the Creative Commons Attribution 4.0 License.
the Creative Commons Attribution 4.0 License.
 | 17 May 2018
Vertical profiles of aerosol mass concentration derived by unmanned airborne in situ and remote sensing instruments during dust events
Dimitra Mamali
Eleni Marinou
Jean Sciare
Michael Pikridas
Panagiotis Kokkalis
Michael Kottas
Ioannis Binietoglou
Alexandra Tsekeri
Christos Keleshis
Ronny Engelmann
Holger Baars
Albert Ansmann
Vassilis Amiridis
Herman Russchenberg
George Biskos
In situ measurements using unmanned aerial vehicles (UAVs) and remote sensing observations can independently provide dense vertically resolved measurements of atmospheric aerosols, information which is strongly required in climate models. In both cases, inverting the recorded signals to useful information requires assumptions and constraints, and this can make the comparison of the results difficult. Here we compare, for the first time, vertical profiles of the aerosol mass concentration derived from light detection and ranging (lidar) observations and in situ measurements using an optical particle counter on board a UAV during moderate and weak Saharan dust episodes. Agreement between the two measurement methods was within experimental uncertainty for the coarse mode (i.e. particles having radii >0.5 µm), where the properties of dust particles can be assumed with good accuracy. This result proves that the two techniques can be used interchangeably for determining the vertical profiles of aerosol concentrations, bringing them a step closer towards their systematic exploitation in climate models.
- Article
(13468 KB) -
Supplement
(2989 KB) - BibTeX
- EndNote


Aerosol particles affect the atmospheric energy balance directly by interacting with solar radiation, and indirectly through the formation of clouds (Lohmann and Feichter, 2005). Determining the radiative forcing of the atmospheric aerosol particles is highly uncertain, partly because of the significant spatial (both vertically and horizontally) and temporal variability of their concentration, size and chemical composition (IPCC, 2013). The vertical variability in the properties of the atmospheric aerosol can be independently determined by modern in situ measurements using airborne platforms and remote sensing observations. Comparison of the measurements obtained by these two types of techniques, however, is fundamental for improving the accuracy of the resulting observational data for use in climate models.
Light detection and ranging (lidar) instruments are among the most powerful tools for probing vertically resolved properties of the atmospheric aerosol. A number of retrieval algorithms that have been developed over the years can be used to obtain aerosol optical parameters from raw lidar signals, including the aerosol backscatter coefficient βaer (Klett, 1981; Fernald, 1984), the aerosol extinction coefficient αaer (Ansmann et al., 1990, 1992) and the particle depolarization ratio δp (Freudenthaler et al., 2009). Under certain assumptions, recently developed algorithms can now be used to retrieve other vertically resolved aerosol properties such as particle absorption and mass concentration using the synergy of lidar and sun photometer (Ansmann et al., 2011; Lopatin et al., 2013; Chaikovsky et al., 2016). To check the validity of these assumptions and to assure the quality of the final data, certain aerosol properties retrieved from lidar observations have been compared with vertical in situ observations using research aircraft (Feingold and Morley, 2003; Weinzierl et al., 2011; Bravo-Aranda et al., 2015; Granados-Muñoz et al., 2016; Rosati et al., 2016; Kokkalis et al., 2017; Tsekeri et al., 2017).

Figure 1Map of Cyprus showing the locations of the observation sites used for the measurements reported in this paper. The inset in the upper-left corner shows the greater area of southern Europe, northern Africa and the Middle East, with the white square indicating the location of Cyprus. The maps were generated by Google Earth Pro (https://www.google.com/earth/download/gep/agree.html, last access: 6 April 2017).
Airborne in situ measurements using research aircraft are complex and costly, and therefore their availability is scarce and time restricted, limiting comparability with remote sensing observations. What is more, manned aircraft cannot cover the lowermost part of the atmosphere due to safety restrictions, posing another major limitation. Recent efforts in aerosol instrumentation have provided lightweight and miniaturized instruments that can measure the size and concentration of aerosol particles on board UAVs (Altstädter et al., 2015; Bezantakos et al., 2015, 2017; Barmpounis et al., 2016; Brady et al., 2016; Renard et al., 2016; Surawski et al., 2017) in a much simpler and cost-effective manner. As a result, vertical profiling of key aerosol parameters can now be performed over long periods of time on a routine basis, and at much lower altitudes compared to measurements with manned research aircraft. Considering, however, that in many cases these advantages come at the expense of the quality of the recorded data, measurements of aerosol properties using miniaturized instruments on board UAVs need to be validated before using them to bridge the long-lasting gap between in situ measurements and remote sensing observations.
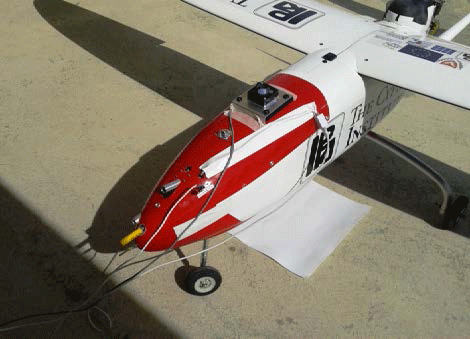
Figure 2Photograph of the UAV of the Cyprus Institute used for the measurements reported in this work.
Here we compare, for the first time to our knowledge, vertical profiles of the aerosol mass concentration, derived from lidar measurements using the polarization lidar photometer networking technique (POLIPHON), and in situ measurements with an optical particle counter (OPC) on board a UAV (hereafter referred to as OPCa). It should be noted that the two techniques do not measure the mass concentration directly, but this is estimated from the recorded signals of the two instruments. The measurements were recorded during the BACCHUS-INUIT-ACTRIS (Impact of Biogenic versus Anthropogenic emissions on Clouds and Climate: towards a Holistic UnderStanding – Ice Nuclei Research Unit – European Research Infrastructure for the observation of Aerosol, Clouds and Trace gases Research InfraSctructure network) campaign that took place in Cyprus during April 2016.
2.1 Site description
Cyprus is located in the eastern Mediterranean (see Fig. 1 inset) and receives air masses from Europe, the Middle East and northern Africa (Lelieveld et al., 2002). Therefore, it is an ideal location for characterizing different aerosol types and investigating the role of particles in various atmospheric processes.
The measurements reported here were conducted at three different locations. Aerial measurements using a UAV were carried out at Orounda (35∘09′ N, 33∘07′ E; 310 m a.s.l.), providing highly resolved spatially and temporally distributed data up to ca. 2 km above ground level (a.g.l.). Concurrent ground-based in situ aerosol measurements were taken at the Cyprus Atmospheric Observatory (CAO) at Agia Marina Xyliatou (35∘04′ N, 33∘06′ E; 535 m a.s.l.), located 6.5 km south of Orounda. A PollyXT Raman lidar instrument was located in the suburbs of Nicosia ( N, E; 190 m a.s.l.), ca. 35 km east of Orounda, providing round-the-clock measurements of the atmospheric conditions up to 12 km a.g.l. The exact locations of the measuring points are shown in Fig. 1 and detailed descriptions of the instruments are given below.
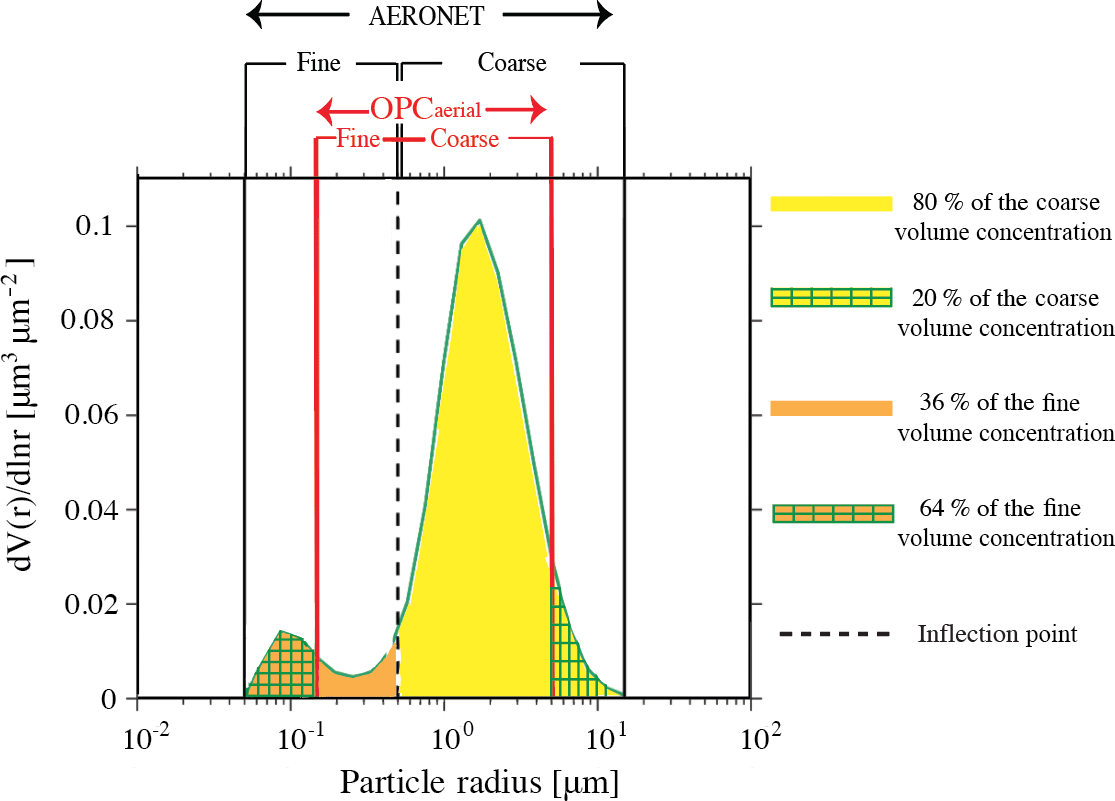
Figure 3Column-integrated volume size distribution measured with the sun photometer over Nicosia at 06:57 UTC on 15 April 2016. The ranges of particle sizes measured by AERONET sun photometers and by the OPCa are also indicated in the figure.
2.2 Unmanned aerial vehicle (UAV)
The UAV employed during the campaign (see Fig. 2) has a fixed wingspan of 3.8 m and is powered by a two-stroke internal combustion engine. It has a take-off weight of 35 kg that results in a payload capacity of approximately 12 kg. The payload bay is 1.3 m × 0.23 m × 0.34 m (length–width–height) and can fit multiple instruments. When loaded, the UAV can fly for up to 4 h with an air speed velocity of 25 ± 10 ms−1 and can reach altitudes of up to 4 km a.g.l. (due to airspace limitations; however, only flights up to 2 km were permitted). An autopilot system allowed predetermined flight plans that involved spiral rectangular-shaped ascending and descending patterns (see Fig. S1 of the Supplement) preventing contamination of the sampling system from the engine's exhaust. For consistency, the results shown in the rest of the paper correspond to measurements during ascent.
2.3 UAV-based optical particle counter measurements
Vertical profiles of the particle size distributions of the atmospheric aerosol were measured using an OPC (i.e. the OPCa; MetOne, model 212-2) on board the UAV, which reported particle size distributions ranging from 0.15 to 5 µm in radius, in eight size bins. The sampled aerosol was dried to below 50 % relative humidity (RH) by gently heating the sampling tube of the OPCa. Assuming spherical shape and constant mass density for the particles, the size distributions were converted into aerosol mass concentrations (see Sect. 2.4). In addition to the OPCa, a single-wavelength aethalometer (AethLabs – model AE51) with a sampling time resolution of 1 s and a flow rate of 0.2 Lpm, was on board the UAV to verify that no contamination of the sampled air by the engine exhaust took place. Each instrument was equipped with an individual sampling inlet that extended 5 cm from the UAV nose to ensure representative sampling.
2.4 Particle mass concentration calculation from the OPCa measurements
The mass concentration profiles of the coarse particles were calculated from the size distribution measurements recorded by the OPCa. Before converting the aerosol number concentrations to mass concentrations, the OPC measurements were averaged over 30 s (original time resolution 1 s). This was found to be optimal for suppressing high-frequency noise of the OPC raw data and at the same time maintaining a relatively high spatial resolution of ∼ 80 m in the vertical direction. The number concentration (dN) of each size bin was converted to volume concentration according to , where r is the mean radius of each size bin in the recorded measurements. The volume concentration of particles with radii larger that 0.5 µm were summed and multiplied by ρd, yielding the coarse-mode mass concentration. The variability in the number size distributions averaged every 30 s propagated an uncertainty of the order of 10 % in the estimated volume size distributions and the mass concentrations of the particles (Taylor, 1997).
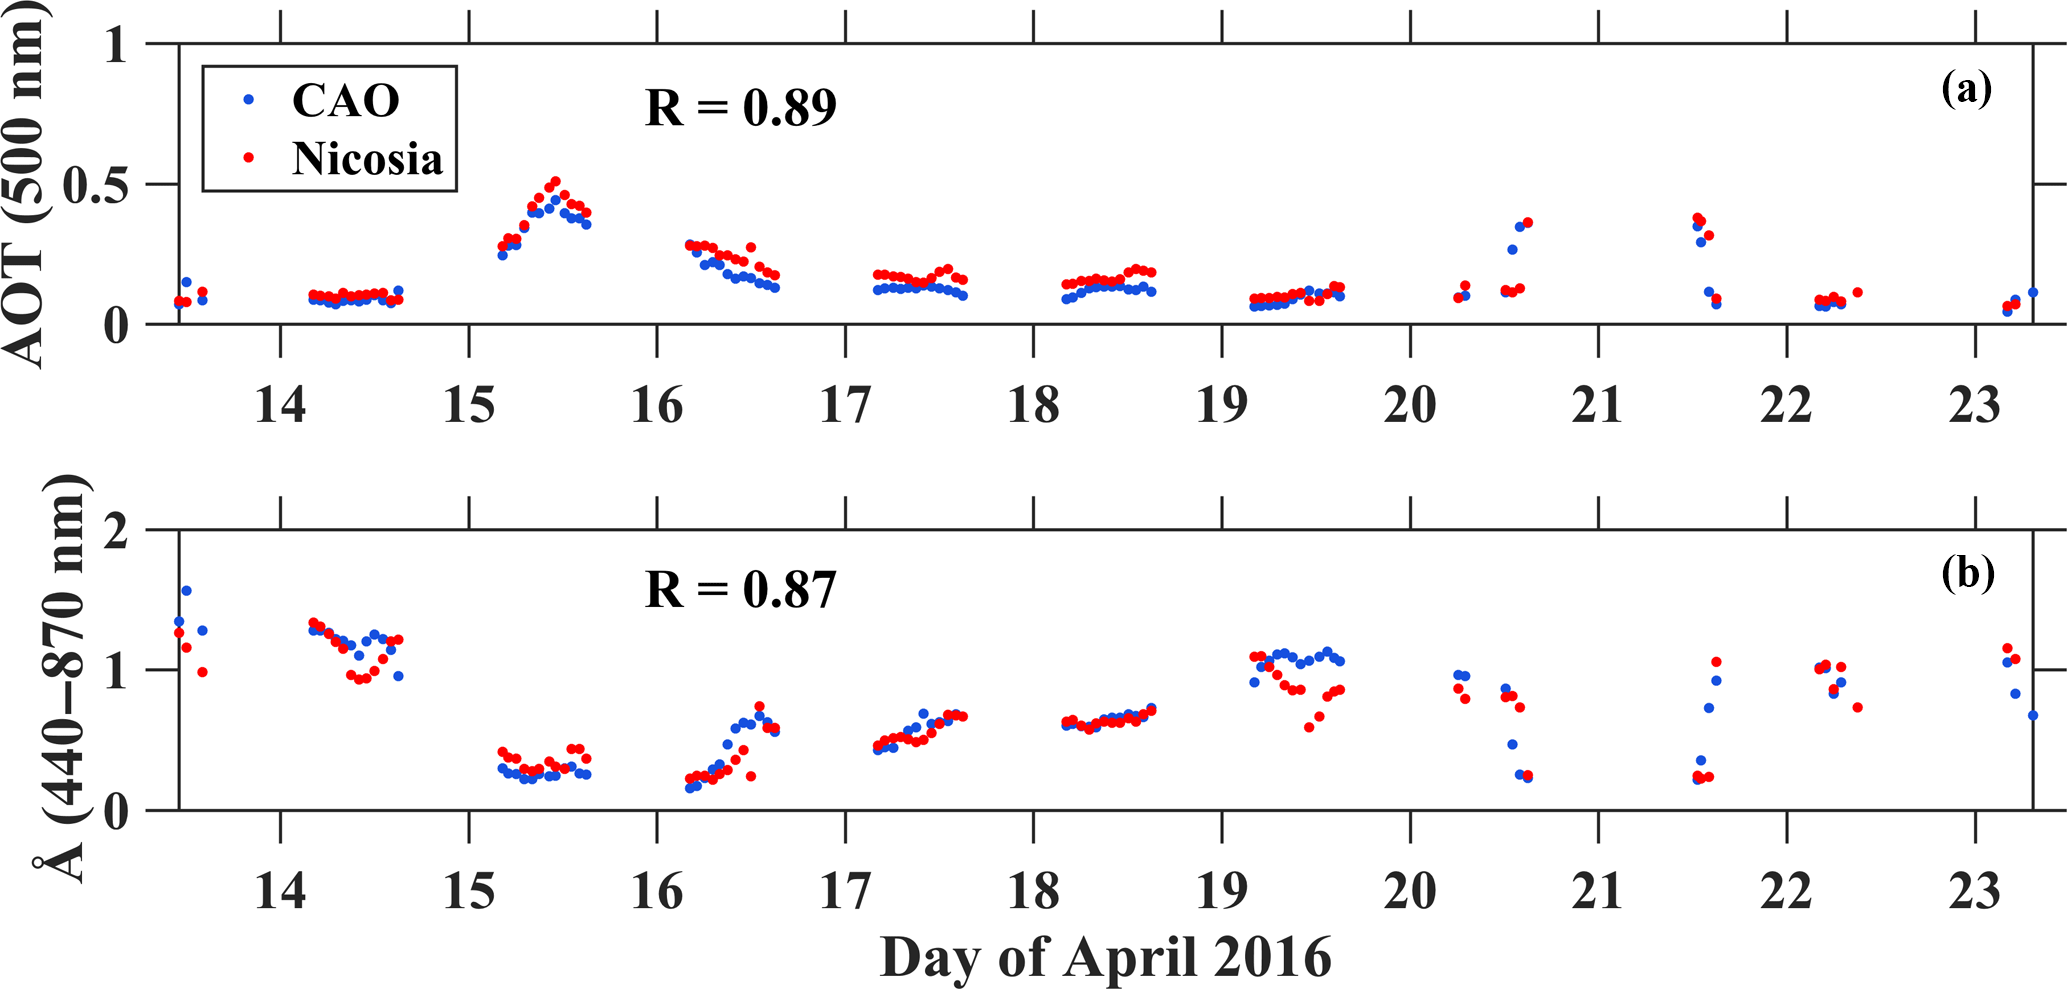
Figure 4(a) AOT500 and (b) Å440−870 as measured with the sun photometers at CAO (blue circles) and Nicosia (red circles) from 13 to 24 April 2016.
2.5 Lidar measurements
A depolarization Raman lidar PollyXT (Althausen et al., 2009; Engelmann et al., 2016) was used in the measurements reported here. This lidar emits laser pulses simultaneously at three wavelengths: 1064, 532 and 355 nm. The laser beam interacts with the atmospheric molecules and particles, and a part of it (backscattered light) is collected by the receiver unit which consists of two telescopes (near-field and far-field). The elastically backscattered signals are used as input to the Fernald–Klett algorithm (Klett, 1981; Fernald, 1984; Böckmann et al., 2004) to retrieve the vertical profile of the particle backscatter coefficient βaer. This method assumes a linear relationship between the aerosol extinction and backscatter (i.e. the fixed lidar ratio S) throughout the entire atmospheric column, a critical assumption that can induce uncertainties up to 20–30 % of the retrieved property from statistical and systematic errors (Bösenberg and Brassington, 1997; Comerón et al., 2004; Rocadenbosch et al., 2010).
In addition to the elastically backscattered signal, PollyXT receives the nitrogen Raman-shifted signal at wavelengths 387 and 607 nm and the water vapour Raman signal at 407 nm wavelength. The Raman technique (Ansmann et al., 1992; Whiteman et al., 1992) utilizes the elastic and inelastic signals to retrieve the particle extinction αaer and scattering βaer profiles independently, without any critical assumptions. The range-resolved aerosol lidar ratio can then be directly estimated as the ratio αaer ∕ βaer. In our analysis, we used the Raman technique to retrieve the αaer and βaer profiles at night-time and the Fernald–Klett method during the daytime when the Raman signal is strongly affected by the background noise induced by the scattered sunlight. The PollyXT system also provides information on volume depolarization ratio δv, from which the particle depolarization ratio δp can be estimated (Murayama et al., 1999; Sakai et al., 2000; Shimizu et al., 2004; Sugimoto and Lee, 2006; Freudenthaler et al., 2009). This allows discrimination between spherical particles (e.g. water droplets) and non-spherical particles such as dust.
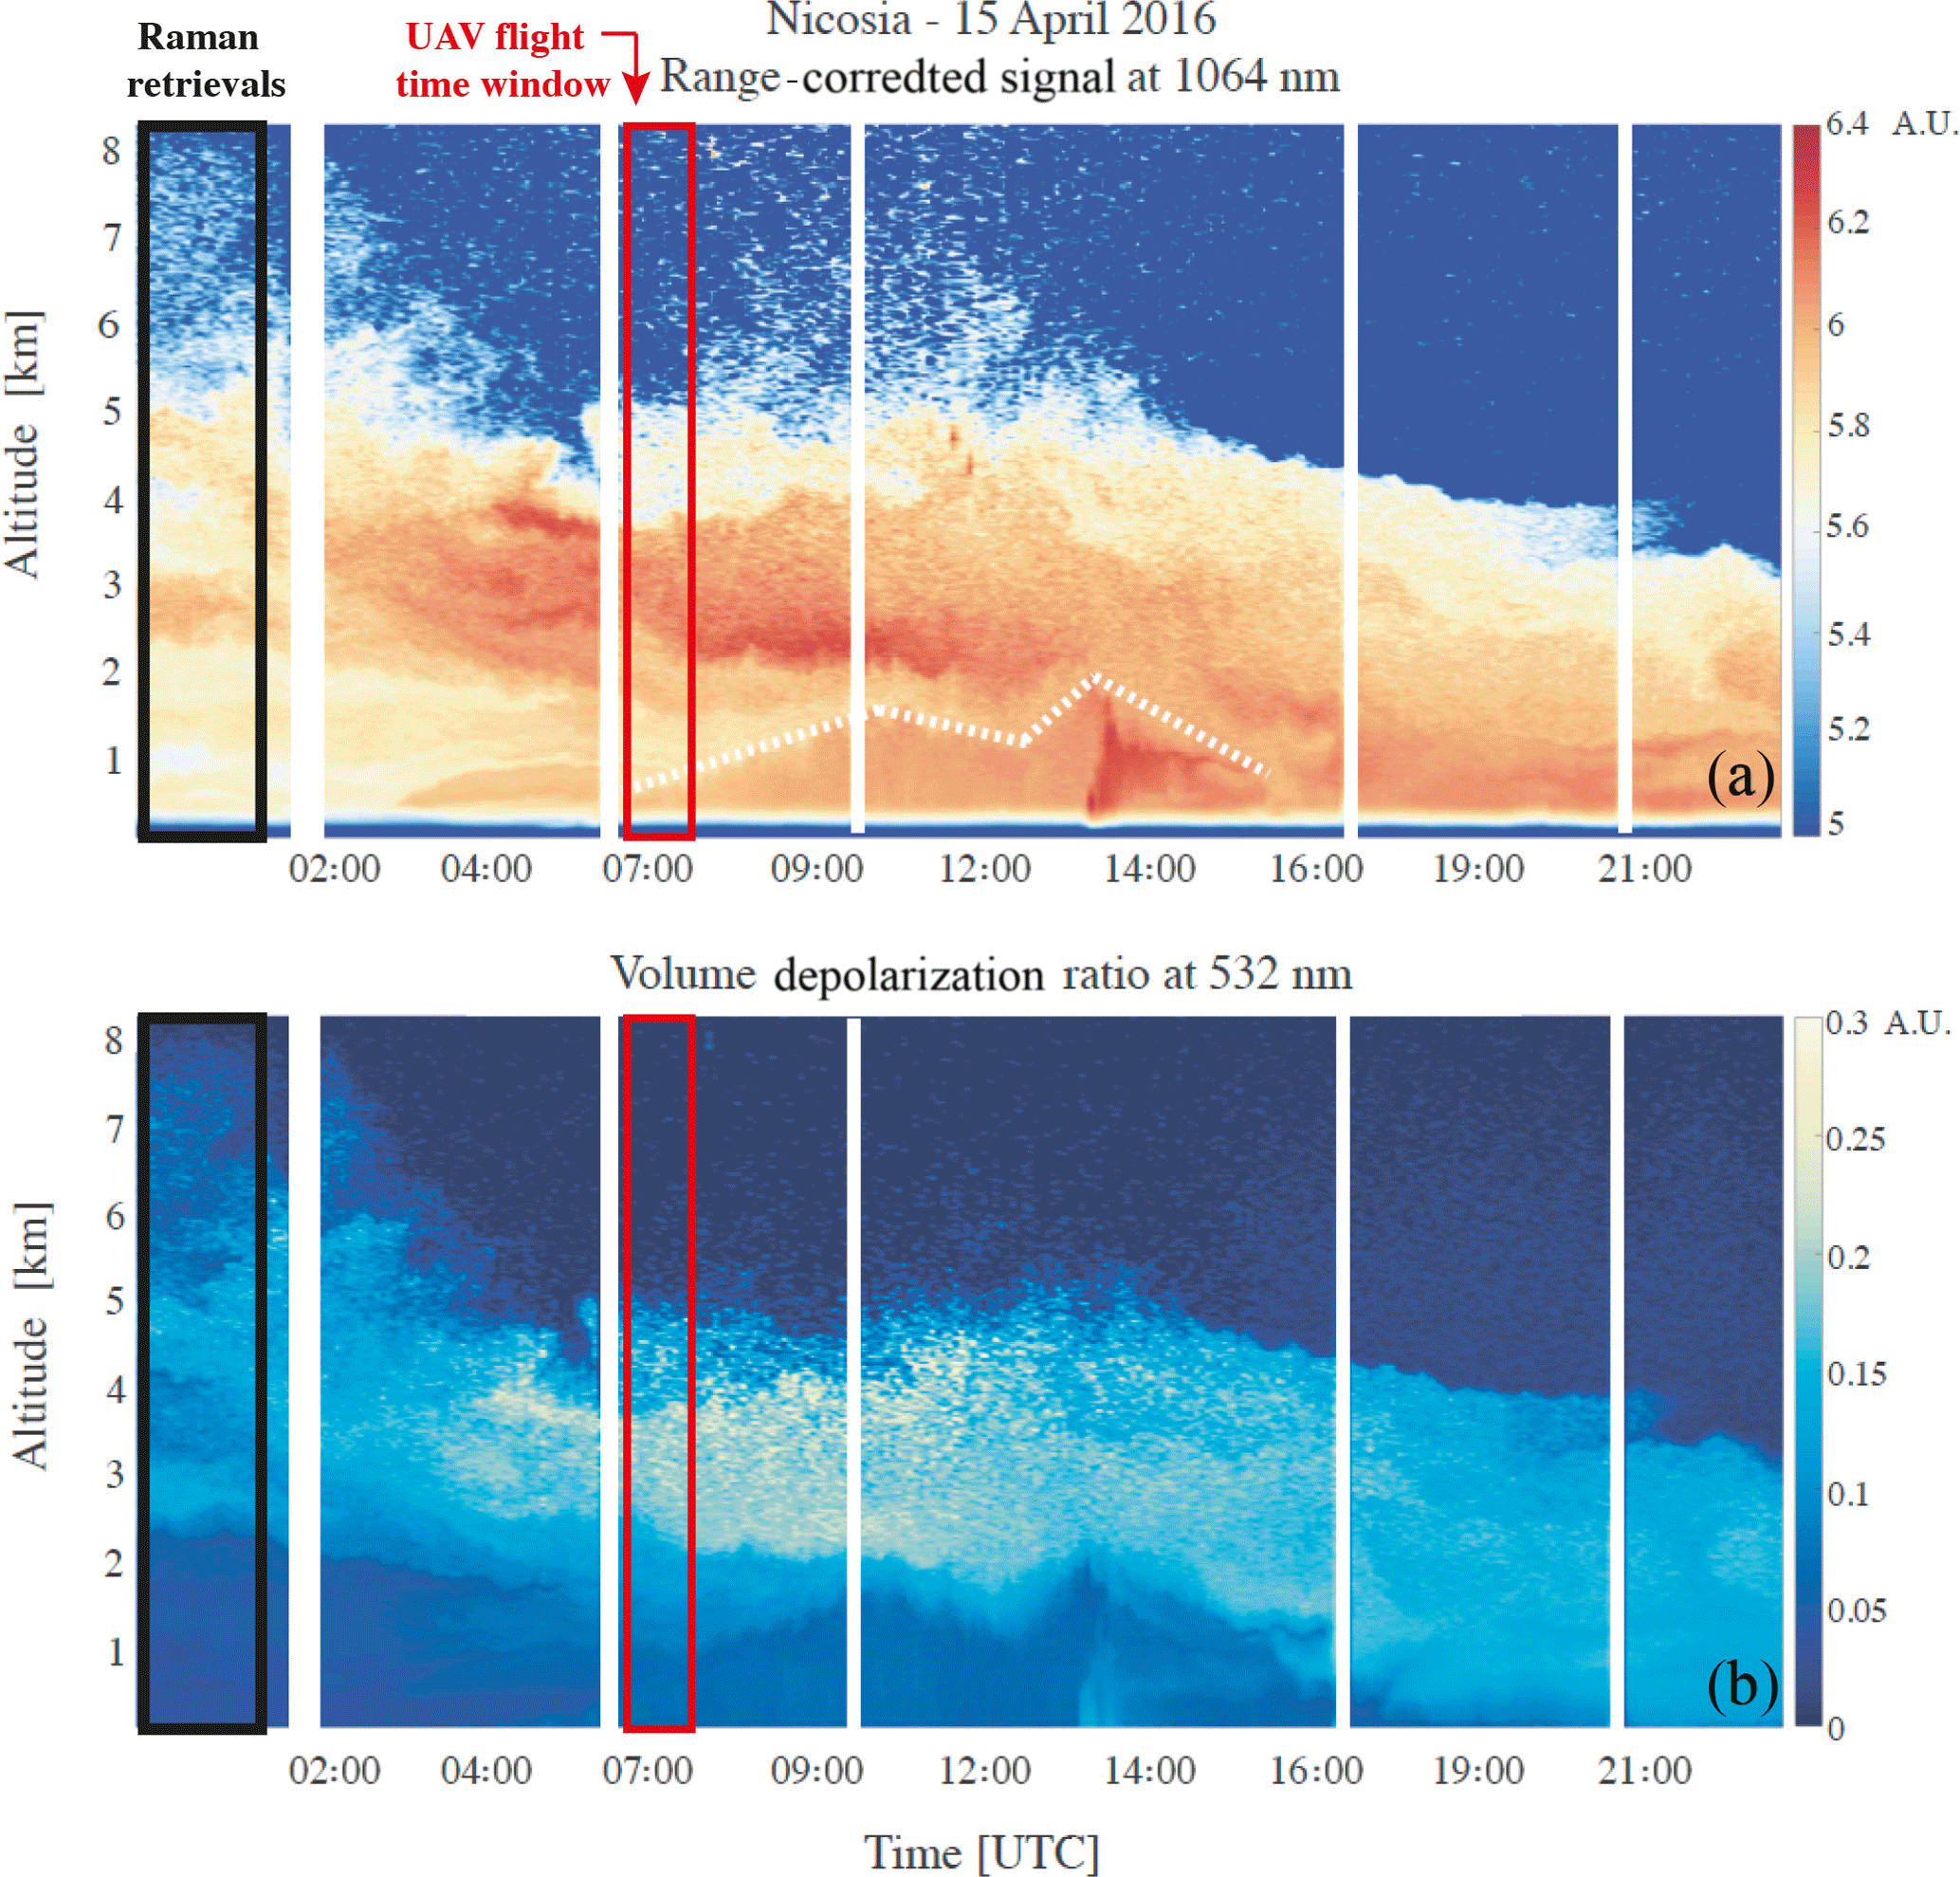
Figure 5Range-corrected lidar signal at 1064 nm (a) and volume linear depolarization ratio (b) reflecting the atmospheric conditions over Nicosia on 15 April 2016. Blue colour indicates weak backscattering, yellow–red colours in the range-corrected lidar signal indicate backscattering mainly from fine aerosols and dust, whereas the dotted line shows the PBL top. The lidar observations used for the comparison with the UAV measurements were those recorded between 07:00 and 07:50 UTC.
2.6 Sun/sky photometer measurements
A lunar/sun sky photometer of the AErosol RObotic NEtwork (AERONET; Holben et al., 1998) was collocated with the lidar at Nicosia, whereas an additional sun photometer was situated at CAO. Both instruments provided measurements of the aerosol optical thickness (AOT) at seven wavelengths (i.e. 340, 380, 440, 500, 675, 871 and 1020 nm). The AERONET products include parameters corresponding to the total atmospheric column such as the Ångström exponent Å (at several wavelength pairs), the particle volume size distributions in the size range 0.05 to 15 µm (particle radius), the fine- and coarse-mode AOT (τf and τc, respectively) at 440, 675, 871, 1020 nm (O'Neill et al., 2003) and the fine- and coarse-mode volume concentrations (vf and vc, respectively; Dubovik et al., 2000a, 2006). According to Dubovik et al. (2000b, 2002) the retrieval of the particle volume size distribution was demonstrated to be adequate in practically all situations with AOT >0.05, which was also the case for the observations reported here. Cloud-screened and quality-assured level 2.0 data products were used in this work. The uncertainties for the AOT were <0.02 for UV wavelengths and <0.01 for wavelengths above 440 nm (Eck et al., 1999).
2.7 Particle mass concentration profiles derived by the lidar measurements and the POLIPHON method
The mass concentration profiles from the lidar measurements were calculated using the POLIPHON method (Ansmann et al., 2011) as stated above. In the first step of the method, the contribution of the fine-mode and coarse-mode particles to the total backscatter coefficient (βt) is calculated based on depolarization measurements (Tesche et al., 2009). Here we assumed an externally mixed aerosol consisting of a fine component with low depolarization (5 ± 1 %; Ansmann et al., 2011) and a coarse component that induces light depolarization of 31 ± 4 % (Freudenthaler et al., 2009), corresponding to dust particles. The dust-related backscatter coefficient was determined as
where βt, δt, δnd and δd are respectively the observed total backscatter coefficient, the observed total depolarization ratio, the assumed non-dust depolarization ratio and the measured depolarization ratio of dust particles. Once βd was determined, the non-dust backscatter coefficient was calculated by βnd = βt−βd. In the calculations presented here we used β and δp values corresponding to 532 nm wavelength.
In the second step of the method, the mass concentrations of the fine (non-dust; mnd) and coarse (dust; md) aerosol fractions are calculated according to Ansmann et al. (2011):
where ρ is the mass density, whereas the product of the backscattering coefficient and the lidar ratio βS is the extinction coefficient of the particles, with subscripts d and nd denoting dust (coarse) and non-dust (fine) particles. It should be noted that the factors and are used to convert the extinction measurements to particle volume concentration for the coarse and the fine fraction, respectively. In this work these factors were determined from the daily mean data of the sun photometer that was collocated with the lidar. The volume concentrations vf and vc were obtained from the AERONET data, whereas the fine- and coarse-mode AOTs, τf and τc, at 532 nm wavelength were calculated using Å (determined in the 440–675 wavelength range) according to
Another assumption we made was that the lidar-derived dust and non-dust fractions are identical to the photometer-derived coarse- and fine-particle fractions. The inflection point of the AERONET data was adopted as the limit between the fine- and the coarse-mode particles. As a result, the fine mode ranged between 0.05 and 0.5 µm (particle radius) and the coarse mode between 0.5 and 15 µm as shown in Fig. 3. The calculated values of and (see Table 1) are in line with the conversion factors mentioned by Mamouri and Ansmann (2016, 2017), who performed an extensive analysis of the conversion factors of dust over Cyprus.
Freudenthaler et al. (2009)Ansmann et al. (2011)Mamouri and Ansmann (2014)Hess et al. (1998)Table 1Values of the input parameters used in the POLIPHON algorithm.
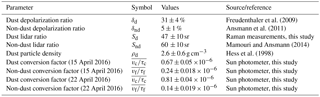
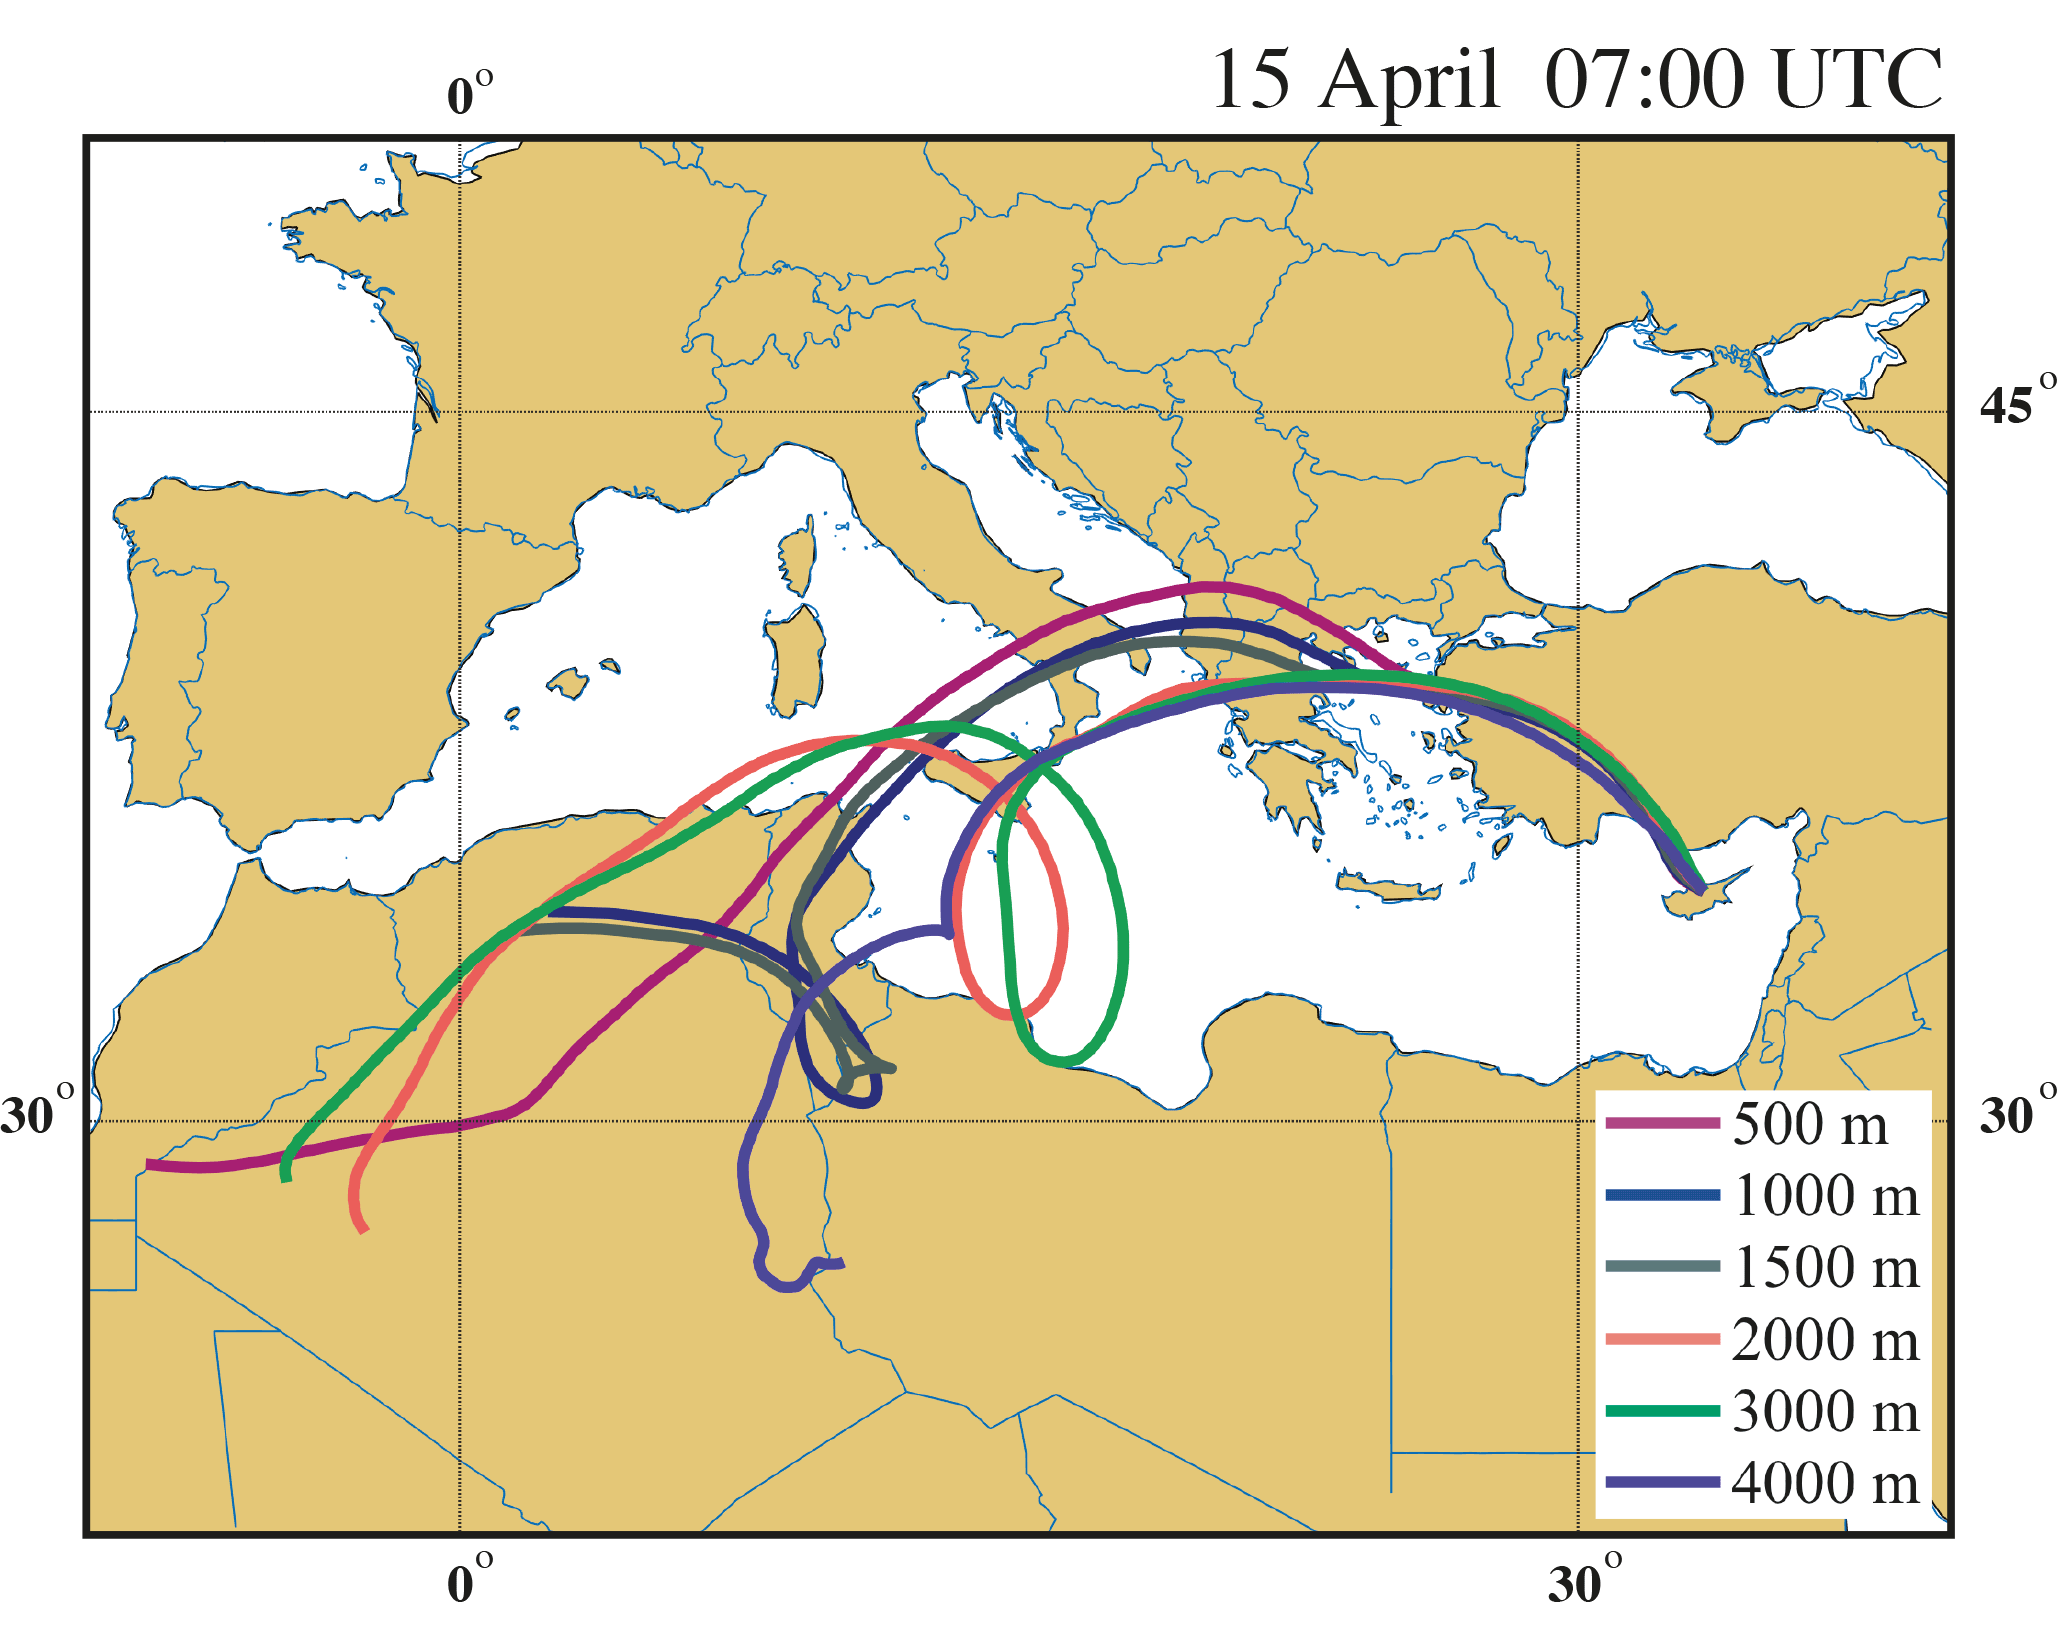
Figure 6Back-trajectories of the air masses arriving at various altitudes over Cyprus on 15 April, 07:00 (UTC). The back-trajectories were calculated for a duration of 5 days using the HYSPLIT transport and dispersion model (Rolph, 2003; Stein et al., 2015) with GDAS 1∘ meteorological data through the Real-time Environmental Applications and Display sYstem (READY; http://ready.arl.noaa.gov/index.php, last access: 26 June 2017).
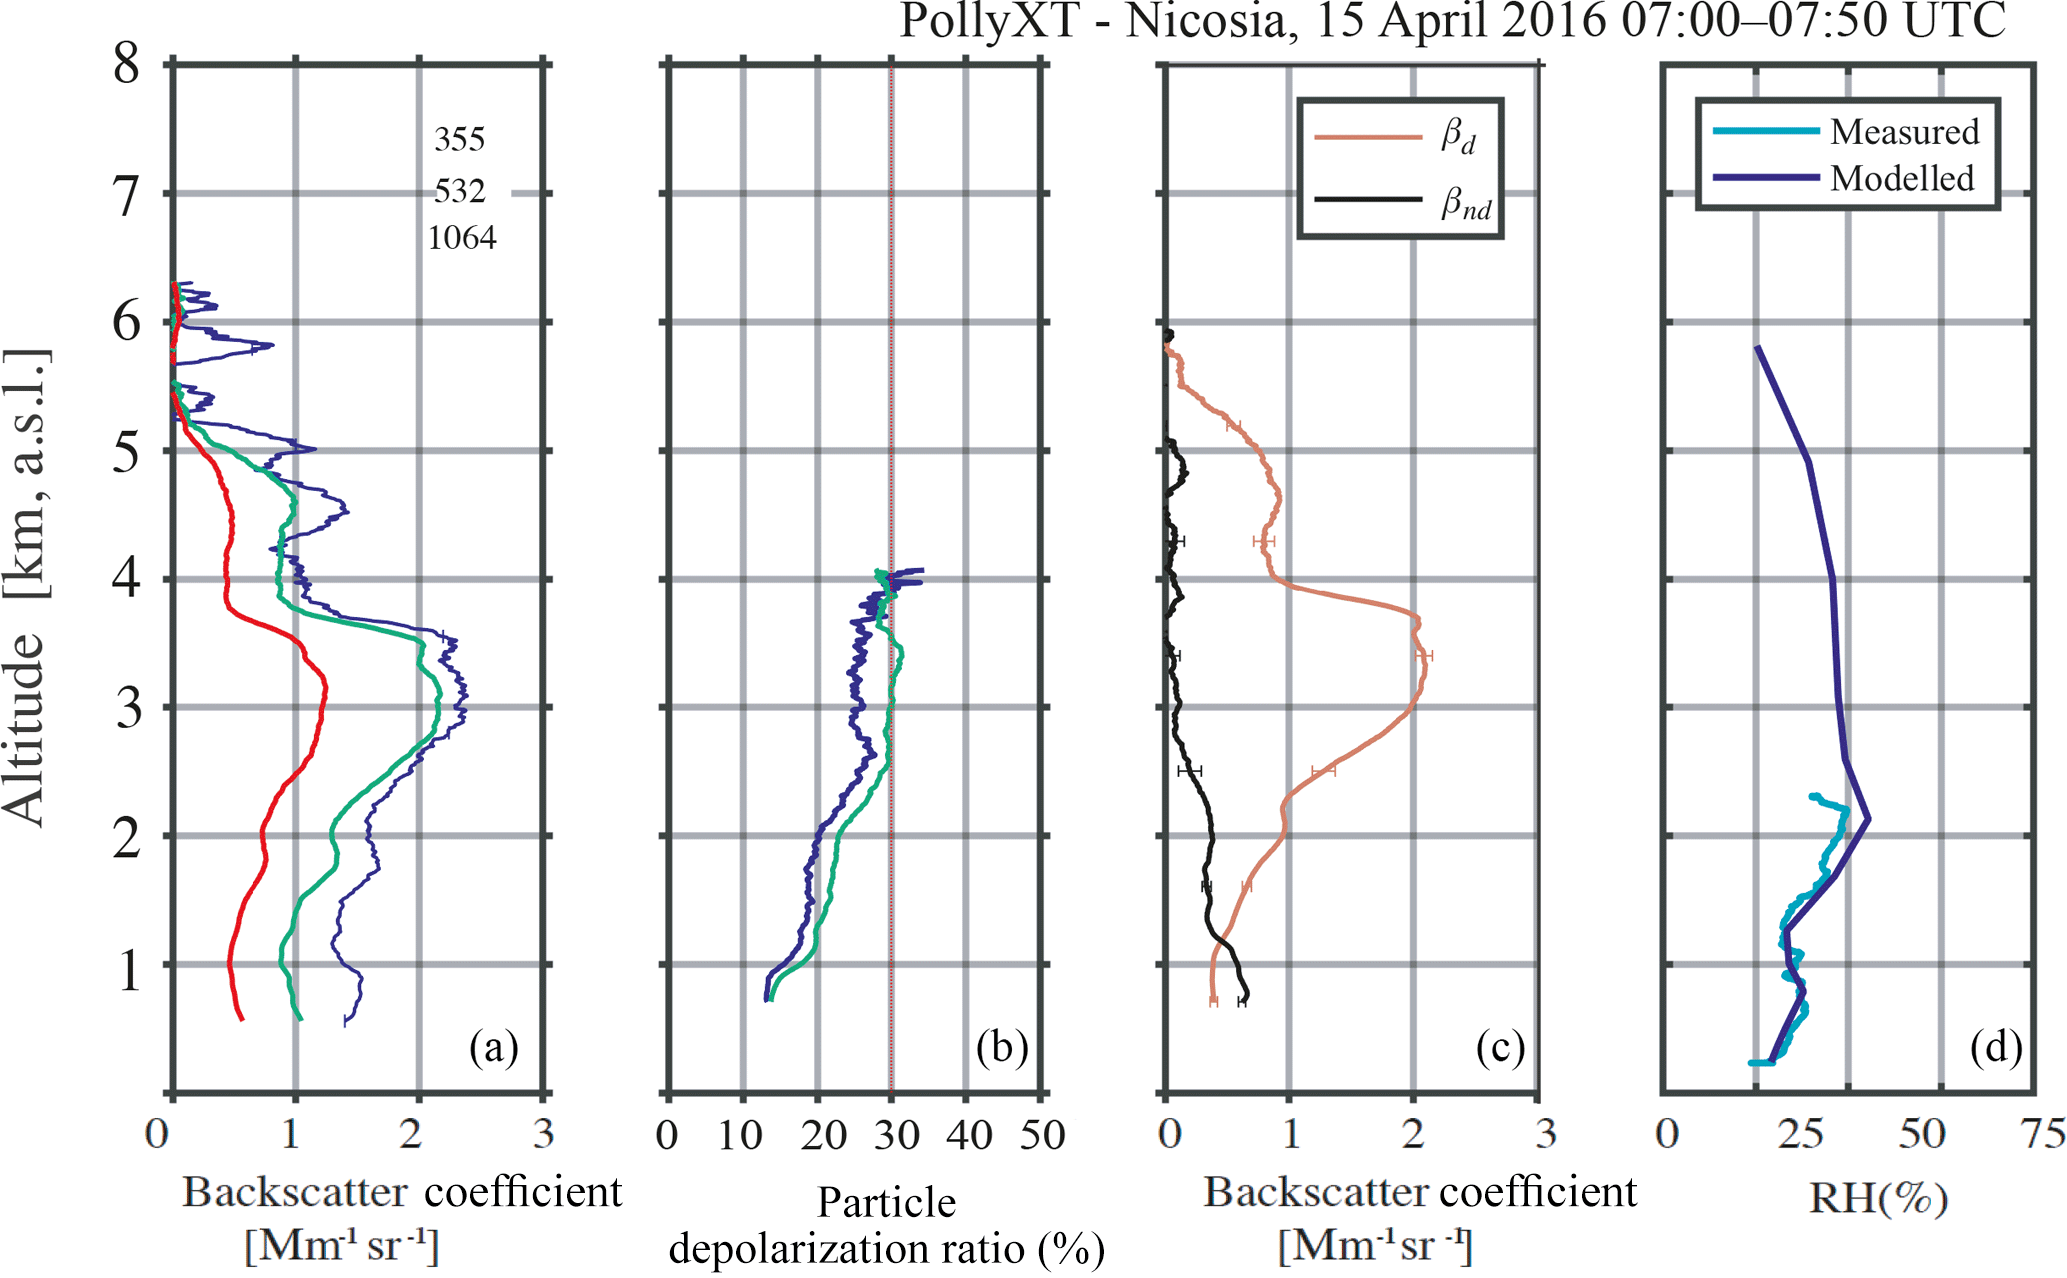
Figure 7Daytime profiles of β (355, 532 and 1064 nm wavelength) (a), δp (355 and 532 nm wavelength) (b), βd and βnd (c) determined by POLIPHON, as well as RH profiles from in situ measurements on board the UAV and from WRF-ARW model simulations over Nicosia at 08:00 UTC (d).

Figure 8Range-corrected lidar signal at 1064 nm (a) and volume linear depolarization ratio (b) reflecting the atmospheric conditions over Nicosia on 22 April 2016. Blue colour indicates weak backscattering, yellow–red colours in the range-corrected lidar signal indicate backscattering mainly from fine aerosols and dust, whereas the dotted line shows the PBL top. The lidar observations used for the comparison with the UAV measurements were those recorded between 04:22 and 05:00 UTC.
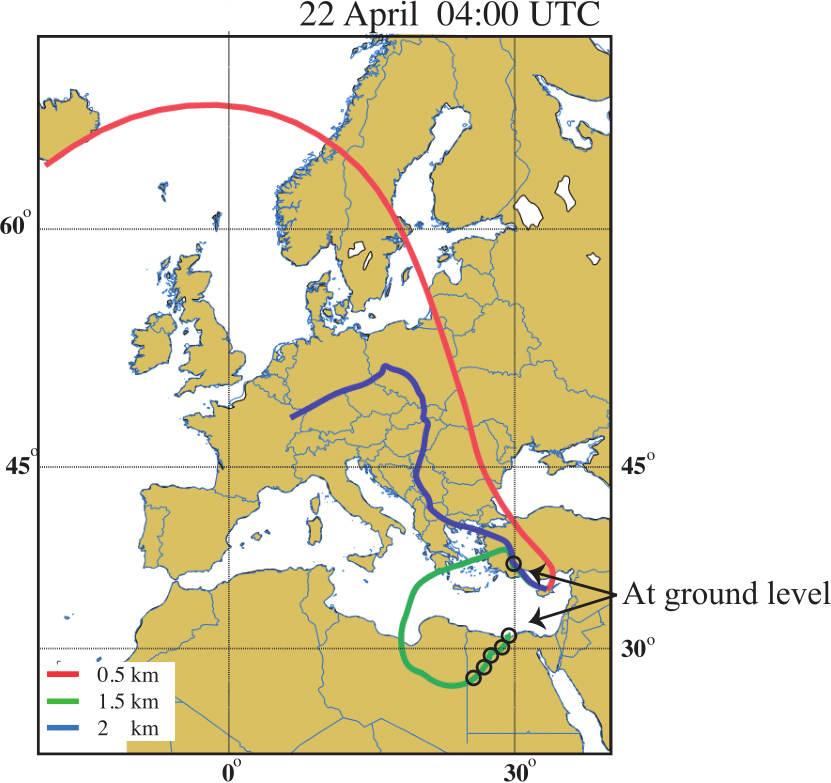
Figure 9Back-trajectories of the air masses arriving at 500, 1000 and 1500 m over Cyprus at 04:00 UTC on 22 April. The back-trajectories were calculated for a duration of 6 days. The black circles indicate the locations where the air mass was below 100 m altitude.

Figure 10Daytime profiles of β (532 and 1064 nm wavelength) (a), δp (355 and 532 nm wavelength) (b), βd and βnd (c) determined by POLIPHON, as well as RH profiles from WRF-ARW model over Nicosia at 04:00 UTC (d). The 355 nm channel of the lidar was discarded due to misalignment.
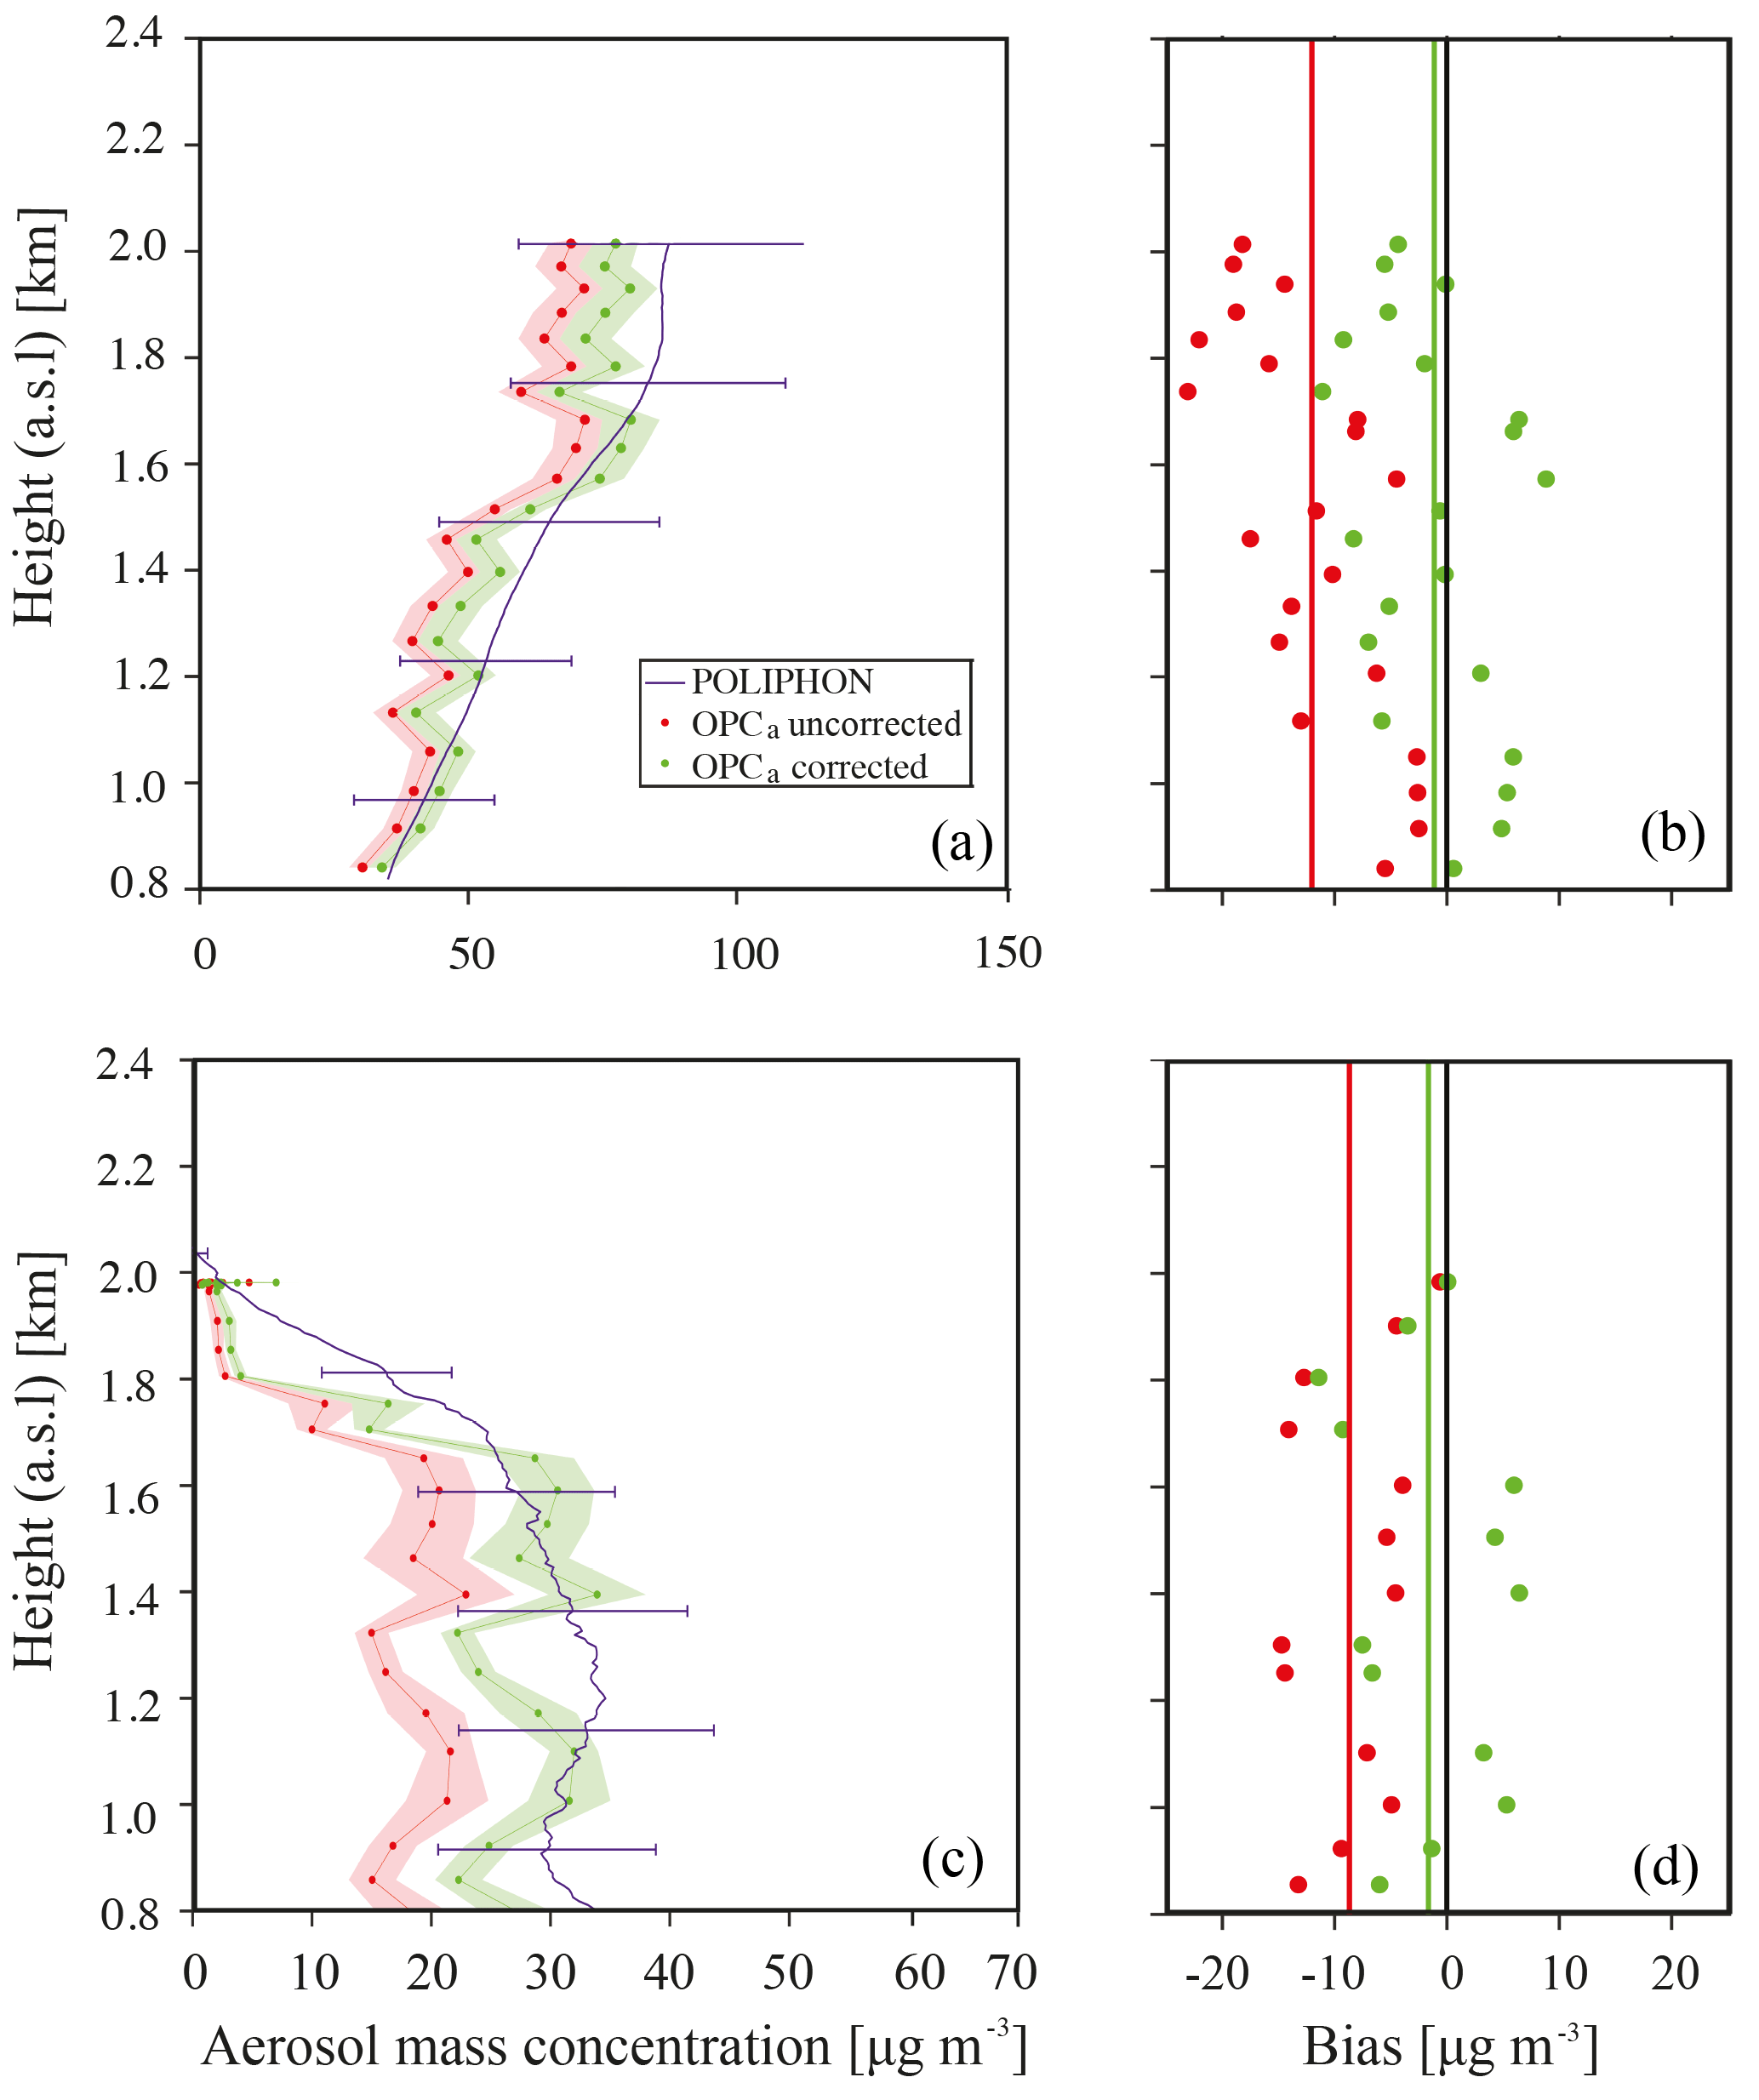
Figure 11Aerosol mass concentration profiles for case studies I and II (a, c) and the respective biases (b, d). In plots (a) and (c), the blue solid lines represent the mass concentration derived by the POLIPHON. The mass concentration measured by the OPCa is plotted in red with the red shaded area representing the uncertainties in the in situ measurement. The green lines show the mass concentration from the OPCa corrected for the particles losses. In plots (b) and (d), the red dots show the biases between the values measured by the OPCa and the lidar (OPCa–lidar) before applying the corrections, while the green dots are the biases after corrections. The red and green solid lines show the mean biases before and after correction, respectively.
Apart from v∕τ, the other parameters required for determining the aerosol mass concentration from the lidar measurements are ρ, β and S. Regarding ρ, we used a density of 2.6 ± 0.6 g cm−3 for the coarse-mode particles (corresponding to dust according to Gasteiger et al., 2011). Chemical analysis of filter samples collected during the measurements showed that the dust density assumed here is valid (data not shown). Values for Snd (60 ± 10 sr) were taken from the literature (Mamouri and Ansmann, 2014) and actual measurements were used for Sd. Sd measurements were only possible at night-time when the Raman channels were operating. We measured the same Sd values (47 ± 10 sr) for both events analysed here (see Fig. S2 in the Supplement). All the values of the parameters that are required as input for the calculations are summarized in Table 1.
2.8 POLIPHON method – error estimation
The uncertainties of βd and βnd in Eq. (1) were determined by Monte Carlo calculations (Bevington et al., 1993). For each input parameter, we generated 100 normally distributed random numbers. The values provided in Table 1 were used as the mean parameter and the standard deviation of the normal distributions. Then, 100 βd and βnd values were calculated for each point in the atmospheric column and from these the mean values and the standard deviations (errors) of βd and βnd were estimated to be 22 and 28 %, respectively. For Eqs. (2) and (3) the uncertainties were calculated analytically using the error propagation law.
3.1 Homogeneity of aerosol properties over the measurement sites
Given the proximity (6.5 km) of the ground (at CAO) and the airborne in situ observations (at Orounda), as well as the absence of any strong pollution sources in the region, the measurements were considered to correspond to the same air parcel in terms of atmospheric composition. The third measurement location (Nicosia) was situated 35 km away from the airfield. As suggested by the comparison of sun photometer measurements at Nicosia and CAO, however, all locations were affected by the same air masses with a minor influence from local emissions that were mostly trapped within the planetary boundary layer (PBL).
Figure 4 shows the AOT500 and the Å440−870 measured by the sun photometers in Nicosia and at CAO from 13 to 24 April 2016 when concurrent measurements were taken at the two locations. Overall, the temporal variability of these two parameters observed at Nicosia was very similar to the respective measurements at CAO, exhibiting correlations coefficients of 0.89 and 0.87 for AOT500 and Å440−870, respectively. This good correlation was further enhanced during the dust event cases (e.g. on 15 April 2016) when the relative contribution of the aerosol fine mode was minimized, suggesting that a comparison of aerosol measurements at these locations is meaningful. In terms of absolute values, AOT500 was 15–50 % higher at Nicosia compared to CAO, even during the cases with the dust events, when coarse particles dominated. The higher values at Nicosia are mainly due to the altitudinal difference between the sites (Nicosia is at an altitude of 190 m, whereas CAO at 535 m above sea level) and the contribution of the local aerosol sources to the total aerosol burden. This was further justified by the higher Å440−870 measurements at Nicosia, which signify the presence of small aerosol particles from anthropogenic sources.
3.2 Comparison of the mass concentration measurements
A total of six UAV flights with an OPCa on board were launched during the entire campaign. However, only two fulfilled all the necessary requirements for comparison with the lidar observations. Those requirements are that (1) there are simultaneous measurements of lidar and OPCa, (2) there are cloud-free conditions or clouds are above 7–8 km altitude so that the lidar retrievals can be made, (3) there is enough dust loading, (4) AERONET data are available, and (5) the airborne in situ measurements were taken before the full development of the PBL. All these requirements were fulfilled during the measurements on 15 and 22 April 2016, which are analysed below.
3.2.1 Case study I: 15 April 2016
The atmospheric situation over south-eastern Europe on 15 April 2016 was dominated by a high-pressure system resulting in mostly cloud-free conditions over Cyprus. A dust event of moderate intensity was observed, resulting in an average AOT500 value of 0.4 over Nisosia and CAO (see discussion in Sect. 3.1 and Fig. 4). Figure 5 shows the lidar time–height display for that day, with the upper panel showing the range-corrected signal of the 1064 nm channel, which provides information about the aerosol loading and the presence of clouds, and the lower panel the linear volume depolarization ratio δv at 532 nm, which is used to discriminate particles of different shapes that can be indicative of different sources. Throughout the day, high concentrations of aerosol particles were observed even up to ca. 7 km altitude (Fig. 5a), with a persistent aerosol layer extending from 2.5 to ca. 7 km. Back-trajectory analysis (see Fig. 6) confirmed that this layer resulted from a Saharan dust event that originated in Algeria and travelled over Italy, Greece and Turkey before reaching Cyprus. Despite passing over polluted areas, the core of the dust layer remained pure (see analysis below) due to its high elevation (> 2 km) all along the path. The δv plot (Fig. 5b) also shows the temporal evolution of this dust layer. From 00:00–03:00 UTC the dust extends from 2 to 7 km altitude, but later (until 14:00 UTC) it becomes shallower. From the early morning hours (07:00 UTC) to the early afternoon (14:00 UTC) when the boundary layer develops, the dust layer is confined above it, reaching up to 5 km altitude. After the collapse of the boundary layer, the dust layer starts to descend and finally reaches the ground at 18:00 UTC.
The cloud-free and time-homogeneous atmospheric scene between 07:00 and 07:50 UTC, which overlapped with the time window of the UAV flight, was selected for calculating the parameters of the atmospheric aerosol using the POLIPHON method. As mentioned earlier, the Sd values used as input in POLIPHON were not measured at the same time window (07:00 and 07:50 UTC), but they were derived from night-time measurements. However, back-trajectory analysis verified that the lidar was measuring the same air mass type during these time spans (Figs. 6 and S3). The lidar profiles of β (retrieved with the Fernald–Klett method; Sect. 2.5) and δp, that were used as input in POLIPHON (532 nm only), are shown in Fig. 7a–b. The backscatter signal increased gradually from 1 Mm−1 sr −1 at 1 km (532 nm), reaching a maximum of ca. 2.3 Mm−1 sr −1 at 3 km where the dust layer core was. The pure dust layer spanned from ca. 2.5 to 3.8 km ( %) while below 2 km the dust was mixed with near-spherical particles, probably from the residual layer, as indicated by the relatively low δp values ranging between 12 and 30 %. Figure 7c shows the POLIPHON-derived dust and non-dust-related backscatter coefficients βd and βnd from Eq. (1), and respective uncertainties determined by Monte Carlo calculations (see Sect. 2.8). The backscatter coefficient of the fine-mode particles βnd decreased with altitude, while the dust particles were present even down to 0.7 km. As discussed in Sect. 2.5, the lidar ratio value used in the Fernald–Klett retrieval and the lidar ratio corresponding to the dust particles Sd that is required as input in the POLIPHON algorithm, were estimated from Raman lidar measurements taken between 00:00 and 01:40 UTC (UTC+3 local time), just before sunrise. It should be noted here that Raman measurements are only possible at night as during the day scattered sunlight induces high background noise signal. The fact that the dust layer observed during the Raman measurements had the same origin and followed the same atmospheric path before reaching the measurement site between 07:00 and 07:50 UTC was confirmed by back-trajectory analysis (Figs. 6 and S3).
Vertical profiles of the RH measured on board the UAV and predicted by the WRF-ARW atmospheric model (Skamarock and Klemp, 2008) showed that the atmosphere was dry enough (RH ≲ 50 %) at the ground level and up to 4 km altitude (Fig. 7d). As a result we could safely assume that the aerosol particles were dry and thus changes in the mass density and backscatter coefficient due to water uptake were negligible.
3.2.2 Case study II: 22 April 2016
Contrary to case study I, a low-intensity dust event (AOT500=0.1) was recorded over Cyprus on 22 April 2016. The evolution of the boundary layer dominating the atmospheric situation that day is depicted in the lidar time–height plots shown in Fig. 8. From 00:00 to 10:00 UTC a sparse dust layer extended between 1 and 2 km a.g.l. while after the PBL decay a shallower dust plume was observed between 1 and 1.5 km altitude. According to the back-trajectory analysis (Fig. 9) the dust air mass at 1.5 km originated from Egypt at the ground level, then it was elevated and passed over Libya, the Mediterranean and Turkey before reaching Cyprus.
The UAV flight on that day was launched between 04:22 and 05:16 UTC. The atmospheric scene between 04:20 and 05:00 UTC (Fig. 8) was selected for the comparison due to its stable conditions above 0.8 km. Also in this case, the same procedure as in case I was followed to retrieve the lidar profiles that were used as input in the POLIPHON algorithm. The backscatter coefficient, the particle depolarization ratio, the POLIPHON-derived dust and non-dust related backscatter coefficients as well as the RH profiles of this atmospheric scene are shown in Fig. 10. In contrast to the estimated δp values determined from the measurements on 15 April, here decreases gradually with height from 0.8 to 2 km exhibiting values between 10 and 17 %. These relatively low values indicate a mixture of Saharan dust with spherical continental/anthropogenic particles. This is supported by the paths that the air mass follow between 1 and 2 km, which originated from north-eastern Africa, close to Cairo and Alexandria. The lidar ratio of 40 ± 7 Sr, measured during the previous night (at a height where the signal is mostly free of noise; i.e. 1.2–1.4 km) agrees with the findings of Schuster et al. (2012) and Nisantzi et al. (2015), who respectively reported S532 values of 40 ± 5 Sr and 47 Sr for dust originating from eastern Sahara.
3.2.3 Particle mass concentration profiles
Figure 11a and c shows the mass concentration profiles for the coarse particles (particles larger than 0.5 µm in radius) derived by the lidar observations using the POLIPHON method for the inversion and the OPCa measurements. The lidar profiles, were calculated by Eqs. (2) and (3) using the measured βd and βnd, profiles and the dust density values from the literature (see Table 1). The respective OPCa profiles were determined by the recorded particle number size distributions assuming the same dust particle density (see Sect. 2.4 for details). To ensure that the lidar observations are representative of the atmospheric aerosol over Orounda and over CAO we compare the data for altitudes higher than 0.8 km a.s.l. during morning hours when the PBL was shallow.
The mass concentration profiles from the lidar and the OPCa observed on 15 April 2016 (Fig. 11a) show a good correlation, with R=0.9. In terms of absolute values, the mass concentrations measured by the OPCa (red curve) lie within the uncertainty limits (38 %) of the lidar observations, with the former being equal to or lower for the entire range of altitudes, exhibiting a bias ranging from −23.0 to −2.4 µg m−3 with a mean of −12.0 µg m−3 (Fig. 11b). The discrepancies between the two methods can be partly attributed to the assumptions used in POLIPHON: (1) constant S throughout the atmospheric column, (2) contribution in the coarse mode only from depolarizing particles and (3) the assumption of an externally mixed aerosol. Assumptions used for the manipulation of the OPC measurements that can explain differences between the two methods are mainly related to the refractive index and the shape of the particles. The refractive index can notably influence the size distribution measured by the OPC, inducing sizing uncertainties of up to 30 % (Rosenberg et al., 2012; Granados-Muñoz et al., 2016). The refractive index used for calibrating OPCa, however, has a value of 1.59, which is very close to literature values for Saharan dust (n=1.56; Petzold et al., 2009). The difference between the refractive index values used for the calibration of OPCa and those used for the retrieval of the lidar measurements is estimated to introduce a bias of 2 % to the calculated mass concentration values. Regarding particle shape, the effect of non-sphericity on the particle sizing by light-scattering instruments with a similar scattering angle range to OPCa (90∘ ± 60∘) is less than 20 %, with a tendency towards undersizing (Osborne et al., 2008).
Another source of discrepancy between the mass concentrations determined by OPCa and the lidar is the limitation of the former to measure particles larger than a few tens of microns due to aerodynamic inlet loses (sedimentation and inertial deposition), resulting in an underestimation of 20 % of the coarse-mode volume concentration (see yellow–green hatched area in Fig. 3). To account for that, we corrected the OPCa measurements using the formula . This correction significantly improved the agreement between the OPCa (green curve in Fig. 11a) and the lidar measurements, constraining the bias range between −11.1 and 8.8 µg m−3 which results in a decreased mean bias of −1.1 µg m−3. Further statistical analysis between the lidar and the corrected OPCa measurements showed that our hypothesis that the two observations refer to the same aerosol population is valid. To be more specific, the two-tailed t test yielded a p value of 0.70 (assuming equal variances), indicating that the differences between the mean values of the two types of observations are not statistically significant.
The mass concentration profiles determined by the lidar and the OPCa measurements on 22 April 2016 (Fig. 11c) also show a good correlation, with R=0.9. In terms of absolute values, the mass concentrations determined by the OPCa measurements (green line) are lower compared to those determined by the lidar observations for the entire range of altitudes, exhibiting biases in the range from −14.7 to 0.6 µg m−3 with a mean value of −8.7 µg m−3 (Fig. 11d). The integrated volume size distribution measured by the sun photometer in Nicosia (see Fig. S4) showed that in this case the OPCa underestimates the coarse volume fraction by 48 %. Upon correction, the mean bias decreases to −1.6 µg m−3 and, with the exception of one point at 1.8 km altitude, the mass concentration values from the OPCa lie within the calculated uncertainty resulting from the POLIPHON algorithm used to invert the lidar data (32 %). At higher altitudes the mass concentration decreases drastically and OPCa measurements drop below the POLIPHON uncertainty limits. Also in this case, the two-tailed t test (assuming equal variances) yielded a p value of 0.05 indicating marginal statistically insignificant differences between the mean value derived from two types of measurements.
Overall, the airborne in situ and lidar observations are in good agreement both during the observation of a moderate and weak dust event, after the necessary corrections for the OPCa measurements. In the case of the moderate dust event the volume concentration fraction that is not captured by the OPC range is small and so is the corresponding correction. In contrast, during the weak dust event, the OPC misses almost 50 % of the volume size distribution, which introduces large measurement ambiguities.
In this study we compare, for the first time to our knowledge, vertical profiles of the aerosol mass concentrations determined independently by an OPC on board a UAV and by remote sensing observations using data from a lidar and a sun photometer. The measurements were taken during two cases of dust events that occurred in the region of the eastern Mediterranean on 15 and 22 April 2016. During those days, the UAV flew up to ca. 2 km altitude with the OPC measuring the size distributions of sampled aerosol particles with radii in the range 0.15–5 µm, from which the aerosol mass concentration was calculated. The same information was retrieved by the concurrent lidar and sun photometer measurements that were inverted using the POLIPHON method.
During the measurements on 15 April 2016 the dense dust layer extended from 2 to 4 km, while a mixture of dust and near-spherical particles was observed below 2 km. The mass concentration of the coarse-mode particles increased from ca. 30 µg m−3 at 0.8 km to ca. 70 µg m−3 at 1.8 km. Agreement between the in situ measurements and the lidar observations retrieved with the POLIPHON method was very good (R=0.9), with the in situ measurements lying within the POLIPHON uncertainty limits (38 %), exhibiting a mean bias of −12.0 µg m−3 that can be mainly attributed to the difference in the cut-off diameters measured by the two techniques. Corrections applied to account for this difference in the cut-off diameters further enhanced the agreement, decreasing the mean bias to −1.1 µg m−3.
In the measurements carried out on 22 April 2016, a sparse dust layer was observed between 0.8 and 2 km altitude during the morning hours. Information from the lidar measurements and the back-trajectory analysis suggests that this layer was a mixture of desert dust with continental/pollution particles. Despite that, agreement between the airborne in situ and remote sensing measurements in this case was also very good (R=0.9). In terms of absolute values, the corrected mass concentrations measured by the airborne OPC were equal or lower than those derived from the lidar measurements for the entire range of altitudes and exhibited a mean bias of −1.6 µg m−3. The concentrations measured by the airborne OPC were within the calculated uncertainty for POLIPHON.
The measurements reported here indicate that unmanned airborne OPC measurements and lidar observations can provide reliable ways to determine coarse-mode aerosol mass concentration profiles in the atmospheric column, thereby bridging the gap between in situ and remote sensing observations. Considering that both methods can provide dense data sets in a cost-effective manner and on a regular basis, this finding paves the way towards their systematic exploitation in climate models.
The sun photometer data sets used in this study are available at https://aeronet.gsfc.nasa.gov (last access: 6 March 2017, Holben et al., 1998). The OPC data sets analysed during the current study are available from the co-author M.Pikridas (m.pikridas@cyi.ac.cy) upon reasonable request. The PollyXT lidar (http://polly.tropos.de, last access: 10 May 2017, Baars et al., 2016) data sets analysed during the current study are available from the co-authors Albert Ansmann (albert@tropos.de) and Eleni Marinou (elmarinou@noa.gr).
The supplement related to this article is available online at: https://doi.org/10.5194/amt-11-2897-2018-supplement.
JS, AA conceived the experiment, EM, MP, MK, CK, RE conducted the experiment(s), DM analysed the data, prepared the figures and wrote the manuscript. HB applied corrections to lidar profiles. GB supervised the work and contributed to the writing of the manuscript. PK, IB, AT, EM and VA supported the data analysis procedure. All authors reviewed the manuscript.
The authors declare that they have no conflict of interest.
This project received funding from the European Union's Seventh Framework
Program (FP7) project BACCHUS (Impact of Biogenic versus Anthropogenic
emissions on Clouds and Climate: towards a Holistic UnderStanding) under
grant agreement no. 603445, and the European Union's Horizon 2020 research
and innovation program ACTRIS-2 (Aerosols, Clouds and Trace gases Research
InfraStructure Network) under grant agreement no. 654109. The authors extend
special thanks to Robin Lewis Modini from the Paul Scherrer Institute for
assisting in the Mie calculations. Panagiotis Kokkalis acknowledges the funding of the Greek
State Scholarship Foundation: IKY. Part of this project is implemented within
the framework of the Action “Reinforcement of Postdoctoral Researchers” of the Operational Program “Human Resource Development, Education and
Lifelong Learning”, and is co-financed by the European Social Fund (ESF)
and the Greek government (NSRF, 2014–2020).
Edited by: Szymon Malinowski
Reviewed by: two anonymous referees
Althausen, D., Engelmann, R., Baars, H., Heese, B., Ansmann, A., Müller, D., and Komppula, M.: Portable Raman lidar PollyXT for automated profiling of aerosol backscatter, extinction, and depolarization, J. Atmos. Ocean Tech., 26, 2366–2378, https://doi.org/10.1175/2009JTECHA1304.1, 2009. a
Altstädter, B., Platis, A., Wehner, B., Scholtz, A., Wildmann, N., Hermann, M., Käthner, R., Baars, H., Bange, J., and Lampert, A.: ALADINA – an unmanned research aircraft for observing vertical and horizontal distributions of ultrafine particles within the atmospheric boundary layer, Atmos. Meas. Tech., 8, 1627–1639, https://doi.org/10.5194/amt-8-1627-2015, 2015. a
Ansmann, A., Riebesell, M., and Weitkamp, C.: Measurement of atmospheric aerosol extinction profiles with a Raman lidar, Opt. Lett., 15, 746–748, https://doi.org/10.1364/OL.15.000746, 1990. a
Ansmann, A., Wandinger, U., Riebesell, M., Weitkamp, C., and Michaelis, W.: Independent measurement of extinction and backscatter profiles in cirrus clouds by using a combined Raman elastic-backscatter lidar, Appl. Optics, 31, 7113–7131, https://doi.org/10.1364/AO.31.007113, 1992. a, b
Ansmann, A., Tesche, M., Seifert, P., Gross, S., Freudenthaler, V., Apituley, A., Wilson, K., Serikov, I., Linné, H., Heinold, B., and Hiebsch, A.: Ash and fine-mode particle mass profiles from EARLINET-AERONET observations over central Europe after the eruptions of the Eyjafjallajökull volcano in 2010, J. Geophys. Res.-Atmos., 116, D20, https://doi.org/10.1029/2010JD015567, 2011. a, b, c, d, e
Baars, H., Kanitz, T., Engelmann, R., Althausen, D., Heese, B., Komppula, M., Preißler, J., Tesche, M., Ansmann, A., Wandinger, U., Lim, J.-H., Ahn, J. Y., Stachlewska, I. S., Amiridis, V., Marinou, E., Seifert, P., Hofer, J., Skupin, A., Schneider, F., Bohlmann, S., Foth, A., Bley, S., Pfüller, A., Giannakaki, E., Lihavainen, H., Viisanen, Y., Hooda, R. K., Pereira, S. N., Bortoli, D., Wagner, F., Mattis, I., Janicka, L., Markowicz, K. M., Achtert, P., Artaxo, P., Pauliquevis, T., Souza, R. A. F., Sharma, V. P., van Zyl, P. G., Beukes, J. P., Sun, J., Rohwer, E. G., Deng, R., Mamouri, R.-E., and Zamorano, F.: An overview of the first decade of PollyNET: an emerging network of automated Raman-polarization lidars for continuous aerosol profiling, Atmos. Chem. Phys., 16, 5111–5137, https://doi.org/10.5194/acp-16-5111-2016, 2016.
Barmpounis, K., Maisser, A., Schmidt-Ott, A., and Biskos, G.: Lightweight differential mobility analyzers: Toward new and inexpensive manufacturing methods, Aerosol. Sci. Tech., 50, 2–5, 2016. a
Bevington, P. R., Robinson, D. K., Blair, J. M., Mallinckrodt, A. J., and McKay, S.: Data reduction and error analysis for the physical sciences, Comput. Phys., 7, 415–416, 1993. a
Bezantakos, S., Huang, L., Barmpounis, K., Attoui, M., Schmidt-Ott, A., and Biskos, G.: A cost-effective electrostatic precipitator for aerosol nanoparticle segregation, Aerosol. Sci. Tech., 49, iv–vi, https://doi.org/10.1080/02786826.2014.1002829, 2015. a
Bezantakos, S., Schmidt-Ott, F., and Biskos, G.: Performance evaluation of the cost-effective and lightweight Alphasense optical particle counter for use onboard unmanned aerial vehicles, Aerosol. Sci. Tech., 52, 1–8, https://doi.org/10.1080/02786826.2017.1412394, 2017. a
Böckmann, C., Wandinger, U., Ansmann, A., Bösenberg, J., Amiridis, V., Boselli, A., Delaval, A., De Tomasi, F., Frioud, M., Grigorov, I. V., and Hågård, A.: Aerosol lidar intercomparison in the framework of the EARLINET project. 2. Aerosol backscatter algorithms, Appl. Optics, 43, 977–989, https://doi.org/10.1364/AO.43.005370, 2004. a
Bösenberg, J. and Brassington, D. J.: Instrument development for atmospheric research and monitoring: lidar profiling, DOAS and tunable diode laser spectroscopy, 8, Springer Science & Business Media, 1997. a
Brady, J. M., Stokes, M. D., Bonnardel, J., and Bertram, T. H.: Characterization of a quadrotor unmanned aircraft system for aerosol-particle-concentration measurements, Environ. Sci. Technol., 50, 1376–1383, https://doi.org/10.1021/acs.est.5b05320, 2016. a
Bravo-Aranda, J. A., Titos, G., Granados-Muñoz, M. J., Guerrero-Rascado, J. L., Navas-Guzmán, F., Valenzuela, A., Lyamani, H., Olmo, F. J., Andrey, J., and Alados-Arboledas, L.: Study of mineral dust entrainment in the planetary boundary layer by lidar depolarization technique, Tellus B, 67, 26180, https://doi.org/10.3402/tellusb.v67.26180, 2015. a
Chaikovsky, A., Dubovik, O., Holben, B., Bril, A., Goloub, P., Tanré, D., Pappalardo, G., Wandinger, U., Chaikovskaya, L., Denisov, S., Grudo, J., Lopatin, A., Karol, Y., Lapyonok, T., Amiridis, V., Ansmann, A., Apituley, A., Allados-Arboledas, L., Binietoglou, I., Boselli, A., D'Amico, G., Freudenthaler, V., Giles, D., Granados-Muñoz, M. J., Kokkalis, P., Nicolae, D., Oshchepkov, S., Papayannis, A., Perrone, M. R., Pietruczuk, A., Rocadenbosch, F., Sicard, M., Slutsker, I., Talianu, C., De Tomasi, F., Tsekeri, A., Wagner, J., and Wang, X.: Lidar-Radiometer Inversion Code (LIRIC) for the retrieval of vertical aerosol properties from combined lidar/radiometer data: development and distribution in EARLINET, Atmos. Meas. Tech., 9, 1181–1205, https://doi.org/10.5194/amt-9-1181-2016, 2016. a
Comerón, A., Rocadenbosch, F., López, M. A., Rodríguez, A., Muñoz, C., García-Vizcaíno, D., and Sicard, M.: Effects of noise on lidar data inversion with the backward algorithm, Appl. Opt., 43, 2572–2577, https://doi.org/10.1364/AO.43.002572, 2004. a
Dubovik, O. and King, M. D.: A flexible inversion algorithm for retrieval of aerosol optical properties from Sun and sky radiance measurements, J. Geophys. Res., 105, 20673–20696, https://doi.org/10.1029/2000JD900282, 2000a. a
Dubovik, O., Smirnov, A., Holben, B., King, M., Kaufman, Y., Eck, T., and Slutsker, I.: Accuracy assessments of aerosol optical properties retrieved from Aerosol Robotic Network (AERONET) Sun and sky radiance measurements, J. Geophys. Res.-Atmos., 105, 9791–9806, https://doi.org/10.1029/2000JD900040, 2000b. a
Dubovik, O., Holben, B., Eck, T. F., Smirnov, A., Kaufman, Y. J., King, M. D., Tanré, D., and Slutsker, I.: Variability of absorption and optical properties of key aerosol types observed in worldwide locations, J. Atmos. Sci., 59, 590–608, https://doi.org/10.1175/1520-0469(2002)059<0590:VOAAOP>2.0.CO;2, 2002. a
Dubovik, O., Sinyuk, A., Lapyonok, T., Holben, B. N., Mishchenko, M., Yang, P., Eck, T. F., Volten, H., Munoz, O., Veihelmann, B., et al.: Application of spheroid models to account for aerosol particle nonsphericity in remote sensing of desert dust, J. Geophys. Res.-Atmos., 111, D11, https://doi.org/10.1029/2005JD006619, 2006. a
Eck, T., Holben, B., Reid, J., Dubovik, O., Smirnov, A., O'neill, N., Slutsker, I., and Kinne, S.: Wavelength dependence of the optical depth of biomass burning, urban, and desert dust aerosols, J. Geophys. Res.-Atmos., 104, 31333–31349, https://doi.org/10.1029/1999JD900923, 1999. a
Engelmann, R., Kanitz, T., Baars, H., Heese, B., Althausen, D., Skupin, A., Wandinger, U., Komppula, M., Stachlewska, I. S., Amiridis, V., Marinou, E., Mattis, I., Linné, H., and Ansmann, A.: The automated multiwavelength Raman polarization and water-vapor lidar PollyXT: the neXT generation, Atmos. Meas. Tech., 9, 1767–1784, https://doi.org/10.5194/amt-9-1767-2016, 2016. a
Feingold, G. and Morley, B.: Aerosol hygroscopic properties as measured by lidar and comparison with in situ measurements, J. Geophys. Res.-Atmos., 108, D11, https://doi.org/10.1029/2002JD002842, 2003. a
Fernald, F. G.: Analysis of atmospheric lidar observations – Some comments, Appl. Optics, 23, 652–653, 1984. a, b
Freudenthaler, V., Esselborn, M., Wiegner, M., Heese, B., Tesche, M., Ansmann, A., Müller, D., Althausen, D., Wirth, M., Fix, A., Ehret, G.: Depolarization ratio profiling at several wavelengths in pure Saharan dust during SAMUM 2006, Tellus B, 61, 165–179, https://doi.org/10.1111/j.1600-0889.2008.00396.x, 2009. a, b, c, d
Gasteiger, J., Groß, S., Freudenthaler, V., and Wiegner, M.: Volcanic ash from Iceland over Munich: mass concentration retrieved from ground-based remote sensing measurements, Atmos. Chem. Phys., 11, 2209–2223, https://doi.org/10.5194/acp-11-2209-2011, 2011. a
Granados-Muñoz, M. J., Bravo-Aranda, J. A., Baumgardner, D., Guerrero-Rascado, J. L., Pérez-Ramírez, D., Navas-Guzmán, F., Veselovskii, I., Lyamani, H., Valenzuela, A., Olmo, F. J., Titos, G., Andrey, J., Chaikovsky, A., Dubovik, O., Gil-Ojeda, M., and Alados-Arboledas, L.: A comparative study of aerosol microphysical properties retrieved from ground-based remote sensing and aircraft in situ measurements during a Saharan dust event, Atmos. Meas. Tech., 9, 1113–1133, https://doi.org/10.5194/amt-9-1113-2016, 2016. a, b
Hess, M., Koepke, P., and Schult, I.: Optical properties of aerosols and clouds: The software package OPAC, B. Am. Meteorol. Soc., 79, 831–844, https://doi.org/10.1175/1520-0477(1998)079<0831:OPOAAC>2.0.CO;2, 1998. a
Holben, B. N., Eck, T., Slutsker, I., Tanre, D., Buis, J., Setzer, A., Vermote, E., Reagan, J., Kaufman, Y., Nakajima, T., Lavenu, F.: AERONET-A federated instrument network and data archive for aerosol characterization, Remote Sens. Environ., 66, 1–16, https://doi.org/10.1016/S0034-4257(98)00031-5, 1998. a
IPCC, I. C.: The physical science basis. Contribution of working group I to the fifth assessment report of the intergovernmental panel on climate change, 95–925, 2013. a
Klett, J. D.: Stable analytical inversion solution for processing lidar returns, Appl. Optics, 20, 211–220, https://doi.org/10.1364/AO.20.000211, 1981. a, b
Kokkalis, P., Amiridis, V., Allan, J. D., Papayannis, A., Solomos, S., Binietoglou, I., Bougiatioti, A., Tsekeri, A., Nenes, A., Rosenberg, P. D., and Marenco, F.: Validation of LIRIC aerosol concentration retrievals using airborne measurements during a biomass burning episode over Athens, Atmos. Res., 183, 255–267, https://doi.org/10.1016/j.atmosres.2016.09.007, 2017. Kokkalis, Panagiotis and Amiridis, Vassilis and Allan, James D and Papayannis, Alexandros and Solomos, Stavros and Binietoglou, Ioannis and Bougiatioti, Aikaterini and Tsekeri, Alexandra and Nenes, Athanasios and Rosenberg, Philip D and Marenco, F a
Lelieveld, J., Berresheim, H., Borrmann, S., Crutzen, P., Dentener, F., Fischer, H., Feichter, J., Flatau, P., Heland, J., Holzinger, R., and Korrmann, R.: Global air pollution crossroads over the Mediterranean, Science, 298, 794–799, https://doi.org/10.1126/science.1075457, 2002. a
Lohmann, U. and Feichter, J.: Global indirect aerosol effects: a review, Atmos. Chem. Phys., 5, 715–737, https://doi.org/10.5194/acp-5-715-2005, 2005. a
Lopatin, A., Dubovik, O., Chaikovsky, A., Goloub, P., Lapyonok, T., Tanré, D., and Litvinov, P.: Enhancement of aerosol characterization using synergy of lidar and sun-photometer coincident observations: the GARRLiC algorithm, Atmos. Meas. Tech., 6, 2065–2088, https://doi.org/10.5194/amt-6-2065-2013, 2013. a
Mamouri, R. E. and Ansmann, A.: Fine and coarse dust separation with polarization lidar, Atmos. Meas. Tech., 7, 3717–3735, https://doi.org/10.5194/amt-7-3717-2014, 2014. a, b
Mamouri, R.-E. and Ansmann, A.: Potential of polarization lidar to provide profiles of CCN- and INP-relevant aerosol parameters, Atmos. Chem. Phys., 16, 5905–5931, https://doi.org/10.5194/acp-16-5905-2016, 2016. a
Mamouri, R.-E. and Ansmann, A.: Potential of polarization/Raman lidar to separate fine dust, coarse dust, maritime, and anthropogenic aerosol profiles, Atmos. Meas. Tech., 10, 3403–3427, https://doi.org/10.5194/amt-10-3403-2017, 2017. a
Murayama, T., Okamoto, H., Kaneyasu, N., Kamataki, H., and Miura, K.: Application of lidar depolarization measurement in the atmospheric boundary layer: Effects of dust and sea-salt particles, J. Geophys. Res.-Atmos., 104, 31781–31792, https://doi.org/10.1029/1999JD900503, 1999. a
Nisantzi, A., Mamouri, R. E., Ansmann, A., Schuster, G. L., and Hadjimitsis, D. G.: Middle East versus Saharan dust extinction-to-backscatter ratios, Atmos. Chem. Phys., 15, 7071–7084, https://doi.org/10.5194/acp-15-7071-2015, 2015. a
O'Neill, N., Eck, T., Smirnov, A., Holben, B., and Thulasiraman, S.: Spectral discrimination of coarse and fine mode optical depth, J. Geophys. Res.-Atmos., 108, D17, https://doi.org/10.1029/2002JD002975, 2003. a
Osborne, S. R., Johnson, B. T., Haywood, J. M., Baran, A. J., Harrison, M. A. J., and McConnell, C. L.: Physical and optical properties of mineral dust aerosol during the Dust and Biomass-burning Experiment, J. Geophys. Res.-Atmos., 113, d00C03, https://doi.org/10.1029/2007JD009551, 2008. a
Petzold, A., Rasp, K., Weinzierl, B., Esselborn, M., Hamburger, T., Dörnbrack, A., Kandler, K., Schütz, L., Knippertz, P., Fiebig, M., and Virkkula, A. K. I.: Saharan dust absorption and refractive index from aircraft-based observations during SAMUM 2006, Tellus B, 61, 118–130, https://doi.org/10.1111/j.1600-0889.2008.00383.x, 2009. a
Renard, J.-B., Dulac, F., Berthet, G., Lurton, T., Vignelles, D., Jégou, F., Tonnelier, T., Jeannot, M., Couté, B., Akiki, R., Verdier, N., Mallet, M., Gensdarmes, F., Charpentier, P., Mesmin, S., Duverger, V., Dupont, J.-C., Elias, T., Crenn, V., Sciare, J., Zieger, P., Salter, M., Roberts, T., Giacomoni, J., Gobbi, M., Hamonou, E., Olafsson, H., Dagsson-Waldhauserova, P., Camy-Peyret, C., Mazel, C., Décamps, T., Piringer, M., Surcin, J., and Daugeron, D.: LOAC: a small aerosol optical counter/sizer for ground-based and balloon measurements of the size distribution and nature of atmospheric particles – Part 2: First results from balloon and unmanned aerial vehicle flights, Atmos. Meas. Tech., 9, 3673–3686, https://doi.org/10.5194/amt-9-3673-2016, 2016. a
Rocadenbosch, F., Reba, M. N. M., Sicard, M., and Comerón, A.: Practical analytical backscatter error bars for elastic one-component lidar inversion algorithm, Appl. Optics, 49, 3380–3393, https://doi.org/10.1364/AO.49.003380, 2010. a
Rolph, G.: Real-time Environmental Applications and Display sYstem (READY), NOAA Air Resources Laboratory, Silver Spring, MD, available at: http://www. arl.noaa. gov/ready/hysplit4. html (last access: 26 June 2017), 2003. a
Rosati, B., Herrmann, E., Bucci, S., Fierli, F., Cairo, F., Gysel, M., Tillmann, R., Größ, J., Gobbi, G. P., Di Liberto, L., Di Donfrancesco, G., Wiedensohler, A., Weingartner, E., Virtanen, A., Mentel, T. F., and Baltensperger, U.: Studying the vertical aerosol extinction coefficient by comparing in situ airborne data and elastic backscatter lidar, Atmos. Chem. Phys., 16, 4539–4554, https://doi.org/10.5194/acp-16-4539-2016, 2016. a
Rosenberg, P. D., Dean, A. R., Williams, P. I., Dorsey, J. R., Minikin, A., Pickering, M. A., and Petzold, A.: Particle sizing calibration with refractive index correction for light scattering optical particle counters and impacts upon PCASP and CDP data collected during the Fennec campaign, Atmos. Meas. Tech., 5, 1147–1163, https://doi.org/10.5194/amt-5-1147-2012, 2012. a
Sakai, T., Shibata, T., Kwon, S.-A., Kim, Y.-S., Tamura, K., and Iwasaka, Y.: Free tropospheric aerosol backscatter, depolarization ratio, and relative humidity measured with the Raman lidar at Nagoya in 1994–1997: contributions of aerosols from the Asian Continent and the Pacific Ocean, Atmos. Environ., 34, 431–442, https://doi.org/10.1016/S1352-2310(99)00328-3, 2000. a
Schuster, G. L., Vaughan, M., MacDonnell, D., Su, W., Winker, D., Dubovik, O., Lapyonok, T., and Trepte, C.: Comparison of CALIPSO aerosol optical depth retrievals to AERONET measurements, and a climatology for the lidar ratio of dust, Atmos. Chem. Phys., 12, 7431–7452, https://doi.org/10.5194/acp-12-7431-2012, 2012. a
Shimizu, A., Sugimoto, N., Matsui, I., Arao, K., Uno, I., Murayama, T., Kagawa, N., Aoki, K., Uchiyama, A., and Yamazaki, A.: Continuous observations of Asian dust and other aerosols by polarization lidars in China and Japan during ACE-Asia, J. Geophys. Res.-Atmos., 109, D19, https://doi.org/10.1029/2002JD003253, 2004. a
Skamarock, W. C. and Klemp, J. B.: A time-split nonhydrostatic atmospheric model for weather research and forecasting applications, J. Comput. Phys., 227, 3465–3485, https://doi.org/10.1016/j.jcp.2007.01.037, 2008. a
Stein, A., Draxler, R. R., Rolph, G. D., Stunder, B. J., Cohen, M., and Ngan, F.: NOAA's HYSPLIT atmospheric transport and dispersion modeling system, B. Am. Meteorol. Soc., 96, 2059–2077, https://doi.org/10.1175/BAMS-D-14-00110.1, 2015. a
Sugimoto, N. and Lee, C. H.: Characteristics of dust aerosols inferred from lidar depolarization measurements at two wavelengths, Appl. Optics, 45, 7468–7474, https://doi.org/10.1364/AO.45.007468, 2006. a
Surawski, N., Bezantakos, S., Barmpounis, K., Dallaston, M., Schmidt-Ott, A., and Biskos, G.: A tunable high-pass filter for simple and inexpensive size-segregation of sub-10-nm nanoparticles, Sci Rep-UK, 7, 45678, https://doi.org/10.1038/srep45678, 2017. a
Taylor, J.: Introduction to error analysis, the study of uncertainties in physical measurements, 1997. a
Tesche, M., Ansmann, A., Müller, D., Althausen, D., Engelmann, R., Freudenthaler, V., and Groß, S.: Vertically resolved separation of dust and smoke over Cape Verde using multiwavelength Raman and polarization lidars during Saharan Mineral Dust Experiment 2008, J. Geophys. Res.-Atmos., 114, https://doi.org/10.1029/2009JD011862, 2009. a
Tsekeri, A., Amiridis, V., Marenco, F., Nenes, A., Marinou, E., Solomos, S., Rosenberg, P., Trembath, J., Nott, G. J., Allan, J., Le Breton, M., Bacak, A., Coe, H., Percival, C., and Mihalopoulos, N.: Profiling aerosol optical, microphysical and hygroscopic properties in ambient conditions by combining in situ and remote sensing, Atmos. Meas. Tech., 10, 83–107, https://doi.org/10.5194/amt-10-83-2017, 2017. a
Weinzierl, B., Sauer, D., Esselborn, M., Petzold, A., Veira, A., Rose, M., Mund, S., Wirth, M., Ansmann, A., Tesche, M., et al.: Microphysical and optical properties of dust and tropical biomass burning aerosol layers in the Cape Verde region – an overview of the airborne in situ and lidar measurements during SAMUM-2, Tellus B, 63, 589–618, https://doi.org/10.1111/j.1600-0889.2011.00566.x, 2011. a
Whiteman, D., Melfi, S., and Ferrare, R.: Raman lidar system for the measurement of water vapor and aerosols in the Earth's atmosphere, Appl. Optics, 31, 3068–3082, https://doi.org/10.1364/AO.31.003068, 1992. a