the Creative Commons Attribution 4.0 License.
the Creative Commons Attribution 4.0 License.
 | 04 Jul 2022
Understanding aerosol composition in a tropical inter-Andean valley impacted by agro-industrial and urban emissions
Lady Mateus-Fontecha
Angela Vargas-Burbano
Nestor Y. Rojas
German Rueda-Saa
Dominik van Pinxteren
Manuela van Pinxteren
Khanneh Wadinga Fomba
Hartmut Herrmann
Agro-industrial areas are frequently affected by various sources of atmospheric pollutants that have a negative impact on public health and ecosystems. However, air quality in these areas is infrequently monitored because of their smaller population compared to large cities, especially in developing countries. The Cauca River valley (CRV) is an agro-industrial region in southwestern Colombia, where a large fraction of the area is devoted to sugarcane and livestock production. The CRV is also affected by road traffic and industrial emissions. This study aims to elucidate the chemical composition of particulate matter fine mode (PM2.5) and to identify the main pollutant sources before source attribution. A sampling campaign was carried out at a representative site in the CRV region, where daily averaged mass concentrations of PM2.5 and the concentrations of water-soluble ions, trace metals, organic and elemental carbon, and various fractions of organic compounds (carbohydrates, n alkanes, and polycyclic aromatic hydrocarbons – PAHs) were measured. The mean PM2.5 was 14.4±4.4 µg m−3, and the most abundant constituent was organic material (52.7 % ± 18.4 %), followed by sulfate (12.7 % ± 2.8 %), and elemental carbon (7.1 % ± 2.5 %), which indicates the presence of secondary aerosol formation and incomplete combustion. Levoglucosan was present in all samples, with a mean concentration of (113.8±147.2 ng m−3), revealing biomass burning as a persistent source. Mass closure using the elemental carbon (EC) tracer method explained 88.4 % on PM2.5, whereas the organic tracer method explained 70.9 % of PM2.5. We attribute this difference to the lack of information of specific organic tracers for some sources, both primary and secondary. Organic material and inorganic ions were the dominant groups of species (79 % of PM2.5). OMprim and OMsec contribute 24.2 % and 28.5 % to PM2.5. Inorganic ions as sulfate, nitrate, and ammonia constitute 19.0 %, EC 7.1 %, dust 3.5%, particle-bounded water (PBW) 5.3 %, and trace element oxides (TEOs), 0.9 % of PM2.5. The aerosol was acidic, with a pH of 2.5±0.4, mainly because of the abundance of organic and sulfur compounds. Diagnostic ratios and tracer concentrations indicate that most PM2.5 was emitted locally and had contributions of both pyrogenic and petrogenic sources, that biomass burning was ubiquitous during the sampling period and was the main source of PAHs, and that the relatively low PM2.5 concentrations and mutagenic potentials are consistent with low-intensity, year-long biomass burning (BB) and sugarcane pre-harvest burning in the CRV.
- Article
(5834 KB) - Full-text XML
-
Supplement
(1182 KB) - BibTeX
- EndNote


Urban and suburban locations, with moderate to high population densities, are exposed to air pollutant emissions, including of fine particulate matter (PM) from industry, road traffic, and other anthropogenic activities. Suburban areas may also be impacted by emissions from agricultural activities (Begam et al., 2016). Air quality in areas under these conditions is infrequently monitored, particularly in developing countries, despite the extensive use of highly emitting practices, including the intensive use of insecticides and pesticides, fire for land and crop management, and diesel-based mechanization (Aneja et al., 2008, 2009). Agricultural sources emit pollutants, such as volatile organic compounds (VOCs), which are precursors of tropospheric ozone (Majra, 2011), and secondary organic aerosols (SOA; Majra, 2011). Most agricultural activities also emit PM2.5 (solid and liquid particles with aerodynamic diameters smaller than 2.5 µm), which may contain black carbon (BC) and toxic and carcinogenic pollutants, e.g., polycyclic aromatic hydrocarbons (PAHs). Other agricultural activities, including mechanized land preparation, sowing, and harvesting, consume significant volumes of fossil fuels, particularly diesel, and emit trace gases (including CO2, CO, SO2, NOx, NH3, and VOCs) that also generate O3 and SOA, all of which affect human health and climate (Yadav and Devi, 2019). Furthermore, agricultural operations are a significant source of nitrogen-containing trace gases (NO2, NO, NH3, and N2O) that are released from fertilizers, livestock waste, and farm machinery into the atmosphere (Sutton et al., 2011). Also, poultry and pig farming are high emitters of sulfur compounds, particularly H2S.
The Cauca River valley (CRV) is an inter-Andean valley in southwestern Colombia, with a flat area of 5287 km2 (248 km long by 22 km mean width), a mean altitude of 985 m a.m.s.l. (above mean sea level; Fig. 1). CRV is bounded by the Colombian Andes western and central Cordilleras and is located at ∼120 km from the Pacific Ocean. The CRV encompasses the cities of Cali, Colombia's third-largest city, with 2.2 million inhabitants (inhab), Yumbo (129 000 inhab), an important industrial hub, and Palmira (313 000 inhab), an important agro-industry center. Industry is also present in the other major CRV cities (Tuluá, Cartago, Jamundí, and Buga).
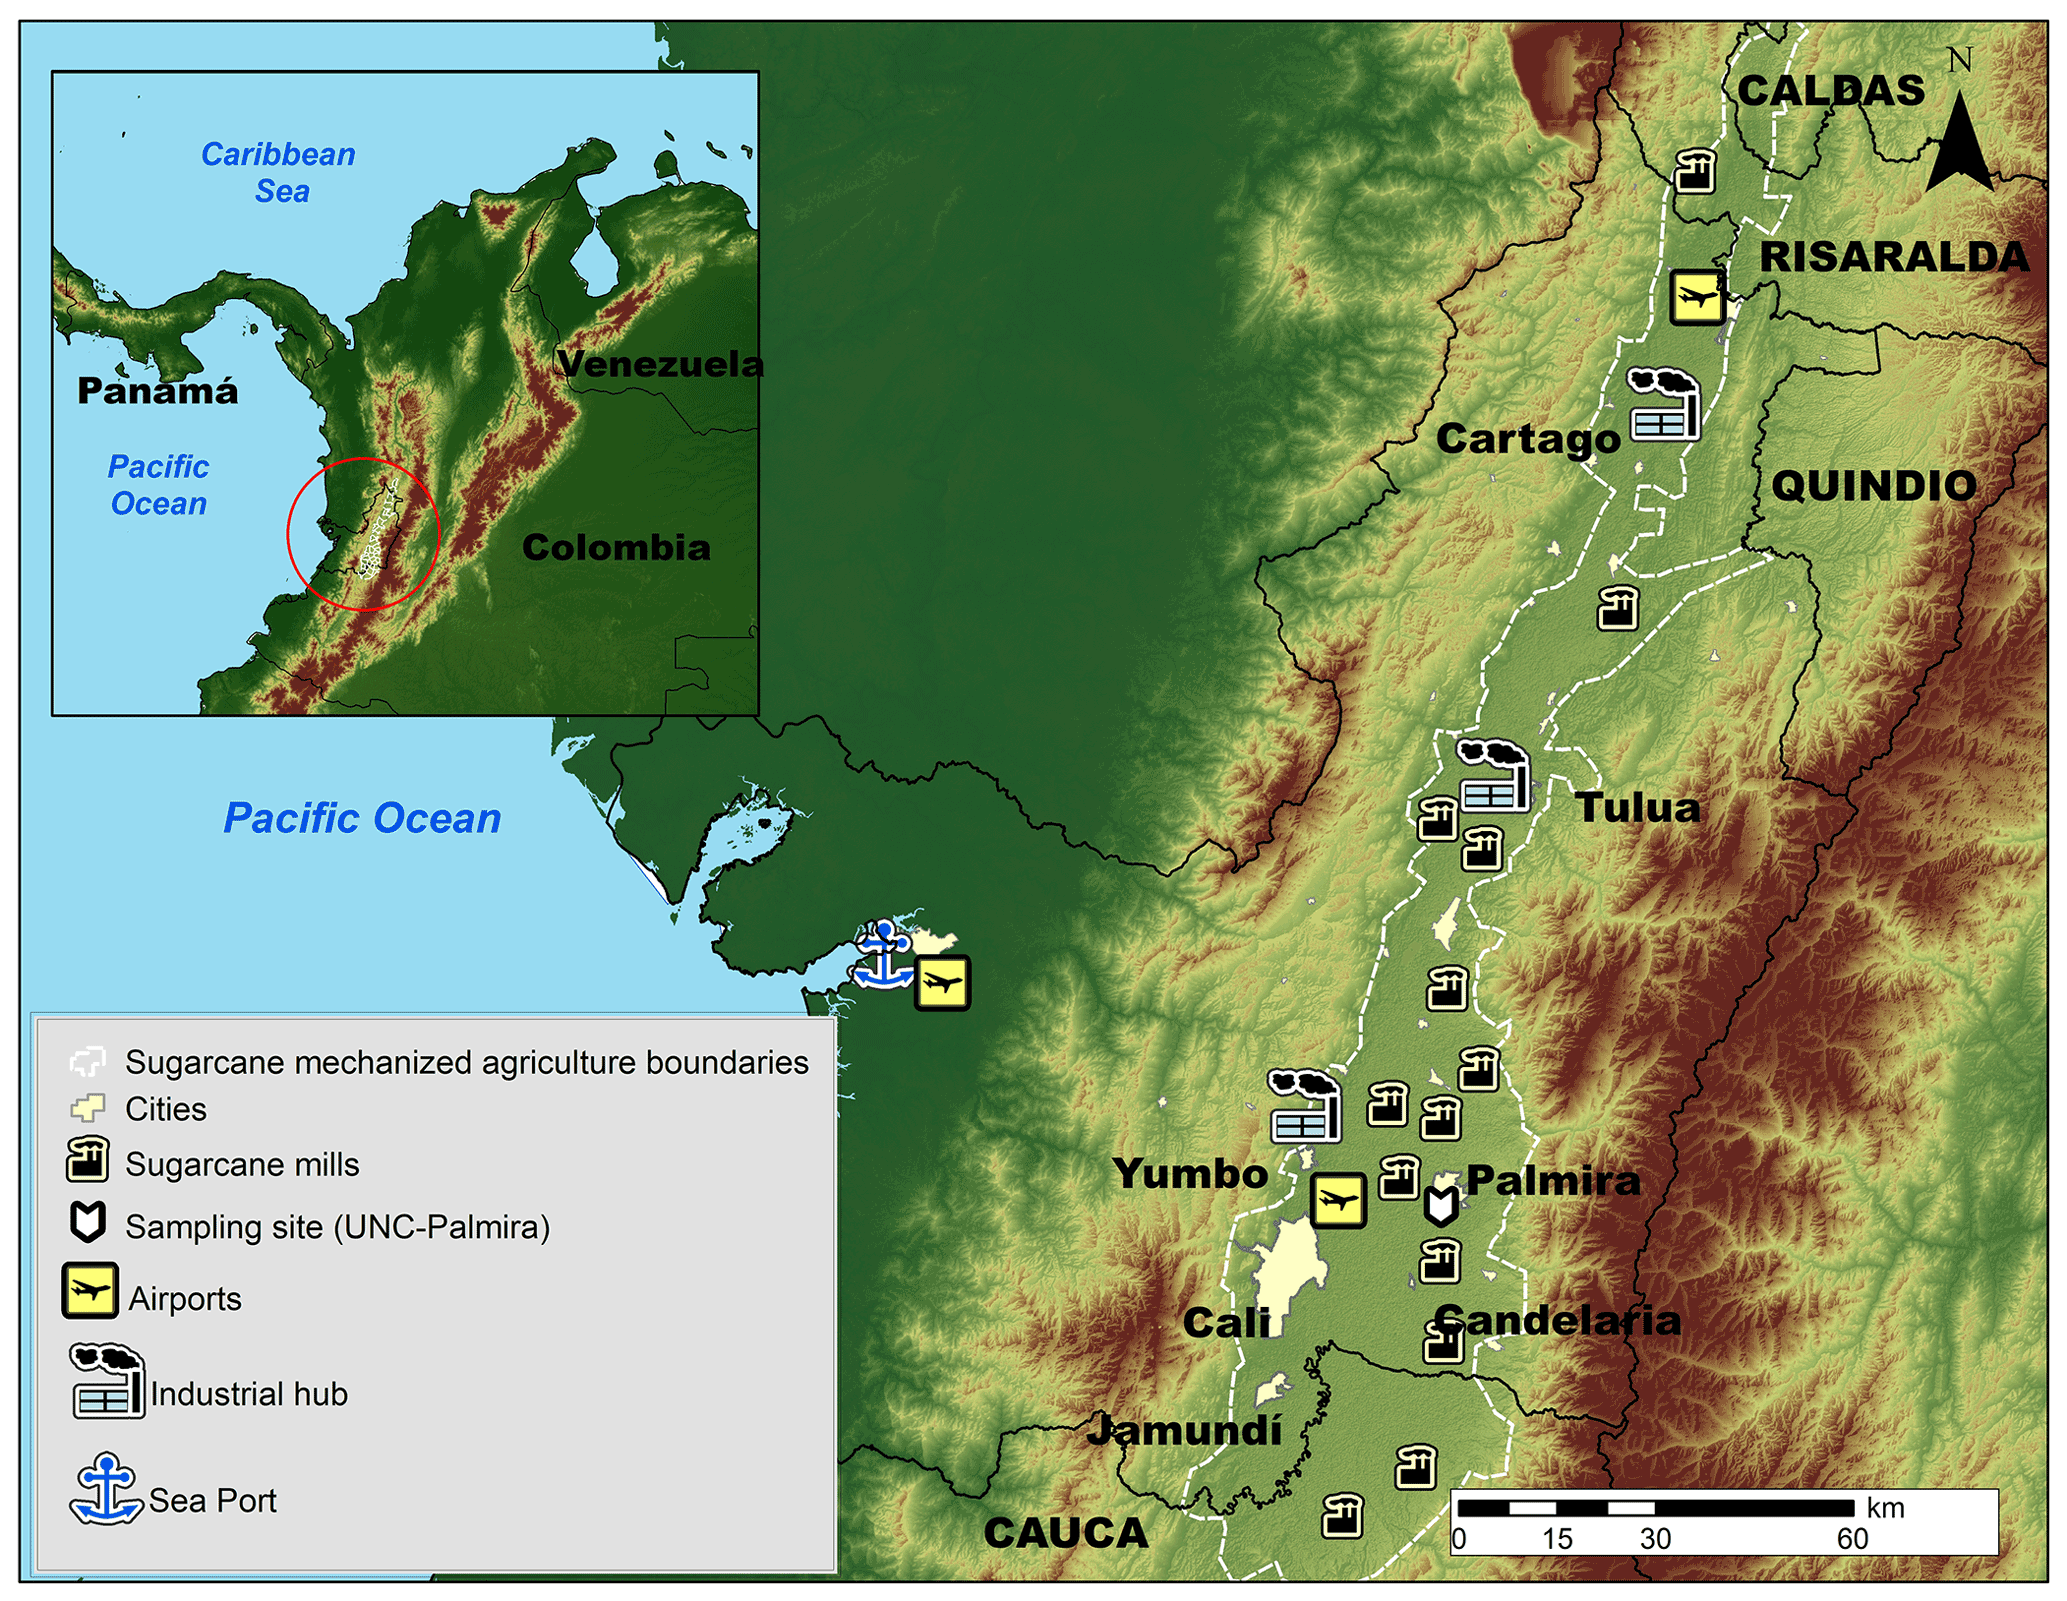
Figure 1Map of the Cauca River valley (CRV). The inset shows the location of CRV in Colombia and in northern South America. The map shows the main cities in the CRV, including Palmira (312 000 inhabitants), our measurement site, Cali, the largest city in the southwest of Colombia, Yumbo, an industrial hub, and the main highways. Sugar mills, which produce sugar, bioethanol, and electric power are also shown. The dashed-line-defined area is CRV's flattest (slope < 5 %) bottomland, where mechanized, intensive sugarcane agriculture takes place. Significant diesel combustion emissions occur along the Buenaventura highway because it is one of the busiest ports in Colombia.
CRV hosts a highly efficient, resource-intensive sugarcane agro-industry with one of the highest biomass yields (up to 120 t ha−1) and the highest sugar productivities in the world (∼13 mg sugar per hectare; Asocaña, 2018, 2019). Sugarcane sowing, harvesting, and transport to mills are all mechanized and use diesel as fuel. Besides, all the sugarcane bagasse is used to either produce heat and electric power (cogeneration) or as feedstock to the local paper industry. Moreover, although pre-harvest burning is being phased out in the CRV, one-third of the sugarcane area in 2018 was burned prior to harvesting. CRV is also the third-largest poultry producer (351 Gg yr−1), and the first egg producer (4.6×10⁹ yr−1) in Colombia (Min.Agricultura, 2020). In addition, the CRV produces 15.1 % of Colombia's pork meat (over 1×10⁶ pigs in stock; Min.Agricultura, 2019) and 1.8 % of national beef production (467 782 heads of cattle in stock; Min.Agricultura, 2018). Poultry and livestock production are significant sources of H2S and NH3. Besides a long established energy-intensive industry, there are also a variety of smaller industries, including brick kilns. Regarding mobile sources, there are nearly 2×10⁶ vehicles (1 951 638 vehicles) registered in the CRV (RUNT, 2021). These include the standard urban categories along with off-road unregulated farming machinery. The sugarcane agro-industry uses multi-car trailers towed by diesel-powered tractors, with enough annual activity to be considered an independent source (the activity of which is proportional to the sugarcane harvested area and the distance to sugar mills). Overall, the CRV mobile sources consumed 772×106 L of gasoline and 590×106 L of diesel in 2018 (SICOM, 2018). Moreover, the local airport, the most important in southwest Colombia, located very close to Palmira, handled 1.3×10⁶ passengers in 2019 (Aerocivil, 2019). Also, 1657 ha of sugarcane and corn were fumigated in 2020 using small aircraft (Aerocivil, 2020).
For this research, we prepared a preliminary, aggregated PM10 emission inventory for CRV by putting together disparate source data, including from the stationary source emission inventories of CRV's six largest cities (Cali, Tuluá, Cartago, Jamundí, Palmira, Yumbo, and Buga), the mobile source emission inventories of Cali and other cities, and our estimation of sugarcane pre-harvest burning (PHB) and other point, linear, and area sources (Table S1 in the Supplement). Our preliminary inventory indicates that the manufacturing industry is by far the main PM10 emitter in the CRV, with annual emissions of ∼8.2 Gg PM10. PM10 emissions from mobile sources (∼1.4 Gg PM10 yr−1) and open-field sugarcane pre-harvest burning (1.7 Gg PM10 yr−1) are a factor ∼5 smaller. The emissions of inorganic and organic secondary aerosol precursors are also significant. We estimate that 30.1 Gg of SO2 are emitted annually in the CRV (41 % from sugar mills and other agro-industries, 32 % from food industries, and 9 % from cement, ceramic, and asphalt production). Emissions of volatile organic compounds (VOCs) are very similar (34.7 Gg yr−1). Although a significant number of coal-fired boilers have been converted to natural gas, CRV's sulfur-rich coal (1.4 %–4 % total S) is still an important industrial fuel. It must be stressed that this is a preliminary, not fully updated, regional inventory. The available information was insufficient for disaggregating the fine-mode particulate matter emissions (PM2.5). The multiplicity, disparity, and uncertainty of sources are indicative of the complexity of the PM2.5 source identification, quantification, and location tasks.
The particulate matter chemical composition has been widely used for the apportionment of pollutant sources and toxicity exposure analyses. Most field-measurement-based studies have been conducted in North America, Europe, and Asia (Karagulian et al., 2015). The number of studies in Latin America and the Caribbean (LAC) is much smaller and focused on the chemical composition of PM10 (Pereira et al., 2019; Vasconcellos et al., 2011) and the PM source apportionment in urban areas of Colombia (Ramírez et al., 2018; Vargas et al., 2012), Chile (Jorquera and Barraza, 2012, 2013; Villalobos et al., 2015), Costa Rica (Murillo et al., 2013), and Brazil (de Andrade et al., 2010). The number of studies that involve agro-industrial sources and their impact on suburban areas is even smaller. These include the Indo-Gangetic plain (Alvi et al., 2020), the São Paulo state in Brazil (Gonçalves et al., 2016; Urban et al., 2016), Ouagadougou in Burkina Faso (Boman et al., 2009), and the Anhui province in China (Li et al., 2014), for which the chemical composition of PM2.5 and some of its sources have been identified. Likewise, regions in South America with sugarcane agro-industry, such as Mexico (Mugica-Álvarez et al., 2015; Mugica-Álvarez et al., 2016, 2018) and Brazil (de Andrade et al., 2010; De Assuncao et al., 2014; Lara et al., 2005; Pereira et al., 2017), have also reported on their agro-industry impact on PM2.5 levels at nearby population centers. There are very few studies on air pollution in the agro-industrial areas of Colombia. Most notably, Romero et al. (2013) measured PAHs and metals in PM10. Most of the studies above identified biomass burning and fossil fuel combustion as significant PM sources, and some also identified industrial and fertilizer use as being relevant.
This research aimed to characterize the chemical composition of PM2.5 at a CRV-representative location, including elemental carbon (EC), primary and secondary organic carbon (OC), ions, trace metals, and specific molecular markers, such as PAHs, n alkanes, and carbohydrates, as well as the relationships among these components and with emission sources. Diagnostic ratios were used to identify the most important PM2.5 components and as a tool for preliminary pollutant source attribution, including primary and secondary aerosols generated by or associated with sugarcane pre-harvest burning. We believe that, in the CRV case, this analysis is needed prior to source apportionment with receptor models for the following three reasons: (1) this is the first comprehensive investigation of PM composition in the CRV (prior studies included two types of components at most), (2) there are no suitable chemical profiles for some pollutant sources, particularly sugarcane PHB, and (3) our measurement dataset is barely large enough for profile-free receptor modeling (positive matrix factorization). We expect that this study will also motivate future research on source apportionment in the region. Our results are particularly relevant for urban communities and atmospheres impacted by large-scale intensive agriculture and industrial emissions, particularly in developing countries and especially in Latin America, where PM composition information is still scarce (Liang et al., 2016).
2.1 Description of the sampling site
The sampling site was located on the rooftop of an eight-story administrative building at the Palmira Campus of Universidad Nacional de Colombia (3∘30′44.26′′ N, 76∘18′27.40′′ W; 1065 m altitude), about 27 m above the ground. The campus is located on the western outskirts of Palmira's urban area and is surrounded by short buildings in the east and extensive sugarcane plantations, several sugar mills, and other industries elsewhere. Palmira is located at ∼27 km northeast of Cali and ∼22 km southeast of Yumbo and is an important industrial hub. The Pacific Ocean coastline stretches at ∼120 km across the western Cordillera, as shown in Fig. 1, where one of the busiest international trade seaports in Colombia operates (López Larada, 2017). Most of the freight is transported by diesel-powered trucks. Road traffic is also substantial within the CRV, together with Bogotá, and along the Pan-American highway that connects Colombia with other South American countries (Orozco et al., 2012).
The Andes Cordillera splits into three south-to-north diverging mountain ranges (western, central, and eastern Cordilleras) near the Colombia–Ecuador border (see Fig. 1). The western Cordillera separates the CRV from the Colombian Pacific Ocean watershed, the rainiest region on Earth (Hernández and Mesa, 2020). The elevated precipitation in this basin (Mesa and Rojo, 2020) is due to the presence of a Walker cell convergence zone at the surface, persistent under neutral and La Niña conditions. This synoptic feature is one of the most important determinants of atmospheric circulation in Colombia, with prevailing east-to-west winds in the lower troposphere, along with upper troposphere return winds (Mesa and Rojo, 2020). The Andean Cordilleras are nevertheless effective barriers to trade winds and the Walker circulation near the CRV surface (Lopez and Howell, 1967; Mesa and Rojo, 2020). The elevated humidity in the Pacific Ocean watershed and the closeness of the two Andes branches drive a zonal regional circulation pattern, consisting of west-to-east anabatic winds over the Pacific slope of the western Cordillera during daytime, followed by rapid katabatic winds in late afternoon (Lopez and Howell, 1967). These winds rapidly ventilate the CRV during the late afternoon–early evening period on an almost regular basis. CRV is wide (∼22 km) and long (∼248 km) enough to develop a valley–mountain wind circulation pattern during the daytime. Winds are very mild during this time period and expected to be highly dispersive, i.e., with high turbulence intensities (Ortiz et al., 2019). The arrival of the katabatic tide in the late afternoon wipes the valley–mountain wind pattern out (Lopez and Howell, 1967).
2.2 Sampling protocols
The sampling campaign was conducted between 25 July and 19 September 2018. PM2.5 aerosol particles (aerodynamic diameter < 2.5 µm) were collected on Teflon and quartz fiber filters simultaneously for 23 h (from 12:00 LT, local time, to the next day at 11:00 LT), using two in-tandem low-volume samplers (ChemComb speciation samplers; R & P). Each sampler used an independent pump set at a flow rate of 14 L min−1. For both types of filters, three lab blank filters without exposure were analyzed. Quartz filters were pre-baked at 600 ∘C for 8 h before sampling to eliminate contaminant trace hydrocarbons. In total, 45 samples were collected. Prior to and after exposure, the filters were conditioned at constant humidity (36±1.5 % relative humidity) and temperature (24±1.2 ∘C) for 24 h before being weighing on a microbalance (Sartorius; Mettler Toledo International Inc.) with a 199.99 g capacity and 10 µg resolution. PM2.5-loaded filters were saved in Petri boxes previously prepared to avoid cross-contamination of organic species. The filters were subsequently stored at −20 ∘C until analysis to reduce the volatilization of species such as ammonium nitrate and semi-volatile organic compounds. Blank quartz filters were pre-baked and stored following an identical procedure to exposed filters to collect samples. Blank Teflon filters were treated under the same conditions of storage, transport, and analysis as PM2.5-loaded filters.
Several frequent challenges can affect the PM composition measurements, including the following: (1) absorption of some gases on the inlet's galvanic steel, which may alter the gas-particle balance of the HNO3 ⇔ system on the collected PM. No denuders were utilized during sample collection in this study; (2) significant temperature changes during sampling, and then during their conditioning before filter weighing, may cause ammonium nitrate to volatilize. Because the samples were collected at temperatures ranging from 17 to 33 ∘C, and then conditioned to 25 ∘C, shifts in the equilibrium of the HNO3 ⇔ system could have been a source of uncertainty in our data. The vaporization of some semi-volatile organic species throughout the sampling and storage period, and the absorption of organic gases in the filter material, are two additional sources of uncertainty.
Mass concentrations were determined from the Teflon filters by differential weighing. It is worth mentioning that, during the sampling period, 1888 sugarcane PHB events occurred. This information was kindly provided by the regional environmental authority (CVC) from reports by sugarcane producers. The vast majority of these events were intentional, controlled, size limited (∼6 ha median area), and brief (∼25 min median duration; Fig. S1 in the Supplement).
2.3 Analytical methods
The quartz fiber filter samples were analyzed for ions, metals, elemental and organic carbon, and speciation of the carbonaceous fraction. The Teflon membrane filter samples were analyzed for metals.
A total of two circular pieces with an 8 mm diameter (100.5 mm2) were punched from each quartz and Teflon filter, following the method described by Wadinga Fomba et al. (2020), and extracted using 1 mL of ultrapure water (18 MΩ) in a shaker at 400 rpm (revolutions per minute) for 120 min. The extracts were filtered through 0.45 µm syringe filters (Acrodisc; Pall Corporation). An aliquot of the solution was analyzed for inorganic (K+, Na+, , Mg2+, Ca2+, Cl−, , , , , Br−, and F−) and some organic ions (, CH3O3S−, and ) by ion chromatography (IC 690, Metrohm AG; ICS-3000, Dionex). Another aliquot was analyzed for carbohydrates, including levoglucosan, mannosan, and galactosan, as described by Iinuma et al. (2009). Organic and elemental carbon were determined from 90.0 mm2 filter pieces following the EUSAAR 2 protocol (Cavalli et al., 2010), with a thermal-optical method, using a Sunset Laboratory Inc. dual carbonaceous analyzer.
In total, 17 metals, including K, Ca, Ti, V, Cr, Mn, Fe, Ni, Cu, As, Se, Sr, Ba, Pb, Sn, Sb, and Cu, were analyzed from Teflon (22 samples) and quartz (23 samples) filters by total reflection X-ray fluorescence spectroscopy (TXRF; PICOFOX S2, Bruker). Si was not determined, as this element is part of the quartz filter substrate. Metals were analyzed from three 8 mm circular pieces punched from Teflon filters, which were digested a nitric and chloride acid solution for 180 min at 180 ∘C. After this, 20 µL aliquots of the digested solution were placed on the surface of polished TXRF quartz substrates along with 10 µL of Ga solution, which served as an internal standard. This solution was left to evaporate at 100 ∘C. The samples were measured at two angles, with a difference of 90∘ between them, to ensure complete excitation of metals. More details on the analytical technique can be found in Fomba et al. (2013).
Alkanes and PAHs were determined from two circular filter punches (6 mm diameter; 56.5 mm2), using a Curie Point Pyrolyzer (JPS 350, JAI) coupled to a gas chromatography mass spectrometry (GC-MS) system (6890N GC, 5973 inert mass selective detector (MSD); Agilent Technologies). The chemical identification and quantification of the C20 to C34 n alkanes, and the following organic species, were performed using the following external standards (Campro Scientific GmbH, Germany): pristane, phytane, fluorene (FLE), phenanthrene (PHEN), anthracene (ANT), fluoranthene (FLT), pyrene (PYR), retene (RET), benzo(b)naphtho(1,2-d)thiophene (BNT(2,1)), cyclopenta(c,d)pyrene (CPY), benz(a)anthracene (BaA), chrysene(+triphenylene) (CHRY), 2,2-binaphtyl (BNT(2,2)), benzo(b)fluoranthene (BbF), benzo(k)fluoranthene (BkF), benzo(e)pyrene (BeP), benzo(a)pyrene (BaP), indeno(1,2,3-c,d)pyrene (IcdP), dibenz(a,h)anthracene (DahA), benzo(g,h,i)perylene (BghiP), coronene (COR), 9H-fluoreneone (FLO(9H)), 9,10-anthracenedione (ANT(9,10)), and 1,2-benzanthraquinone (BAQ(1,2)). In total, four deuterated PAHs, (acenaphthene-d10, phenanthrene-d10, chrysene-d12, and perylene-d12), and two deuterated alkanes (tetracosane-d50 and tetratriacontane-d70) were used as internal standards, following the analytical method described by Neusüss et al. (2000). For each analyzed compound, the sample concentration was calculated by subtracting the average concentration of three blank filters from the measured concentration.
2.4 Diagnostic ratios and mass closure
The main PM2.5 components, organic material (OM), elemental carbon (EC), sulfate, ammonium and nitrate, crustal material (dust), other trace element oxides (TEOs), and particle-bounded water (PBW), were estimated from the concentrations of EC, organic carbon (OC), water-soluble ions (, , and ), and tracer metal concentrations (Ca, Ti, Fe, Ni, Cu, Zn, As, Se, Sb, Ba, and Pb). PM2.5 closure is described by Eq. (1) (Dabek-Zlotorzynska et al., 2011). We used the Interagency Monitoring of Protected Visual Environments (IMPROVE) equations (Chow et al., 2015) to quantify the concentrations of the main compounds (Table 1). The aerosol–particle-bounded water content was estimated from the measured ionic composition, relative humidity, and temperature, following the aerosol inorganic model (AIM) described by Clegg et al. (1998), which is available online at http://www.aim.env.uea.ac.uk/aim/model2/model2a.php (last access: 27 June 2022). The thermodynamic equilibrium of the system H+––Na+––NO3–Cl−H2O was described by and estimated from AIM.
Table 1Equations used to estimate the main components of PM2.5.
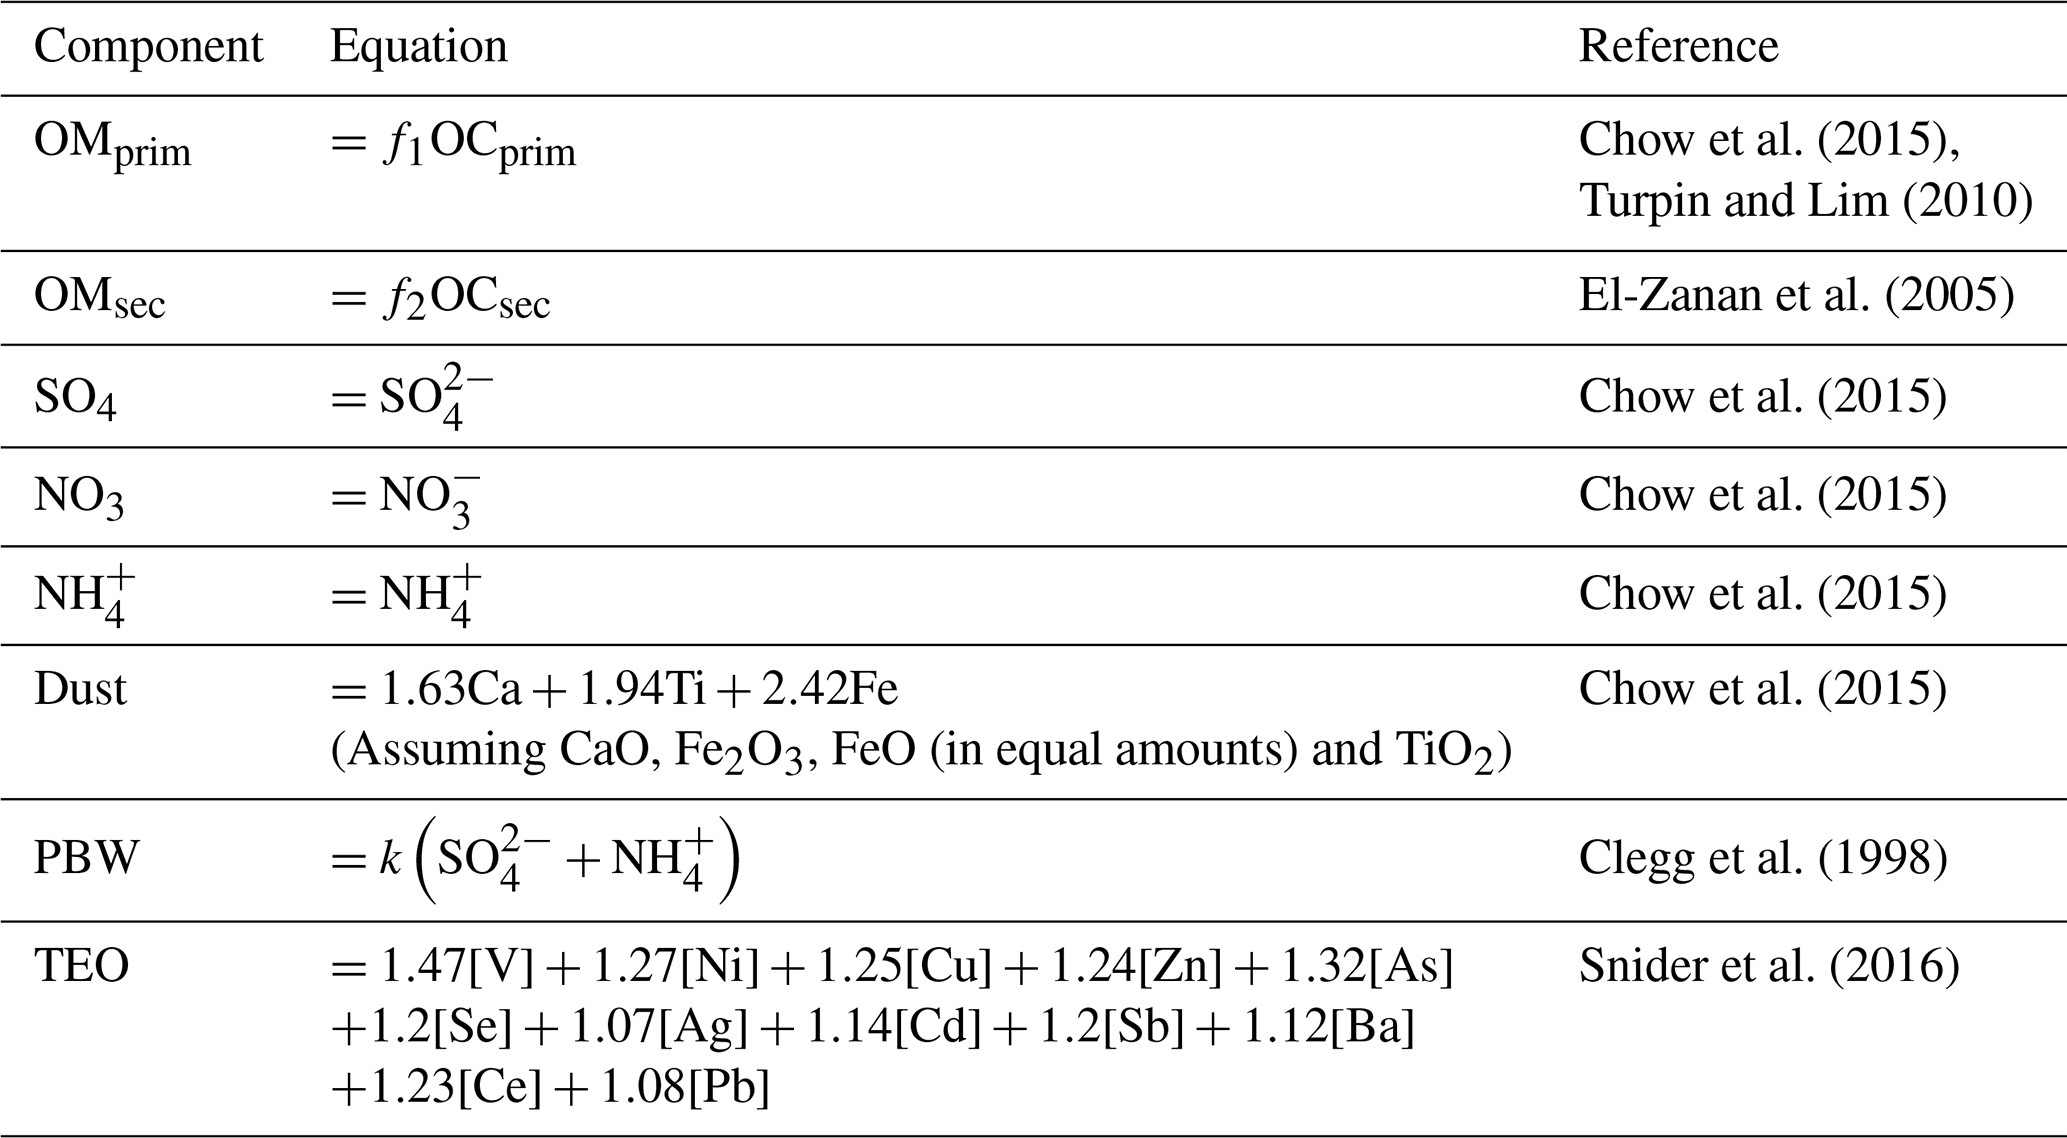
f1=1.6; this factor was estimated considering the predominant sources. f2=2.1; this factor was estimated by subtracting the non-carbon component of PM2.5 from the measured mass. k=0.32 was calculated using the Aerosol Inorganic Model.
The EC tracer method was applied to estimate primary (OCprim) and secondary (OCsec) organic carbon (Lee et al., 2010). This method utilizes EC as a tracer for primary OC, which implies that OCprim from non-combustion sources is deemed negligible. Primary and secondary OC can be estimated by defining a suitable primary OC to EC ratio ( ; see Eqs. (2) and (3)). We estimated the ratio as the slope of the Deming linear fit between EC and OC measurements. The term b corresponds to the linear fit intercept, which can be interpreted as the emitted OCprim that is not associated with EC emissions. This method is limited as per the following assumptions: (1) is deemed constant, while in reality it may change throughout the day, depending on factors such as wind direction and the location of the dominant emission sources. Our 23 h sampling is expected to smooth this variability source out; (2) it neglects OCprim from non-combustion sources, and (3) it assumes that OCprim is nonvolatile and nonreactive. Departure from these assumptions implies that the estimation of OCprim and OCsec might be biased, likely underestimating OCsec.
OCprim was also estimated by using an organic tracer method involving three sources considered significant in the CRV, namely fossil fuel combustion (OCFF), biomass burning (OCBB), and vegetable detritus (OCdet). OCFF, OCBB, and OCdet were estimated by fitting a linear model (Eq. 4) using robust regression (M estimator with bisquare function), which used the coefficients X, Y, and Z, to multiply the tracer concentrations of each source. The tracers used were the sum of the BghiP and IcdP for fossil fuel (TFF), levoglucosan for biomass burning (TBB), and the sum of the highest molecular weight alkanes (C27–C33) for vegetable detritus (Tdet). The sum of each tracer is multiplied by X, Y, and Z, respectively, Eq. (5), corresponding to OCprim attributed to known sources present in the CRV. The subtraction of OCprim attributed to the OC total is named OCrest, which corresponds to another source of OC primary and OC secondary.
Following Table 1, OM was estimated from OC using the conversion factors f1 and f2 (Chow et al., 2015). These are dependent on the OM oxidation level and secondary organic aerosol (SOA) formation and aging during air mass movements. Turpin and Lim (2010) recommended a OM OC ratio of 1.6±0.2 for urban aerosols and 2.1±0.2 for non-urban aerosols. These values are comparable to those reported by Aiken et al. (2008) of 1.71 (1.41–2.15), where lower values (1.6–1.8) are typical of ground measurements in the morning and higher values (1.8–1.9) of aircraft samples. The conversion factors for biomass burning (BB) aerosols can be even higher (2.2–2.6) due to the presence of organic components with higher molecular weights, e.g., levoglucosan. However, Andreae (2019) recommends a factor of 1.6 for fresh BB aerosol, which is consistent with Hodshire et al. (2019). We believe that traffic and biomass burning are the dominant primary OC sources at our site. Therefore, we used f1=1.6 to estimate OMpri and f2=2.1 to estimate OMsec from the OCsec. This factor was chosen based on recommended ratios of 2.1±0.2 for aged aerosols (Schauer, 1998). It is worth mentioning that some global climate models estimate direct radiative forcing from organic material present in aerosols using OM OC ratios without separating sources, while others apply different ratios, depending on the type of source, particularly values ranging within 1.4–1.6 for fossil fuels and biofuel, and 2.6 for biomass burning. Other models use specific molecules as tracers of OM, such as monoterpenes, isoprene, aromatics, and alkanes. Tsigaridis et al. (2014) presented a list of tracers than haven been used in various models to quantify OM in the aerosols.
Concentration ratios among distinct species were used to chemically characterize and infer the main sources of fine particle matter at Palmira. The cation/anion equivalent ratio and the molar ratio were used as preliminary proxies for PM2.5 acidity. The first one is based on electroneutrality and assumes that H+ balances out the excess of anions in the solution. The cation equivalent to anion equivalent ratio was calculated using Eqs. (7) and (8) for each term. The second ratio is an indicator of acidity attributable to those two ions, which are usually the most abundant among cations and anions in PM2.5.
However, these approaches to infer the PM2.5 acidity can result in challenging interpretations and incomplete and incorrect results due to an indirect connection to the system's acidity (Pye et al., 2020). Therefore, the E-AIM (Extended Aerosol Inorganics Model) was used to estimate the equilibrium state of a system containing water and the following: , , , Na+, and Cl− ions in equilibrium with an atmosphere at a known temperature and relative humidity but without information on gas-phase concentrations (NH3, HNO3, and SO2), as these were not available in our investigation. The H+ mole fraction concentration from E-AIM IV (Friese and Ebel, 2010) was used to calculate pH following Eq. (9). E-AIM requires that the input data for ionic composition be balanced on an equivalent basis, which means that the sums of the charges on the cations and anions considered in the system do balance, accordingly [ + [] + [Cl−] = [] + [Na+]. The disadvantage of this approach is that it does not allow for the partitioning of trace gases into the vapor phase (the model is available at http://www.aim.env.uea.ac.uk/aim/model4/model4a.php; last access 22 January 2022).
Parent PAH ratios are widely used to identify combustion-derived PAHs (Khedidji et al., 2020; Szabó et al., 2015; Tobiszewski and Namieśnik, 2012), although some of them are photochemically degraded in the atmosphere (Yunker et al., 2002). Additionally, n alkanes are employed as markers of fossil fuel or vegetation contributions to PM2.5. Carbon number maximum concentration (Cmax), carbon preference index (CPI), and wax n alkanes percentage (WNA %) were the criteria utilized to determine the n alkanes origin. Table 2 summarizes the diagnostic ratio equations and the expected dominating source based on ratio values.
Table 2Diagnostic ratios of organic compounds used to infer the sources of PM2.5 in this study.
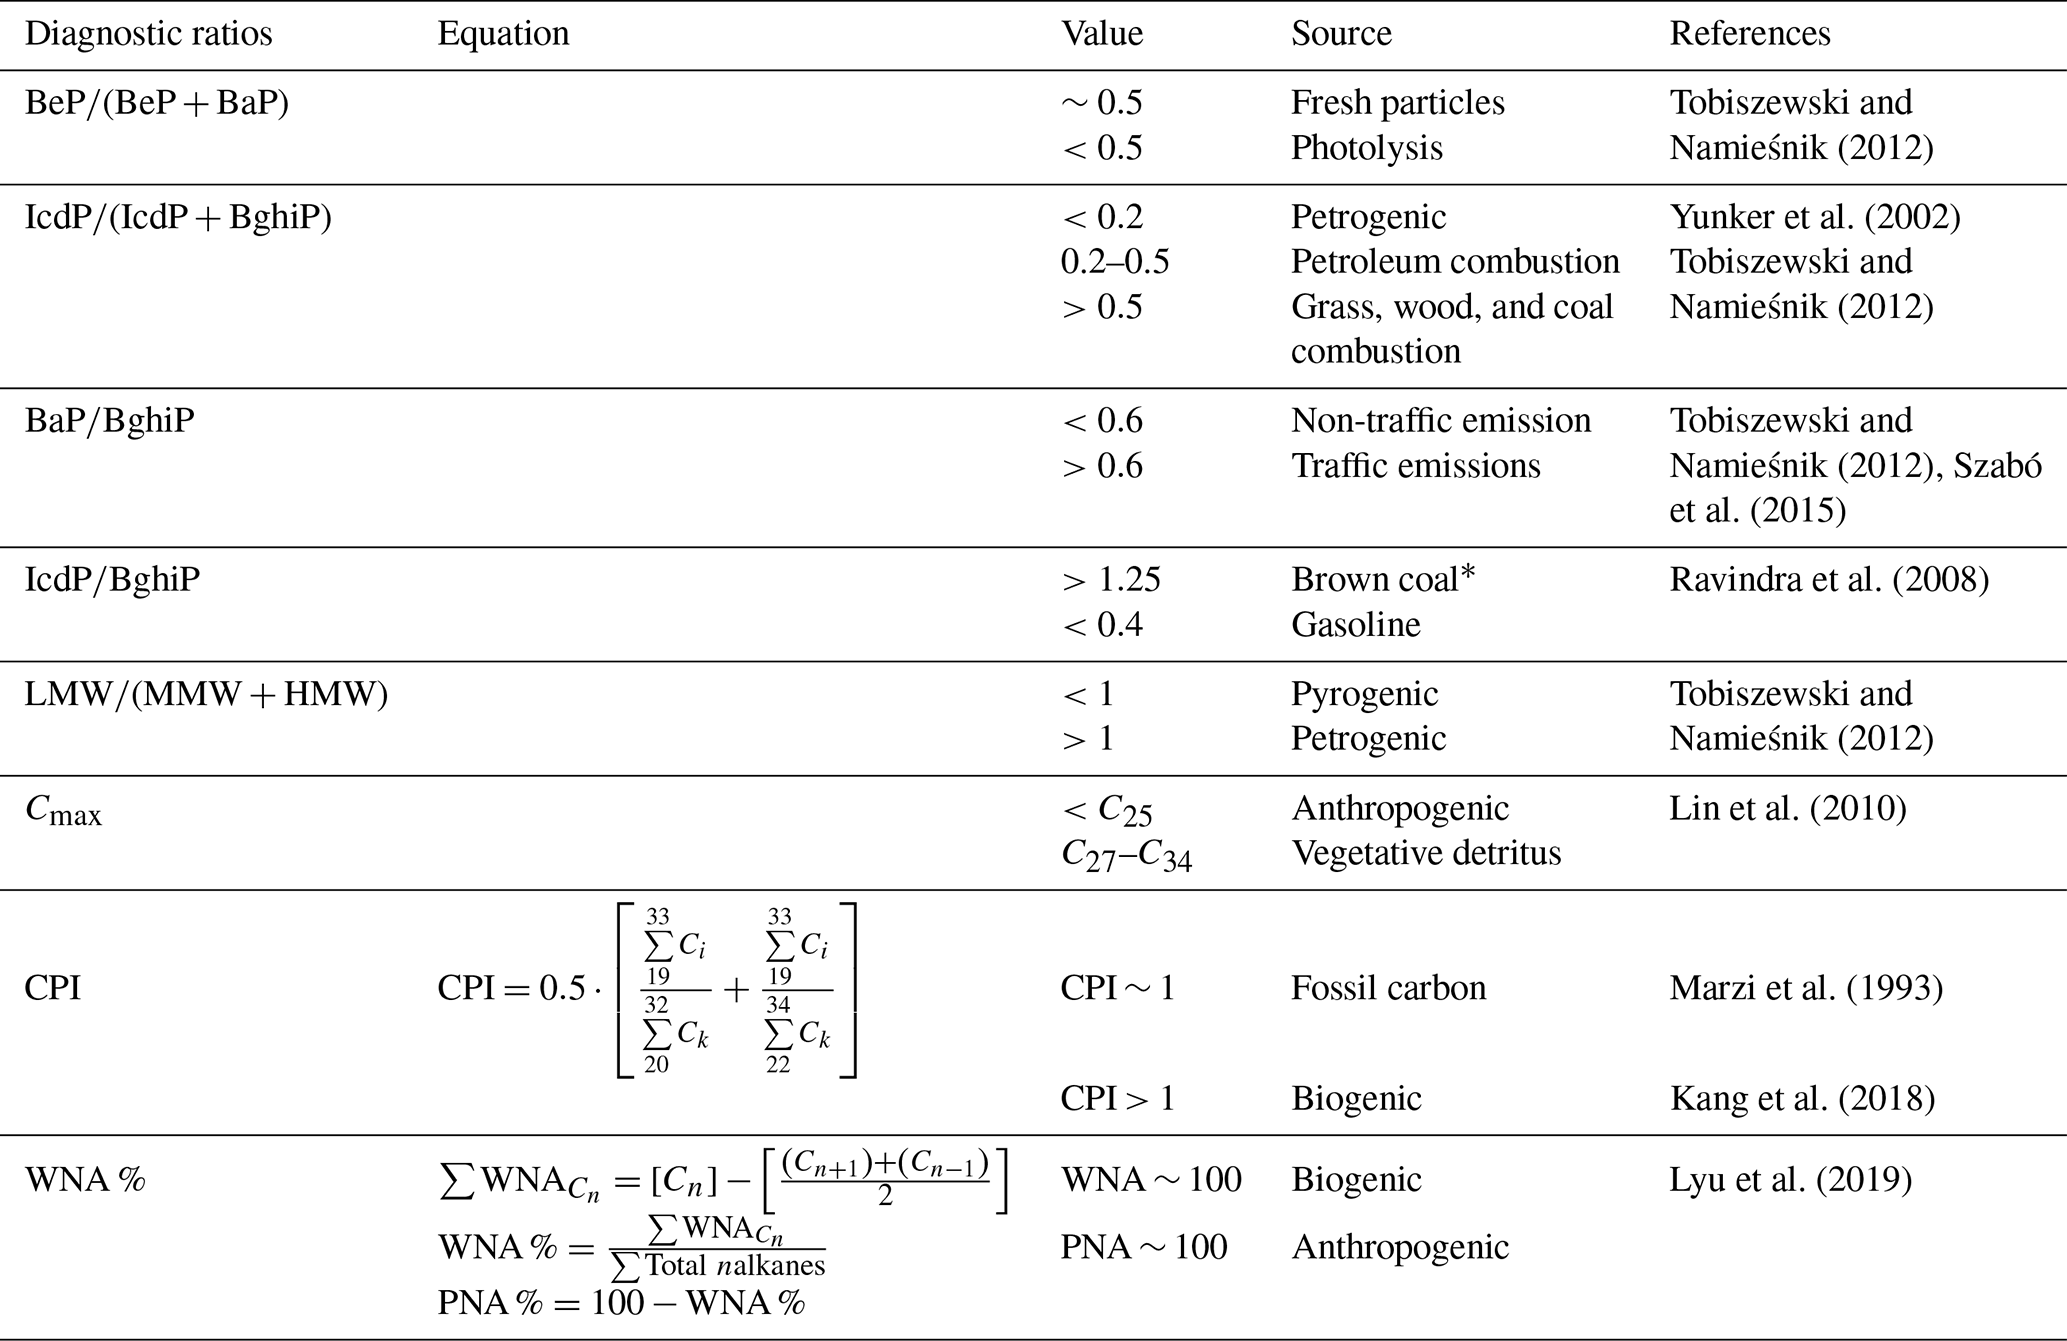
* Used for residential heating and industrial operation.
As all measured variables were subject to analytical uncertainty and temporal variability, linear fitting parameters were obtained from Deming regressions as recommended for atmospheric measurements (Wu and Zhen Yu, 2018). The Spearman coefficient was selected instead of Pearson's as an indicator of the statistical correlation between chemical components to reduce the effect of outliers. Derived ratios and other parameters were considered statistically significant when p values < 0.05. The statistical analysis was conducted using R version 4.0.2, with 24 packages, including corrr (0.4.2), mcr (1.2.1), cluster (2.1.0), tidyverse (1.3.0), ggplot2 (3.3.2), MASS (7.3–53.1), and openair (2.7-4).
3.1 Meteorology
We monitored the local meteorology 1 year prior to the sampling period, first at 14.5 m above the ground, a few meters over the mean canopy level, and then at 32.5 m above the ground during the sampling campaign. The box-and-whisker plot in Fig. 2 shows katabatic tide winds of up to ∼8 m s−1 at the sampling site elevation, peaking at LT (local time). Wind speeds were a factor ∼2–3 slower at ground level. The wind runs at the sampling height were typically above ∼200 km d−1 (Fig. S3), indicating that the samples had a substantially broader spatial coverage of the CRV – much larger than it would have been at ground level. This also implies that the samples were frequently and significantly influenced by emissions coming from Yumbo's industrial hub (northwest of Palmira) and also by Palmira and Yumbo urban and highway emissions, as well as sugarcane PHB and sugarcane mill emissions. The wind rose (Fig. 2a) suggests that the influence of urban emissions from Cali, CRV's largest city by far, was minor. Other meteorological variables are reported in the Supplement (Fig. S2). Temperature (24.2 ∘C on average) and relative humidity (71.6 %) were very likely controlled by solar radiation (350 W m−2 on average). The late-afternoon katabatic tide is fast enough to temporarily reduce temperature. The daily pressure profile (∼763 hPa on average) clearly showed the influence of the katabatic tide, with a ∼3 hPa drop during its arrival in the late afternoon. Overall, we believe that our measurements at the Palmira site are reasonably representative of the regional air quality.
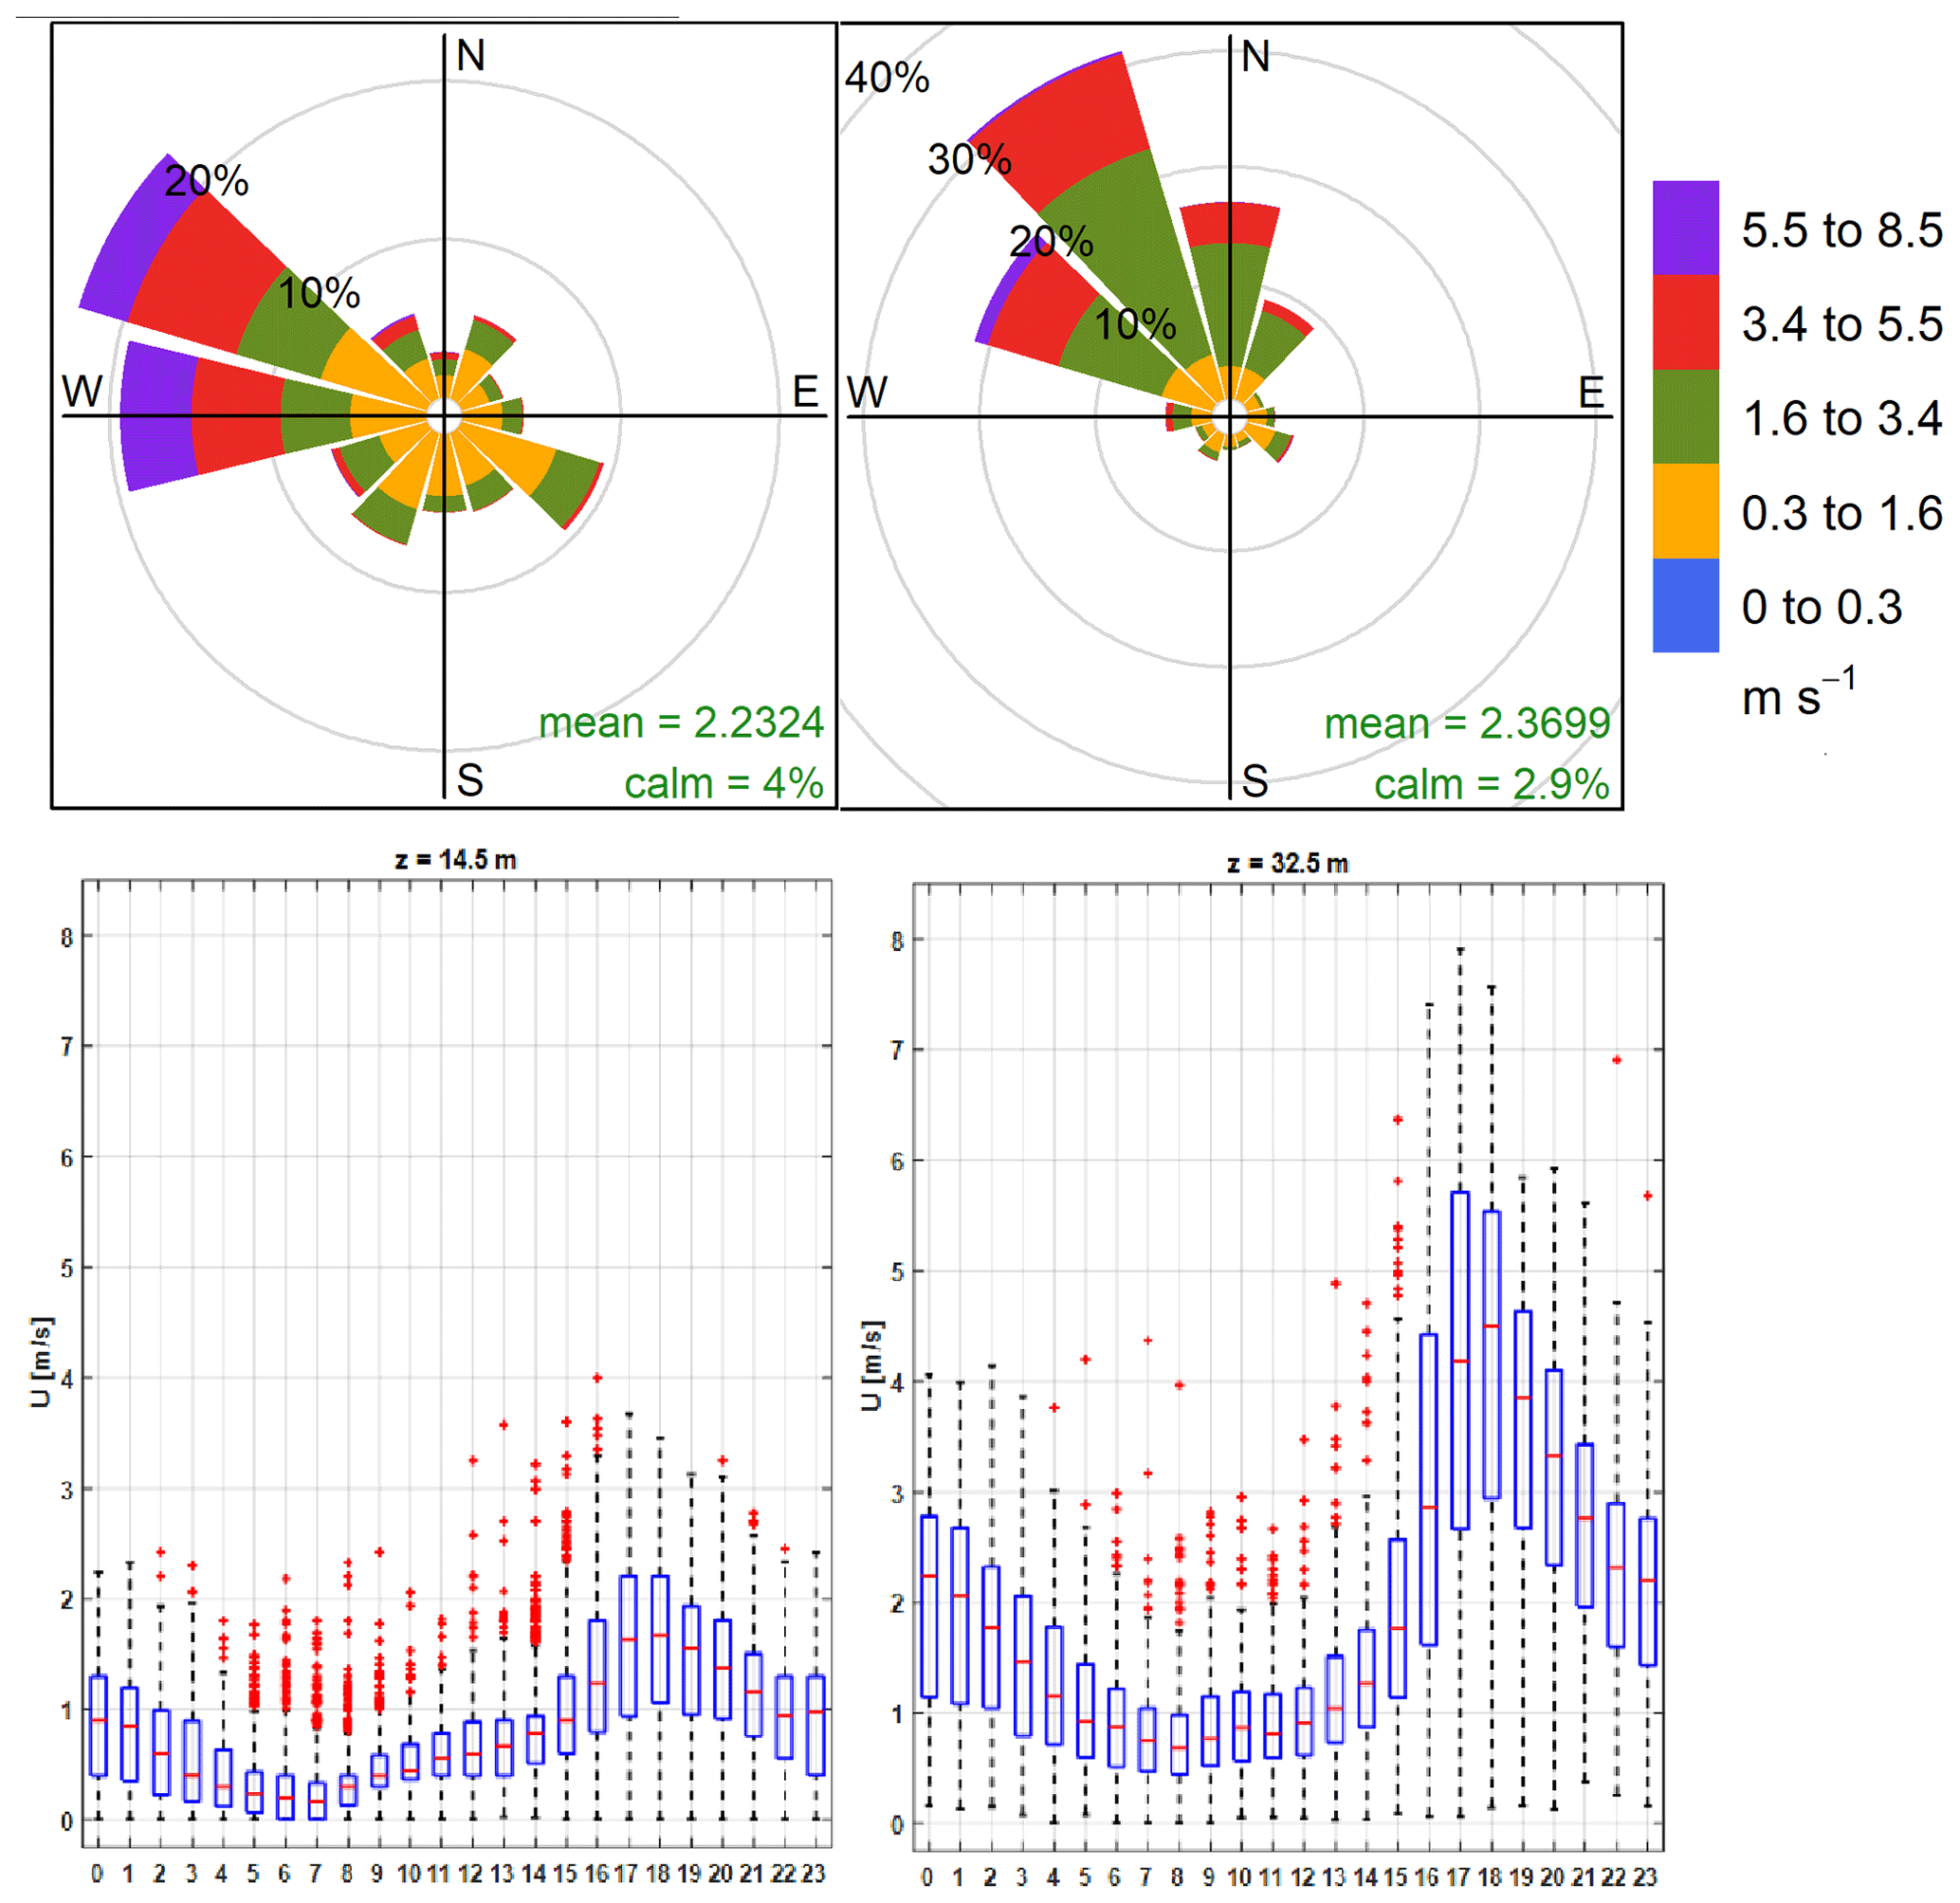
Figure 2Wind pattern in the sampling location. (a) Predominant wind rose during the sampling period (July–September 2018). (b) Hourly profile of wind speed at 14.5 m above the ground (August–December 2017). (c) Hourly profile of wind speed in sampling location at 32.5 m over the ground level (December 2017–September 2018). * Red points corresponding to the upper 10 % of outliers.
3.2 Bulk PM2.5 concentration and composition
The daily PM2.5 concentration measured in this study ranged from 6.73 to 24.45 µg m−3, with a campaign average of 14.38±4.35 µg m−3 (23 h average; ±1σ). Although these concentrations may appear comparatively low, it is worth stressing that samples were collected at more than 30 m height, with hourly wind speeds frequently above 4 m s−1. However, on most days during this study, PM2.5 concentration exceeded the 5 µg m−3 annual mean and 15 µg m−3 24 h mean guidelines by the World Health Organization (WHO, 2021). Nevertheless, the Colombian standards are less demanding; thus the observed concentrations comply with the 37 µg m−3 24 h mean (MADS, 2017).
Previous studies conducted in rural areas of Brazil impacted by open-field sugarcane burning reported significantly higher (mean 22.7 µg m−3; Lara et al., 2005), similar (mean 18 µg m−3; Souza et al., 2014), and significantly lower PM2.5 concentrations (mean 10.88 µg m−3; Franzin et al., 2020). Comparable measurements in Mexico during harvest periods showed much higher concentrations, from 29.14 µg m−3 (Mugica-Álvarez et al., 2015) up to 51.3 µg m−3 (Mugica-Álvarez et al., 2016). Our PM2.5 concentration measurements in the CRV are thus substantially lower than those usually reported in Mexico and Brazil during sugarcane burning periods. Major differences among sugarcane PHB practices in Colombia, Brazil, and Mexico must be considered when comparing concentrations. First, one-third of the sugarcane harvested area is burned before harvest at the CRV. This fraction is much larger in Mexico and Brazil (FAO, 2020). Second, sugarcane is harvested year round in the CRV, as opposed to Brazil and Mexico, where the harvest is limited to a ∼ 6-month period (known in Spanish as zafra or the harvest). Third, the size of the individual plots burned in the CRV is typically ∼6 ha (median burned area; Cardozo-Valencia et al., 2019), compared to much larger plots and total areas in Brazil and Mexico (FAO, 2020).
OC was the most abundant measured PM2.5 component, with a mean daily concentration of 3.97±1.31 µg m−3, whereas the mean EC concentration was only 0.96±0.31 µg m−3. These two components contributed to 29.1±8.3 % and 7.2±2.3 % of the PM2.5 mass, respectively (carbonaceous fractions were thus 4.93±1.58 µg m−3, i.e., 36.31±10.41 % of PM2.5).
The most abundant water-soluble ions found in Palmira's PM2.5 were , , and , with average concentrations of 2.15±1.39 µg m−3, 0.67±0.62 µg m−3, and 0.51±0.30 µg m−3, respectively (12.7±2.8 %, 3.7±1.1 %, and 2.6±1.3 % of the mass concentration, respectively). Other water-soluble ions, such as Na+, Ca+, and , had mean concentrations of around 0.1 µg m−3, while those of K+, , CH3O3S−, Mg2+, and Cl− had concentrations ranging from 10–80 ng m−3 (Table 3).
Table 3Mean, 1 SD (standard deviation), minimum and maximum concentrations of carbonaceous fraction, soluble ions, and metals in samples of PM2.5 collected in Palmira.
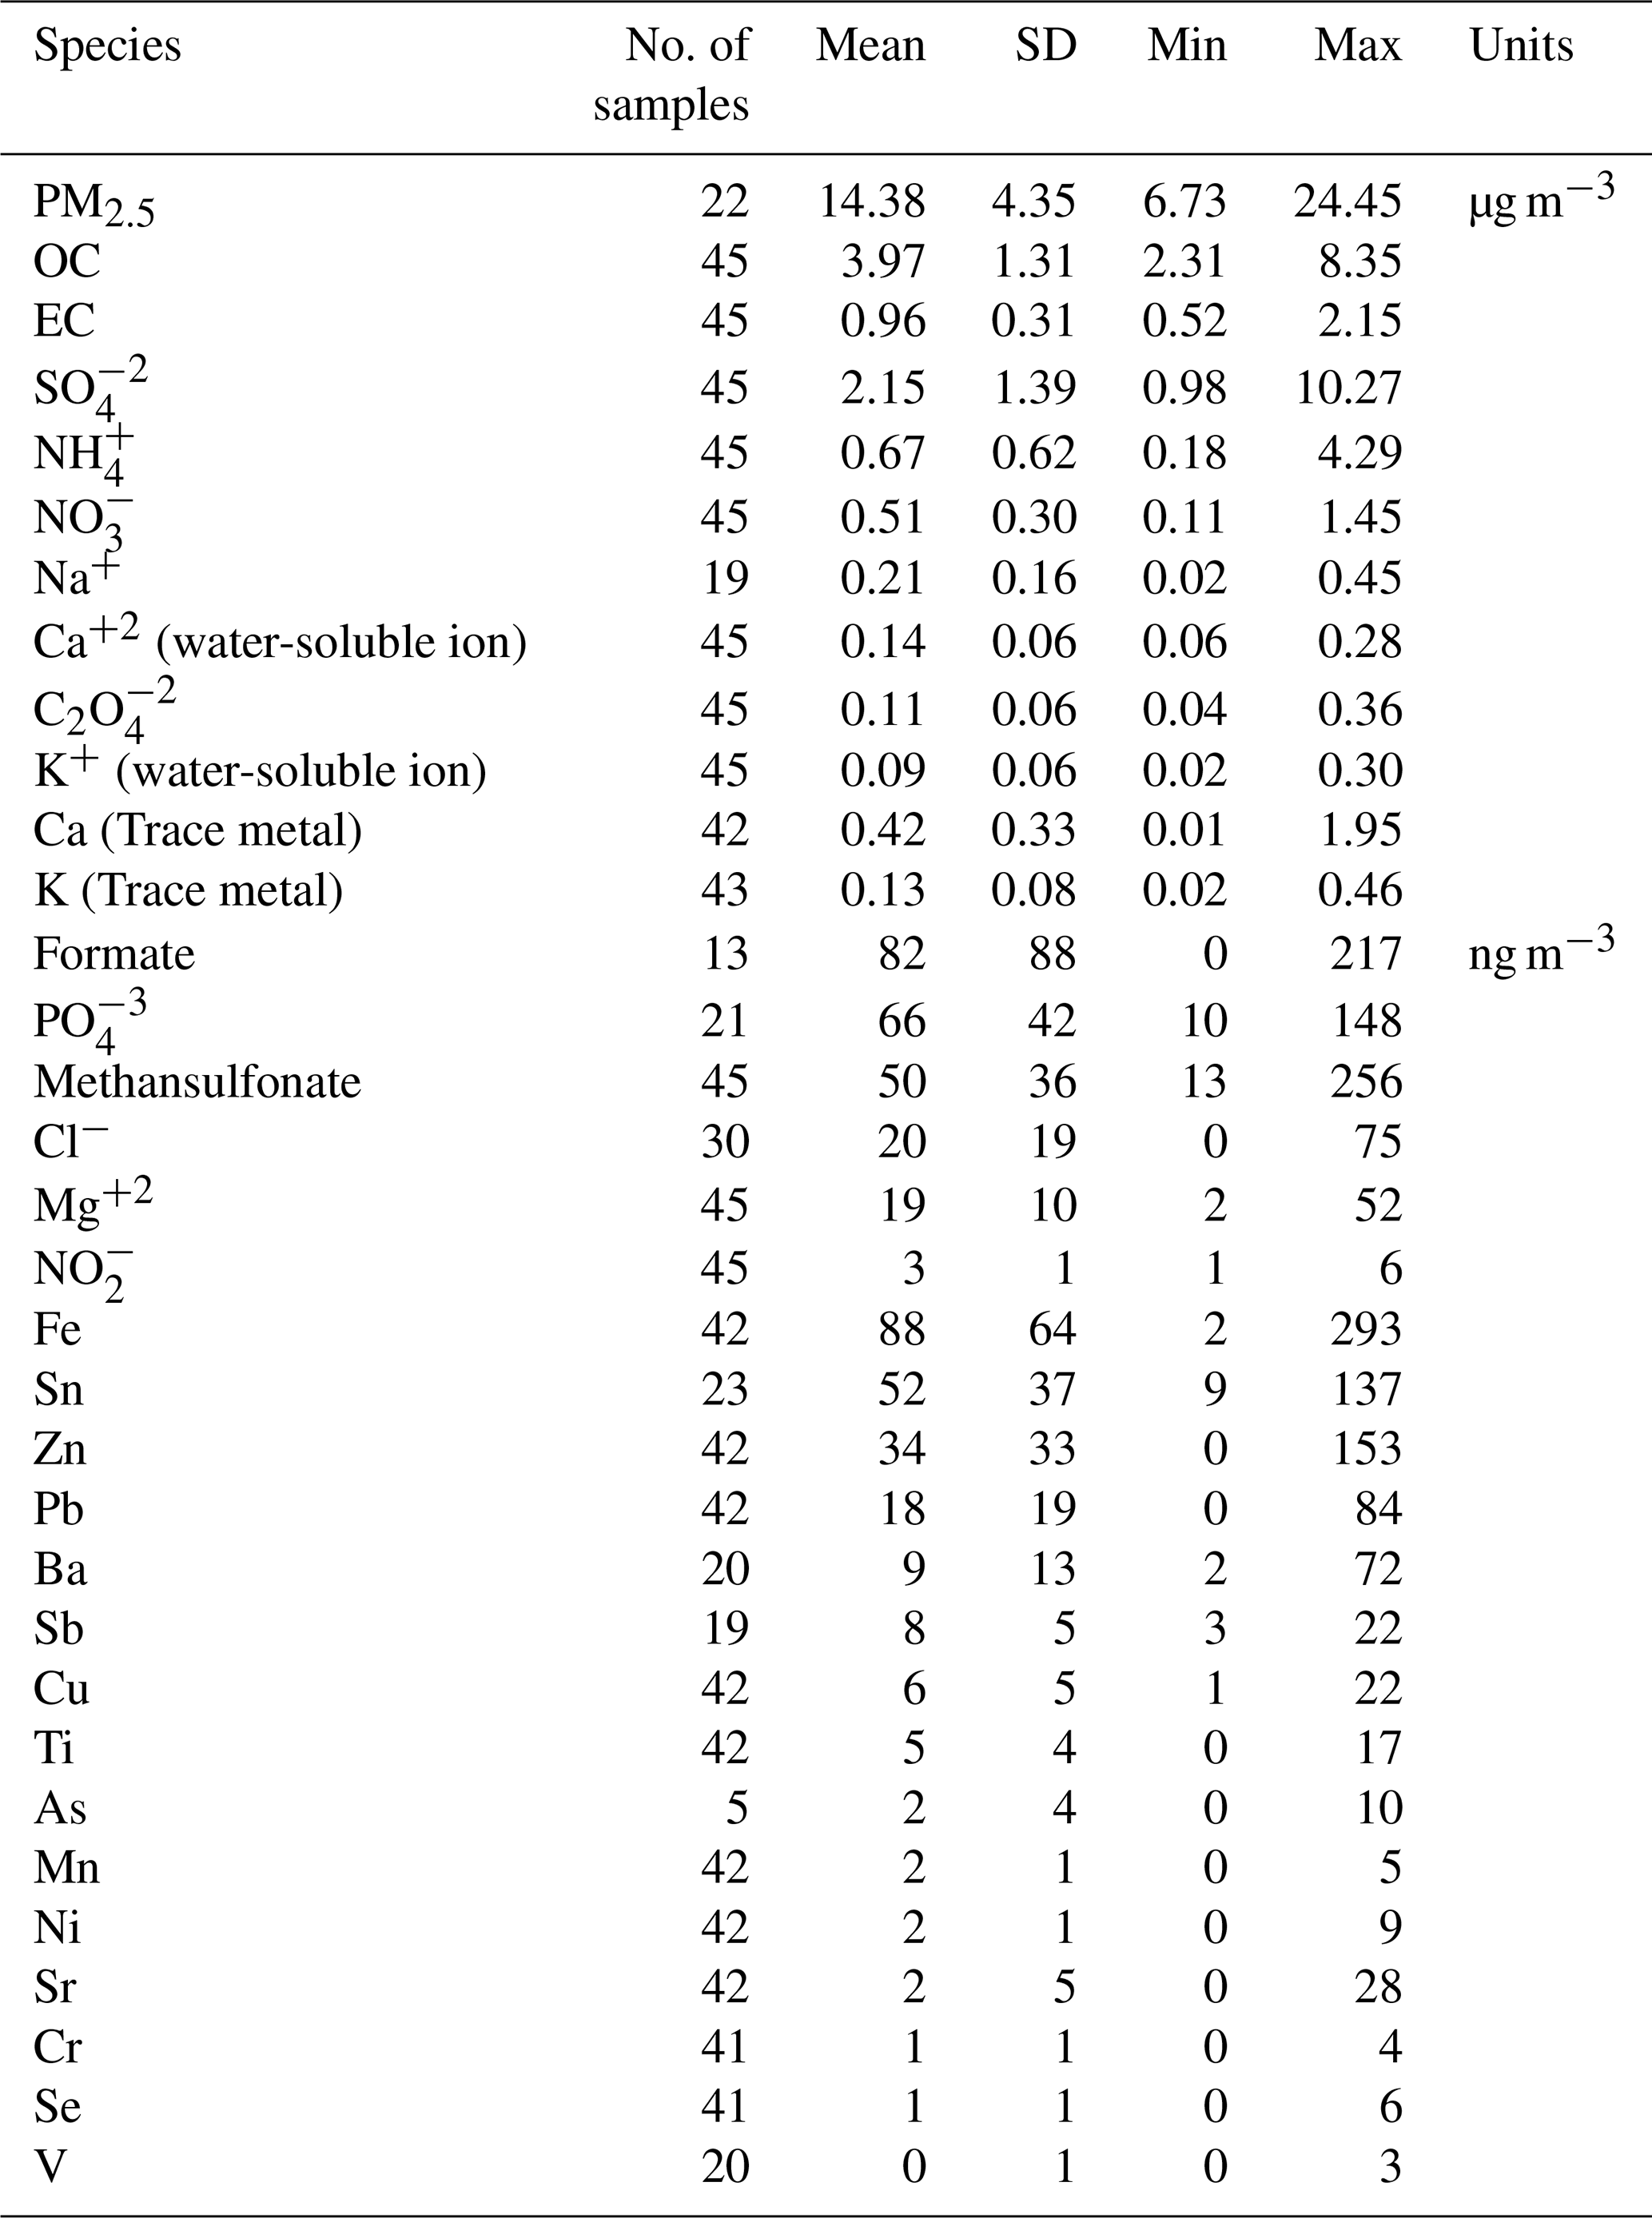
The predominant elements were Ca (0.42±0.33 µg m−3), K (0.13±0.08 µg m−3), and Fe (88±65 ng m−3), followed by Zn (34±33 ng m−3), Pb (18±19 ng m−3), Sn (52±37 ng m−3), Ti (5±4 ng m−3), Ba (9±13 ng m−3), and Sr (2±5 ng m−3). Mn, Ni, Cr, and Se concentrations were all below 2±1 ng m−3. Trace metals such as Ti, Cr, Mn, K, Ca, Fe, Ni, Cu, Zn, Sr, Pb, and Se were found in all PM2.5 samples, while V was found only in a few samples. Other trace metals such as As and Sb were detected only at a reduced number of samples with concentrations below 20 ng m−3. Table 3 shows the mean, standard deviation, minimum, and maximum concentration of the carbonaceous fraction, soluble ions, and metals found in the PM2.5 samples collected in the CRV.
3.3 Ions
and were the most abundant anion and cation in the PM2.5 samples. The molar ratio [] was 1.6±0.3 (min 0.8 and max 2.3), suggesting that PM2.5 is acidic. The pH of PM2.5 samples was calculated using the E-AIM IV thermodynamic model, which estimates the activity coefficient of these species in aqueous phase equilibrium using the H+––Na+–––Cl−–H2O system, resulting in a pH of 2.5±0.4. The correlation between the [] ratio and the pH was strong (r2=0.96; Fig. S3), suggesting that the molar concentrations of these ions significantly explained the particle acidity. Other studies have reported similar [] values for pH values lower than the estimated for the CRV. For instance, Xue et al. (2011) report molar ratios in ranging from 1.32 to 1.71 and pH values between −0.45 and 0.59. Pye et al. (2020) showed that fine particles have a bimodal distribution of pH, with one mode around a pH of 1–3, and another mode around a pH of 4–5, with the latter influenced by dust, sea spray, and potentially biomass burning. In this study, only one PM2.5 sample exceed a pH value of 4. Overall, this is an indicator of the abundance of sulfate and organic compounds in samples collected in the CRV.
pH affects the partitioning of total nitrate ( + HNO3) and total ammonium ( + NH3) between the gas and particulate phases. Lower pH values favor the partitioning of total nitrate toward the gaseous phase (HNO3) rather than the particulate phase (). In contrast, the partitioning of total ammonium is favored toward the particulate phase, remaining as NH in the aerosol, whereas is a nonvolatile species that remained in the particulate phase. Acidity conditions in the samples collected in this study are consistent with the concentrations of , , and , corresponding to 2.5 µg m−3, 0.7 µg m−3, and 0.5 µg m−3, respectively. Ammoniated sulfate and ammonium nitrate are generally considered the predominant forms of nitrate and sulfate in the inorganic fraction in fine particles. In ammonium-limited conditions, ammonia reacts preferentially with H2SO4 to form ammonium sulfate ([NH4]2SO4), letovicite ([NH4]3H[SO4]2), or ammonium bisulfate ([NH4HSO4]; Lee et al., 2008). Although the correlation coefficient between and concentrations was high (R2=0.98), the amount of ammonium contained in the samples was not high enough to neutralize sulfate completely and form [NH4]2SO4. In ammonium-limited atmospheres, it is expected that not completely neutralized sulfate salts form, such as [NH4]3H[SO4]2 and [NH4HSO4] (Ianniello et al., 2011). Thus, based on the limited ammonium concentrations found in the PM2.5 of CRV, and taking into consideration stoichiometric molar ratios [] of 3:2 for letovicite and 1:1 for ammonium bisulfate and the results of the E-AIM model, it is reasonable to assume that a mixture of sulfate salts is present in the PM2.5 of CRV, such as ammonium bisulfate, letovicite, and ammonium sulfate, which form progressively, depending on the ammonia availability. The E-AIM model indicates the saturation ratio for each solid species, which usually forms before ammonium bisulfate than letovicite and ammonium sulfate. For a molar ratio of 1.5, the aerosol phase consists almost exclusively of letovicite, while, to form ammonium sulfate, the ratio should be over 2.0 (Seinfeld and Pandis, 1998). As result of the [] ratios observed in the samples collected in the CRV and the pH estimated from the E-AIM IV model, there is no reason to assume that nitrate is present as ammonium nitrate in the PM2.5 in the CRV.
Instead of this, might be bound to cations contained in sea salt and dust particles to form relative nonvolatile salts, such as KNO3, NaNO3, and Ca(NO3)2. showed some correlation with Na+, Ca2+, and K+ (r2=0.6, 0.2, and 0.2, respectively), indicating the possible formation of these salts. The correlation between Na+ and could be explained by the impact of sea salt aerosol that comes from air mass origin in the Pacific Ocean. However, the amount of Na+ is not enough to neutralize the total of , while Ca2+ showed to be sufficient to neutralize . The molar ratio observed in PM2.5 samples of CRV for [] was 2.6±1.4, [] was 1.7±1.3, and [] was 5.0±3.2, overcoming the stoichiometric molar ratio required to form Ca(NO3)2, NaNO3, and KNO3.
The abundance of in the PM2.5 in the CRV can be attributed to the oxidation of SO2 and SO3 emitted by coal-fired boilers and other combustion equipment (Wang et al., 2016), biomass burning activities, including PHB and bagasse combustion, and the emission of H2S associated with poultry and pork production (Casey et al., 2006). H2S emissions from poultry and pork production were estimated using mean emission factors calculated on a live animal unit (AU) basis, where 1 AU corresponds to 500 kg of body mass. H2S emissions from swine and poultry housing are usually lower than 5 g H2S AU−1 d−1 (Casey et al., 2006). With this emission factor, we estimate these emissions at 3.5 mg H2S d−1 due to poultry and 5 mg H2S d−1 associated with pork production. Ammonia emissions factors by poultry and livestock vary from 0.09 to 12.9 g NH3 AU−1 d−1, which led to emissions of 9.05 mg NH3 d−1 from poultry and 12 t d−1 due to pork production.
PM2.5 consistently contained methansulfonate, with an average concentration of 50±13 ng m−3. This ion is produced by the aqueous oxidation of dimethyl sulfide (DMS), one of the most prevalent biogenic sulfur compounds in the troposphere. DMS oxidation is a major source of non-sea-salt sulfate aerosols in marine areas (Tang et al., 2019) but can also originate from continental origins, such as biomass burning (Gondwe, 2004; Meinardi et al., 2003; Sorooshian et al., 2015; Stahl et al., 2020). Methanesulfonate was mainly correlated to the ions sulfate and ammonia (r2=0.88) and (r2=0.66), the metals Se (r2=0.74) and Fe (r2=0.41), and the carbonaceous fraction EC (r2=0.56) and OC (r2=0.49) in this study. Knowing the origin of this ion in the PM2.5 in the CRV, which is not directly in the coastal area, prompts future studies with a higher time resolution (6–12 h) to establish the connection with changes in the wind pattern and the impact of the katabatic circulation, especially because biomass burning, mainly from sugarcane PHB, is a year-round activity in the CRV.
The measured average ratio of . This ratio is higher than the one obtained by Souza et al. (2014) at Piracicaba (3.6±1.0) and São Paulo (1.8±1.0), Brazil. The strong correlations between and (r2=0.84), and methanesulfonate (CH3O3S−; r2=0.88), and and oxalate dianion (; r2=0.71) allow us to infer that inorganic secondary aerosol formation is a significant PM2.5 source in the CRV. In addition, the presence of potassium cation (K+) in submicron particles is recognized as a biomass burning tracer (Andreae, 1983; Ryu et al., 2004). K+ showed a moderate correlation with nitrite anion (; r2=0.44) and (r2=0.43) in the CRV, which suggests that biomass burning influences secondary aerosol formation. Mg2+ and Ca2+ ions, usually considered crustal metals, exhibited a moderate correlation of r2=0.59 (Li et al., 2013). Also, Mg2+ and moderate correlation (r2=0.26) points to a link between crustal species and secondary aerosols. Such an association could be plausibly explained by soil erosion induced by pyroconvection during sugarcane pre-harvest burning (Wagner et al., 2018). Our study's full species correlation matrix is shown in Fig. S4.
3.4 Metals
The measured total PM2.5 trace metal concentration was 706±462 ng m−3 (101.3 to 2638 ng m−3). Trace metals can originate from non-exhaust and exhaust emissions. Non-exhaust emissions come from brake and tire wear, road surface abrasion, wear/corrosion of other vehicle components, and the resuspension of road surface dust (Pant and Harrison, 2013). Metals in exhaust emissions are related to fuel, lubricant combustion, catalytic converters, and engine corrosion. As shown by Kundu and Stone (2014), many of these sources share some metals in their chemical composition profile; thus, an unambiguous specific source attribution is non-trivial. In this study, we found a significant correlation among Fe, Mn, and Ti (r2≈0.72), which is typically associated with a high abundance of crustal material (Fomba et al., 2018), indicating that soil dust is a significant source in the CRV. Also, tire and brake wear tracer metals, including Zn and Cu, showed weaker but still significant correlations among them (r2≈0.32). Ca concentrations were quite high (405±334 ng m−3; 1.6 to 1952 ng m−3). These levels can be attributed to dust generation by agricultural practices, particularly land planning, liming and tilling, PHB pyroconvection-induced soil erosion, and traffic-induced soil resuspension on unpaved rural roads. One of the very few previous investigations into on PM composition in the CRV (Criollo and Daza, 2011) analyzed trace metals in PM10 at four CRV locations, including the same area where our study was conducted. They found significant enrichment of Fe and K metals at locations exposed to PHB. It must be kept in mind that PM10 samples included coarse mode aerosols, of which dust might have been a significant fraction. Also, environmental regulations have been successful in steadily reducing the sugarcane burned area in the CRV since 2009. The burned area dropped from 72 % in 2011 to 35.46 % in 2018, which is our year of measurements (Cardozo-Valencia et al., 2019).
Cd, Pb, Ni, Hg, and As, and other metals and metalloids are considered carcinogenic (WHO Regional Office for Europe, 2020). Measured concentrations of Pb and Ni in PM2.5 at the CRV were 18 ng m−3 (±19) and 2 ng m−3 (±1), respectively. These mean values were below the EU target values (of 0.5 µg m−3 and 20 ng m−3 respectively; World Health Organization, 2013) and below the annual average limit of the Colombian national ambient air quality standard (0.5 µg m−3 and 0.1 µg m−3 respectively; MADS, 2017). Nevertheless, these concentrations are significantly higher than those reported for other suburban areas in the midwestern United States and remote sites in the northern tropical Atlantic (Fomba et al., 2018; Kundu and Stone, 2014). Pb concentrations are similar to those reported for Bogotá and other large urban areas (SDA, 2010; Vasconcellos et al., 2007). Pb has long been banned as a fuel additive in Colombia; thus, the observed levels might be associated with metallurgical industry and waste incineration. Information on ambient air hazardous metal concentrations in Latin America's urban and rural areas is still scarce.
3.5 Carbohydrates
Levoglucosan is a highly specific biomass burning organic tracer (Bhattarai et al., 2019). Along with K+, OC, and EC, it can be used to effectively identify the relevance of biomass burning as an aerosol source. The relative contribution of levoglucosan to the PM carbohydrate burden, and especially the levoglucosan to mannosan ratio, can be used as indicators of the type of biomass burned (Engling et al., 2009). In this study, the following carbohydrates were quantified: levoglucosan, mannosan, glucose, galactosan, fructose, and arabitol. Levoglucosan was by far the most abundant (113.8±147.2 ng m−3), reaching values of up to 904.3 ng m−3, followed by glucose (10.4±6.1 ng m−3), mannosan (7±6.1 ng m−3), and arabitol (4.1±3.5 ng m−3). Levoglucosan and mannosan were detected in all PM2.5 samples, while galactosan and fructose were detected only in 9 and 11 samples, respectively. Levoglucosan was 3.5±2.3 % of OC and 0.96 % ± 0.81 % of PM2.5.
The levoglucosan concentration found in this study was quite similar to that reported in areas of Brazil where sugarcane production and processing are important economic activities (Fig. 3). For instance, during the harvest (zafra) period in Araraquara, the levoglucosan mean concentration was 138±91 ng m−3, although during the non-harvest period it was unexpectedly high (73±37 ng m−3; Urban et al., 2014). Likewise, the levoglucosan average concentration at Piracicaba during a reduced fire period was 66 ng m−3 (Souza et al., 2014). The measured mean levoglucosan mannosan ratio in the CRV was 17.6±13.0 (min 8.1–max 58.1). Chemical profile studies found a levoglucosan mannosan ratio of ∼10 for sugarcane leaves burned in stoves (Hall et al., 2012; Dos Santos et al., 2002) and of ∼54 for burned bagasse (Dos Santos et al., 2002). Leaves constitute the largest fraction (20.8 %; Victoria et al., 2002) of pre-harvest burned sugarcane. Consistently and expectably, the levoglucosan mannosan ratio in this study was much closer to the chemical profile ratio of leaves than that of bagasse. Moreover, ambient air samples in Araraquara and Piracicaba showed levoglucosan mannosan ratios of 9±5 and ∼33, respectively. For comparison, the levoglucosan mannosan ratios in PM from rice straw and other crops burned were ∼26.6 and ∼23.8, respectively (Engling et al., 2009). This indicates that the levoglucosan mannosan ratio is sensitive to the type of biomass burned but also to burning conditions. The large levoglucosan mannosan ratio in our study suggests that in the CRV was impacted by sugarcane PHB most of the time, and, to a lesser extent, by bagasse combustion in sugar mills. We hypothesize that, even if these were very small, levoglucosan and mannosan combustion emissions might not be negligible as the CRV sugarcane biomass yields are very high and most of the harvested sugarcane bagasse is combusted for electric power and steam production.

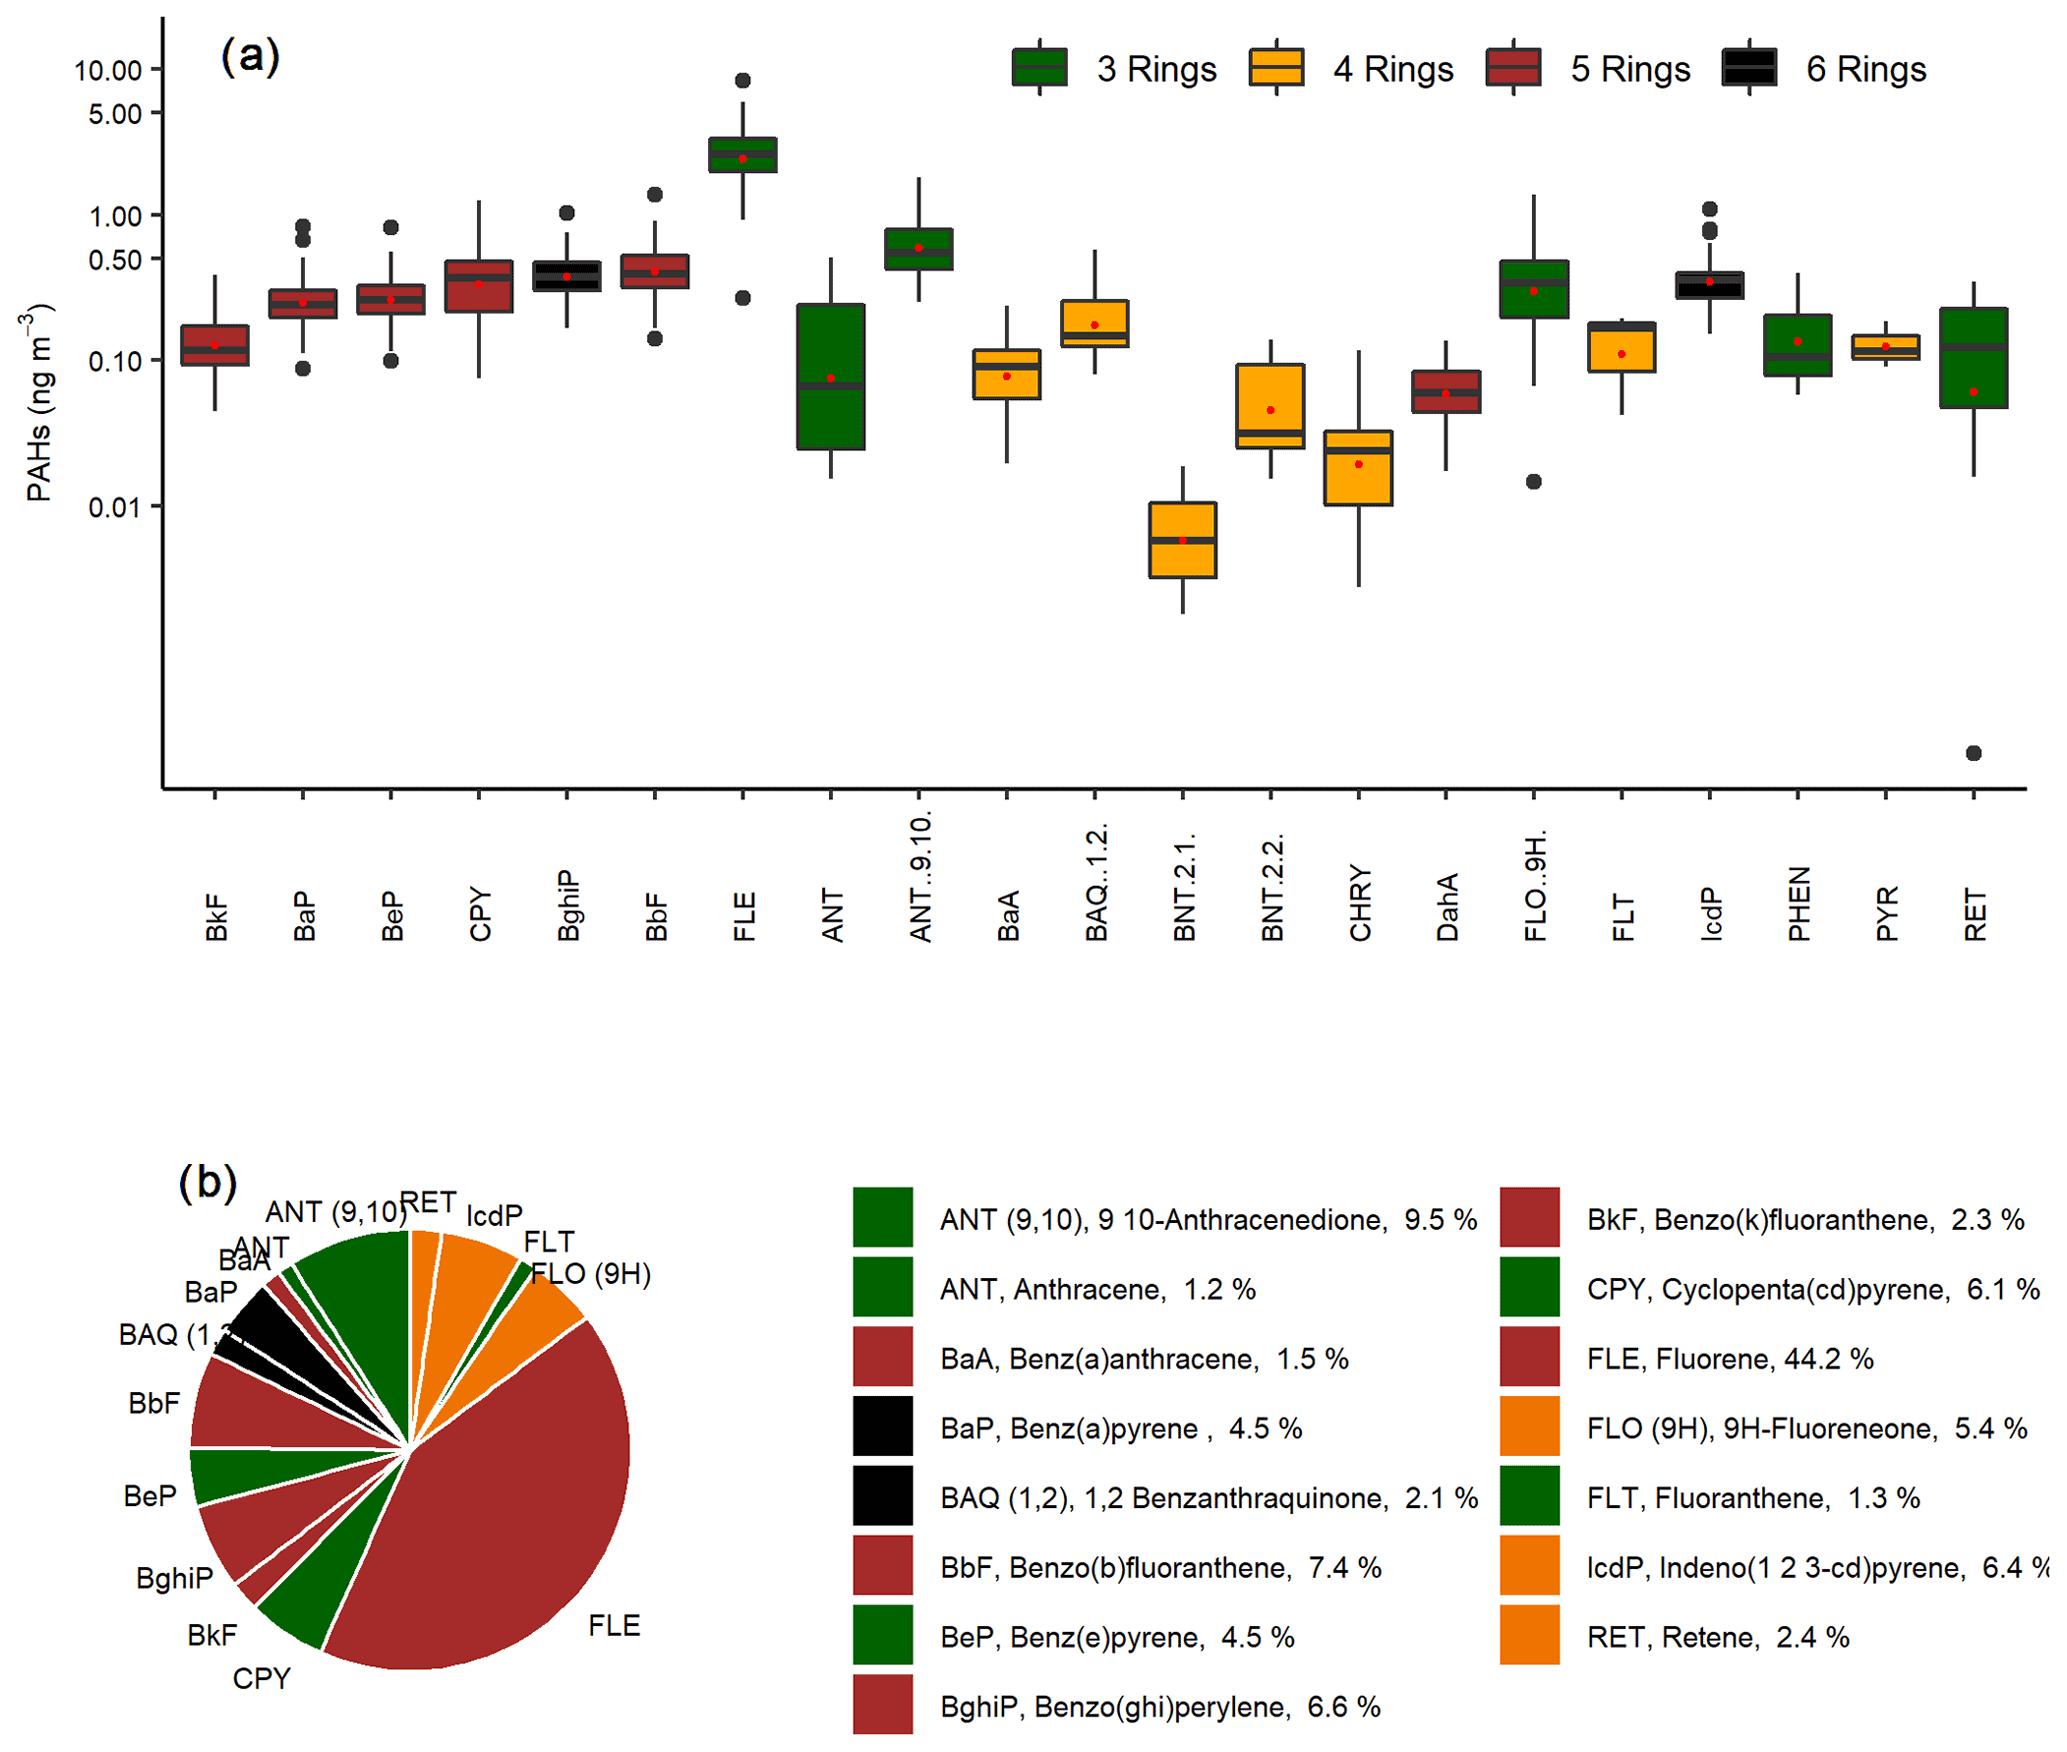
Figure 4The abundance of PAHs measured in PM2.5 samples collected in the CRV, represented by colors according to the number of rings of each PAH, indicated in green (three rings), yellow (four rings), brown (five rings), and black (six rings). (a) Box plot of concentrations in nanogram per cubic meter (ng m−3), and the red dots represent the mean concentrations of each PAH. (b) Pie chart of the relative abundance of PAHs in PM2.5 samples.
3.6 Polycyclic aromatic hydrocarbons (PAHs)
A total of 22 PAHs were measured in each sample collected at Palmira, including the 16 PAHs listed as human health priority pollutants by WHO and the U.S. Environmental Protection Agency (EPA; Yan et al., 2004). The total PAHs concentration was 5.6±2.9 ng m−3 (min 2.3 ng m−3–max 15.8 ng m−3). Figure 4a shows the PAH concentration variability during the sampling campaign (mean and standard deviation are available in Table S2). The most abundant PAHs were FLE (44.2 % ± 11.9 % total concentration share), ANT (9,10; 10.0 % ± 4.5 %), BbF (7.4 % ± 2.3 %), BghiP (6.7 % ± 2.4 %), IcdP (6.4 % ± 1.9 %), CPY (6.0 % ± 2.3 %), FLO (9H; 5.4 % ± 3.1 %), BeP (4.6 % ± 1.3 %), and BaP (4.4 % ± 1.6 %), which accounted for 95.1 % of the total PAH concentration (Fig. 4b). The three-ring PAHs were the most abundant (59.04 % of total PAH). Put together, the five- and six-ring PAHs accounted for an additional 38.44 %. The less abundant PAH group was the four-ring (2.52 %). A previous study in the CRV, carried out on PM10 samples by Romero et al. (2013), showed higher FLT, PYR, and PHEN concentrations in areas highly exposed to sugarcane PHB compared to other locations. In contrast, PM2.5 FLE concentrations in this research were significantly higher than those in PM10 by Romero et al. (2013), while PYR and PHE levels were similar.
The carcinogenic species BaP, BbF, BkF, BaA, BghiP, FLE, CPY, and BeP were identified in all the PM2.5 samples. BaP is a reference for PAH carcinogenicity (World Health Organization, 2013) that is used as a PAH exposure metric, known as the benzo(a)pyrene-equivalent carcinogenic potency (BaPE). We calculated BaPE using the toxic equivalent factors (TEFs) proposed by Nisbet and LaGoy (1992) and Malcolm and Dobson (1994). PAH concentrations were multiplied by TEFs and then added to estimate the carcinogenic potential of PM2.5-bounded PAHs. The mean carcinogenicity level at Palmira, expressed as BaP-TEQ, was 0.4±0.2 ng m−3 (min 0.1 ng m−3–max 1.4 ng m−3). Only one sample exceeded the Colombian annual limit of 1 ng m−3, but most of them exceeded the WHO reference level of 0.12 ng m−3. The mutagenic potential of PAHs (BaP-MEQ) was estimated using the mutagenic equivalent factors (MEFs) reported by Durant et al. (1996). The average BaP-MEQ was 0.5±0.3 ng m−3 (min 0.2 ng m−3–max 1.8 ng m−3). These levels are comparable to those measured in PM2.5 by Mugica-Álvarez et al. (2016) in Veracruz (Mexico) but during the sugarcane non-harvest period. PM10 BaP-MEQ levels in Araraquara (Brazil; de Andrade et al., 2010; De Assuncao et al., 2014) were twice as high as those found in this study. This suggests that year-long sugarcane PHB in the CRV leads to lower mutagenic potential compared to those at locations where the harvesting period (zafra) is shorter and, thus, with higher burning rates. We estimated the average BaP-TEQ and BaP-MEQ concentrations in the CRV according to their exposure to sugarcane burning products, from Romero et al. (2013) data, and used them as a benchmark to our measurements. PM10-bound BaP-TEQ and BaP-MEQ levels for areas not directly exposed to sugarcane burning were 0.16 and 0.21 ng m−3, respectively. Toxicity and mutagenicity due to PM10-bound PAHs were 4 times as high as those at areas directly exposed to sugarcane burning. It is reasonable to assume that PAHs are largely bound to fine aerosol (<2.5 µm) and, thus, that our measurements are comparable to Romero et al. (2013). If so, our site of observation would be at an intermediate exposure condition, which is higher than areas not directly exposed to sugarcane burning but lower than directly exposed areas.
Ratios among different PAHs have been extensively used to distinguish between traffic and other PAH sources. We used the diagnostic ratios presented by Ravindra et al. (2008) and Tobiszewski and Namieśnik (2012) to better understand the contribution of sources to PM2.5 in the CRV. The ratio benzo(e)pyrene to the sum of benzo(e)pyrene and benzo(a)pyrene is used as an indicator of aerosol aging. Local or fresh aerosols have ratios around 0.5, while aged aerosols can have ratios as low as zero as a result of photochemical decomposition and oxidation. The ratio at Palmira was 0.51±0.04, with a majority (84.4 %, n=38) of fresh samples a minor fraction (15.6 %, n=7) of photochemically degraded samples.
Other two diagnostic ratios were used to assess the prevalence of traffic as a PM2.5 source. The first ratio used IcdP BghiP, which are two automobile emission markers (Miguel and Pereira, 1989). Values higher than 0.5 for the ratio indicates aged particles (Tobiszewski and Namieśnik, 2012) generated by coal, grass, or wood burning (Yunker et al., 2002). The second ratio is . Ratios higher than 0.6 are indicative of traffic emissions (Tobiszewski and Namieśnik, 2012). At Palmira, the and ratios were 0.48±0.04 and 0.69±0.13, which indicates that ∼63,% of the samples originated from combustion of oil products (n=30) and ∼36 % came from non-traffic sources, like wood, grass, or coal (n=15).
Also, the structure and size of PAHs are indicative of their sources. PAHs of low molecular weight (LMW; two or three aromatic rings) have been reported as being tracers of wood, grass, and fuel oil combustion, while those of medium molecular weight (MMW; four rings) and high molecular height (HMW; five and six rings) are associated with coal combustion and vehicular emissions. The ratio between LMW and the sum of MMW and HMW, ), is used for source identification. Ratios lower than 1 are indicative of oil products combustion, while ratios larger than 1 are associated with coal and biomass combustion (Tobiszewski and Namieśnik, 2012). The ratio at Palmira, , was rather variable but suggests that a large fraction of PAHs in the CRV (82.2 % of samples) were generated by biomass burning or combustion and coal combustion in brick kilns. Just one in five samples (17.8 %) had PAHs attributable to oil product combustion.
Sugarcane-burning-emitted PAH are mainly LMW, especially of two (∼66 % of PAHs) and three rings (∼27 %), among which FLE, PHE, and ANT are the most emitted, according to the Hall et al. (2012) chemical profile. The relative abundance of three-ring PAHs (Fig. 4) in PM2.5 in the CRV is likely due to open-field sugarcane PHB, to a major extent, and to controlled bagasse combustion for electric power and steam production, to a lesser extent.
The highest PAH concentrations were observed on 10 August and 11 September 2018, with levels of 15.8 and 14.4 ng m−3, respectively (Fig. S5). Elevated concentrations of five- and six-ring PAHs were observed on 10 August 2018. A change in the wind circulation pattern was observed on the previous day (Fig. S2), with a wind speed reduction and a predominance of winds from the north. Later, on 11 September 2018, we observed an increase in three-ring PAHs and winds from the NW at the average wind speed at the sampling location. This indicates that there were at least two types of sources. The abundance of HMW PAHs indicates fossil fuel combustion sources, and LMW PAHs suggest that parts of these come from non-fossil-fuel combustion sources.
3.7 Alkanes
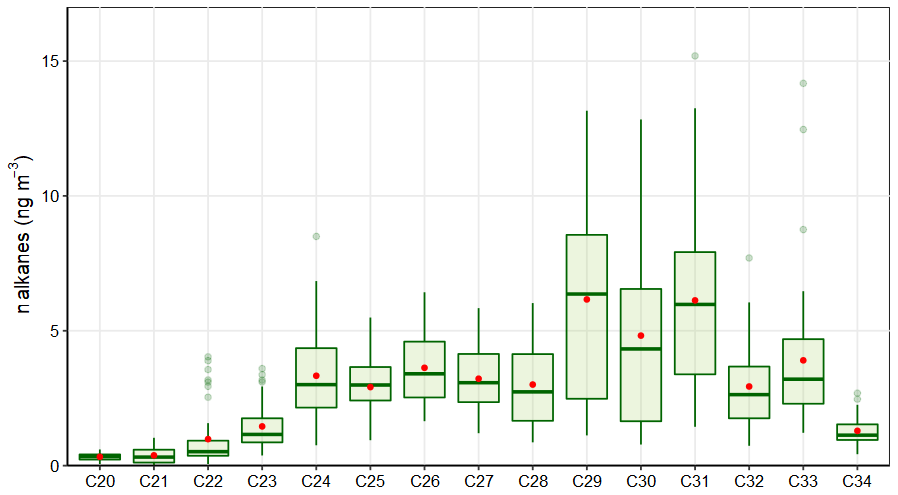
A total of 16 alkanes, ranging from C20 up to C34, were analyzed in this study and used to identify the presence of fossil fuel combustion and plant fragments in the PM2.5 samples. The abundance of total n alkanes during the whole sampling period was in the range of 13.0 to 88.45 ng m−3, with an average concentration of 40.36±18.82 ng m−3. In general, the high molecular weight n alkanes, such as C29–C31, were the most abundant. These are characteristic of vegetative detritus corresponding to plant fragments in airborne PM (Lin et al., 2010). The most abundant n alkanes were C29, C30, and C31 (Fig. 5). Likewise, the carbon number maximum concentration (Cmax) was C29 in 43 % of samples and C31 in 28 % of them. This result is consistent with the chemical profile of sugarcane burning reported by Oros et al. (2006), with a Cmax of C31.
The carbon preference index (CPI) and wax n alkanes percentage (WNA %) are parameters used to elucidate the origin of the n alkanes and infer whether emissions come from biogenic or anthropogenic sources. The CPI represents the ratio between odd and even carbon number n alkanes. The equation used to calculate CPI in the present study is shown in Table 2, following the procedure reported by Marzi et al. (1993). Values of CPI ≤ 1 (or close to 1) indicate that n alkanes are emitted from anthropogenic sources, while values higher than 1 indicate the influence of vegetative detritus and biomass burning in the PM2.5 samples (Mancilla et al., 2016). In this study, the mean CPI was always greater than 1, with an average value of 1.22±0.18 (min 1.02–max 1.8) that is between the CPI for fossil fuel emissions of ∼1.0 (Caumo et al., 2020) and sugarcane burning of 2.1 Oros et al., 2006), revealing the influence of several sources over the PM2.5 in the CRV.
Likewise, WNA % represents the preference of odd n alkanes in the sample. The odd n alkanes, especially of higher molecular weight, are representative of plant-wax-related emissions. The waxes are present on the surface of plants, especially on the leaves, and they become airborne by a direct or indirect mechanism like wind action or biomass burning (Kang et al., 2018; Simoneit, 2002). In this research, the samples analyzed showed a preference for odd carbon on C27, C29, C31, and C33, which have higher concentrations than the next higher and lower even carbon number homologous series, proving the biogenic contribution over the PM2.5 in the CRV. The WNA % was calculated using the equation shown in Table 2, as described by Yadav et al. (2013). A larger WNA % represents the contribution from emissions of plant waxes or biomass burning. Otherwise, a smaller value represents n alkanes from petrogenic sources, known as petrogenic n alkanes (PNA) %. The mean WNA % calculated for the PM2.5 samples collected from the CRV was 12.65 % ± 5.21 % (min 4.71 %–max 29.92 %) and can be defined as petrogenic inputs (PNA %) that were 87.35 % during the sampling period. The correlation between CPI and WNA was moderate (r2=0.53), supporting a consistent meaning between these two parameters, and they are useful for assessing the plant wax contribution to PM2.5.
Overall, the total concentration of n alkanes in the PM2.5 in the CRV was lower than those reported in areas where sugarcane is often burned in Brazil (Urban et al., 2016), although the behavior of the parameters of CPI and Cmax is similar. Compared with other urban areas in Latin America, the n alkane concentration in the CRV was similar to that reported in the metropolitan zone of the Mexican valley (MZMV) for PM2.5 (Amador-Muñoz et al., 2011), Bogotá for PM10. and slightly lower than reported in São Paulo for PM10 (Vasconcellos et al., 2011). However, the CPI and WNA in these cities were smaller than in the CRV because of the strong influence of vehicular emissions in these densely populated cities. The OC EC ratio was moderately associated with WNA values (r2=0.41), indicating that an increase in this ratio can be explained by the vegetative detritus contribution to PM2.5, while the levoglucosan concentrations did not show correspondence to the CPI and WNA values; therefore, the levoglucosan levels did not explain the preference of odd carbon number homologs. These results indicated that the n alkanes found in this study came from several sources, with a noticeable contribution from plant wax emissions. The parameters used to assess the source contribution of PM2.5 through n alkanes such as CPI and WNA %, were characteristic of aerosols collected in urban areas.
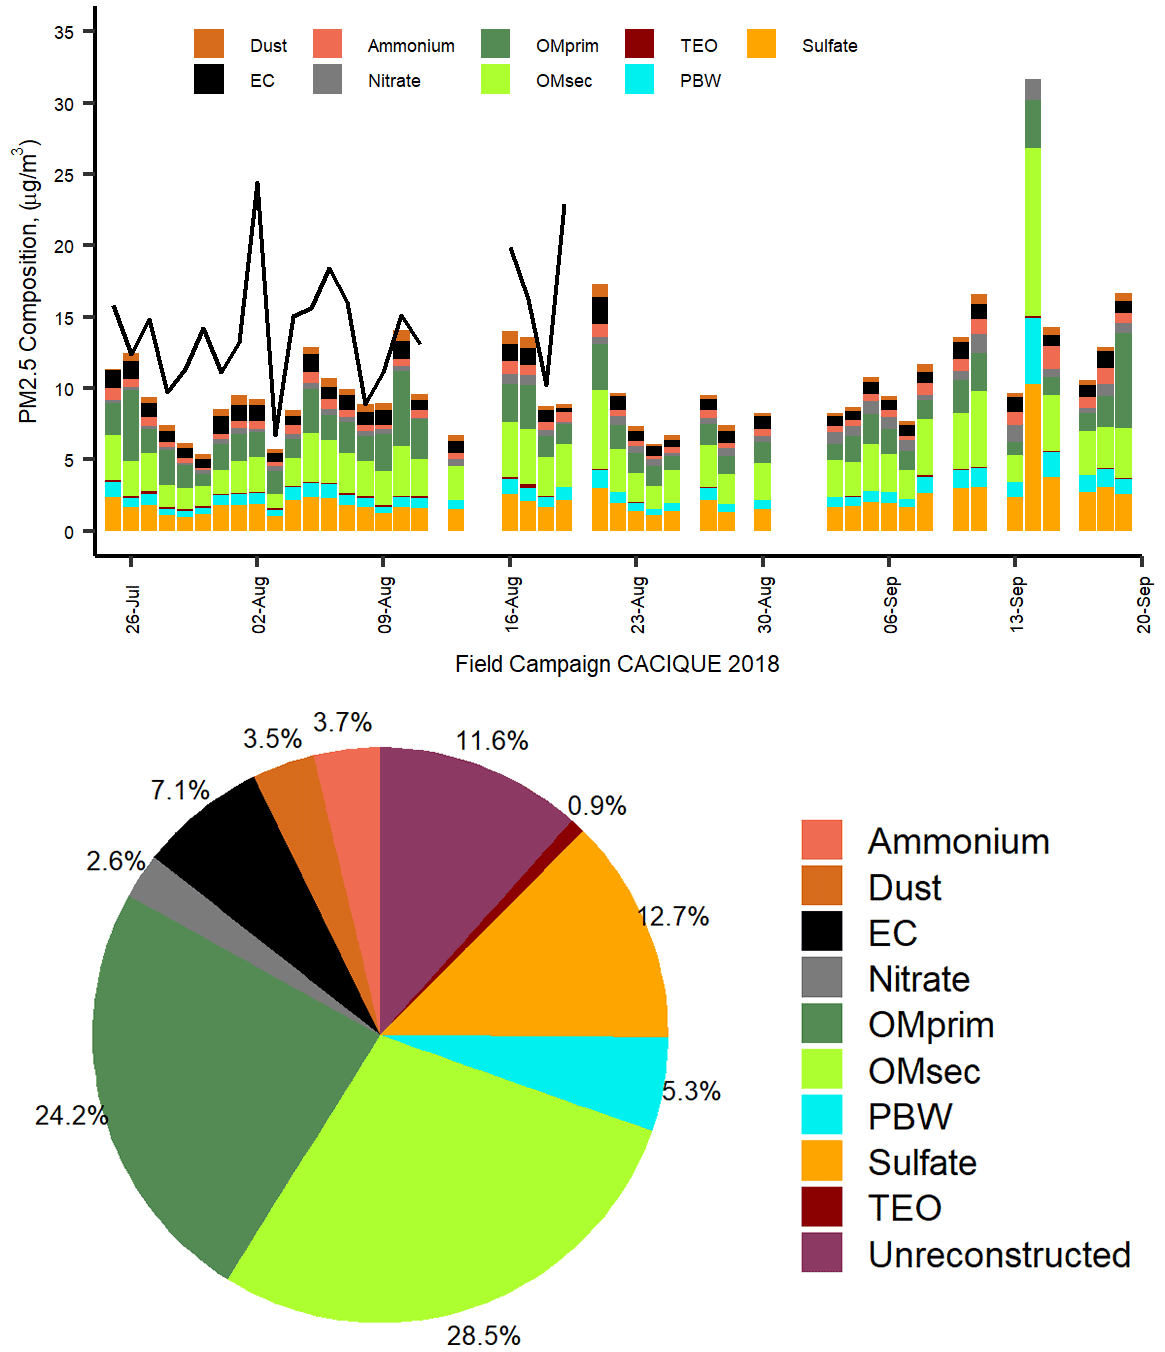
Figure 6Mass reconstruction of PM2.5 collected in the CRV. The upper panel corresponds to the time series of PM2.5 gravimetric mass measured and reconstructed mass from the chemical speciation in the CRV during July–September 2018, and the lower panel corresponds to the to pie chart with the relative mean contributions (%) of the major chemical components of gravimetric PM2.5, based on chemical speciation.
3.8 PM2.5 mass closure
Mass closure (Fig. 6) shows the crucial contribution of organic material (52.66±18.44 %) and inorganic fraction, represented by sulfate (12.69±2.84 %), ammonium (3.75±1.05 %), and nitrate (2.56±1.29 %). EC constituted 7.13±2.44 % of PM2.5. The mineral fraction corresponded to dust (3.51±1.35 %) and TEOs (0.85±0.42 %). A mass closure of 88.42±24.17 % was achieved. Although PM2.5 concentrations observed in the CRV were not as high as compared to those registered in Brazil and Mexico during the pre-harvest season, the EC percentage is in a similar range or slightly lower than those observed in other urban areas (Snider et al., 2016), showing the key role of incomplete combustion processes in the area.
The average (OC EC) ratio found in the CRV was 4.2±0.72, from which we can infer that secondary aerosol formation had a relevant role. The segregation of OC into the primary and secondary fractions was carried out using two methods. The first was the EC tracer method applied in previous studies (Pio et al., 2011; Plaza et al., 2011), and the second was the organic tracer method, which is based on the lineal regression between OC and organic tracers from primary sources. In the EC tracer method, the ratio selected to differentiate OCprim from OCsec was the minimum ratio observed and equivalent to 2.12. Still, this value could induce the overestimation of OCprim due to the distance between the emission sources and the sampling site (27 m above ground) and the local meteorological conditions that favor the volatilization and oxidation of organic components into particles before being collected. As a result, OCprim was estimated at 50.3 % and OCsec at 49.7 % of the total OC, with a minimum variability of 3.8 %. The estimated OMpri concentration was 3.22±1.09 µg m−3, and the OMsec concentration was 4.01±1.78 µg m−3, which represented 24.2 % and 28.5 % of PM2.5, respectively.
In the organic tracer method, the contribution of fossil fuel combustion – mainly derived from transport, biomass burning, and vegetative detritus to OCprim – was estimated from a linear model by robust regression using an M estimator with bisquare function between organic tracers and OC. Resulting contributions were as follows: OCff was 16.38 %, OCbb was 15.19 %, and OCdet was 1.45 % of the total OC measured. Overall, the used organic tracer method to estimate OCprim indicates that this carbonaceous fraction represents 32.68 % ± 11.02 % of the total OC, and it may fluctuate between 17.61 % and 68.60 %.
The difference between OCprim from the organic tracer method and that obtained from the EC tracer method can be associated to the fact that the organic tracer method may not be representative of all sources. Industrial coal and fuel oil burning, garbage burning, cooking, charcoal production, and other sources may not be accounted for by this method, since we did not have specific organic tracers for each of these activities.
The mineral fraction, quantified as the sum of the oxides present in the crustal material (dust) and other TEOs contributed 3.51±1.35 % and 0.85±0.42 %, respectively. Despite the non-quantification of highly abundant mineral dust elements such as Si, the concentrations of Ca, Ti, and Fe indicated the impact of soil resuspension on the PM2.5 mass concentration.
PBW depends on the concentration of hygroscopic compounds embodied in the PM and the relative humidity of the weighing room where the PM2.5 mass collected on the filters was determined. In this study, it was assumed that (i) , , and were the main compounds responsible for absorbed water, and (ii) thermodynamic equilibrium is dominated by these ions that allow the calculation of the H+ molar fraction as a difference between ( +) and , which is required to establish charge neutrality. Polar organic compounds and other water-soluble ions were not considered in the present study. The PBW content was estimated using the mean measured concentrations of , , and in the AIM model, where a multiplier factor of 0.32 was found as a proportion between the concentrations of the sum of these ions and the water fraction contained in PM2.5. As a result, PBW was 5.3 % of the PM2.5 mass concentration.
PM2.5 samples collected in the Cauca River valley, Colombia, were analyzed to determine the main chemical components of fine aerosol particles and to qualitatively identify aerosol sources using its chemical composition and diagnostic ratios. PM2.5 during the campaign was 14.4±4.4 µg m−3. Its main components were OC (4.0±1.3 µg m−3), sulfate (2.2±1.4 µg m−3), and EC (1.0±0.3 µg m−3), ammonium (0.7±0.6 µg m−3), and nitrate (0.5±0.3 µg m−3). OM was estimated using the EC tracer method and the organic tracer method. Mass closure using the EC tracer method explained 88.4 % of PM2.5, whereas the organic tracer method explained 70.9 % of PM2.5. We attribute this difference to the lack of information on specific organic tracers for some sources, both primary and secondary. Organic material and inorganic ions were the dominant groups of species, constituting almost 79 % of PM2.5. OMprim and OMsec from the EC tracer method contribute 24.2 % and 28.5 % to PM2.5. Inorganic ions made up 19.0 %, EC 7.1 %, dust 3.5 %, PBW 5.3 %, and TEOs 0.9 % of PM2.5.
Aerosol acidity was evaluated using three methods. The first, using the nitrate sulfate ratio, the second using the anion cation equivalent ratio, and the third, estimating the pH with the E-AIM thermodynamic model. All methods showed that the aerosol was acidic, with a pH of 2.5±0.4, mainly because of the abundance of organic and sulfur compounds.
Diagnostic ratios applied to organic compounds indicate that most PM2.5 was emitted locally and had contributions of both pyrogenic and petrogenic sources. In addition, levoglucosan and mannosan levels showed that biomass burning was ubiquitous during the sampling period. Fluoranthene (FLE) was the most abundant PAH, confirming the strong influence of BB associated with agro-industry. The five- and six-ring PAHs associated with vehicular emissions were also abundant in PM2.5. Our measurements point to BB as the main source of PAHs in the CRV. Relatively low PM2.5 concentrations and mutagenic potentials are consistent with low-intensity, year-long BB and sugarcane PHB in the CRV, which leads to lower atmospheric pollutant burdens and mutagenic potentials compared to those at locations where the harvesting period is shorter (zafra) and, thus, with higher burning rates.
The data presented in this publication are deposited as related metadata in Mateus et al. (2022) https://doi.org/10.17632/jryhypdhy3.1).
The supplement related to this article is available online at: https://doi.org/10.5194/acp-22-8473-2022-supplement.
RJ, GRS, and NR conceived and managed the project. LMF, ACVB, GRS, and RJ set the instruments up and performed the aerosol sampling. LMF carried out the sample chemical analysis at TROPOS, with the guidance and support of DvP, MvP, KW, and HH. LMF and ACVB analyzed the measurement results, including PCA and other techniques, with the support of DvP. LMF, RJ, NR, and ACVB prepared the paper, with substantial contributions from all the authors.
The contact author has declared that neither they nor their co-authors have any competing interests.
Publisher's note: Copernicus Publications remains neutral with regard to jurisdictional claims in published maps and institutional affiliations.
The authors gratefully acknowledge the financial support from Universidad Nacional de Colombia – Sede Palmira (project “Impacto de la quema de caña de azúcar en la calidad del aire del Valle Geografico del Río Cauca (CACIQUE); Hermes grant no. 37718) and the Leibniz Institute for Tropospheric Research (TROPOS), for the analytical support. This investigation was also supported by a mobility grant from the EU project PAPILA. We thank Susanne Fuchs, Anke Roedger, Sylvia Haferkorn, and Kornelia Pielok, for their technical assistance in the chemical analysis of samples. We acknowledge Pablo Gutierrez, for his contributions in the processing of the open sugarcane burning database and for preparing the CRV map.
This paper was edited by Alexander Laskin and reviewed by two anonymous referees.
Aerocivil: Estadísticas Operacionales, Operaciones aéreas Total, 2000–2019, https://www.aerocivil.gov.co/atencion/estadisticas-de-las-actividades-aeronauticas/estadisticas-operacionales (last access: 15 February 2022), 2019.
Aerocivil: Base de datos servicios fumigación aérea, Aerocivil [data set], https://www.aerocivil.gov.co/atencion/estadisticas-de-las-actividades-aeronauticas/bases-de-datos (last access: 27 June 2022), 2020.
Aiken, A. C., Decarlo, P. F., Kroll, J. H., Worsnop, D. R., Huffman, J. A., Docherty, K. S., Ulbrich, I. M., Mohr, C., Kimmel, J. R., Sueper, D., Sun, Y., Zhang, Q., Trimborn, A., Northway, M., Ziemann, P. J., Canagaratna, M. R., Onasch, T. B., Alfarra, M. R., Prevot, A. S. H., Dommen, J., Duplissy, J., Metzger, A., Baltensperger, U., and Jimenez, J. L.: and ratios of primary, secondary, and ambient organic aerosols with high-resolution time-of-flight aerosol mass spectrometry, Environ. Sci. Technol., 42, 4478–4485, https://doi.org/10.1021/es703009q, 2008.
Alvi, M. U., Kistler, M., Shahid, I., Alam, K., Chishtie, F., Mahmud, T., and Kasper-Giebl, A.: Composition and source apportionment of saccharides in aerosol particles from an agro-industrial zone in the Indo-Gangetic Plain, Environ. Sci. Pollut. Res., 27, 14124–14137, https://doi.org/10.1007/S11356-020-07905-2, 2020.
Amador-Muñoz, O., Villalobos-Pietrini, R., Miranda, J., and Vera-Avila, L. E.: Organic compounds of PM2.5 in Mexico Valley: Spatial and temporal patterns, behavior and sources, Sci. Total Environ., 409, 1453–1465, https://doi.org/10.1016/j.scitotenv.2010.11.026, 2011.
Andreae, M. O.: Soot Carbon and Excess Fine Potassium: Long-Range Transport of Combustion-Derived Aerosols, Science, 220, 1148–1151, https://doi.org/10.1126/science.220.4602.1148, 1983.
Andreae, M. O.: Emission of trace gases and aerosols from biomass burning – an updated assessment, Atmos. Chem. Phys., 19, 8523–8546, https://doi.org/10.5194/acp-19-8523-2019, 2019.
Aneja, V. P., Schlesinger, W. H., and Erisman, J. W.: Farming pollution, Nat. Geosci., 1, 409–411, https://doi.org/10.1038/ngeo236, 2008.
Aneja, V. P., Schlesinger, W. H., and Erisman, J. W.: Effects of agriculture upon the air quality and climate: Research, policy, and regulations, Environ. Sci. Technol., 43, 4234–4240, https://doi.org/10.1021/es8024403, 2009.
Asocaña: Aspectos Generales del Sector Agroindustrial de la Caña 2017–2018, Informe Anual, https://www.asocana.org/documentos/2352019-D0CA1EED-00FF00,000A000,878787,C3C3C3,0F0F0F,B4B4B4,FF00FF,2D2D2D,A3C4B5.pdf (last access: 20 May 2020), 2018.
Asocaña: Aspectos generales del sector agroindustial de la caña Informe anual 2018–2019. https://www.asocana.org/documentos/2352019-D0CA1EED-00FF00,000A000,878787,C3C3C3,0F0F0F,B4B4B4,FF00FF,2D2D2D,A3C4B5.pdf (last access: 20 May 2020), 2019.
Begam, G. R., Vachaspati, C. V., Ahammed, Y. N., Kumar, K. R., Reddy, R. R., Sharma, S. K., Saxena, M., and Mandal, T. K.: Seasonal characteristics of water-soluble inorganic ions and carbonaceous aerosols in total suspended particulate matter at a rural semi-arid site, Kadapa (India), Environ. Sci. Pollut. Res., 24, 1719–1734, https://doi.org/10.1007/s11356-016-7917-1, 2016.
Bhattarai, H., Saikawa, E., Wan, X., Zhu, H., Ram, K., Gao, S., Kang, S., Zhang, Q., Zhang, Y., Wu, G., Wang, X., Kawamura, K., Fu, P., and Cong, Z.: Levoglucosan as a tracer of biomass burning: Recent progress and perspectives, Atmos. Res., 220, 20–33, https://doi.org/10.1016/j.atmosres.2019.01.004, 2019.
Boman, J., Lindén, J., Thorsson, S., Holmer, B., and Eliasson, I.: A tentative study of urban and suburban fine particles (PM2.5) collected in Ouagadougou, Burkina Faso, X-Ray Spectrom., 38, 354–362, https://doi.org/10.1002/XRS.1173, 2009.
Cardozo-Valencia, A., Saa, G. R., Hernandez, A. J., Lopez, G. R., and Jimenez, R.: Distribución espaciotemporal y estimación de emisiones por quema precosecha de caña de azúcar en el Valle del Cauca, in: Conf. Proc. – Congr. Colomb. y Conf. Int. Calid. Aire y Salud Publica, CASAP 2019, https://doi.org/10.1109/CASAP.2019.8916696, 2019.
Casey, K. D., Bicudo, J. R., Schmidt, D. R., Singh, A., Gay, S. W., Gates, R. S., Jacobson, L. D., and Hoff, S. J.: Air quality and emissions from livestock and poultry production/waste management systems, in: Animal Agriculture and the Environment, National Center for Manure & Animal Waste Management White Papers, edited by: Rice, J. M., Caldwell, D. F., and Humenik, F. J., ASABE, St. Joseph, Michigan, 1–40, https://doi.org/10.13031/2013.20246, 2006.
Caumo, S., Bruns, R. E., and Vasconcellos, P. C.: Variation of the distribution of atmospheric n-alkanes emitted by different fuels' combustion, Atmosphere (Basel), 11, 1–19, https://doi.org/10.3390/atmos11060643, 2020.
Cavalli, F., Viana, M., Yttri, K. E., Genberg, J., and Putaud, J.: Toward a standardised thermal-optical protocol for measuring atmospheric organic and elemental carbon: the EUSAAR protocol, Atmos. Meas. Tech., 3, 79–89, https://doi.org/10.5194/amt-3-79-2010, 2010.
Chow, J. C., Lowenthal, D. H., Chen, L. W. A., Wang, X., and Watson, J. G.: Mass reconstruction methods for PM2.5: a review, Air Qual. Atmos. Health, 8, 243–263, https://doi.org/10.1007/s11869-015-0338-3, 2015.
Clegg, S. L., Brimblecombe, P., and Wexler, A. S.: Thermodynamic Model of the System H+–––NO3–H2O at Tropospheric Temperatures, J. Phys. Chem. A, 102, 2137–2154, https://doi.org/10.1021/jp973042r, 1998.
Criollo, J. and Daza, N.: Evaluación de los niveles de concentración de metales en PM10 producto de la quema de biomasa en el valle geográfico del rio Cauca, La Salle University, https://ciencia.lasalle.edu.co/ing_ambiental_sanitaria/135/ (last access: 20 June 2022), 2011.
Dabek-Zlotorzynska, E., Dann, T. F., Kalyani Martinelango, P., Celo, V., Brook, J. R., Mathieu, D., Ding, L., and Austin, C. C.: Canadian National Air Pollution Surveillance (NAPS) PM2.5 speciation program: Methodology and PM2.5 chemical composition for the years 2003–2008, Atmos. Environ., 45, 673–686, https://doi.org/10.1016/j.atmosenv.2010.10.024, 2011.
de Andrade, S. J., Cristale, J., Silva, F. S., Julião Zocolo, G., and Marchi, M. R. R.: Contribution of sugar-cane harvesting season to atmospheric contamination by polycyclic aromatic hydrocarbons (PAHs) in Araraquara city, Southeast Brazil, Atmos. Environ., 44, 2913–2919, https://doi.org/10.1016/j.atmosenv.2010.04.026, 2010.
De Assuncao, J. V., Pesquero, C. R., Nardocci, A. C., Francisco, A. P., Soares, N. S., and Ribeiro, H.: Airborne polycyclic aromatic hydrocarbons in a medium-sized city affected by preharvest sugarcane burning and inhalation risk for human health, J. Air Waste Manage. Assoc., 64, 1130–1139, https://doi.org/10.1080/10962247.2014.928242, 2014.
Dos Santos, C. Y. M., de Azevedo, D. A., and De Aquino Neto, F. R.: Selected organic compounds from biomass burning found in the atmospheric particulate matter over sugarcane plantation areas, Atmos. Environ., 36, 3009–3019, https://doi.org/10.1016/S1352-2310(02)00249-2, 2002.
Durant, J. L., Busby Jr, W. F., Lafleur, A. L., Penman, B. W., and Crespi, C. L.: Human cell mutagenicity of oxygenated, nitrated and unsubstituted polycyclic aromatic hydrocarbons associated with urban aerosols, Mutat. Res.-Genet. Toxicol., 371, 123–157, https://doi.org/10.1016/S0165-1218(96)90103-2, 1996.
El-Zanan, H. S., Lowenthal, D. H., Zielinska, B., Chow, J. C., and Kumar, N.: Determination of the organic aerosol mass to organic carbon ratio in IMPROVE samples, Chemosphere, 60, 485–496, https://doi.org/10.1016/j.chemosphere.2005.01.005, 2005.
Engling, G., Lee, J. J., Tsai, Y.-W., Lung, S.-C. C., Chou, C. C.-K., and Chan, C.-Y.: Size-Resolved Anhydrosugar Composition in Smoke Aerosol from Controlled Field Burning of Rice Straw, Aerosol Sci. Tech., 43, 662–672, https://doi.org/10.1080/02786820902825113, 2009.
FAO: FAOSTAT, http://www.fao.org/faostat/en/#data/QC (last access: 21 July 2021), 2020.
Fomba, K. W., Müller, K., Van Pinxteren, D., and Herrmann, H.: Aerosol size-resolved trace metal composition in remote northern tropical Atlantic marine environment: case study Cape Verde islands, Atmos. Chem. Phys., 13, 4801–4814, https://doi.org/10.5194/acp-13-4801-2013, 2013.
Fomba, K. W., van Pinxteren, D., Müller, K., Spindler, G., and Herrmann, H.: Assessment of trace metal levels in size-resolved particulate matter in the area of Leipzig, Atmos. Environ., 176, 60–70, https://doi.org/10.1016/j.atmosenv.2017.12.024, 2018.
Franzin, B. T., Guizellini, F. C., de Babos, D. V., Hojo, O., Pastre, I. A., Marchi, M. R. R., Fertonani, F. L., and Oliveira, C. M. R. R.: Characterization of atmospheric aerosol (PM10 and PM2.5) from a medium sized city in São Paulo state, Brazil, J. Environ. Sci. (China), 89, 238–251, https://doi.org/10.1016/j.jes.2019.09.014, 2020.
Friese, E. and Ebel, A.: Temperature Dependent Thermodynamic Model of the System H+––Na+–––Cl−–H2O, J. Phys. Chem. A, 114, 11595–11631, https://doi.org/10.1021/jp101041j, 2010.
Gonçalves, C., Figueiredo, B. R., Alves, C. A., Cardoso, A. A., and Vicente, A. M.: Size-segregated aerosol chemical composition from an agro-industrial region of São Paulo state, Brazil, Air Qual. Atmos. Health, 10, 483–496, https://doi.org/10.1007/S11869-016-0441-0, 2016.
Gondwe, M.: Comparison of modeled versus measured MSA: nss SO = 4 ratios: A global analysis, Global Biogeochem. Cy., 18, 1–18, https://doi.org/10.1029/2003GB002144, 2004.
Hall, D., Wu, C. Y., Hsu, Y. M., Stormer, J., Engling, G., Capeto, K., Wang, J., Brown, S., Li, H. W., and Yu, K. M.: PAHs, carbonyls, VOCs and PM2.5 emission factors for pre-harvest burning of Florida sugarcane, Atmos. Environ., 55, 164–172, https://doi.org/10.1016/j.atmosenv.2012.03.034, 2012.
Hernández, J. D. R. and Mesa, Ó. J.: A simple conceptual model for the heat induced circulation over Northern South America and MESO-America, Atmosphere (Basel), 11, 1–14, https://doi.org/10.3390/atmos11111235, 2020.
Hodshire, A. L., Akherati, A., Alvarado, M. J., Brown-Steiner, B., Jathar, S. H., Jimenez, J. L., Kreidenweis, S. M., Lonsdale, C. R., Onasch, T. B., Ortega, A. M., and Pierce, J. R.: Aging Effects on Biomass Burning Aerosol Mass and Composition: A Critical Review of Field and Laboratory Studies, Environ. Sci. Technol., 53, 10007–10022, https://doi.org/10.1021/acs.est.9b02588, 2019.
Ianniello, A., Spataro, F., Esposito, G., Allegrini, I., Hu, M., and Zhu, T.: Chemical characteristics of inorganic ammonium salts in PM2.5 in the atmosphere of Beijing (China), Atmos. Chem. Phys., 11, 10803–10822, https://doi.org/10.5194/acp-11-10803-2011, 2011.
Iinuma, Y., Engling, G., Puxbaum, H., and Herrmann, H.: A highly resolved anion-exchange chromatographic method for determination of saccharidic tracers for biomass combustion and primary bio-particles in atmospheric aerosol, Atmos. Environ., 43, 1367–1371, 2009.
Jorquera, H. and Barraza, F.: Source apportionment of ambient PM2.5 in Santiago, Chile: 1999 and 2004 results, Sci. Total Environ., 435–436, 418–429, https://doi.org/10.1016/j.scitotenv.2012.07.049, 2012.
Jorquera, H. and Barraza, F.: Source apportionment of PM10 and PM2.5 in a desert region in northern Chile, Sci. Total Environ., 444, 327–335, https://doi.org/10.1016/j.scitotenv.2012.12.007, 2013.
Kang, M., Ren, L., Ren, H., Zhao, Y., Kawamura, K., Zhang, H., Wei, L., Sun, Y., Wang, Z., and Fu, P.: Primary biogenic and anthropogenic sources of organic aerosols in Beijing, China: Insights from saccharides and n-alkanes, Environ. Pollut., 243, 1579–1587, https://doi.org/10.1016/j.envpol.2018.09.118, 2018.
Karagulian, F., Belis, C. A., Francisco, C., Dora, C., Prüss-ustün, A. M., Bonjour, S., Adair-rohani, H., and Amann, M.: Contributions to cities' ambient particulate matter (PM): A systematic review of local source contributions at global level, Atmos. Environ., 120, 475–483, https://doi.org/10.1016/j.atmosenv.2015.08.087, 2015.
Khedidji, S., Müller, K., Rabhi, L., Spindler, G., Fomba, K. W., van Pinxteren, D., Yassaa, N., and Herrmann, H.: Chemical Characterization of Marine Aerosols in a South Mediterranean Coastal Area Located in Bou Ismaïl, Algeria, Aerosol Air Qual. Res., 20, 2448–2473, https://doi.org/10.4209/aaqr.2019.09.0458, 2020.
Kundu, S. and Stone, E. A.: Composition and sources of fine particulate matter across urban and rural sites in the Midwestern United States, Environ. Sci. Process. Imp., 16, 1360–1370, https://doi.org/10.1039/c3em00719g, 2014.
Lara, L. L., Artaxo, P., Martinelli, L. A., Camargo, P. B., Victoria, R. L., and Ferraz, E. S. B.: Properties of aerosols from sugar-cane burning emissions in Southeastern Brazil, Atmos. Environ., 39, 4627–4637, https://doi.org/10.1016/j.atmosenv.2005.04.026, 2005.
Lee, S., Wang, Y., and Russell, A. G.: Assessment of secondary organic carbon in the southeastern United States: A review, J. Air Waste Manage. Assoc., 60, 1282–1292, https://doi.org/10.3155/1047-3289.60.11.1282, 2010.
Lee, T., Yu, X., Kreidenweis, S. M., Malm, W. C., and Collett, J. L.: Semi-continuous measurement of PM2.5 ionic composition at several rural locations in the United States, Atmos. Environ., 42, 6655–6669, https://doi.org/10.1016/j.atmosenv.2008.04.023, 2008.
Li, J., Song, Y., Mao, Y., Mao, Z., Wu, Y., Li, M., Huang, X., He, Q., and Hu, M.: Chemical characteristics and source apportionment of PM2.5 during the harvest season in eastern China's agricultural regions, Atmos. Environ., 92, 442–448, https://doi.org/10.1016/J.ATMOSENV.2014.04.058, 2014.
Li, X., Wang, L., Ji, D., Wen, T., Pan, Y., Sun, Y., and Wang, Y.: Characterization of the size-segregated water-soluble inorganic ions in the Jing-Jin-Ji urban agglomeration: Spatial/temporal variability, size distribution and sources, Atmos. Environ., 77, 250–259, https://doi.org/10.1016/j.atmosenv.2013.03.042, 2013.
Liang, C. S., Duan, F. K., He, K. B., and Ma, Y. L.: Review on recent progress in observations, source identifications and countermeasures of PM2.5, Environ. Int., 86, 150–170, https://doi.org/10.1016/j.envint.2015.10.016, 2016.
Lin, L., Lee, M. L., and Eatough, D. J.: Review of recent advances in detection of organic markers in fine particulate matter and their use for source apportionment, J. Air Waste Manage. Assoc., 60, 3–25, https://doi.org/10.3155/1047-3289.60.1.3, 2010.
Lopez, M. and Howell, W.: Katabatic Winds in the equatorial Andes, J. Atmos. Sci., 24, 29–35, 1967.
López Larada, J.: Zona portuaria de Buenaventura: y su importancia en Colombia, Univ. San Buenaventura, 1–14, http://bibliotecadigital.usbcali.edu.co/bitstream/10819/7099/1/Zona_Portuaria_Buenaventura_Lopez_2017.pdf (last access: 23 February 2022), 2017.
Lyu, R., Shi, Z., Alam, M. S., Wu, X., Liu, D., Vu, T. V., Stark, C., Xu, R., Fu, P., Feng, Y., and Harrison, R. M.: Alkanes and aliphatic carbonyl compounds in wintertime PM2.5 in Beijing, China, Atmos. Environ., 202, 244–255, https://doi.org/10.1016/j.atmosenv.2019.01.023, 2019.
MADS: Res. No. 2254, Ministerio de Ambiente y Desarrollo Sostenible, Colombia, 2017.
Majra, J. P.: Air Quality in Rural Areas, in Chemistry, Emission Control, Radioactive Pollution and Indoor Air Quality, Intech Open, https://doi.org/10.5772/16890, 2011.
Malcolm, H. M. and Dobson, S.: The calculation of an Environmental Assessment Level (EAL) for atmospheric PAHs using relative potencies, Department of the Environment, London, 1994.
Mancilla, Y., Mendoza, A., Fraser, M. P., and Herckes, P.: Organic composition and source apportionment of fine aerosol at Monterrey, Mexico, based on organic markers, Atmos. Chem. Phys., 16, 953–970, https://doi.org/10.5194/acp-16-953-2016, 2016.
Marzi, R., Torkelson, B. E., and Olson, R. K.: A revised carbon preference index, Org. Geochem., 20, 1303–1306, https://doi.org/10.1016/0146-6380(93)90016-5, 1993.
Mateus, L., Vargas, A., and Jimenez, R.: Chemical composition of PM2.5 in Cauca River valley Colombia, V1, Mendeley Data [data set], https://doi.org/10.17632/jryhypdhy3.1, 2022.
Meinardi, S., Simpson, I. J., Blake, N. J., Blake, D. R., and Rowland, F. S.: Dimethyl disulfide (DMDS) and dimethyl sulfide (DMS) emissions from biomass burning in Australia, Geophys. Res. Lett., 30, 1454, https://doi.org/10.1029/2003GL016967, 2003.
Mesa, S., Ó. J. and Rojo H. J. D.: On the general circulation of the atmosphere around Colombia, Rev. la Acad. Colomb. Ciencias Exactas, Fis. y Nat., 44, 857–875, https://doi.org/10.18257/RACCEFYN.899, 2020.
Miguel, A. H. and Pereira, P. A. P.: Benzo(k)fluoranthene, benzo(ghi)perylene, and indeno(1, 2, 3-cd)pyrene: New tracers of automotive emissions in receptor modeling, Aerosol Sci. Tech., 10, 292–295, https://doi.org/10.1080/02786828908959265, 1989.
Min.Agricultura: Cadenas cárnicas bovina – bufalina, Bogotá, DC, https://sioc.minagricultura.gov.co/Bovina/Documentos/2018-12-30 CifrasSectoriales.pdf (last access: 20 June 2022), 2018.
Min.Agricultura: Cadena Carnica Porcina, Bogotá, DC, https://sioc.minagricultura.gov.co/Porcina/Documentos/2019-12-30 Cifrassectoriales.pdf (last access: 20 June 2022),, 2019.
Min.Agricultura: Cadena Avícola, segundo trimestre 2020, Bogotá, DC, https://www.minagricultura.gov.co/paginas/default.aspx (last access: 20 June 2022),, 2020.
Mugica-Álvarez, V., Santiago-de la Rosa, N., Figueroa-Lara, J., Flores-Rodríguez, J., Torres-Rodríguez, M., and Magaña-Reyes, M.: Emissions of PAHs derived from sugarcane burning and processing in Chiapas and Morelos México, Sci. Total Environ., 527–528, 474–482, https://doi.org/10.1016/j.scitotenv.2015.04.089, 2015.
Mugica-Álvarez, V., Ramos-Guízar, S., Rosa, N. S. la, Torres-Rodríguez, M., and Noreña-Franco, L.: Black Carbon and Particulate Organic Toxics Emitted by Sugarcane Burning in Veracruz, México, Int. J. Environ. Sci. Dev., 7, 290–294, https://doi.org/10.7763/ijesd.2016.v7.786, 2016.
Mugica-Álvarez, V., Hernández-Rosas, F., Magaña-Reyes, M., Herrera-Murillo, J., Santiago-De La Rosa, N., Gutiérrez-Arzaluz, M., de Jesús Figueroa-Lara, J., and González-Cardoso, G.: Sugarcane burning emissions: Characterization and emission factors, Atmos. Environ., 193, 262–272, https://doi.org/10.1016/j.atmosenv.2018.09.013, 2018.
Murillo, J. H., Roman, S. R., Felix, J., Marin, R., Ramos, A. C., Jimenez, S. B., Gonzalez, B. C., and Baumgardner, D. G.: Chemical characterization and source apportionment of PM10 and PM2.5 in the metropolitan area of Costa Rica, Central America Jorge, Atmos. Pollut. Res., 4, 181–190, https://doi.org/10.5094/APR.2013.018, 2013.
Neusüss, C., Pelzing, M., Plewka, A., and Herrmann, H.: A new analytical approach for size-resolved speciation of organic compounds in atmospheric aerosol particles: Methods and first results, J. Geophys. Res.-Atmos., 105, 4513–4527, https://doi.org/10.1029/1999JD901038, 2000.
Nisbet, I. C. T. and LaGoy, P. K.: Toxic equivalency factors (TEFs) for polycyclic aromatic hydrocarbons (PAHs), Regul. Toxicol. Pharmacol., 16, 290–300, https://doi.org/10.1016/0273-2300(92)90009-X, 1992.
Oros, D. R., Abas, M. R. bin, Omar, N. Y. M. J., Rahman, N. A., and Simoneit, B. R. T.: Identification and emission factors of molecular tracers in organic aerosols from biomass burning: Part 3. Grasses, Appl. Geochem., 21, 919–940, https://doi.org/10.1016/j.apgeochem.2006.01.008, 2006.
Orozco, C., Sanandres, E., and Molinares, I.: Colombia, Panamá y la Ruta Panamericana: Encuentros y Desencuentros, Memorias Rev. Digit. Hist. y Arqueol. desde el Caribe, http://www.scielo.org.co/scielo.php?script=sci_arttext&pid=S1794-88862012000100005 (last access: 23 February 2022), 2012.
Ortiz, E. Y., Jimenez, R., Fochesatto, G. J., and Morales-Rincon, L. A.: Caracterización de la turbulencia atmosférica en una gran zona verde de una megaciudad andina tropical, Rev. la Acad. Colomb. Ciencias Exactas, Físicas y Nat., 43, 133, https://doi.org/10.18257/raccefyn.697, 2019.
Pant, P. and Harrison, R. M.: Estimation of the contribution of road traffic emissions to particulate matter concentrations from field measurements: A review, Atmos. Environ., 77, 78–97, https://doi.org/10.1016/j.atmosenv.2013.04.028, 2013.
Pereira, G. M., Teinilä, K., Custódio, D., Gomes Santos, A., Xian, H., Hillamo, R., Alves, C. A., Bittencourt de Andrade, J., Olímpio da Rocha, G., Kumar, P., Balasubramanian, R., de Andrade, M. F., and de Castro Vasconcellos, P.: Particulate pollutants in the Brazilian city of São Paulo: 1-year investigation for the chemical composition and source apportionment, Atmos. Chem. Phys., 17, 11943–11969, https://doi.org/10.5194/acp-17-11943-2017, 2017.
Pereira, G. M., Oraggio, B., Teinilä, K., Custódio, D., Huang, X., Hillamo, R., Alves, C. A., Balasubramanian, R., Rojas, N. Y., and Sanchez-Ccoyllo, O.: A comparative chemical study of PM10 in three Latin American cities: Lima, Medellín, ans São Paulo, Air Qual. Atmos. Health, 12, 1141–1152, https://doi.org/10.1007/s11869-019-00735-3, 2019.
Pio, C., Cerqueira, M., Harrison, R. M., Nunes, T., Mirante, F., Alves, C., Oliveira, C., Sanchez de la Campa, A., Artíñano, B., and Matos, M.: OC EC ratio observations in Europe: Re-thinking the approach for apportionment between primary and secondary organic carbon, Atmos. Environ., 45, 6121–6132, https://doi.org/10.1016/j.atmosenv.2011.08.045, 2011.
Plaza, J., Artíñano, B., Salvador, P., Gómez-Moreno, F. J., Pujadas, M., and Pio, C. A.: Short-term secondary organic carbon estimations with a modified OC/EC primary ratio method at a suburban site in Madrid (Spain), Atmos. Environ., 45, 2496–2506, https://doi.org/10.1016/j.atmosenv.2011.02.037, 2011.
Pye, H. O. T., Nenes, A., Alexander, B., Ault, A. P., Barth, M. C., Clegg, S. L., Collett, J. L., Fahey, K. M., Hennigan, C. J., Herrmann, H., Kanakidou, M., Kelly, J. T., Ku, I. T., Faye McNeill, V., Riemer, N., Schaefer, T., Shi, G., Tilgner, A., Walker, J. T., Wang, T., Weber, R., Xing, J., Zaveri, R. A. and Zuend, A.: The acidity of atmospheric particles and clouds, Atmos. Chem. Phys., 20, 4809–4888, https://doi.org/10.5194/acp-20-4809-2020, 2020.
Ramírez, O., Sánchez de la Campa, A. M., Amato, F., Catacolí, R. A., Rojas, N. Y., and de la Rosa, J.: Chemical composition and source apportionment of PM10 at an urban background site in a high–altitude Latin American megacity (Bogota, Colombia), Environ. Pollut., 233, 142–155, https://doi.org/10.1016/j.envpol.2017.10.045, 2018.
Ravindra, K., Sokhi, R., and Van Grieken, R.: Atmospheric polycyclic aromatic hydrocarbons: Source attribution, emission factors and regulation, Atmos. Environ., 42, 2895–2921, https://doi.org/10.1016/j.atmosenv.2007.12.010, 2008.
Romero, D., Sarmiento, H., and Pachón, J. E.: Estimación de hidrocarburos aromáticos policíclicos y metales pesados asociados con la quema de caña de azúcar en el valle geográfico del río Cauca, Colombia, Rev. Épsilon, 21, 57–82, 2013.
Ryu, S. Y., Kim, J. E., Zhuanshi, H., Kim, Y. J., and Kang, G. U.: Chemical composition of post-harvest biomass burning aerosols in gwangju, Korea, J. Air Waste Manage. Assoc., 54, 1124–1137, https://doi.org/10.1080/10473289.2004.10471018, 2004.
Schauer, J. J.: Sources contributions to atmospheric organic compound concentrations: Emissions measurments and model predictions, PhD thesis, California Institute Technology, https://doi.org/10.7907/3FPH-HY50, 1998.
SDA: Plan decenal de descontaminación del aire de Bogotá, Bogotá, DC, http://ambientebogota.gov.co/en/c/document_library/get_file?uuid=b5f3e23f-9c5f-40ef-912a-51a5822da320&groupId=55886 (last access: 20 June 2022), 2010.
Seinfeld, J. H. and Pandis, S. N.: Atmospheric Chemistry and Physics: From Air Pollution to Climate Change, 2nd Edn., J. W. & Sons, A Wiley-Interscience publication, ISBN 978-0-471-72018-8, 1998.
SICOM: Boletín estadístico, Boletín Estad. EDS automotriz y Fluv, https://www.sicom.gov.co/index.php/boletin-estadistico (last access: 15 February 2022), 2018.
Simoneit, B. R. T.: Biomass burning – A review of organic tracers for smoke from incomplete combustion, Appl. Geochem., 17, 129–162, https://doi.org/10.1016/S0883-2927(01)00061-0, 2002.
Snider, G., Weagle, C. L., Murdymootoo, K. K., Ring, A., Ritchie, Y., Stone, E., Walsh, A., Akoshile, C., Anh, N. X., Balasubramanian, R., Brook, J., Qonitan, F. D., Dong, J., Griffith, D., He, K., Holben, B. N., Kahn, R., Lagrosas, N., Lestari, P., Ma, Z., Misra, A., Norford, L. K., Quel, E. J., Salam, A., Schichtel, B., Segev, L., Tripathi, S., Wang, C., Yu, C., Zhang, Q., Zhang, Y., Brauer, M., Cohen, A., Gibson, M. D., Liu, Y., Martins, J. V., Rudich, Y., and Martin, R. V.: Variation in global chemical composition of PM2.5: emerging results from SPARTAN, Atmos. Chem. Phys., 16, 9629–9653, https://doi.org/10.5194/acp-16-9629-2016, 2016.
Sorooshian, A., Crosbie, E., Maudlin, L. C., Youn, J., Wang, Z., Shingler, T., Ortega, A. M., Hersey, S., and Woods, R. K.: Surface and airborne measurements of organosulfur and methanesulfonate over the western United States and coastal areas, J. Geophys. Res.-Atmos., 120, 8535–8548, https://doi.org/10.1002/2015JD023822, 2015.
Souza, D. Z., Vasconcellos, P. C., Lee, H., Aurela, M., Saarnio, K., Teinilä, K., and Hillamo, R.: Composition of PM2.5 and PM10 collected at Urban Sites in Brazil, Aerosol Air Qual. Res., 14, 168–176, https://doi.org/10.4209/aaqr.2013.03.0071, 2014.
Stahl, C., Cruz, M. T., Bañaga, P. A., Betito, G., Braun, R. A., Aghdam, M. A., Cambaliza, M. O., Lorenzo, G. R., Macdonald, A. B., Hilario, M. R. A., Pabroa, P. C., Yee, J. R., and Simpas, J. B.: Sources and characteristics of size-resolved particulate organic acids and methanesulfonate in a coastal megacity: Manila, Philippines, Atmos. Chem. Phys., 20, 15907–15935, https://doi.org/10.5194/acp-20-15907-2020, 2020.
Sutton, M. A., Billen, G., Bleeker, A., Erisman, J. W., Grennfelt, P., Van Grinsven, H., Grizzetti, B., Howard, C. M., and Leip, A.: Technical summary Part I Nitrogen in Europe: the present position, Eur. Nitrogen Assess. Sources, Eff. Policy Perspect., December 2015, Xxxv–Lii, https://doi.org/10.1017/CBO9780511976988.003, 2011.
Szabó, J., Szabó Nagy, A., and Erdős, J.: Ambient concentrations of PM10, PM10-bound polycyclic aromatic hydrocarbons and heavy metals in an urban site of Győr, Hungary, Air Qual. Atmos. Health, 8, 229–241, https://doi.org/10.1007/s11869-015-0318-7, 2015.
Tang, M., Guo, L., Bai, Y., Huang, R., Wu, Z., and Wang, Z.: Impacts of methanesulfonate on the cloud condensation nucleation activity of sea salt aerosol, Atmos. Environ., 201, 13–17, https://doi.org/10.1016/j.atmosenv.2018.12.034, 2019.
Tobiszewski, M. and Namieśnik, J.: PAH diagnostic ratios for the identification of pollution emission sources, Environ. Pollut., 162, 110–119, https://doi.org/10.1016/j.envpol.2011.10.025, 2012.
Tsigaridis, K., Daskalakis, N., Kanakidou, M., Adams, P. J., Artaxo, P., Bahadur, R., Balkanski, Y., Bauer, S. E., Bellouin, N., Benedetti, A., Bergman, T., Berntsen, T. K., Beukes, J. P., Bian, H., Carslaw, K. S., Chin, M., Curci, G., Diehl, T., Easter, R. C., Ghan, S. J., Gong, S. L., Hodzic, A., Hoyle, C. R., Iversen, T., Jathar, S., Jimenez, J. L., Kaiser, J. W., Kirkeväg, A., Koch, D., Kokkola, H., H Lee, Y., Lin, G., Liu, X., Luo, G., Ma, X., Mann, G. W., Mihalopoulos, N., Morcrette, J. J., Müller, J. F., Myhre, G., Myriokefalitakis, S., Ng, N. L., O'donnell, D., Penner, J. E., Pozzoli, L., Pringle, K. J., Russell, L. M., Schulz, M., Sciare, J., Seland, Shindell, D. T., Sillman, S., Skeie, R. B., Spracklen, D., Stavrakou, T., Steenrod, S. D., Takemura, T., Tiitta, P., Tilmes, S., Tost, H., Van Noije, T., Van Zyl, P. G., Von Salzen, K., Yu, F., Wang, Z., Wang, Z., Zaveri, R. A., Zhang, H., Zhang, K., Zhang, Q., and Zhang, X.: The AeroCom evaluation and intercomparison of organic aerosol in global models, Atmos. Chem. Phys., 14, 10845–10895, https://doi.org/10.5194/acp-14-10845-2014, 2014.
Turpin, B. J. and Lim, H.: Species Contributions to PM2.5 Mass Concentrations: Revisiting Common Assumptions for Estimating Organic Mass, Aerosol Sci. Tech., 35, 37–41, https://doi.org/10.1080/02786820119445, 2010.
Urban, R. C., Alves, C. A., Allen, A. G., Cardoso, A. A., Queiroz, M. E. C., and Campos, M. L. A. M.: Sugar markers in aerosol particles from an agro-industrial region in Brazil, Atmos. Environ., 90, 106–112, https://doi.org/10.1016/j.atmosenv.2014.03.034, 2014.
Urban, R. C., Alves, C. A., Allen, A. G., Cardoso, A. A., and Campos, M. L. A. M.: Organic aerosols in a Brazilian agro-industrial area: Speciation and impact of biomass burning, Atmos. Res., 169, 271–279, https://doi.org/10.1016/j.atmosres.2015.10.008, 2016.
Vargas, F. A., Rojas, N. Y., Pachon, J. E., and Russell, A. G.: PM10 characterization and source apportionment at two residential areas in Bogota, Atmos. Pollut. Res., 3, 72–80, https://doi.org/10.5094/APR.2012.006, 2012.
Vasconcellos, P. C., Balasubramanian, R., Bruns, R. E., Sanchez-Ccoyllo, O., Andrade, M. F., and Flues, M.: Water-soluble ions and trace metals in airborne particles over urban areas of the state of São Paulo, Brazil: Influences of local sources and long range transport, Water. Air. Soil Pollut., 186, 63–73, https://doi.org/10.1007/s11270-007-9465-2, 2007.
Vasconcellos, P. C., Souza, D. Z., Ávila, S. G., Araújo, M. P., Naoto, E., Nascimento, K. H., Cavalcante, F. S., Dos, M., Smichowski, P., and Behrentz, E.: Comparative study of the atmospheric chemical composition of three South American cities, Atmos. Environ., 45, 5770–5777, https://doi.org/10.1016/j.atmosenv.2011.07.018, 2011.
Victoria, J., Amaya, A., Rangel, H., Viveros, C., Cassalett, C., Carbonell, J., Quintero, R., Cruz, R., Isaacs, C., Larrahondo, J., Moreno, C., Palma, A., Posada, C., Villegas, F., and Gómez, L.: Características agronómicas y de productividad de la variedad Cenicaña Colombiana Cenicaña, Cali, 90 pp., https://www.cenicana.org/pdf_privado/serie_tecnica/st_30/st_30.pdf (last access: 21 June 2022), 2002.
Villalobos, A. M., Barraza, F., Jorquera, H., and Schauer, J. J.: Chemical speciation and source apportionment of fine particulate matter in Santiago, Chile, 2013, Sci. Total Environ., 512–513, 133–142, https://doi.org/10.1016/j.scitotenv.2015.01.006, 2015.
Wadinga Fomba, K., Deabji, N., El Islam Barcha, S., Ouchen, I., Mehdi Elbaramoussi, E., Cherkaoui El Moursli, R., Harnafi, M., El Hajjaji, S., Mellouki, A., and Herrmann, H.: Application of TXRF in monitoring trace metals in particulate matter and cloud water, Atmos. Meas. Tech., 13, 4773–4790, https://doi.org/10.5194/amt-13-4773-2020, 2020.
Wagner, R., Jähn, M., and Schepanski, K.: Wildfires as a source of airborne mineral dust – Revisiting a conceptual model using large-eddy simulation (LES), Atmos. Chem. Phys., 18, 11863–11884, https://doi.org/10.5194/acp-18-11863-2018, 2018.
Wang, Y., Yang, F., Li, X., Tian, M., and Hopke, P. K.: On the source contribution to Beijing PM2.5 concentrations, Atmos. Environ., 134, 84–95, https://doi.org/10.1016/j.atmosenv.2016.03.047, 2016.
WHO Regional Office for Europe: Air quality guidelines for Europe, World Health Organization, Copenhagen, Denmark, 457–465, https://doi.org/10.1525/9780520948068-070, 2020.
World Health Organization: Review of evidence on health aspects of air pollution – REVIHAAP Project. http://www.euro.who.int/_data/assets/pdf_file/0004/193108/REVIHAAP-Final-technical-report-final-version.pdf (last access: 20 June 2022), 2013.
World Health Organization: WHO global air quality guidelines: particulate matter (PM2.5 and PM10), ozone, nitrogen dioxide, sulfur dioxide and carbon monoxide, World Health Organization, https://www.who.int/publications/i/item/9789240034228 (last access: 22 February 2022), 2021.
Wu, C. and Zhen Yu, J.: Evaluation of linear regression techniques for atmospheric applications: The importance of appropriate weighting, Atmos. Meas. Tech., 11, 1233–1250, https://doi.org/10.5194/amt-11-1233-2018, 2018.
Xue, J., Lau, A. K. H., and Yu, J. Z.: A study of acidity on PM2.5 in Hong Kong using online ionic chemical composition measurements, Atmos. Environ., 45, 7081–7088, https://doi.org/10.1016/j.atmosenv.2011.09.040, 2011.
Yadav, I. C. and Devi, N. L.: Biomass burning, regional air quality, and climate change, in: Earth Systems and Environmental Sciences, edited by: Nriagu, J., Elsevier Inc., Waltham, 386–391, https://doi.org/10.1016/B978-0-12-409548-9.11022-X, 2019.
Yadav, S., Tandon, A., and Attri, A. K.: Monthly and seasonal variations in aerosol associated n-alkane profiles in relation to meteorological parameters in New Delhi, India, Aerosol Air Qual. Res., 13, 287–300, https://doi.org/10.4209/aaqr.2012.01.0004, 2013.
Yan, J., Wang, L., Fu, P. P., and Yu, H.: Photomutagenicity of 16 polycyclic aromatic hydrocarbons from the US EPA priority pollutant list, Mutat. Res.-Genet. Toxicol. Environ. Mutagen., 557, 99–108, https://doi.org/10.1016/j.mrgentox.2003.10.004, 2004.
Yunker, M. B., Macdonald, R. W., Vingarzan, R., Mitchell, H., Goyette, D., and Sylvestre, S.: PAHs in the Fraser River basin: a critical appraisal of PAH ratios as indicators of PAH source and composition, Org. Geochem., 33, 489–515, https://doi.org/10.1016/S0146-6380(02)00002-5, 2002.