the Creative Commons Attribution 4.0 License.
the Creative Commons Attribution 4.0 License.
 | 06 Feb 2020
Characterization of aerosol particles at Cabo Verde close to sea level and at the cloud level – Part 1: Particle number size distribution, cloud condensation nuclei and their origins
Heike Wex
Jens Voigtländer
Khanneh Wadinga Fomba
Kay Weinhold
Manuela van Pinxteren
Silvia Henning
Thomas Müller
Hartmut Herrmann
Frank Stratmann
In the framework of the MarParCloud (Marine biological production, organic aerosol particles and marine clouds: a Process Chain) project, measurements were carried out on the islands of Cabo Verde (a.k.a. Cape Verde) to investigate the abundance, properties and sources of aerosol particles in general, and cloud condensation nuclei (CCN) in particular, both close to sea level and at the cloud level.
A thorough comparison of particle number concentration (PNC), particle number size distribution (PNSD) and CCN number concentration (NCCN) at the Cape Verde Atmospheric Observatory (CVAO, sea-level station) and Monte Verde (MV, cloud-level station) reveals that during times without clouds the aerosols at CVAO and MV are similar and the boundary layer is generally well mixed. Therefore, data obtained at CVAO can be used to describe the aerosol particles at cloud level. Cloud events were observed at MV during roughly 58 % of the time, and during these events a large fraction of particles was activated to cloud droplets.
A trimodal parameterization method was deployed to characterize PNC at CVAO. Based on number concentrations in different aerosol modes, four well-separable types of PNSDs were found, which were named the marine type, mixture type, dust type1 and dust type2. Aerosol particles differ depending on their origins. When the air masses came from the Atlantic Ocean, sea spray can be assumed to be one source for particles besides new particle formation. For these air masses, PNSDs featured the lowest number concentration in Aitken, accumulation and coarse modes. Particle number concentrations for sea spray aerosol (SSA, i.e., the coarse mode for these air masses) accounted for about 3.7 % of NCCN,0.30 % (CCN number concentration at 0.30 % supersaturation) and about 1.1 % to 4.4 % of Ntotal (total particle number concentration). When the air masses came from the Sahara, we observed enhanced Aitken, accumulation and coarse mode particle number concentrations and overall increased NCCN; NCCN,0.30 % during the strongest observed dust periods is about 2.5 times higher than that during marine periods. However, the particle hygroscopicity parameter κ for these two most different periods shows no significant difference and is generally similar, independent of air mass.
Overall, κ averaged 0.28, suggesting the presence of organic material in particles. This is consistent with previous model work and field measurements. There is a slight increase in κ with increasing particle size, indicating the addition of soluble, likely inorganic, material during cloud processing.
- Article
(11325 KB) - Companion paper
-
Supplement
(11758 KB) - BibTeX
- EndNote


Clouds in the atmosphere are formed when excess water vapor condenses on aerosol particles that serve as cloud condensation nuclei (CCN). Back in the 1970s, Twomey (1974) described that an increase in the number of aerosol particles that activate to clouds led to more but smaller droplets. Albrecht (1989) suggested that smaller droplets then cause suppression in the formation of precipitation, leading to a prolonged cloud lifetime. Both of these effects enhance the shortwave reflection of clouds, i.e., they lead to a cooling of the atmosphere. In particular, warm low-level clouds located in the boundary layer constitute an important role in the cooling effects due to their abundance and strong cloud albedo effect (Christensen et al., 2016). In recent years, many more aspects of aerosol–cloud interactions were discussed. Considerable progress has been made in understanding the chemical composition and microphysical properties of aerosol particles that enable them to act as CCN (Andreae and Rosenfeld, 2008). The ability of particles to act as CCN is largely controlled by aerosol particle size rather than composition (Dusek et al., 2006). However, we still lack understanding of the overall roles of aerosol particles, clouds and their interactions in the climate system, which contribute to the largest uncertainties to estimate the Earth's energy budget (Stocker, 2014).
Mineral dust from deserts contributes largely to tropospheric aerosols and impacts the air quality of several regions, even of the globe (Ginoux et al., 2001; Huang et al., 2006; Tanaka and Chiba, 2006). The largest dust source is located in the Northern Hemisphere in the Sahara and Sahel regions (Goudie and Middleton, 2001; Prospero et al., 2002; Ginoux et al., 2012), with millions of tonnes of mineral dust being transported to Europe and the Middle East, as well as to the Americas, yearly (including the Caribbean and the Amazon basin) (Swap et al., 1992; Salvador et al., 2013; Wex et al., 2016). Mineral dust aerosol in the atmosphere can affect the Earth's radiative budget by directly scattering and absorbing solar and infrared radiation (Goudie and Middleton, 2001; Shao et al., 2011). On the other hand, it can modify cloud properties, i.e., serve as CCN or ice-nucleating particles (INPs) (Sassen et al., 2003; DeMott et al., 2003). Karydis et al. (2011) found that the predicted annual average contribution of insoluble mineral dust to CCN number concentration in cloud-forming areas is up to 40 % over northern Africa and Asia (Arabian Peninsula and Gobi Desert).
Based on a 3-week field campaign in summer 1973 at Cabo Verde, Jaenicke and Schütz (1978) investigated the aerosol properties, such as total size distribution, mass, sea salt, mineral and organic compound content, and found that a total mass of 100 µg m−3 during dust plumes is 5 times higher than the 20 µg m−3 of clean air masses. Kandler et al. (2011b) also found that the total particle mass concentration during dust plumes was raised by a factor of more than 10 over the maritime mass concentration, demonstrating a strong impact of Saharan dust advection on the aerosol load at Cabo Verde. Significant seasonal intrusions of dust from northwest Africa affect Cabo Verde at surface level from October till March. An hourly PM10 value reached up to 710 µg m−3 at surface level at Cabo Verde (Gama et al., 2015). Schladitz et al. (2011b) found that mineral dust particles were mainly in the coarse mode. The variation in the amount of mineral dust is much larger than the variation in the sea salt content in the coarse mode. Also pesticides, polycyclic aromatic hydrocarbons (PAHs), and polychlorinated biphenyl (PCB), all of which originate from the Sahara and Sahel regions, can be incorporated with Saharan dust and then transported to Cabo Verde (Garrison et al., 2014).
Many studies investigated the marine aerosol in laboratory or in field measurements, but few of them were carried out at Cabo Verde or nearby regions. Due to the vast coverage of the Earth's surface by the oceans, wind-driven particle production on the ocean surface is one of the largest global sources of primary atmospheric particle on a mass concentration basis (Warneck, 1999; Modini et al., 2015). Together with newly formed particles originating from gaseous precursors which can also be emitted from the ocean, this sea spray aerosol (SSA) contributes to marine aerosols. Ambient measurements and laboratory studies indicated that the resulting marine aerosol with less than 10 µm diameter can have a trimodal size distribution, which suggests that several mechanisms are involved in marine aerosol production (Prather et al., 2013; Quinn et al., 2015; Brooks and Thornton, 2018). Marine aerosol number and mass concentrations, chemical composition, and optical and cloud-nucleating properties can be changed during transportation, e.g., marine aerosol can carry continental emissions up to thousands of kilometers downwind (Quinn et al., 2015). Marine aerosol impacts Earth's radiation balance by directly scattering solar radiation (Quinn et al., 2017). Ocean physics, biology and chemistry ultimately control both particle hygroscopicity (Fuentes et al., 2011) and the number of particles that can act as CCN and INPs (Andreae and Rosenfeld, 2008; Wilson et al., 2015; DeMott et al., 2016) in the marine aerosol. On a global basis, SSA makes a contribution of less than 30 % to the CCN population (Quinn et al., 2017).
Marine aerosol is the second important aerosol source at Cabo Verde when looking at particle mass (Fomba et al., 2014; Salvador et al., 2016). There is always a background of marine aerosol present at Cabo Verde (Kandler et al., 2011a). Based on a 5-year measurement at Cabo Verde, Fomba et al. (2014) found that the mean mass concentration of sea salt was 11.00±5.10 µg m−3 (corresponding to total mass of 47.20±55.50 µg m−3). Additionally during summer, elevated concentrations of organic material were observed to originate from marine emissions. A summer maximum was observed for non-sea-salt sulfate, and it was connected to periods when air mass inflow was predominantly of marine origin, indicating that marine biogenic emissions were a significant source. Schladitz et al. (2011b) found that the Aitken mode and accumulation mode particles were mainly composed of marine aerosol, whereas coarse mode particles were composed of sea salt and a variable fraction of Saharan mineral dust.
As outlined above, Saharan dust and sea salt dominate PM10 particle composition (more than 70 %) near the surface at Cabo Verde (Fomba et al., 2014; Salvador et al., 2016). In addition, Cabo Verde is rich in other kinds of aerosols from both continental and marine sources. Biomass burning aerosols produced from October to November in sub-Sahelian latitudes had a clear influence on the content of elemental carbon (EC) recorded at Cabo Verde but a small impact on PM10 (Salvador et al., 2016), as particles originating from the biomass burning layer usually stay at high altitude (1500–5000 m) (Tesche et al., 2009; Heinold et al., 2011; Lieke et al., 2011).
Overall, there are diverse sources of less or more hygroscopic particles which might contribute to aerosols at Cabo Verde. Pringle et al. (2010) used an atmospheric chemistry model to simulate global fields of the effective hygroscopicity parameter, represented by κ (Petters and Kreidenweis, 2007), which roughly describes the influence of chemical composition on CCN activity of aerosol particles. An annual cycle of monthly-mean κ values at the surface of Cabo Verde was reported in Pringle et al. (2010). The only field measurement of particle hygroscopicity at Cabo Verde was carried out by Schladitz et al. (2011a). Here, these model results and field measurement values will be compared with those obtained from in situ measurements during our measurement campaign in the framework of the MarParCloud (Marine biological production, organic aerosol particles and marine clouds: a Process Chain) project.
The atmospheric boundary layer (ABL) is the region in the lowest part of the troposphere (below 1000 m above the ground) where the Earth's surface strongly influences temperature, moisture and wind through the turbulent transfer of air masses. Most particles are emitted or formed in the ABL with temporally varying sources (Rosati et al., 2016b). Extensive data sets from ground-based aerosol property studies are available. One major point of interest is to know whether ground-based measurements can be used to infer aerosol properties at cloud level. Previous field measurements at Po Valley and the Netherlands found that during the development of a newly mixed layer the estimation of altitude-specific data from surface measurements may be problematic (Rosati et al., 2016a, b). Once the ABL was fully mixed, a constant extinction coefficient (Rosati et al., 2016b) and particle hygroscopicity (Rosati et al., 2016a) were observed at all altitudes within the ABL. Wex et al. (2016) found, for marine aerosol on Barbados, that the particle number size distribution (PNSD) on the ground and throughout the subcloud level showed good agreement.
During the MarParCloud project, we set up two measurement stations, one close to the sea level (10 m a.s.l.) and one on a mountaintop (744 m a.s.l.), to characterize aerosol properties, including particle number concentration (PNC), PNSD and CCN number concentration (NCCN). In addition, a measurement from a kite and balloon (Helikite) was carried out to characterize vertical profiles of meteorological parameters at Cabo Verde. This offered a unique opportunity to compare particle properties close to the sea level and higher up in the marine boundary layer (MBL).
In a series of companion papers (Gong et al., 2020), we aim to provide a quantitative understanding regarding the abundance, properties and source of aerosol particles in general, and CCN and INPs in particular, close to both sea-level and cloud-level heights. In this paper, we will (1) compare aerosol properties measured close to sea level and at a mountaintop to examine the representativeness of ground-based measurements to the MBL and (2) present a thorough characterization of CCN with respect to their hygroscopicity and number concentrations for different air masses. Both of these will be presented here for the Cabo Verde for the first time. In a companion paper, we will examine the abundance and properties of INPs from several different sources, namely sea surface microlayer and under layer water from the ocean, airborne close to sea and cloud level, and cloud water of warm cloud. This study is the first in a series of publications to come from the MarParCloud project. For more information about the campaign itself and a more detailed analysis of the meteorological situation, we refer the reader to the overview paper (van Pinxteren et al., 2019), which will also cover a thorough size-resolved chemical composition analysis of particles close to the sea level and on the mountaintop.
2.1 Sampling sites and campaign setup
The measurements were carried out on São Vicente island in Cabo Verde from 13 September to 13 October 2017. Located in the Atlantic Ocean, São Vicente island is ∼900 km off the African coast. The region experiences constant northeasterly winds. The average annual temperature at Cabo Verde is 23.6±4.0 ∘C (mean ±1 standard deviation). It is an arid region with a maximum of 24–350 mm rainfall per year. The precipitation frequency is about 3 to 10 events annually, mainly between August and October (Carpenter et al., 2010; Fomba et al., 2013). More details of the meteorological conditions at Cabo Verde can be found in Carpenter et al. (2010).
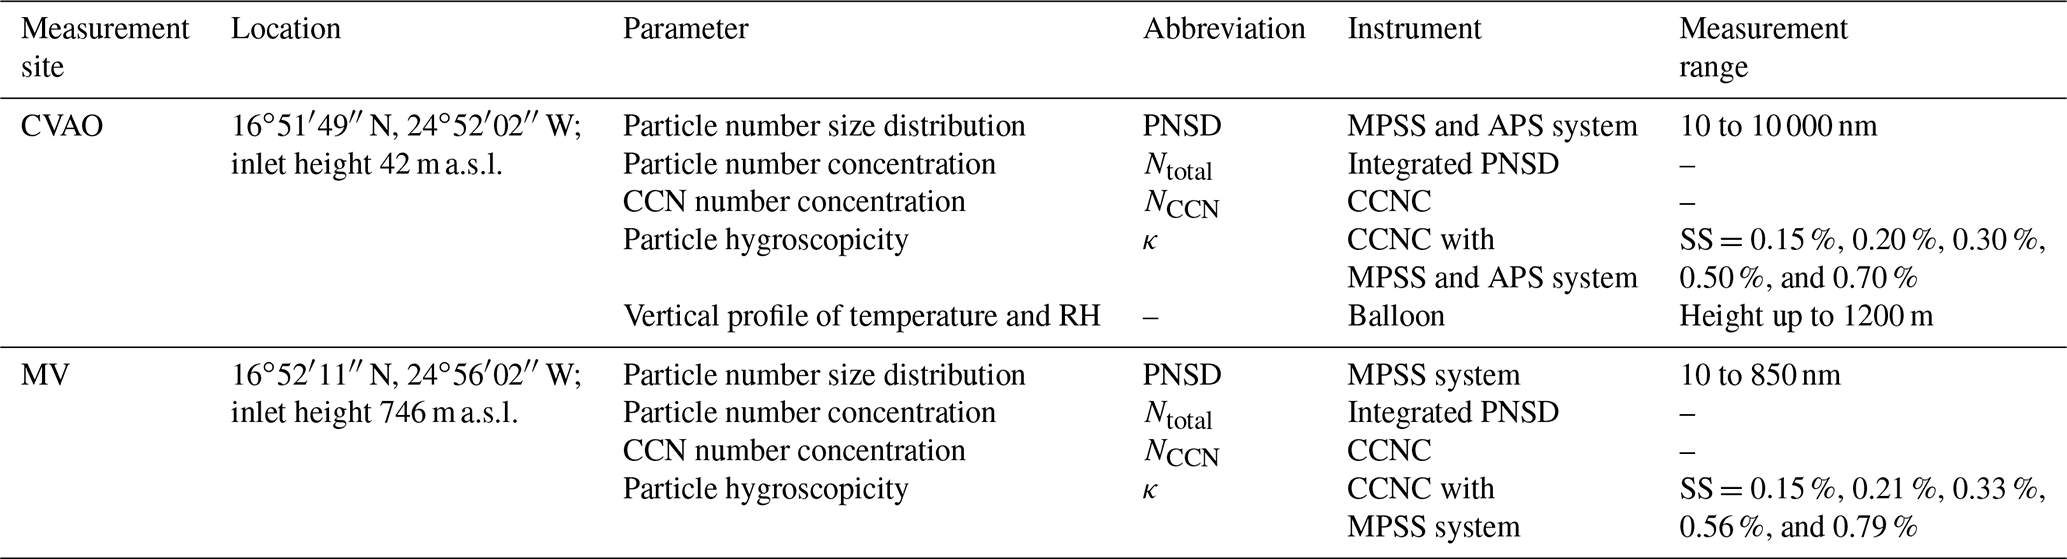
Three measurement stations were set up at Cabo Verde, i.e., Cape Verde Atmospheric Observatory (CVAO), Monte Verde station (MV) and an ocean station (OS, this station will be discussed only in the companion paper). CVAO ( N, W) is located at the northeastern shore of the São Vicente island, 70 m from the coastline at about 10 m a.s.l. An aerosol PM10 inlet, employed to remove particles larger than 10 µm in aerodynamic diameter, was installed on top of a 32 m tower. Downstream of the aerosol inlet there was a vertical stainless-steel sampling pipe (32 m long, 1∕2 in. outer diameter), installed together with a diffusion dryer, which was placed directly on top of the measurement container. Aerosol entered the inlet on top of the mast and was transported through the tube and the dryer. Downstream of the dryer and inside of the container, the aerosol was split isokinetically and distributed to various instruments, including a mobility particle sizer spectrometer (MPSS), an aerodynamic particle sizer (APS) and a cloud condensation nuclei counter (CCNC). Besides, airborne measurements were carried out at CVAO using a Helikite to characterize the vertical profiles of temperature, relative humility (RH), and wind speed and direction. MV ( N, W) is located on the top of Monte Verde (744 m a.s.l.), ∼7 km away to the west of CVAO. An aerosol inlet was installed on the roof of a building, which overall had a cut-off size of 4 µm. A vertical stainless-steel sampling pipe (2 m long, 1 in. diameter) and a diffusion dryer were placed downstream of the aerosol inlet. Downstream of the dryer and inside the building, the sample aerosol was split isokinetically to an MPSS and CCNC. An overview of the sampling site and instruments is given in Table 1. In the following, we will briefly introduce the different measurement techniques applied in this study, including calibrations, measurements and data processing.
Table 1Measured and derived parameters and the respective instrumentation used at CVAO and MV. Note, SS represents supersaturation.
2.2 Balloon measurements
The vertical profile of meteorological parameters was taken at CVAO. The measurements were achieved using a 16 m3 Helikite (Allsopp Helikites Ltd, Hampshire, UK), a unique combination of a tethered balloon and a kite. Helikites are designed to be operated under extreme weather conditions. The kite was attached to a 3 mm Dyneema rope (2000 m long, ∼4.6 g m−1, Lyros D-Pro 3 mm, breaking load 950 daN, working elongation <1 %) and operated by a winch. Under calm conditions, the Helikite has a net load capacity of ∼8 kg. Under windy condition, the pull increases significantly, and the net load capacity reaches about 16 kg at 6 m s−1. Depending on the prevailing conditions, meteorological measurements of up to an altitude of about 1200 m could be carried out. The measuring system, built by the Leibniz Institute for Tropospheric Research (TROPOS), was attached to the rope 20 m below the Helikite. All sensors were selected and tested individually in the laboratory at TROPOS. Wind speed was measured using a differential pressure sensor together with a pitot tube; wind direction was determined from an orientation sensor (compass) of a wind vane. Data were recorded with a measuring frequency of 2 Hz, stored in a Secure Digital memory card and additionally transmitted to a ground station (via Digi XBee radio modules). Our aim was to characterize the atmospheric boundary layer in terms of mixing state, which can provide insights into uncertainties regarding the connection between ground-based measurements and the free troposphere.
2.3 Particle number size distribution
PNSDs were measured in the size range from 10 nm to 10 µm using a TROPOS-type MPSS (Wiedensohler et al., 2012) and an APS (aerodynamic particle sizer, model 3321, TSI Inc., St. Paul, MN, USA). The APS data accounted for the multiple charge correction of MPSS data in the inversion of measured PNSD (Wiedensohler, 1988; Pfeifer et al., 2016). The combined PNSD is then given on the basis of the volume equivalent particle diameter. More details about the combined MPSS and APS PNSDs can be found in the Supplement and Schladitz et al. (2011b). Size-dependent particle losses caused by diffusion, deposition and sedimentation within the inlet were corrected for by utilizing the empirical particle loss calculator (von der Weiden et al., 2009). The size-dependent particle losses are shown in the Supplement, Fig. S1. Total particle number concentrations (Ntotal) were calculated from the measured PNSDs accounting for the size-dependent particle losses. The MPSS and APS were calibrated before, during and after the intensive field study. Overall, fewer than 3 % of the particles were lost when passing the inlet. More details about calibration methods can be found in Wiedensohler et al. (2018).
2.4 Cloud condensation nuclei
NCCN was measured using a cloud condensation nuclei counter (CCNC, Droplet Measurement Technologies, Boulder, USA; Roberts and Nenes, 2005). The CCNC is a cylindrical continuous-flow thermal-gradient diffusion chamber, establishing a constant streamwise temperature gradient to adjust a quasi constant centerline supersaturation. The sampled aerosol particles are guided within a sheath flow through this chamber and can become activated to droplets, depending on the supersaturation level and the ability of the particles to act as CCN.
During our study, the supersaturation was varied between ∼0.15 % and ∼0.79 % at a constant total flow rate of 0.5 L min−1. To ensure stable column temperature, the first 5 min and the last 30 s of each 12 min long measurement at each supersaturation were excluded from the data analysis. The remaining data points were averaged. A supersaturation calibration (following the protocol by Gysel and Stratmann, 2013) was done at the cloud laboratory of the TROPOS prior to and after the measurement campaign in order to determine the relationship between the temperature gradient along the column and the effective supersaturation. Calibrated supersaturation set points were 0.15 %, 0.20 %, 0.30 %, 0.50 % and 0.70 % of CVAO CCNC and 0.15 %, 0.21 %, 0.33 %, 0.56 %, and 0.79 % of MV CCNC. These values were used for further calculations.
According to Köhler theory (Köhler, 1936), whether or not a particle can act as a CCN depends on its dry size, chemical composition and the maximum supersaturation it encounters. Petters and Kreidenweis (2007) presented a method to describe the relationship between particle dry diameter and CCN activity using the hygroscopicity parameter κ; κ values reported in this study were calculated as follows, assuming the surface tension of the examined solution droplets, σs∕α, to be that of pure water:
with
where dcrit is the critical diameter above which all particles activate into cloud droplets for a given supersaturation. S is the supersaturation. Mω and ρω are the molar mass and density of water, respectively, and R and T are the ideal gas constant and the absolute temperature, respectively. To derive dcrit, simultaneously measured NCCN and PNSD are used. Therefore, it is assumed that all particles in the neighborhood of a given particle diameter have a similar κ, meaning that the aerosol particles are internally mixed. At a given supersaturation, a particle can be activated to a droplet once its dry size is equal to or larger than dcrit. Therefore, dcrit is the diameter at which NCCN is equal to the value of the cumulative particle number concentration, determined via integration from the upper towards the lower end of the PNSD. Values for κ can be calculated with dcrit and the corresponding supersaturation based on Eq. (1). The inferred κ values correspond to particles with sizes of roughly dcrit. The uncertainty in κ, which results from uncertainties of the PNSD measurements and the supersaturations of the CCNC, was determined by applying a Monte Carlo simulation (MCS) in a similar fashion as done by Kristensen et al. (2016) and Herenz et al. (2018). A detailed description of this method is provided in the Supplement. Note that the particle losses inside the CCNC (discussed in Rose et al., 2008) were also considered before κ was calculated.
3.1 Overview of the meteorology
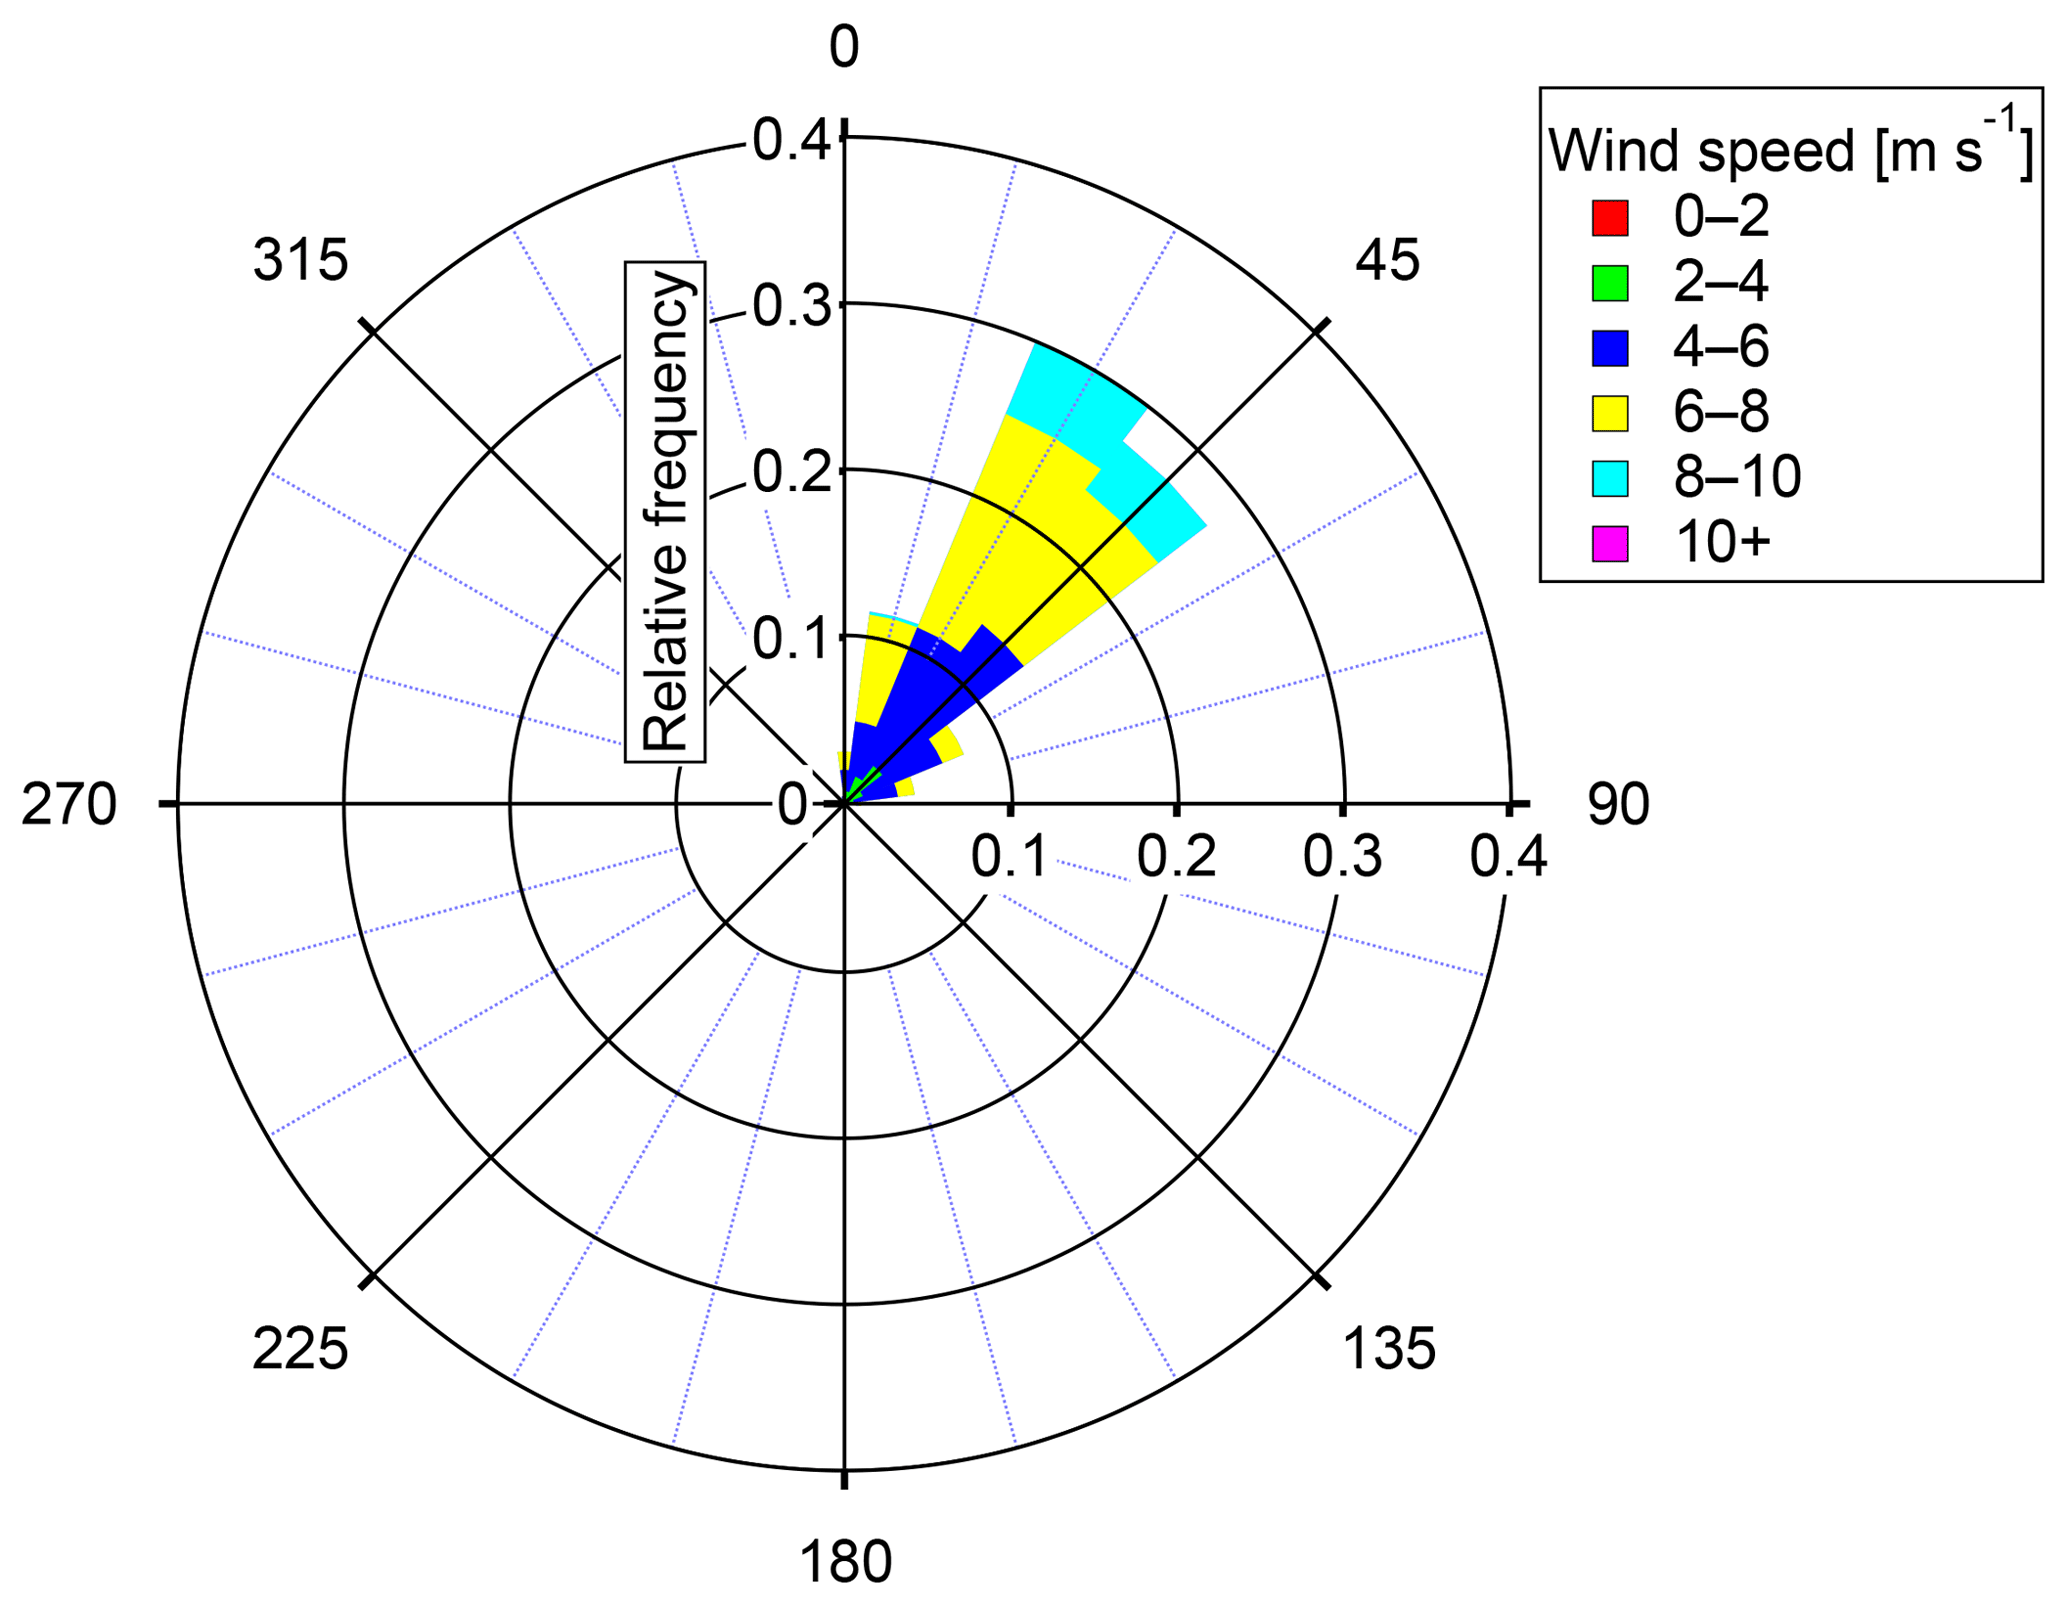
Time series of meteorological parameters, including the wind speed, temperature and RH at CVAO and MV, as well as wind direction at CVAO, are shown in Fig. 1. The wind speed varied from 0.6 to 9.7 m s−1, with a mean of 6.0 m s−1 at CVAO. The variation in wind speed at MV is similar to that at CVAO. Figure 2 shows the wind rose plot based on hourly average of wind speed and direction at CVAO. Clearly, the CVAO station experienced constant northeasterly winds during this campaign. The temperature and RH were measured by a digital temperature and humidity sensor (Davis Instruments, 7346.070). The accuracy of the temperature sensor is ±0.3 ∘C; the accuracy of the humidity sensor is ±2 % below 90 % and ±4 % above 90 %. The temperature and RH at CVAO varied from 25.6 to 28.3 ∘C and 70.0 % to 90.5 %, with means of 26.6 ∘C and 81.0 %, respectively. Obviously, temperature at MV was lower than that at CVAO, ranging from 18.9 to 25.4 ∘C, with a mean of 21.2 ∘C. The measured RH was 100 % during more than half of the campaign at MV. Note that due to the instrument detection limit, RH =100 % is not accurate. However, the RH =100 % result indicates that the MV station was often in a cap cloud. More precise determination of cloud events and influences of cloud on aerosol particles will be discussed in Sect. 3.3. Note that all the times presented here are in UTC (corresponding to LT+1). For better comparison, all PNC and NCCN data reported in this study are given for standard temperature and pressure (STP, 0 ∘C and 1013.25 hPa).
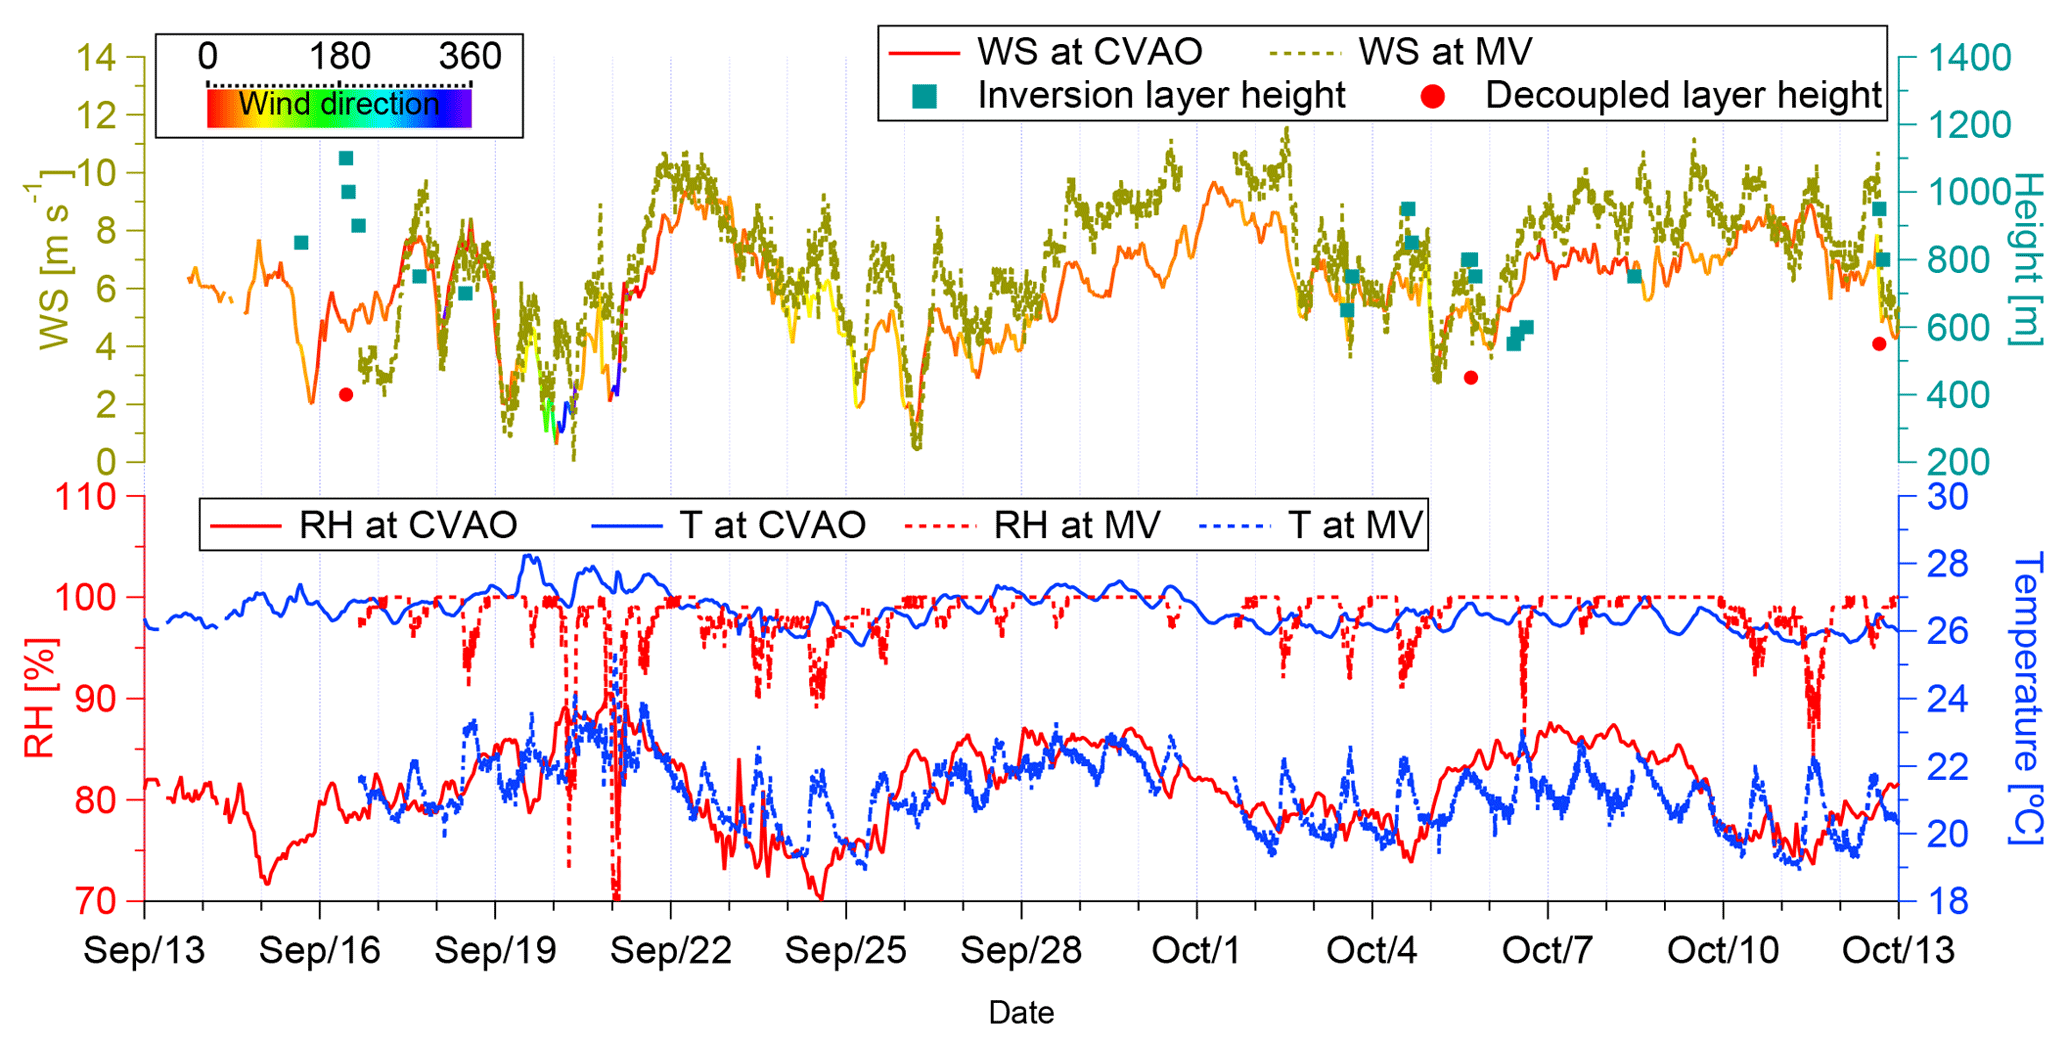
Figure 1Time series of wind speed (WS), wind direction (CVAO only), RH and temperature. Parameters measured at CVAO are shown by solid lines and at MV in dashed lines. Time series of inversion layer height are shown by blue squares and decoupled layer height in red dots.
During the MarParCloud campaign, 19 vertical profiles on 10 different days were taken. Profiles of up to about 1200 m could be measured. The inversion layer heights were determined by the measurements. The MBL was typically well mixed with boundary layer heights between about 550 and 1100 m, as shown by blue rectangles in Fig. 1. It is indicated that there were three cases of a decoupled boundary layer during the whole campaign, as shown by red dots in Fig. 1. Therefore, to be sure to represent aerosol collected at Cabo Verde, we used backward trajectories starting at 200 m altitude to represent MBL air mass origins in this study. Exemplary data from one balloon measurement can be found in the Supplement (Sect. S3).
3.2 Particle characterization
This section will first discuss PNSDs and PNC at CVAO. A well-known trimodal lognormal parameterization method is adopted to characterize the temporal variation in PNC in three modes. It is used to classify the particles into different types based on PNC in different modes. Lastly, to get insights into possible particle sources, we studied the air mass origin and transport through backward trajectory analysis. Calculations were performed with the HYSPLIT (HYbrid Single-Particle Lagrangian Integrated Trajectory) model (Stein et al., 2015; Rolph, 2003).
3.2.1 Particle number size distribution and concentration
Particle size is one of the most important parameters to characterize the atmospheric aerosol. Figure 3 presents contour plots for PNSDs of supermicron particles in Fig. 3a and submicron particles in Fig. 3b. In order to show details of supermicron particles, we adopted different color bar scales for submicron and supermicron particles. Most of the time, two submicron modes (Aitken and accumulation mode) and one supermicron mode (coarse mode) are observed. The Aitken mode is observed from ∼10 to ∼80 nm, and the accumulation mode is observed from ∼80 to ∼1000 nm. However, from 03:30 to 20:00 21 September and from 09:30 28 September to 18:30 30 September, the submicron particles only exhibited a unimodal distribution. The supermicron particles exhibited a high concentration during those periods. Ntotal was changed significantly, from ∼200 to ∼1500 cm−3 with a median of ∼700 cm−3, shown as black line in Fig. 3b.

Figure 3Contour plots for PNSDs of 1000 nm to 10 µm in panel (a) and 10 to 1000 nm in panel (b). The color scale indicates dN∕dlogDp in cubic centimeters (cm−3). Time series of Ntotal is shown by the black line in panel (b).
Particles of different sizes have different formation routes, sources and behaviors. To better define the modes of our data, we fitted the PNSDs to three lognormal functions. The lognormal distribution was expressed by Seinfeld and Pandis (2016), and the parameterization function is as follows:
where Ni is the total number concentration of the ith mode, Di is the geometric mean diameter of the ith mode and σi is the geometric standard deviation of the ith mode distribution. Every PNSD was individually parameterized by a trimodal distribution, where the number of i, , stands for Aitken, accumulation or coarse mode, receptively. For each PNSD, we searched for an optimal fitting function, until the coefficient of determination (R2) was larger than 0.97.
Time series of PNC in Aitken mode (NAitken), accumulation mode (Naccumulation) and coarse mode (Ncoarse), together with sum of Ni and measured Ntotal, are shown in Fig. 4. Due to the unimodal distribution of submicron particles from 03:30 to 20:00 21 September and from 09:30 28 September to 18:30 30 September, the trimodal lognormal fitting did not work properly, so we did a bimodal lognormal fitting instead, with one submicron mode (Nsubmicron, as shown by purple dots) and one coarse mode.
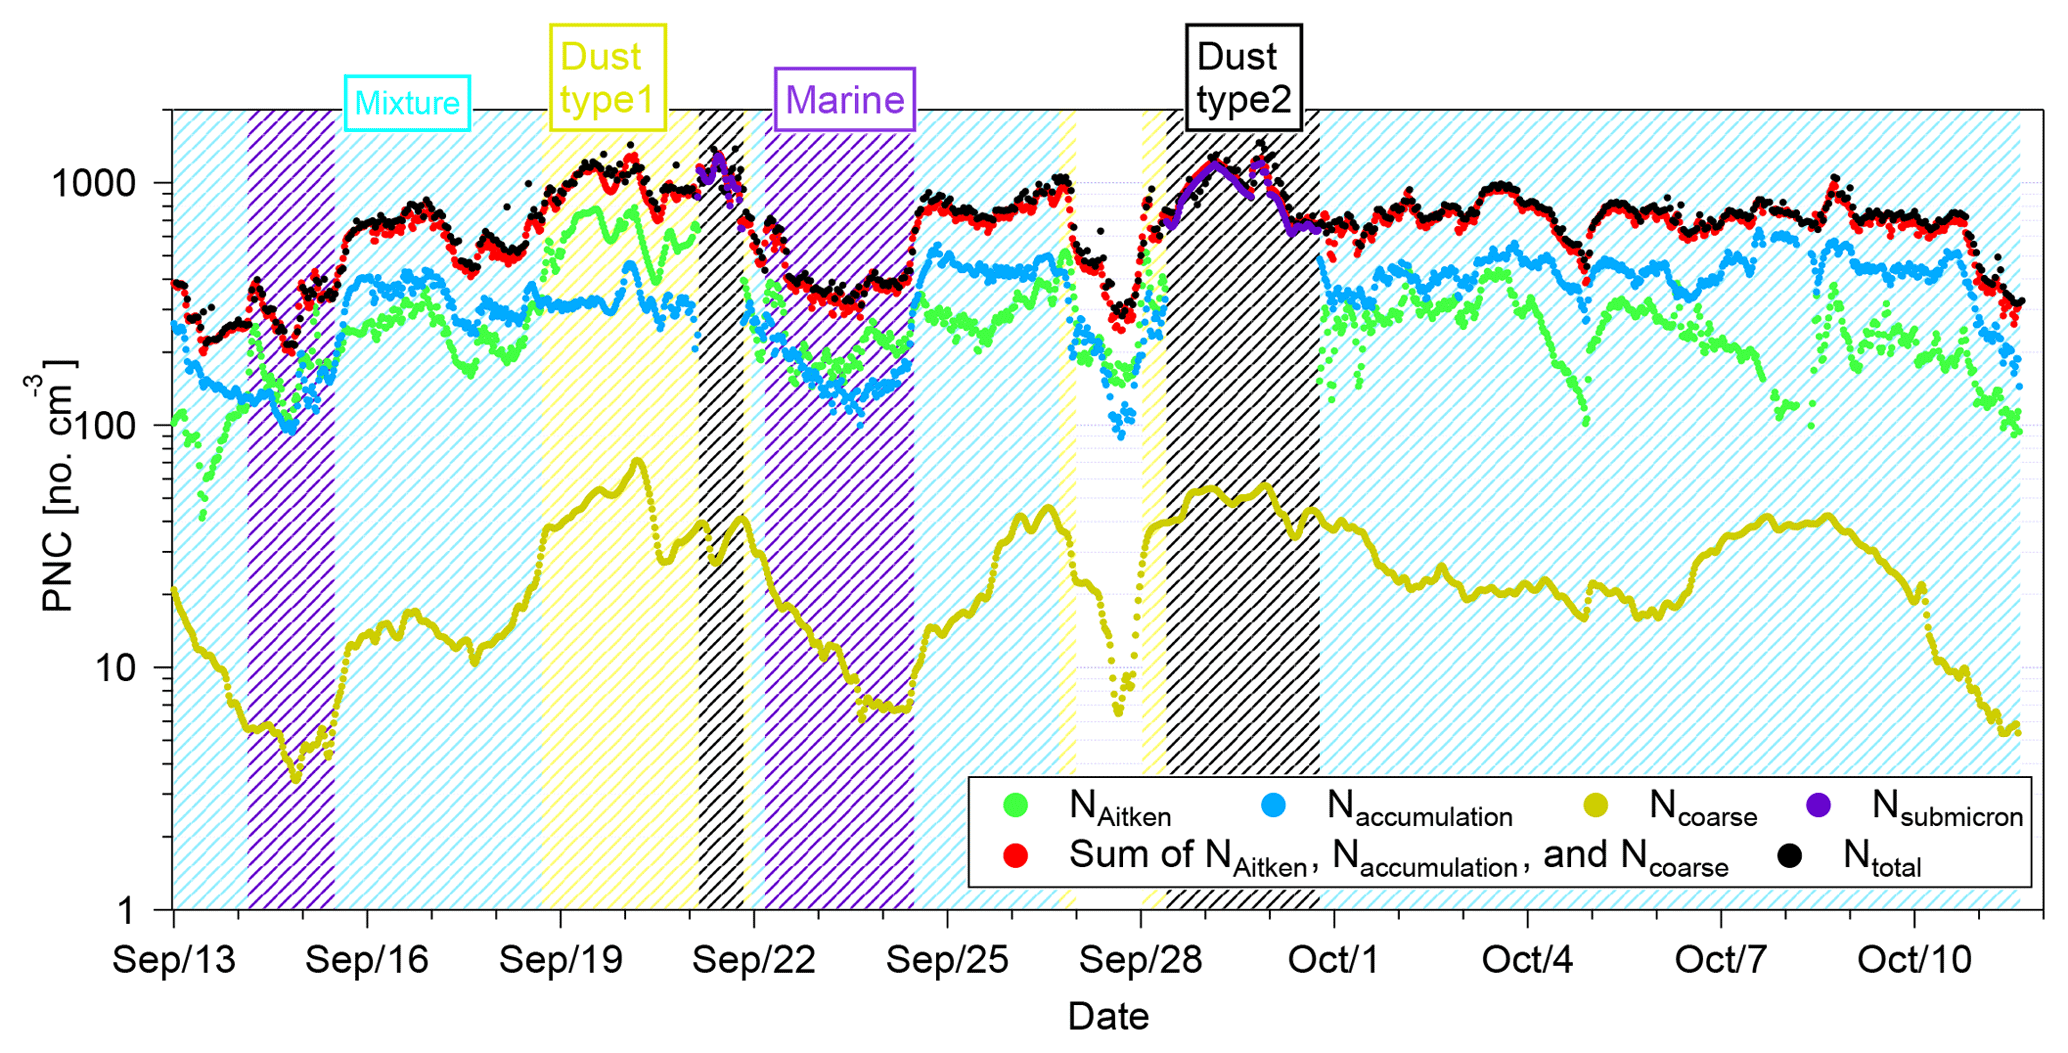
Figure 4Time series of NAitken, Naccumulation, Ncoarse, Nsubmicron, sum of Ni and Ntotal at CVAO. The different shading colors indicate different aerosol type periods.
PNC showed large variability during our measurement. NAitken and Naccumulation varied from 41 to 789 and 89 to 639 cm−3, with medians of 244 and 354 cm−3, respectively. Generally, Aitken mode particles are produced by homogeneous and heterogeneous nucleation processes, formed during natural gas-to-particle condensation. Aitken mode particles are transferred to the accumulation mode through cloud processing (Hoppel et al., 1994). And accumulation mode particles are furthermore formed by coagulation of smaller particles or condensation of vapors onto existing particles, during which they grow into that size range (Seinfeld and Pandis, 2016). Therefore, when Naccumulation is higher than NAitken, this indicates long-range transport and a more aged aerosol. Ncoarse varied from 3 to 71 cm−3, with a median of 21 cm−3. Coarse mode particles are mostly emitted to the atmosphere from natural sources, e.g., marine aerosol, mineral dust or biological materials.
3.2.2 Particle classification and origins
To better understand the particle sources and features, we divided the data from the campaign into different periods. An overview of the classification criteria and features of the different resulting aerosol types are summarized in Table 2. Details about the classification criteria are discussed in the Supplement. Classification results are shown as different background colors in Fig. 4. Note that from 00:00:00 27 September to 00:00:00 28 September, Ntotal suddenly decreased. This might due to the wet deposition that happened before the air masses arrived at the measurement site. The precipitation is an output parameter of the calculated NOAA HYSPLIT backward trajectories. From 00:00:00 27 September to 00:00:00 28 September, the total precipitation (sum of precipitation of 144 segment endpoints) exceeded a value of 7 mm in the past 144 h (corresponding to 6 d) of each backward trajectory history. Therefore, this period was not included in the aerosol classification.
Table 2Classification criteria and features of four different particle types.
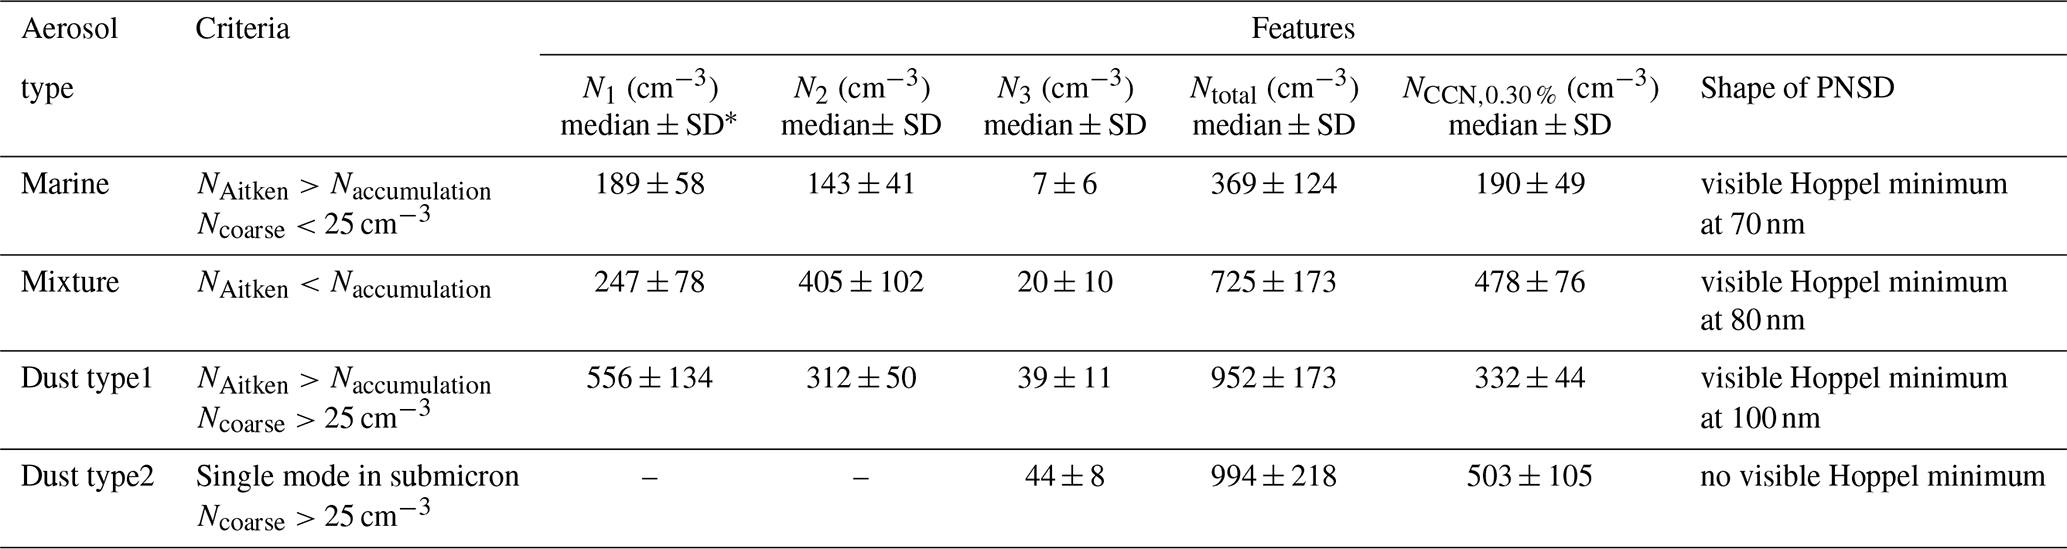
* 1 standard deviation
Figure 5 shows the median of PNSDs of the four different aerosol types, with a linear (top) and a logarithmic (bottom) scaling on the y axis. The error bar indicates the range between 25th and 75th percentiles. PNSDs which have NAitken larger than Naccumulation and Ncoarse<25 cm−3 are attributed to the “marine type” in this work. PNSDs resembling those show three modes, i.e., Aitken, accumulation and coarse modes, which can be clearly distinguished, as shown in blue lines in Fig. 5. For the separation of this marine type, trajectories were additionally examined. The marine type featured the lowest NAitken, Naccumulation and Ncoarse median values of 189, 143 and 7 cm−3, respectively. The minimum between the Aitken and accumulation mode of PNSDs (Hoppel minimum; see Hoppel et al., 1986) at roughly 70 nm indicates the sizes above which particles had previously been activated to cloud droplets during the history of the air mass at least once. When passing through a cloud, soluble material is added to the activated particles by aqueous-phase chemistry, increasing particulate mass and hence the size of those particles. The coarse mode particles can also be assumed to be sea spray aerosol (SSA) during the marine type period, as discussed in previous studies (Modini et al., 2015; Wex et al., 2016). A decent correlation (R2=0.69, p<0.01) was found between SSA number concentration and wind speed (Supplement, Fig. S6). Modini et al. (2015) also observed that SSA number concentration correlated with local wind speed, which is consistent with the fact that SSAs are generated from the process associated with the agitation of the sea surface by air moving above it. The SSA accounted for 1.1 % to 4.4 % of Ntotal at CVAO (wind speed from 4 to 10 m s−1), which is relatively low when comparing to Wex et al. (2016), who found the SSA particles contributed 4 % to 10 % of Ntotal (wind speed up to 14 m s−1) for the marine aerosol on Barbados. Figure 6 shows the 6 d backward trajectories with 1 h time resolution ending at 200 m above CVAO. Looking at Fig. 6a, which displays the marine periods, the backward trajectories clearly featured paths over the Atlantic Ocean and traveled to Cabo Verde. None of the backward trajectories touched the European or African continents.
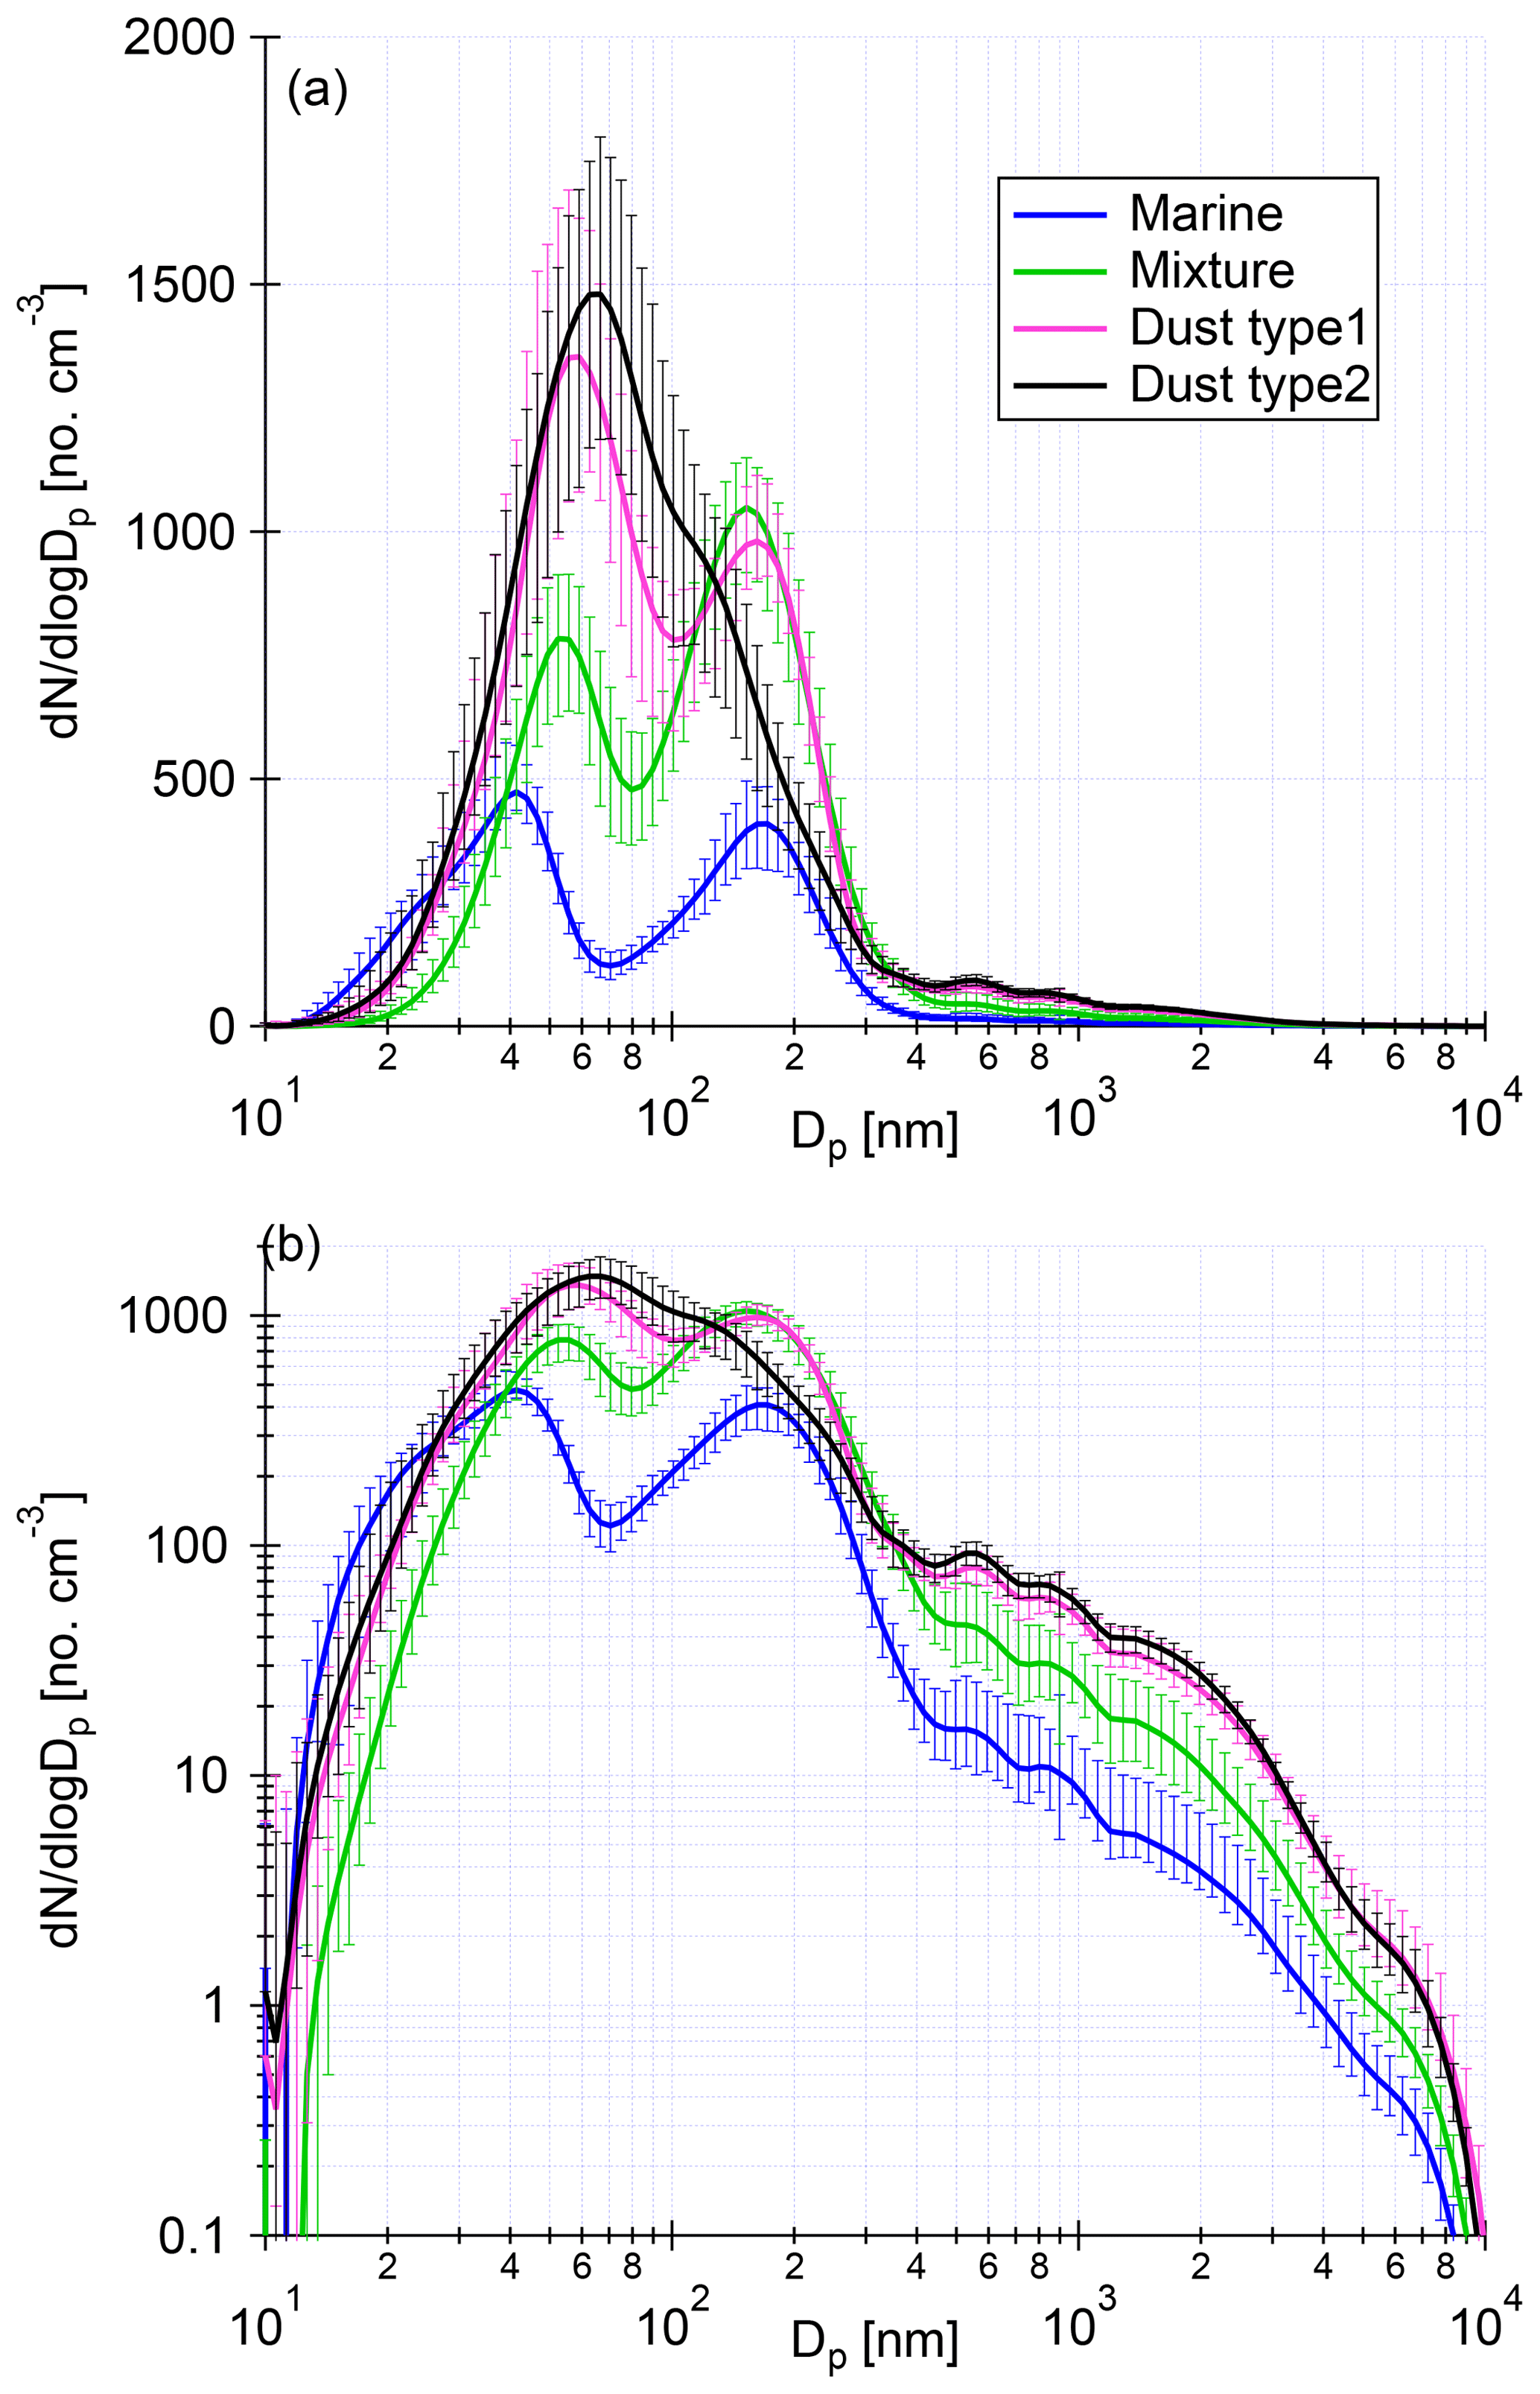
Figure 5The median of PNSDs of marine type (blue), mixture type (green), dust type1 (purple) and dust type2 (black), with a linear (a) and a logarithmic (b) scaling on the y axis. The error bar indicates the range between 25th and 75th percentiles.
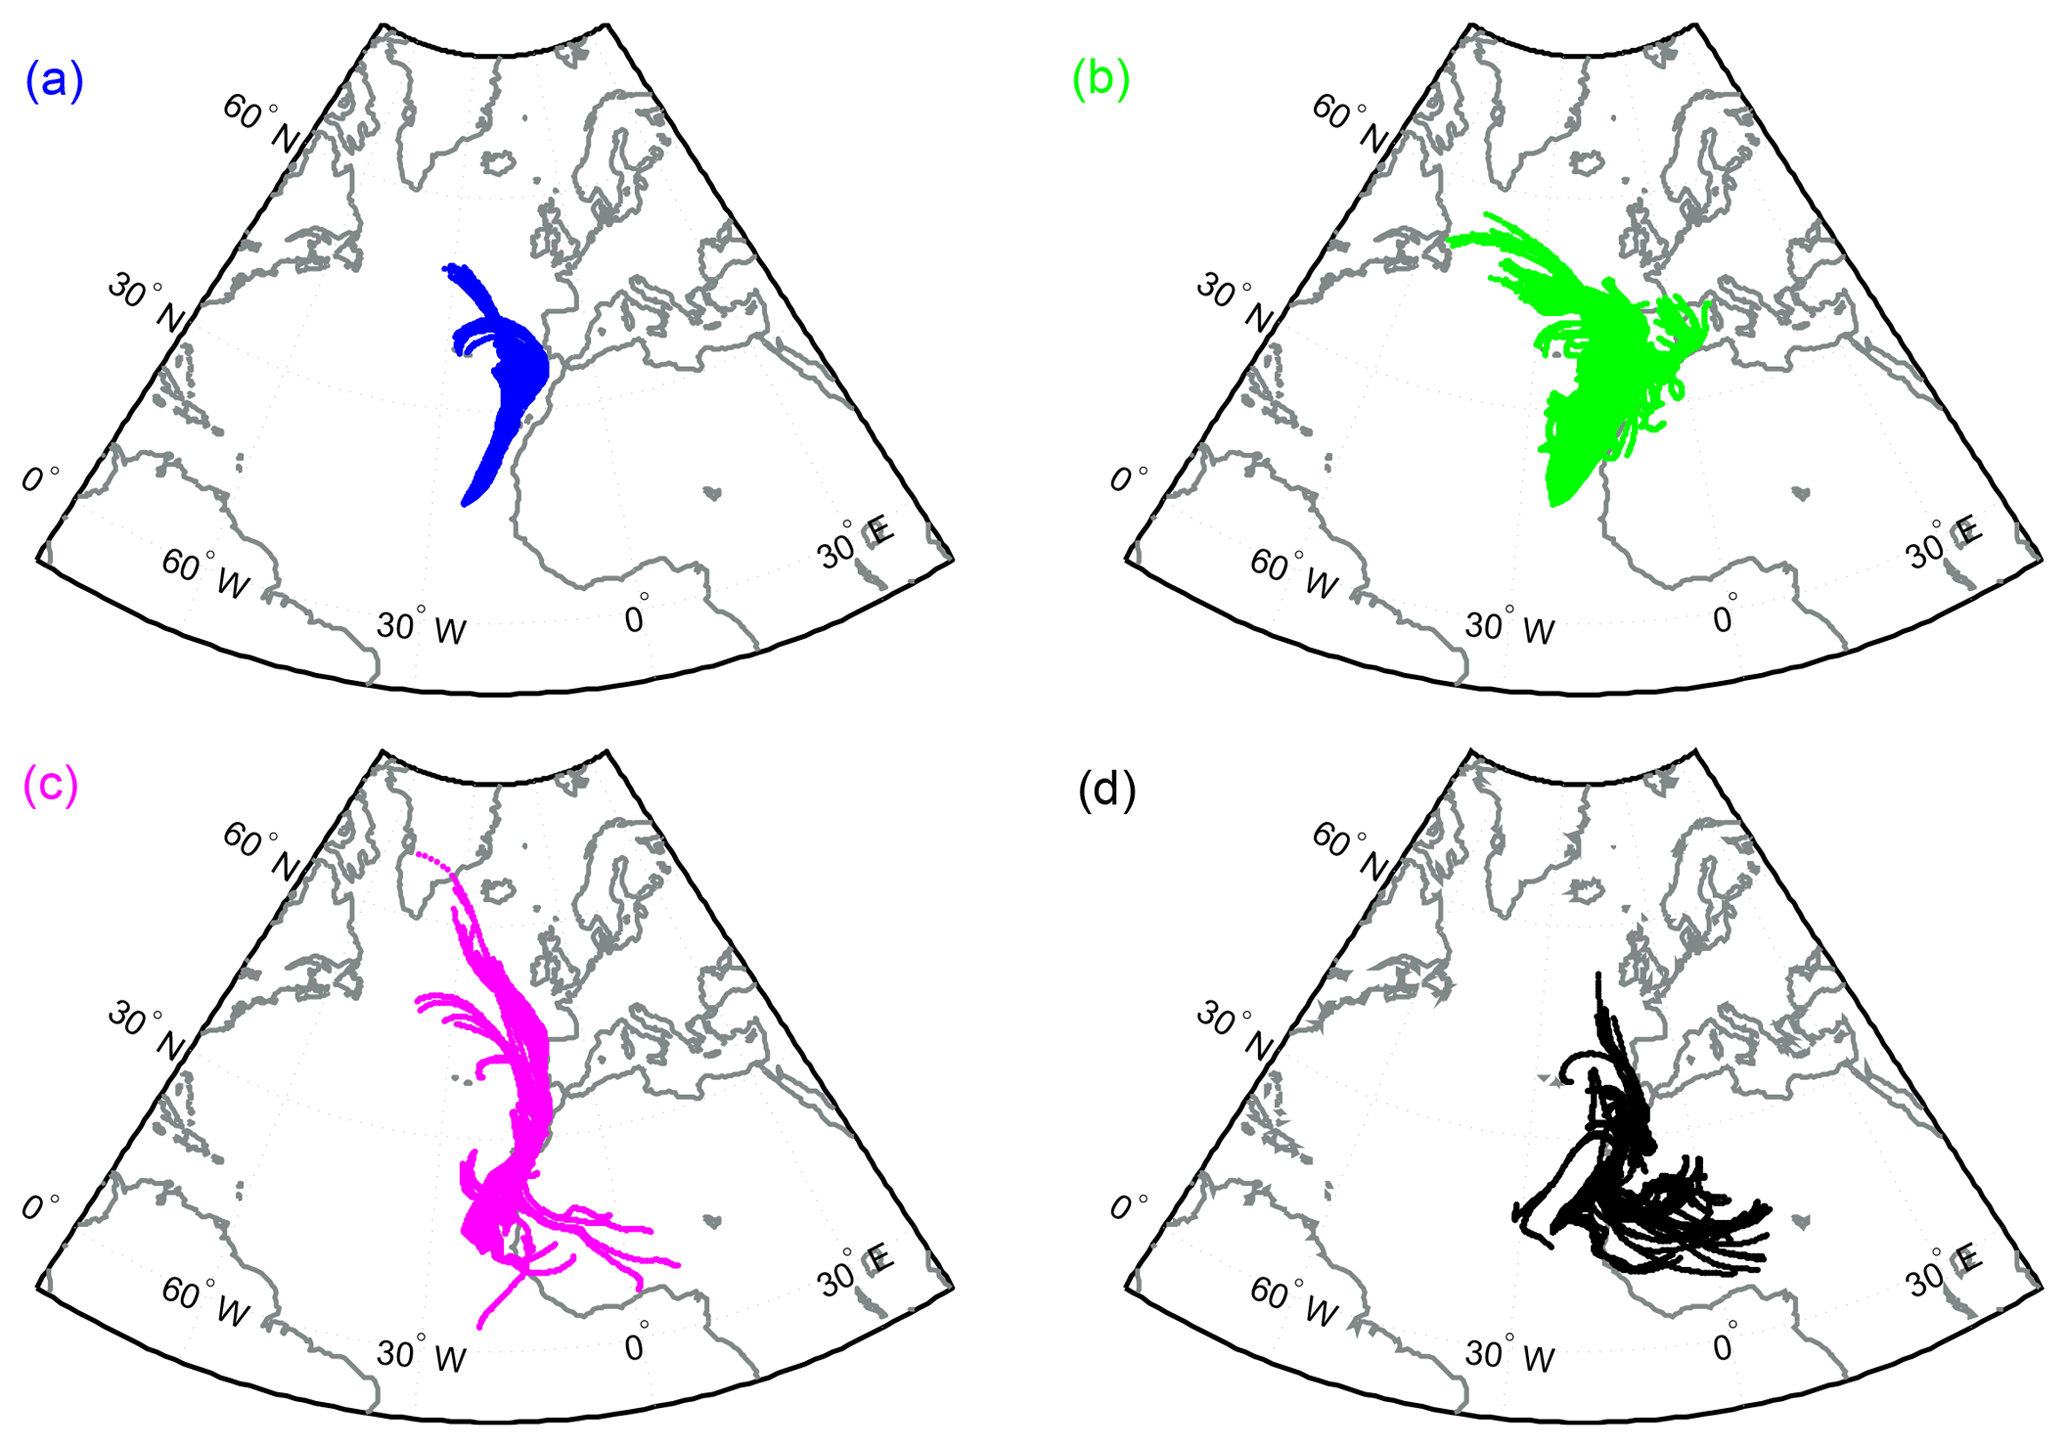
Figure 6The 6 d backward trajectories arriving at CVAO at a height of 200 m with 1 h resolution for marine type (a), mixture type (b), dust type1 (c) and dust type2 (d). Each calculation is shown as a separate dot, which is separately visible when air masses moved fast.
PNSDs that have a larger Naccumulation than NAitken are attributed to the “mixture type” in this work, shown as green lines in Fig. 5, with three modes, i.e., Aitken, accumulation and coarse modes, which can be clearly distinguished. NAitken, Naccumulation and Ncoarse have median values of 247, 405 and 20 cm−3, respectively. The Hoppel minimum of the mixture type is at roughly 80 nm. The respective backward trajectories, colored in green in Fig. 6b, showed that the related air mass came from the north Atlantic Ocean and spent some days over southern Europe and northern Africa. Anthropogenic aerosol and mineral dust may be incorporated into air parcels and transported to Cabo Verde, causing higher levels of Aitken, accumulation and coarse mode particles than in the marine type.
PNSDs with larger NAitken than Naccumulation and Ncoarse>25 cm−3 are attributed to the “dust type1” in this work, shown as red lines in Fig. 5. PNSDs attributed to this type show three modes, i.e., Aitken, accumulation and coarse modes, which can be clearly distinguished. NAitken, Naccumulation and Ncoarse had median values of 556, 312 and 39 cm−3, respectively. The Hoppel minimum of the mixture type is at roughly 100 nm. The respective backward trajectories, colored in red in Fig. 6c, featured two pathways. One air mass group originated from the north Atlantic Ocean and stayed a few days over southern Europe and northern Africa. Another air mass group came from the Sahara.
It is interesting to note that the Hoppel minimum is at the lowest diameter for the marine air mass (∼70 nm), compared to all other air masses. This suggests that the supersaturation in the clouds forming in the clean marine air masses is highest, as there is less surface area for the water vapor to condense onto during cloud formation.
PNSDs which featured a single mode in the submicron size range are attributed to “dust type2”, shown as black lines in Fig. 5. No visible Hoppel minimum can be seen. The dust type2 featured highest Ntotal and Ncoarse median values of 994 and 44 cm−3, respectively. It is worth mentioning that previous field measurements at the Sahara found similar PNSDs to what we observed in this study (Kaaden et al., 2009; Kandler et al., 2009; Weinzierl et al., 2009). We assumed that dust type2 is the heaviest dust plume period during this campaign. The respective backward trajectories, colored in black in Fig. 6d, showed that related air masses originated from the Sahara.
The higher Ncoarse during dust type1 and type2 periods is due to the direct dust aerosol from the Sahara. Schladitz et al. (2011b) also found that the higher coarse mode number concentration at Cabo Verde originated from the Sahara. Besides, a very high concentration of Aitken mode particles was observed during dust type1 and dust type2 periods. A previous study also found that an African-influenced period showed a great enhancement in the Aitken mode particles and an overall increase in the number of particles of all sizes (Allan et al., 2009). Nie et al. (2014) found that new particle formation and growth happened in the remote ambient atmosphere during the strongest observed dust episodes. Both the formation and growth rates of particles in the diameter range of 15–50 nm were enhanced during the dust episodes. In our data, we found that backward trajectories often traveled from the upper troposphere down to the marine boundary layer during dust periods, which means that Aitken mode particles could have been transported from the upper troposphere. Therefore, there are different factors contributing to the observed high NAitken and Naccumulation during dust plumes, such as direct transport of particles from the desert and Sahel region, and additional new particle formation and growth in the vicinity or in the upper troposphere.
To summarize Sect. 3.2, based on number concentrations in different aerosol modes, an aerosol classification was done, and four well-separable types of PNSDs were found, i.e., the marine type, mixture type, dust type1 and dust type2. Marine type particles are mainly from the Atlantic Ocean, while dust type particles are mainly from the Sahara. Mixture type particles are a combination of marine, anthropogenic and dust particles. Backward trajectories support this classification and analysis. The marine, mixture, dust type1 and dust type2 in this study are comparable to type A, D, C and B in Fomba et al. (2014), respectively, who characterized particle chemical composition at CVAO over a time period of 4 years.
3.3 Comparison of CVAO and MV
In this section, we will compare the PNC, PNSDs and NCCN at CVAO and MV. Cloud events are identified based on the difference in integrated PNC between MV and CVAO. Cloud effects on PNSDs and NCCN will also be discussed.
3.3.1 Comparison of PNC and PNSD
PNSDs from 10 to 800 nm were measured by MPSS and a bimodal lognormal parameterization was adopted to calculate NAitken and Naccumulation at MV. Figure 7 shows the time series of PNC in the size range between 10 and 800 nm at CVAO () and MV () in Fig. 7a, PNC of accumulation mode at CVAO () and MV () in Fig. 7b, and PNC of Aitken mode at CVAO () and MV () in Fig. 7c. The variation in and was similar sometimes, e.g., from 23 to 25 September. However, sometimes the concentrations at MV were obviously lower than the respective values at CVAO, at least for and , as, for example, from 5 to 9 October. Such a decrease was sometimes, but not always, also observed for . This is a typical observation for cloudy air, in which particles from the accumulation mode and maybe also some from the Aitken mode are activated to cloud droplets which are then removed in the aerosol inlet on MV. When the ratio of to was lower than 0.85, we assumed that MV is in the cloud. When the trimodal fitting function did not work for the CVAO data set (from 03:30 to 20:00 21 September and from 09:30 28 September to 18:30 30 September), a slightly different approach was needed. For that, we used the ratio of PNC in the size range between 80 and 800 nm at MV () to that at CVAO () (replacing the ratio of to ). When this ratio was lower than 0.75, we assumed that MV is in the cloud. It is described in more detail in the Supplement how this ratio was derived separately for cases with trimodal and bimodal fitting. The time for cloud events is shown as red shading in Fig. 7. As outlined above in the meteorology part, we observed RH =100 % at MV. Figure S8 shows the time series of RH at MV together with the time for cloud events as red shading. It is clear that times with RH =100 % are consistent with cloud events identified as described above, which verifies our identification of cloud events.
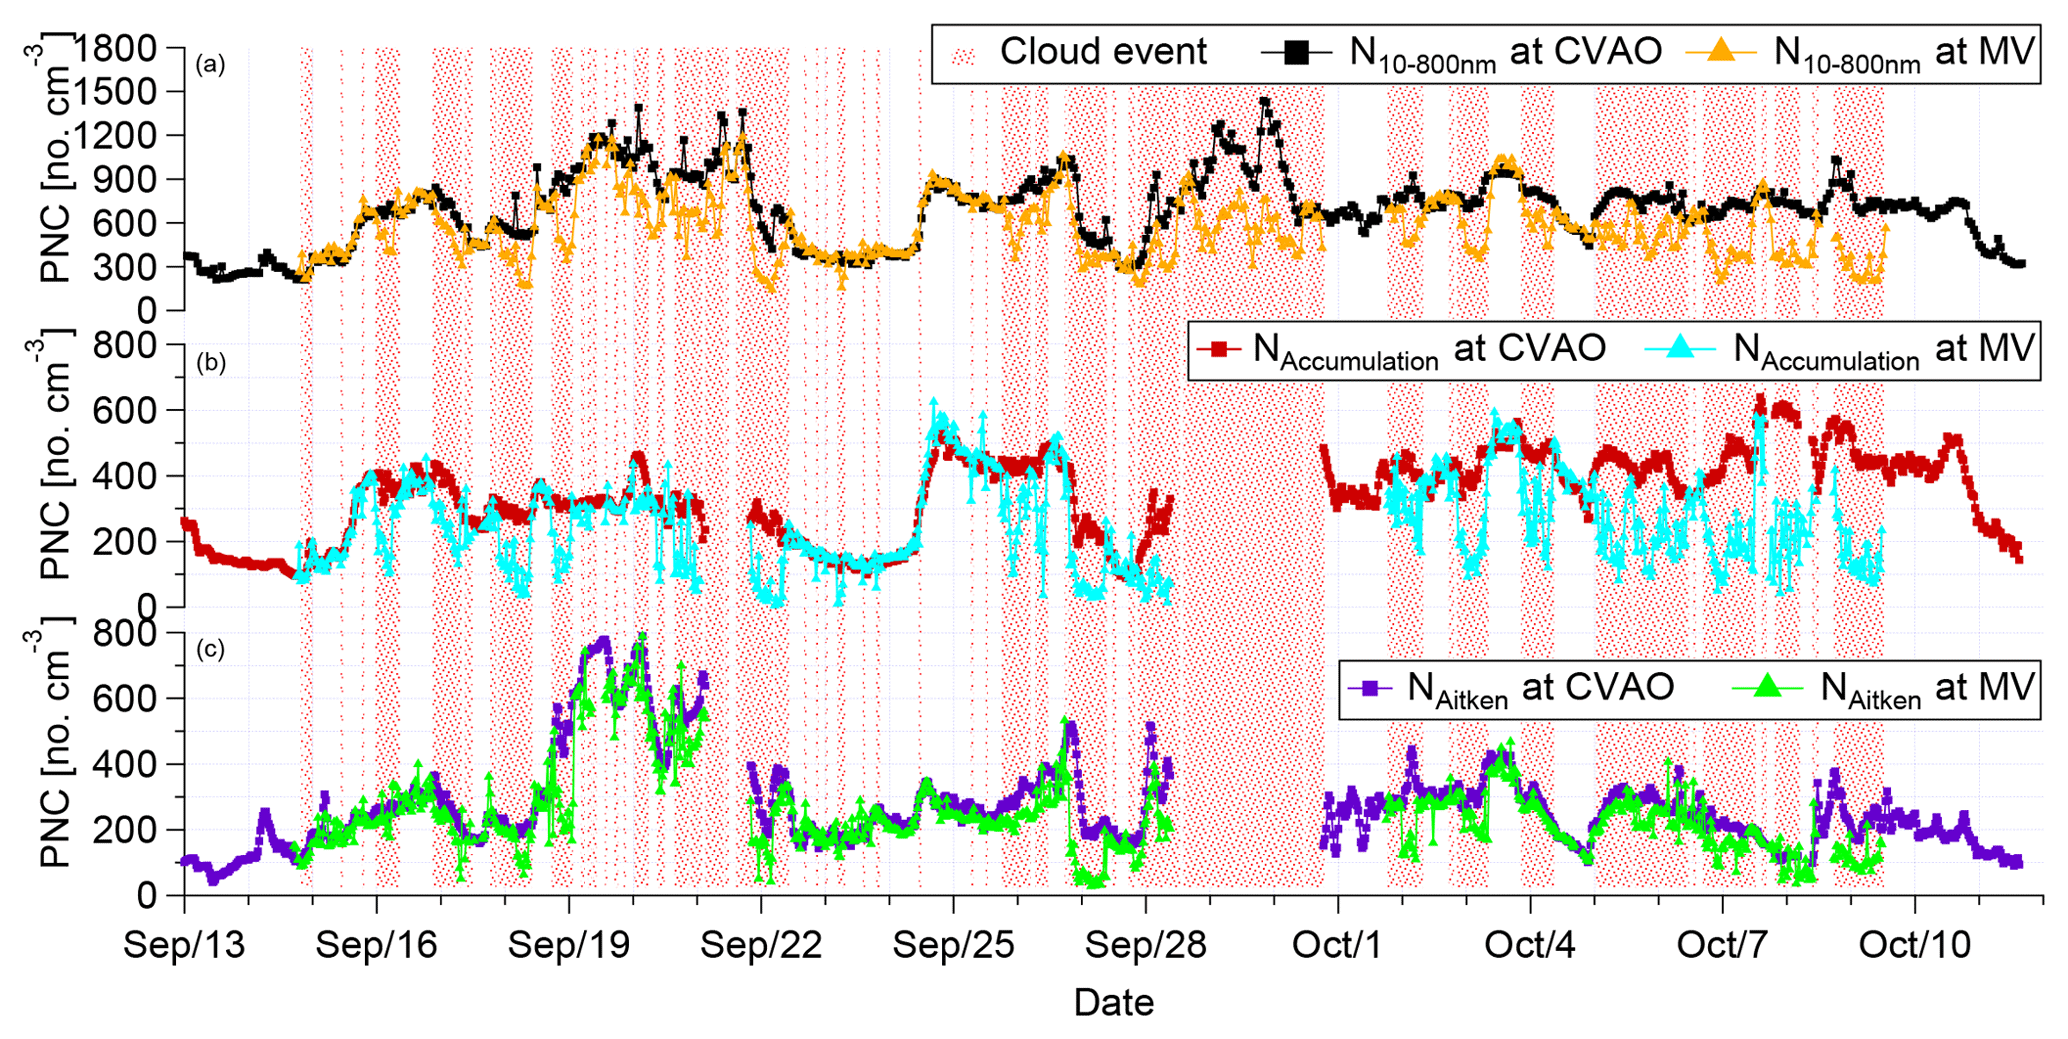
Figure 7Time series of and in panel (a), and in the panel (b), and and in panel (c). The times of cloud events are shown by red shading.
To better understand the cloud effect of PNSDs, we compared the PNSDs at CVAO and MV during cloud events and noncloud events of different aerosol types. Figure 8 shows the median PNSDs of different particle types during cloud events and noncloud events. During noncloud events, PNSDs at CVAO () and MV () were similar for marine, mixture or dust type1 periods. During dust type2, there is only a very short period of noncloud event with 15 PNSDs observed. Therefore, we did not include the comparison of and during the dust type2 period in Fig. 8.
During noncloud events, PNSDs at CVAO and MV were the same, as shown in Fig. 8. For periods with clouds, PNSDs in the size range >80 nm at MV are lower than that at CVAO for all the particle types. For dust type1 and dust type2, depending on the clouds, i.e., the highest supersaturation the particles encounter, particles in Aitken mode were also activated to cloud droplets. For particles in the size range <40 nm, PNSDs are similar during cloud and noncloud events. This is because the particle size is not large enough to activate to cloud droplets. Furthermore, it also indicates that PNSDs are similar at CVAO and MV during cloud events, at least in the size range <40 nm. For a more detailed comparison of PNSDs at CVAO and MV, contour plots for PNSDs can be found in Fig. S9 in the Supplement.

Figure 8The median of PNSDs for four different particle types during cloud events and noncloud events at CVAO and MV.
During the campaign, a decoupled marine boundary layer was observed with our balloon measurements in three cases, i.e., 10:30 to 11:00 16 September, 16:00 to 16:30 5 October and 17:20 to 17:50 12 October (shown as red dots in Fig. 1). Only for the first decoupling case (10:30 to 11:00 16 September) was MV cloud free; otherwise, PNSDs were similar at CVAO and MV (Fig. S10). Therefore, the MBL may be generally well mixed, maybe still from times before the decoupling of the layers formed. On the other hand, lifting of the air masses over the mountain might also partially explain this observation. However, due to the fact that there is only this one decoupled case, a thorough analysis of the influence of coupling and decoupling can not be done.
3.3.2 Comparison of NCCN
Figure 9 shows the scatter plot of NCCN at CVAO () against that at MV () during cloud events (green dots) and noncloud events (red rectangles) at different supersaturations. During cloud events, large particles that had been activated to cloud droplets were removed by the aerosol inlet on MV. Therefore, is larger than at each supersaturation. During noncloud events, all the data points are close to the 1:1 line (for the slopes see Fig. 9), and R2 values between and are all above 0.90, indicating NCCN is similar at CVAO and MV. Although there were slight differences in supersaturation at CVAO and MV due to the CCNC calibration, the similarity between NCCN at the two stations conveys the same message as what was discussed before concerning the comparison of PNSDs at CVAO and MV, i.e., particles are generally well mixed in the MBL.
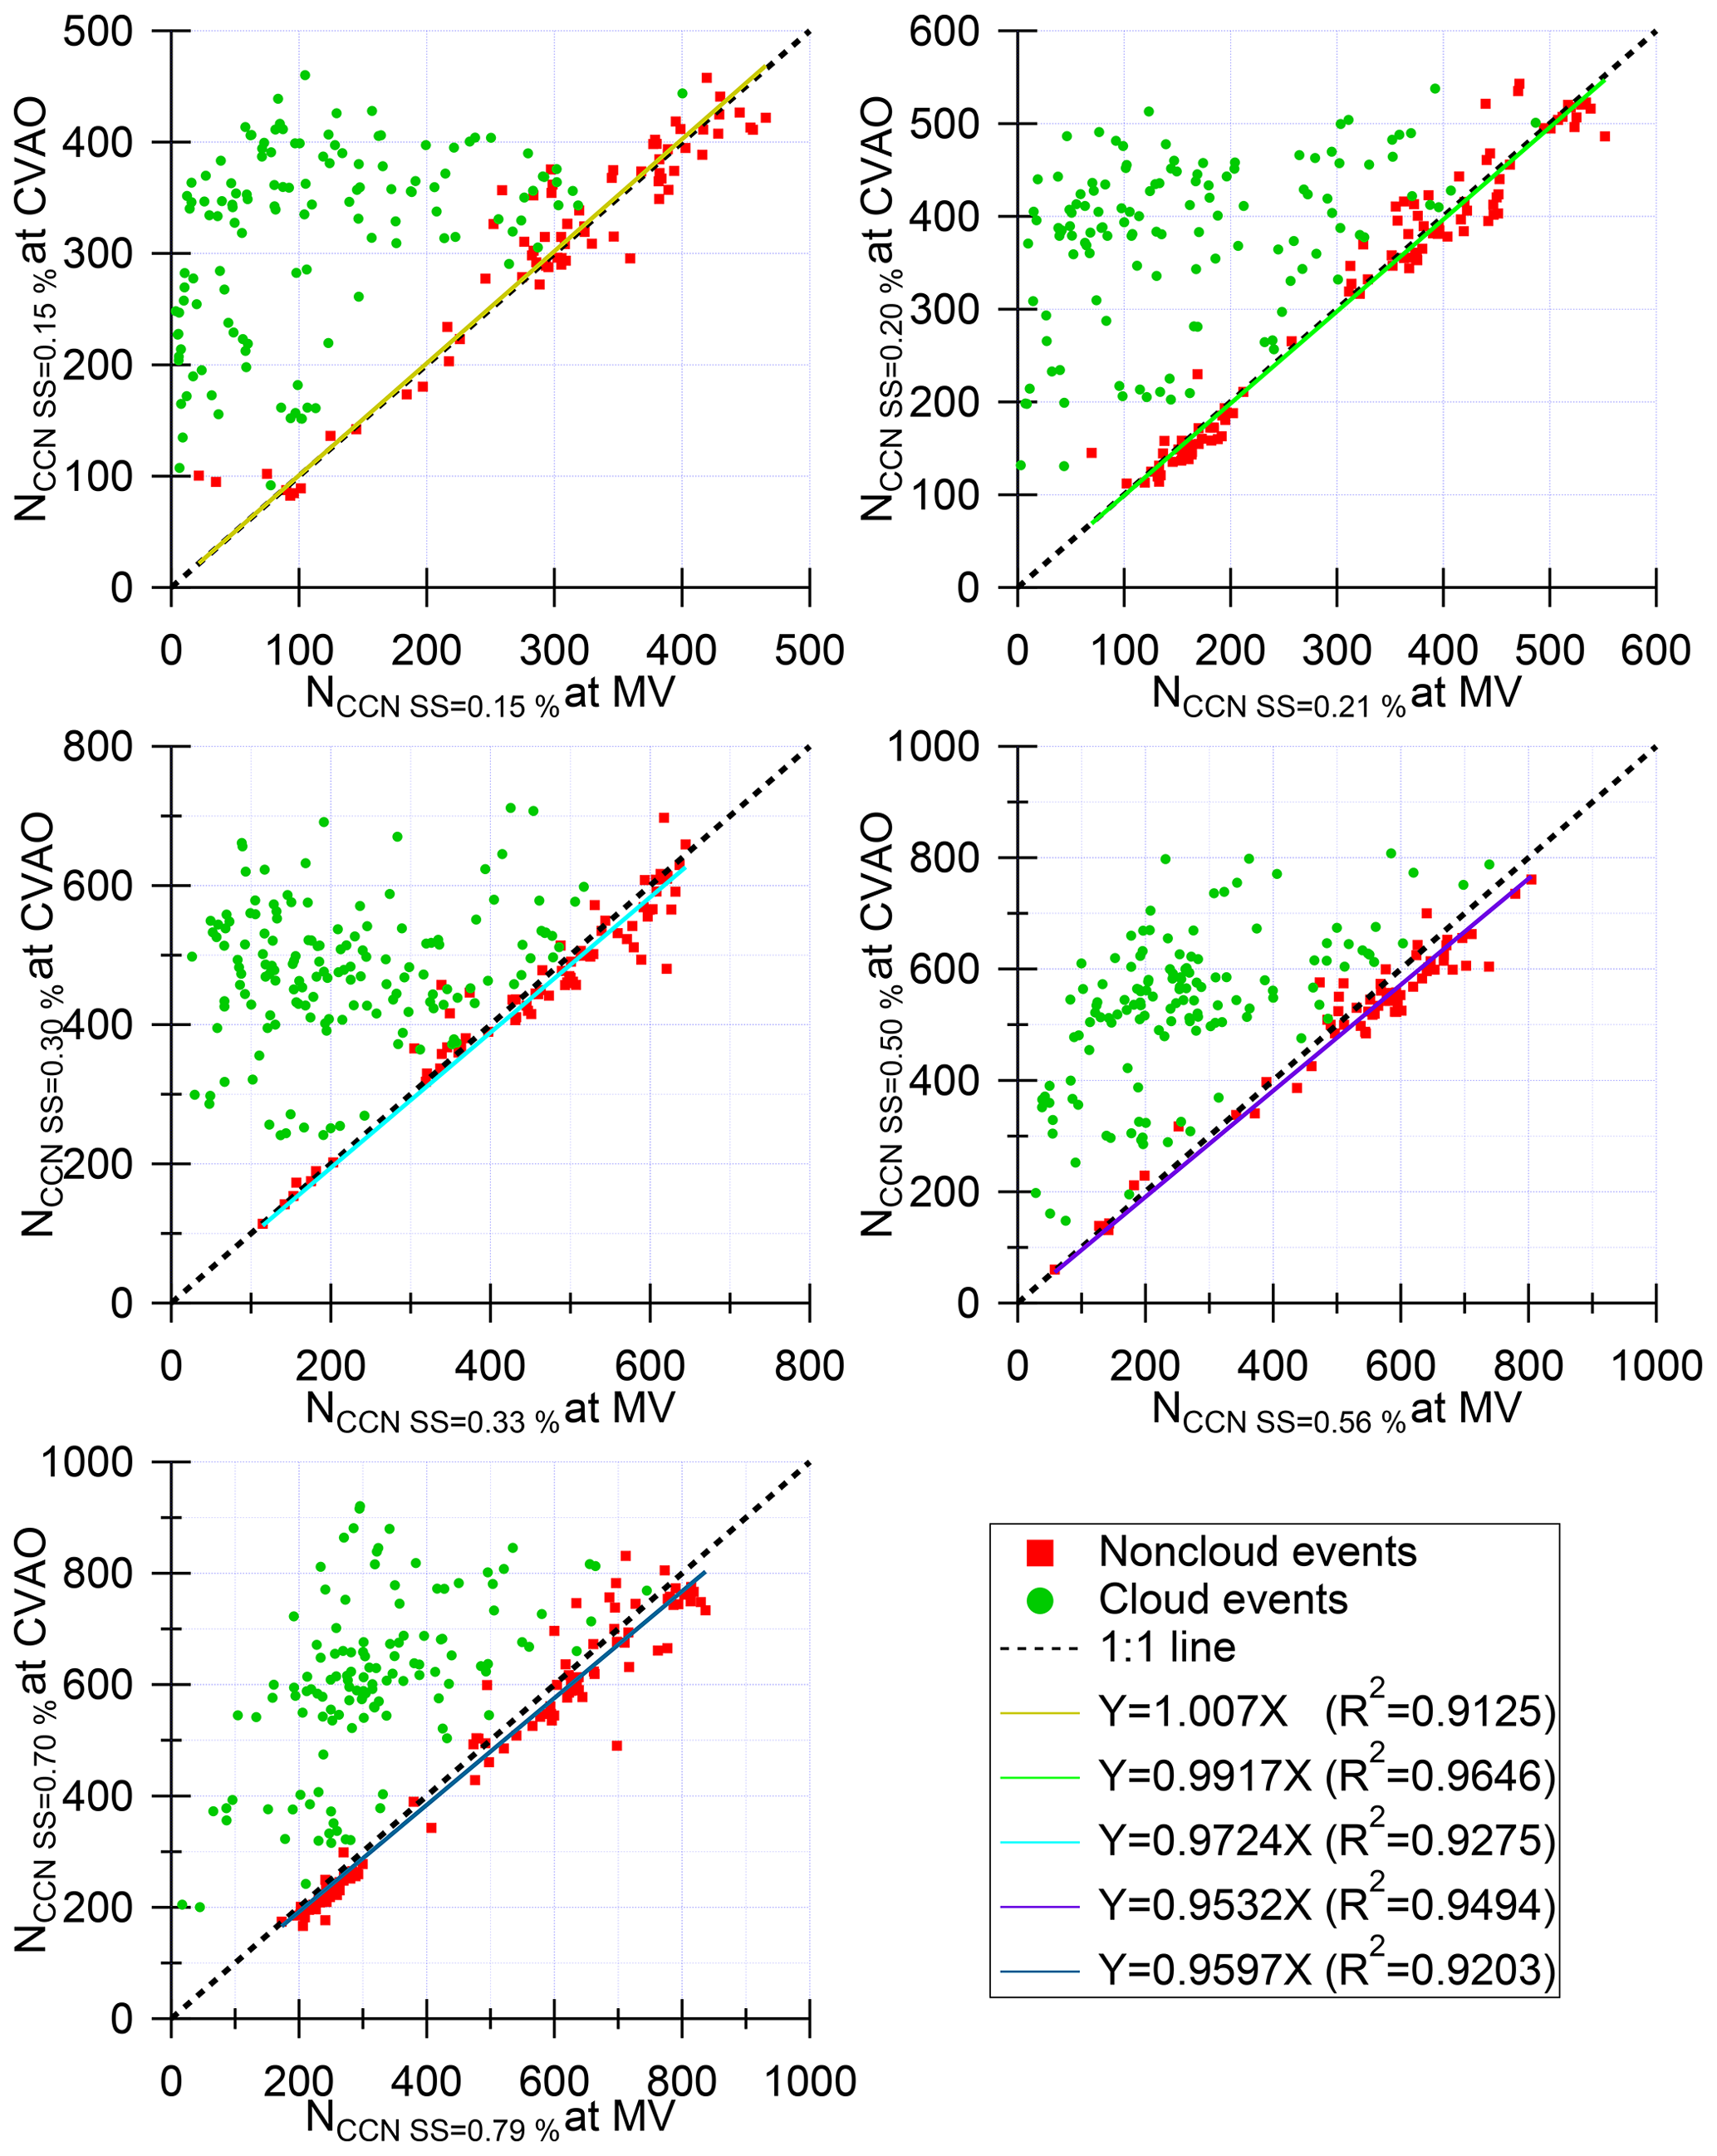
Figure 9Scatter plots of NCCN at CVAO against those at MV at different supersaturations. Slope and R2 values for these fits are given in the legend.
To summarize Sect. 3.3, cloud events were observed at MV and can be identified based on the integrated concentrations between ground and cloud level. During the cloud events, larger particles (mainly accumulation and coarse mode) are activated to cloud droplets. Aitken mode particles starting with sizes of roughly 40 nm can also be activated to cloud droplets if the cloud is strong enough. During noncloud events, PNC, PNSD and NCCN are similar at CVAO and MV. The aerosol particles measured at ground level (CVAO) can represent the aerosol particles at the cloud level (MV).
3.4 Particle hygroscopicity
In this section, we will focus on NCCN, dcrit and κ measurements at CVAO. As outlined above, PNSDs and NCCN measured at ground level are similar to those at cloud level. Therefore, measurements at CVAO can be representative of that at MV. Firstly, a thorough statistical analysis of NCCN, dcrit and κ will be discussed. Secondly, the marine and dust aerosol contributions of particles to NCCN and their κ values will be compared.
3.4.1 Statistical analysis of NCCN, dcrit and κ
Figure 10a shows the time series of Ntotal and NCCN, dcrit in Fig. 10b and κ in Fig. 10c, with different colors for different supersaturations. The error bars of dcrit show 1 standard deviation (SD), and error bars of κ show 1 geometric standard deviation (geoSD). Explanation of error bars can be found in Sect. 2.4 as well as in the Supplement. NCCN shows large variability, e.g., NCCN,0.30 % varied from 106 to 884 cm−3, with a median of 509 cm−3. We observed highest NCCN,0.30 % of 503 cm−3 (median) during dust type2 periods, and lowest NCCN,0.30 % of 109 cm−3 (median) during marine periods. NCCN,0.30 % during different aerosol type periods are summarized in Table 2. Figure 11a shows the boxplot of NCCN at different supersaturations during the whole campaign. As can be seen, NCCN increases towards higher supersaturation, which is expected. The median of NCCN at different supersaturations also exhibited large variability, varying from 327 (median) at a supersaturation of 0.15 % to 652 cm−3 (median) at a supersaturation of 0.70 %. Table 3 summarizes those numbers and shows additional details.
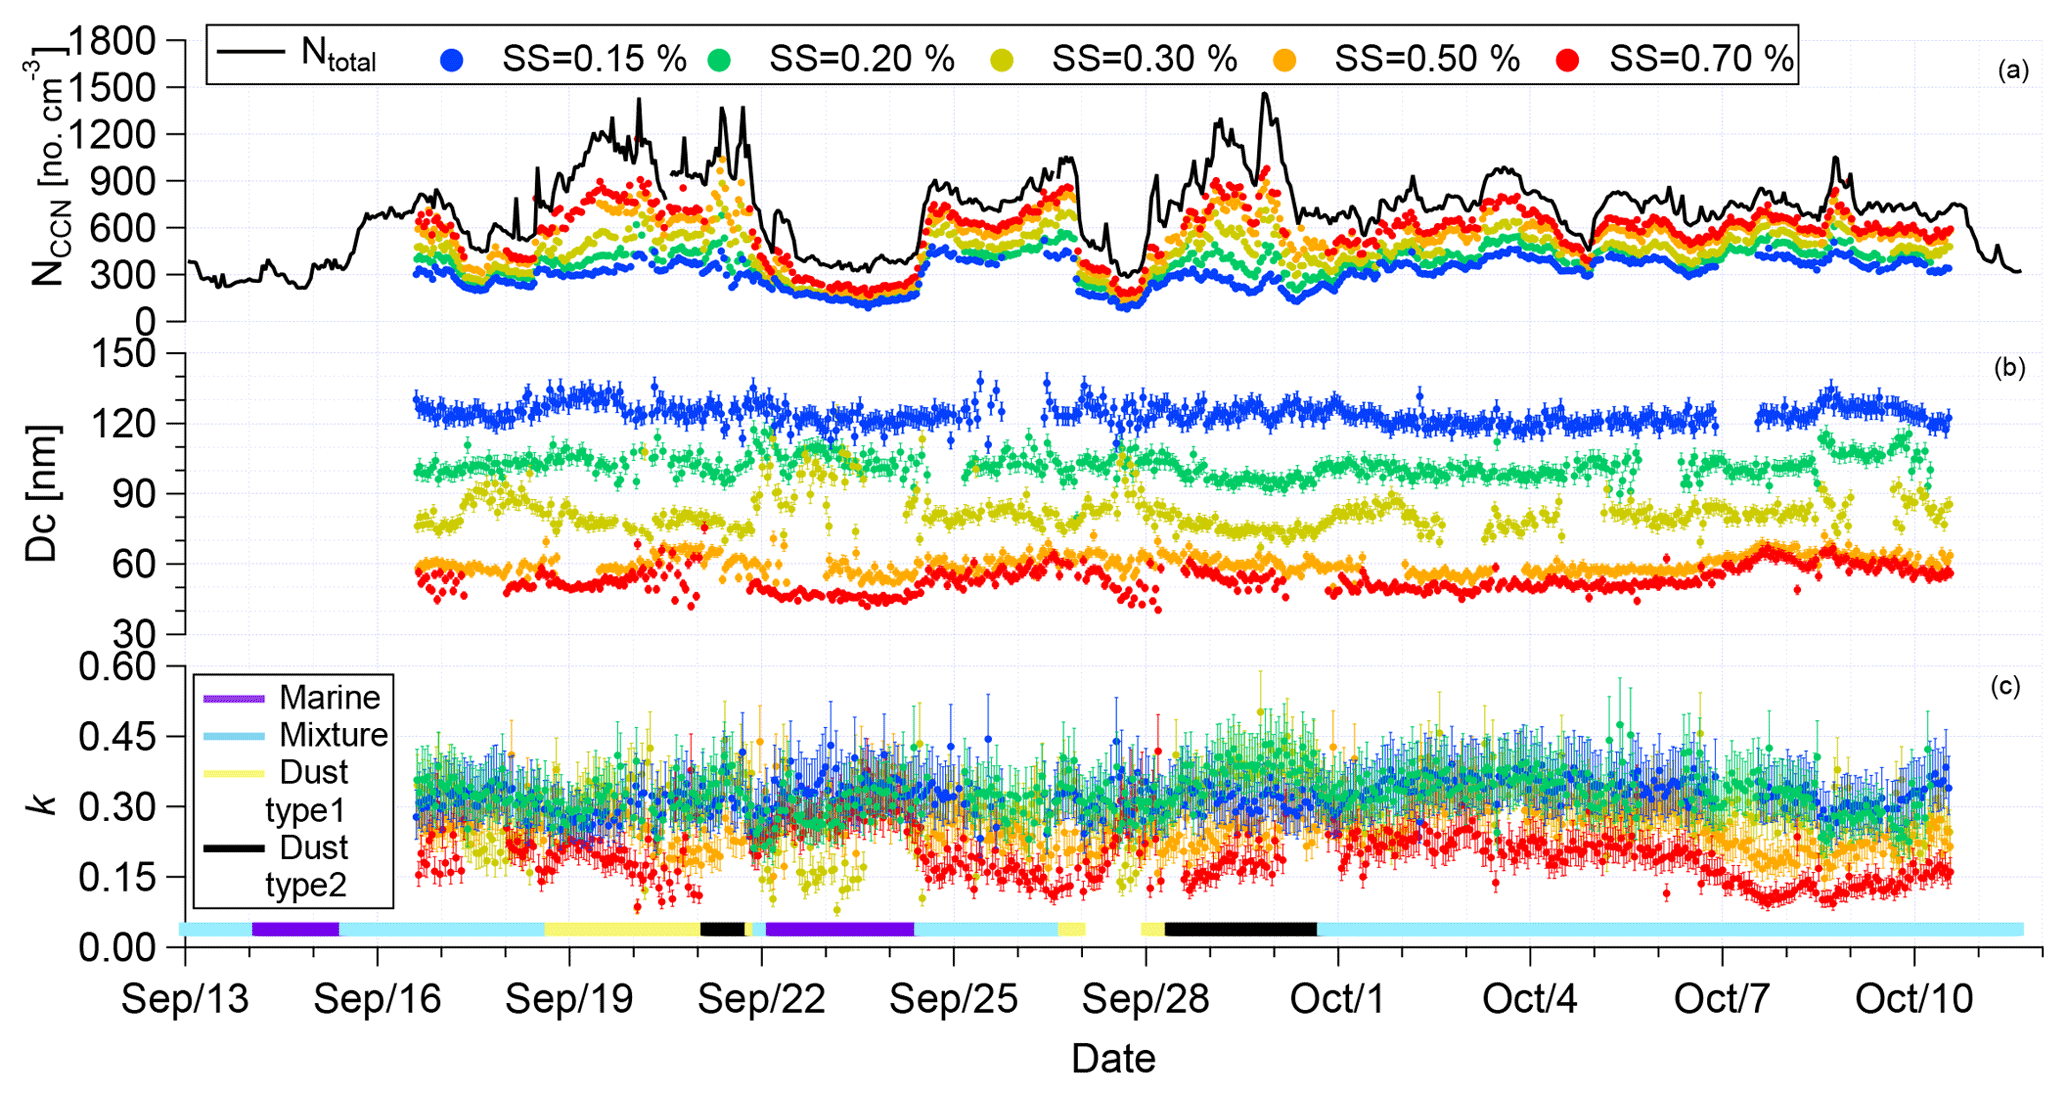
Figure 10Time series of NCCN in (a), dcrit in (b) and κ in (c). All of those are measured at CVAO. Error bars of dcrit and κ show 1 standard deviation and 1 geometric standard deviation. The color bar in (c) indicates the times of different aerosol type periods.
dcrit at supersaturations of 0.15 %, 0.20 %, 0.50 % and 0.70 % were almost constant throughout the campaign, as shown in Fig. 10b. The mean value of dcrit and its SD are summarized in Table 3. For the supersaturations of 0.70 % and 0.50 %, dcrit is below 80 nm, i.e., inside the Aitken mode. However, for the lower supersaturations of 0.15 % and 0.20 %, dcrit is located in the accumulation mode. Consequently, hygroscopicities derived at these supersaturations can be assumed to be representative of the Aitken (at supersaturations of 0.70 % and 0.50 %) and the accumulation modes (at supersaturation of 0.10 % and 0.20 %), respectively. dcrit at a supersaturation of 0.30 % (dcrit,0.30 %) is not as constant as it is at other supersaturations, and it is larger during the marine type period than during other periods. With a median of 79.7 nm, it is close to the Hoppel minimum. Therefore, the hygroscopicity derived at a supersaturation of 0.30 % can be assumed to be representative of the mixture of Aitken and accumulation particles.
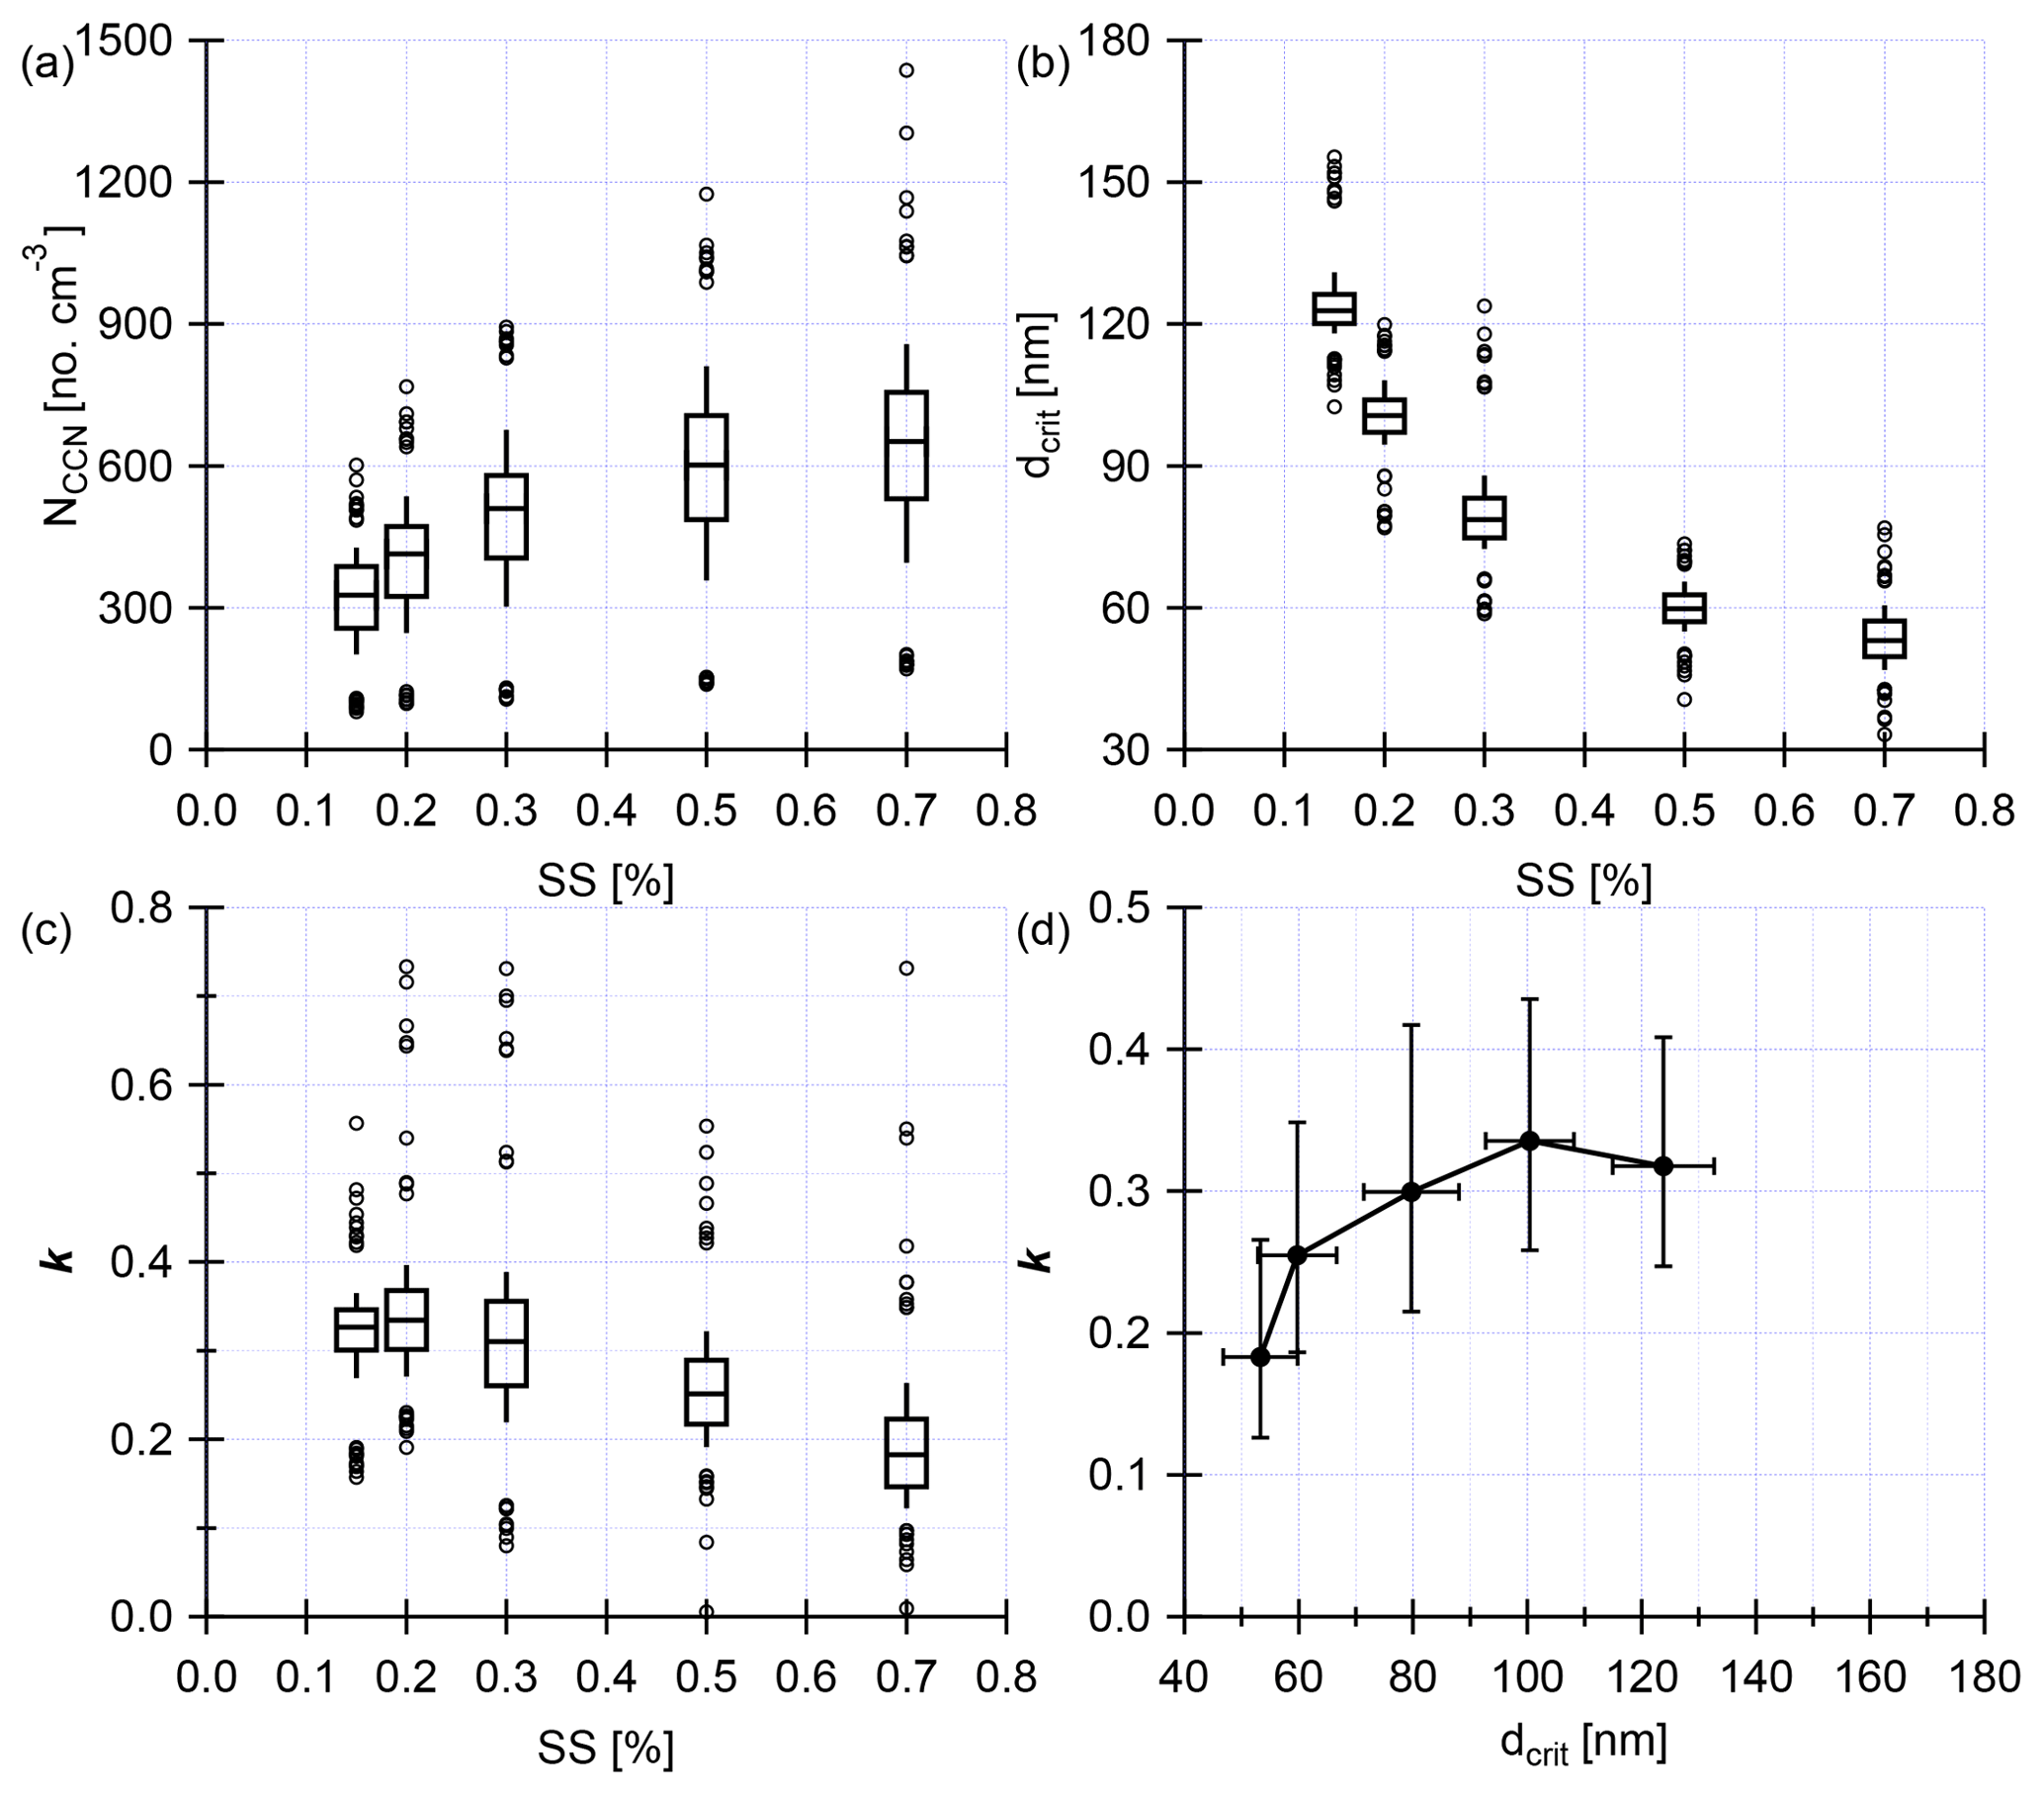
Figure 11Boxplots of NCCN (a), dcrit (b) and κ (c) at different supersaturations (SS). Whiskers show the 10th to 90th percentiles. Circles show the outliers (1 %). (d) κ as a function of dcrit. Error bars of dcrit and κ show 1 standard deviation and 1 geometric standard deviation, respectively.
Table 3Median and mean values of NCCN, dcrit, κ, 1 standard deviation of dcrit and 1 geometric standard deviation of κ at different supersaturations.
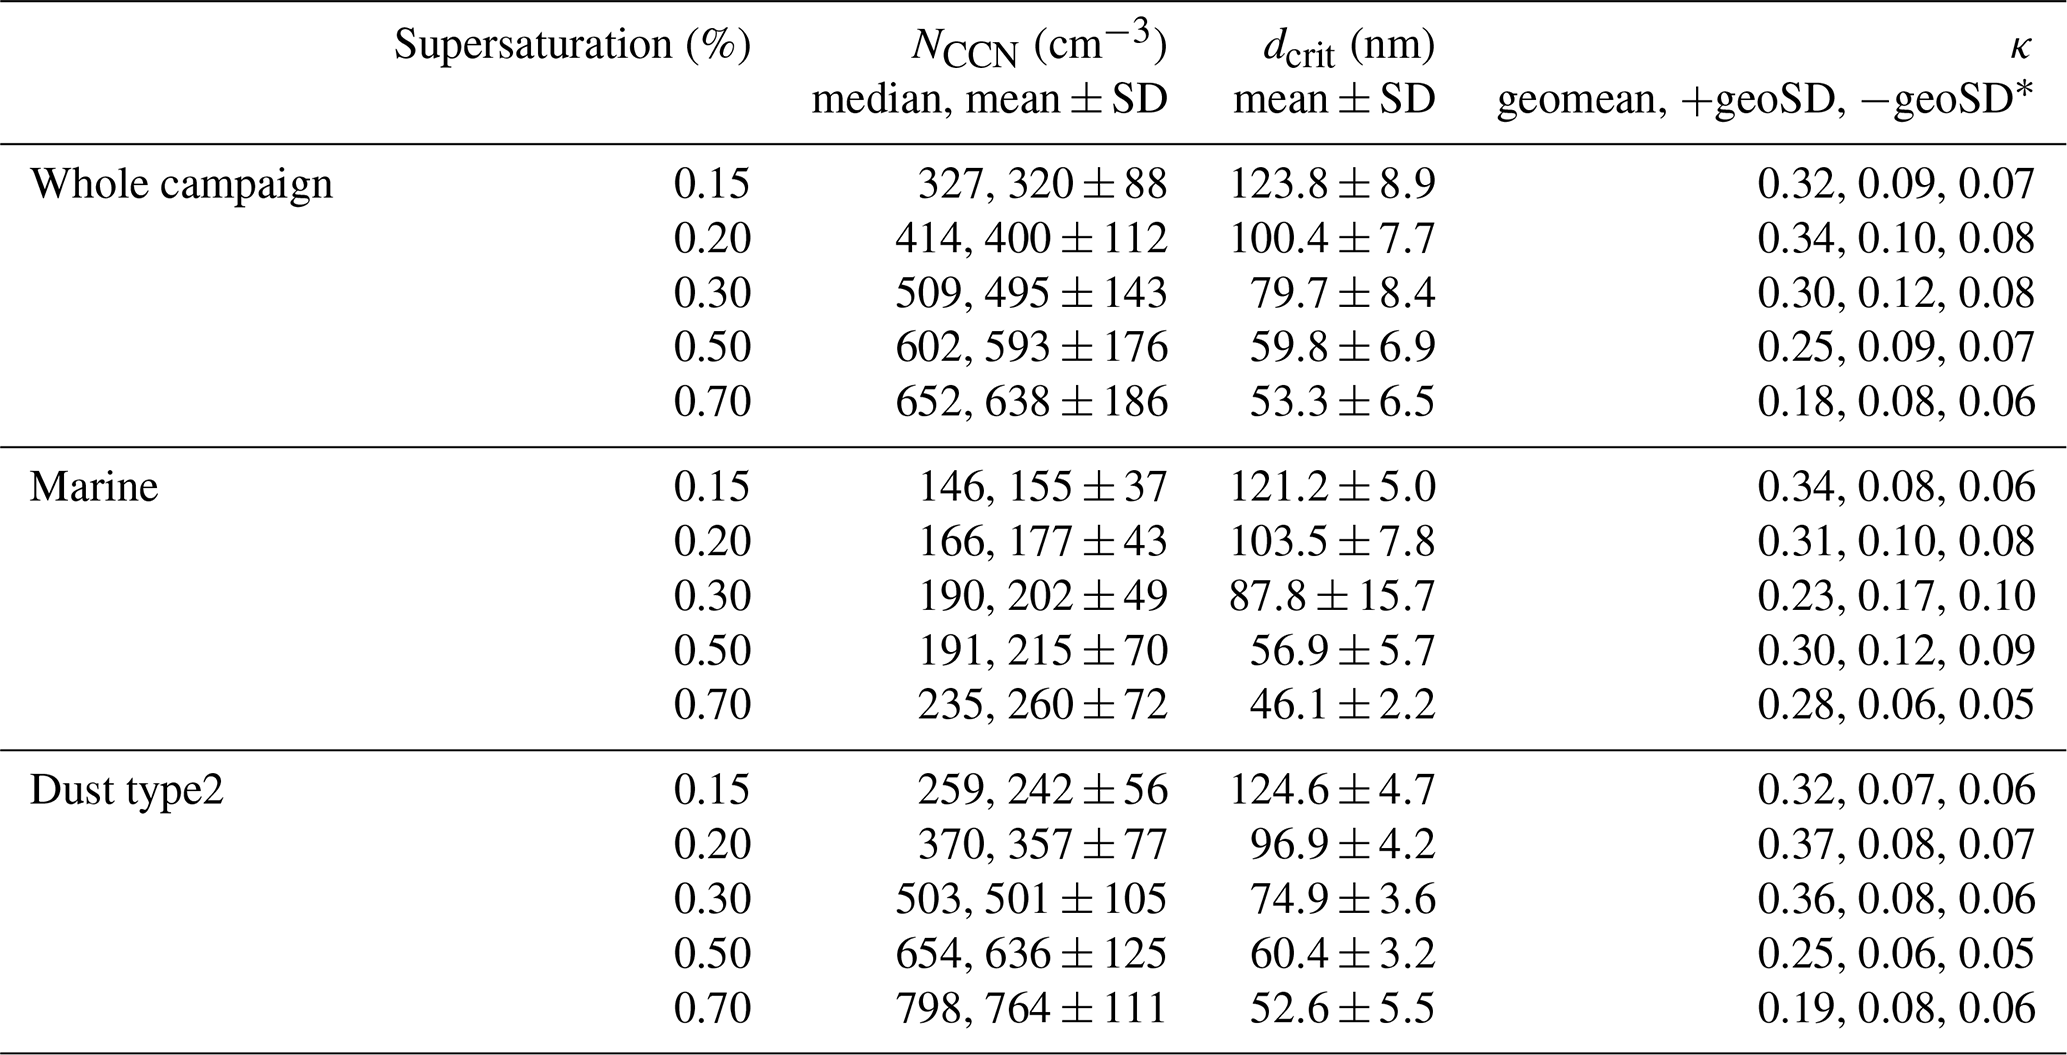
* 1 geometric standard deviation
The particle hygroscopicity, expressed as κ, can be seen as a measure for average particle chemical composition. κ values at different supersaturations show little variability over time (lower panel in Fig. 10), with geoSD lower than 0.12, i.e., there is no clear trend in κ over time during the campaign. A slightly increasing trend of κ was observed with decreasing supersaturations, as shown in Fig. 11c. At supersaturations of 0.70 % and 0.50 %, i.e., for Aitken mode particles, κ values are 0.18 and 0.25 (geomean), respectively. At the lowest supersaturation of 0.15 % and 0.20 %, i.e., for accumulation mode particles, κ values are 0.32 and 0.34 (geomean). Table 3 summarizes those numbers and shows additional details.
Figure 11d shows κ as a function of dcrit and error bars of κ and dcrit show geoSD and SD, respectively. A slightly increasing trend of κ over increasing dcrit is observed. It suggests that the soluble, likely inorganic, material added during cloud processing increases κ of the originally very organic-rich particles, which has also been observed in previous studies (Kalivitis et al., 2015; Kristensen et al., 2016). Overall, κ averaged 0.28. Pringle et al. (2010) used an atmospheric chemistry model to derive global distributions of effective particle hygroscopicity κ. For CVAO, this model resolved an annual cycle of monthly-mean κ values ranging from 0.25 in February to 0.60 in April. This annual circle of κ likely originated in a change of chemical composition of the aerosol throughout the year, related to different precursors and a higher organic content during times with higher algal activity. For September and October, the period of this study, values of 0.35 and 0.30 were reported, respectively, which is consistent with what we obtained during this campaign.
The Hoppel minimum diameter range of 70 to 100 nm for different aerosol types (mentioned in Sect. 3.2.2), together with the average κ of 0.28, can be used to obtain a rough estimate of maximum supersaturations present in trade wind clouds along the path of the sampled air masses. Resulting values are roughly 0.22 % to 0.37 % for dust type2 and marine air masses, respectively. These are close to an earlier estimate given in Clarke et al. (1996) of 0.35 %, and they can be interpreted as typical values for trade wind cumuli.
3.4.2 Dust and marine comparison
In this section, we will focus on examining the difference between the cleanest periods (marine type) and heaviest observed dust pollution periods (dust type2). Therefore, we compared NCCN and κ during marine type and dust type2 periods. Figure 12a shows the boxplot of NCCN as a function of supersaturation. As outlined above, during dust periods, the aerosol shows a great enhancement in the Aitken, accumulation and coarse mode particles; therefore, overall NCCN increases at different supersaturations. It is clear that NCCN during dust type2 periods is much higher than that during marine periods. For example, NCCN,0.30 % median values were 503 and 190 cm−3 during dust type2 and marine periods, respectively. During marine periods, Ncoarse, i.e., SSA particles, accounted for roughly 3.7 % of NCCN,0.30 %, for the range of wind speeds from 4 to 10 m s−1 that were present during this study. This is relatively low compared to Wex et al. (2016), who found that the SSA particles accounted for up to 15 % of NCCN,0.30 % for wind speeds up to 14 m s−1 for the marine aerosol on Barbados, and Modini et al. (2015), who found that SSA particles accounted for up to 16 % to 28 % (wind speeds up to 16 m s−1) and 5 % to 10 % (wind speed from 4 to 10 m s−1) of NCCN,0.30 %. However, these fractions not only depend on the concentrations of SSA but also on those of particles in the accumulation mode, which have other sources. Still, the respective accumulation modes and related particle concentrations in Modini et al. (2015), Wex et al. (2016) and the present study resemble each other. Therefore the lower fractions of SSA particles in our study are likely connected to the low wind speeds (lower SSA number concentration) or, to some extent, to different accumulation mode particle number concentrations.
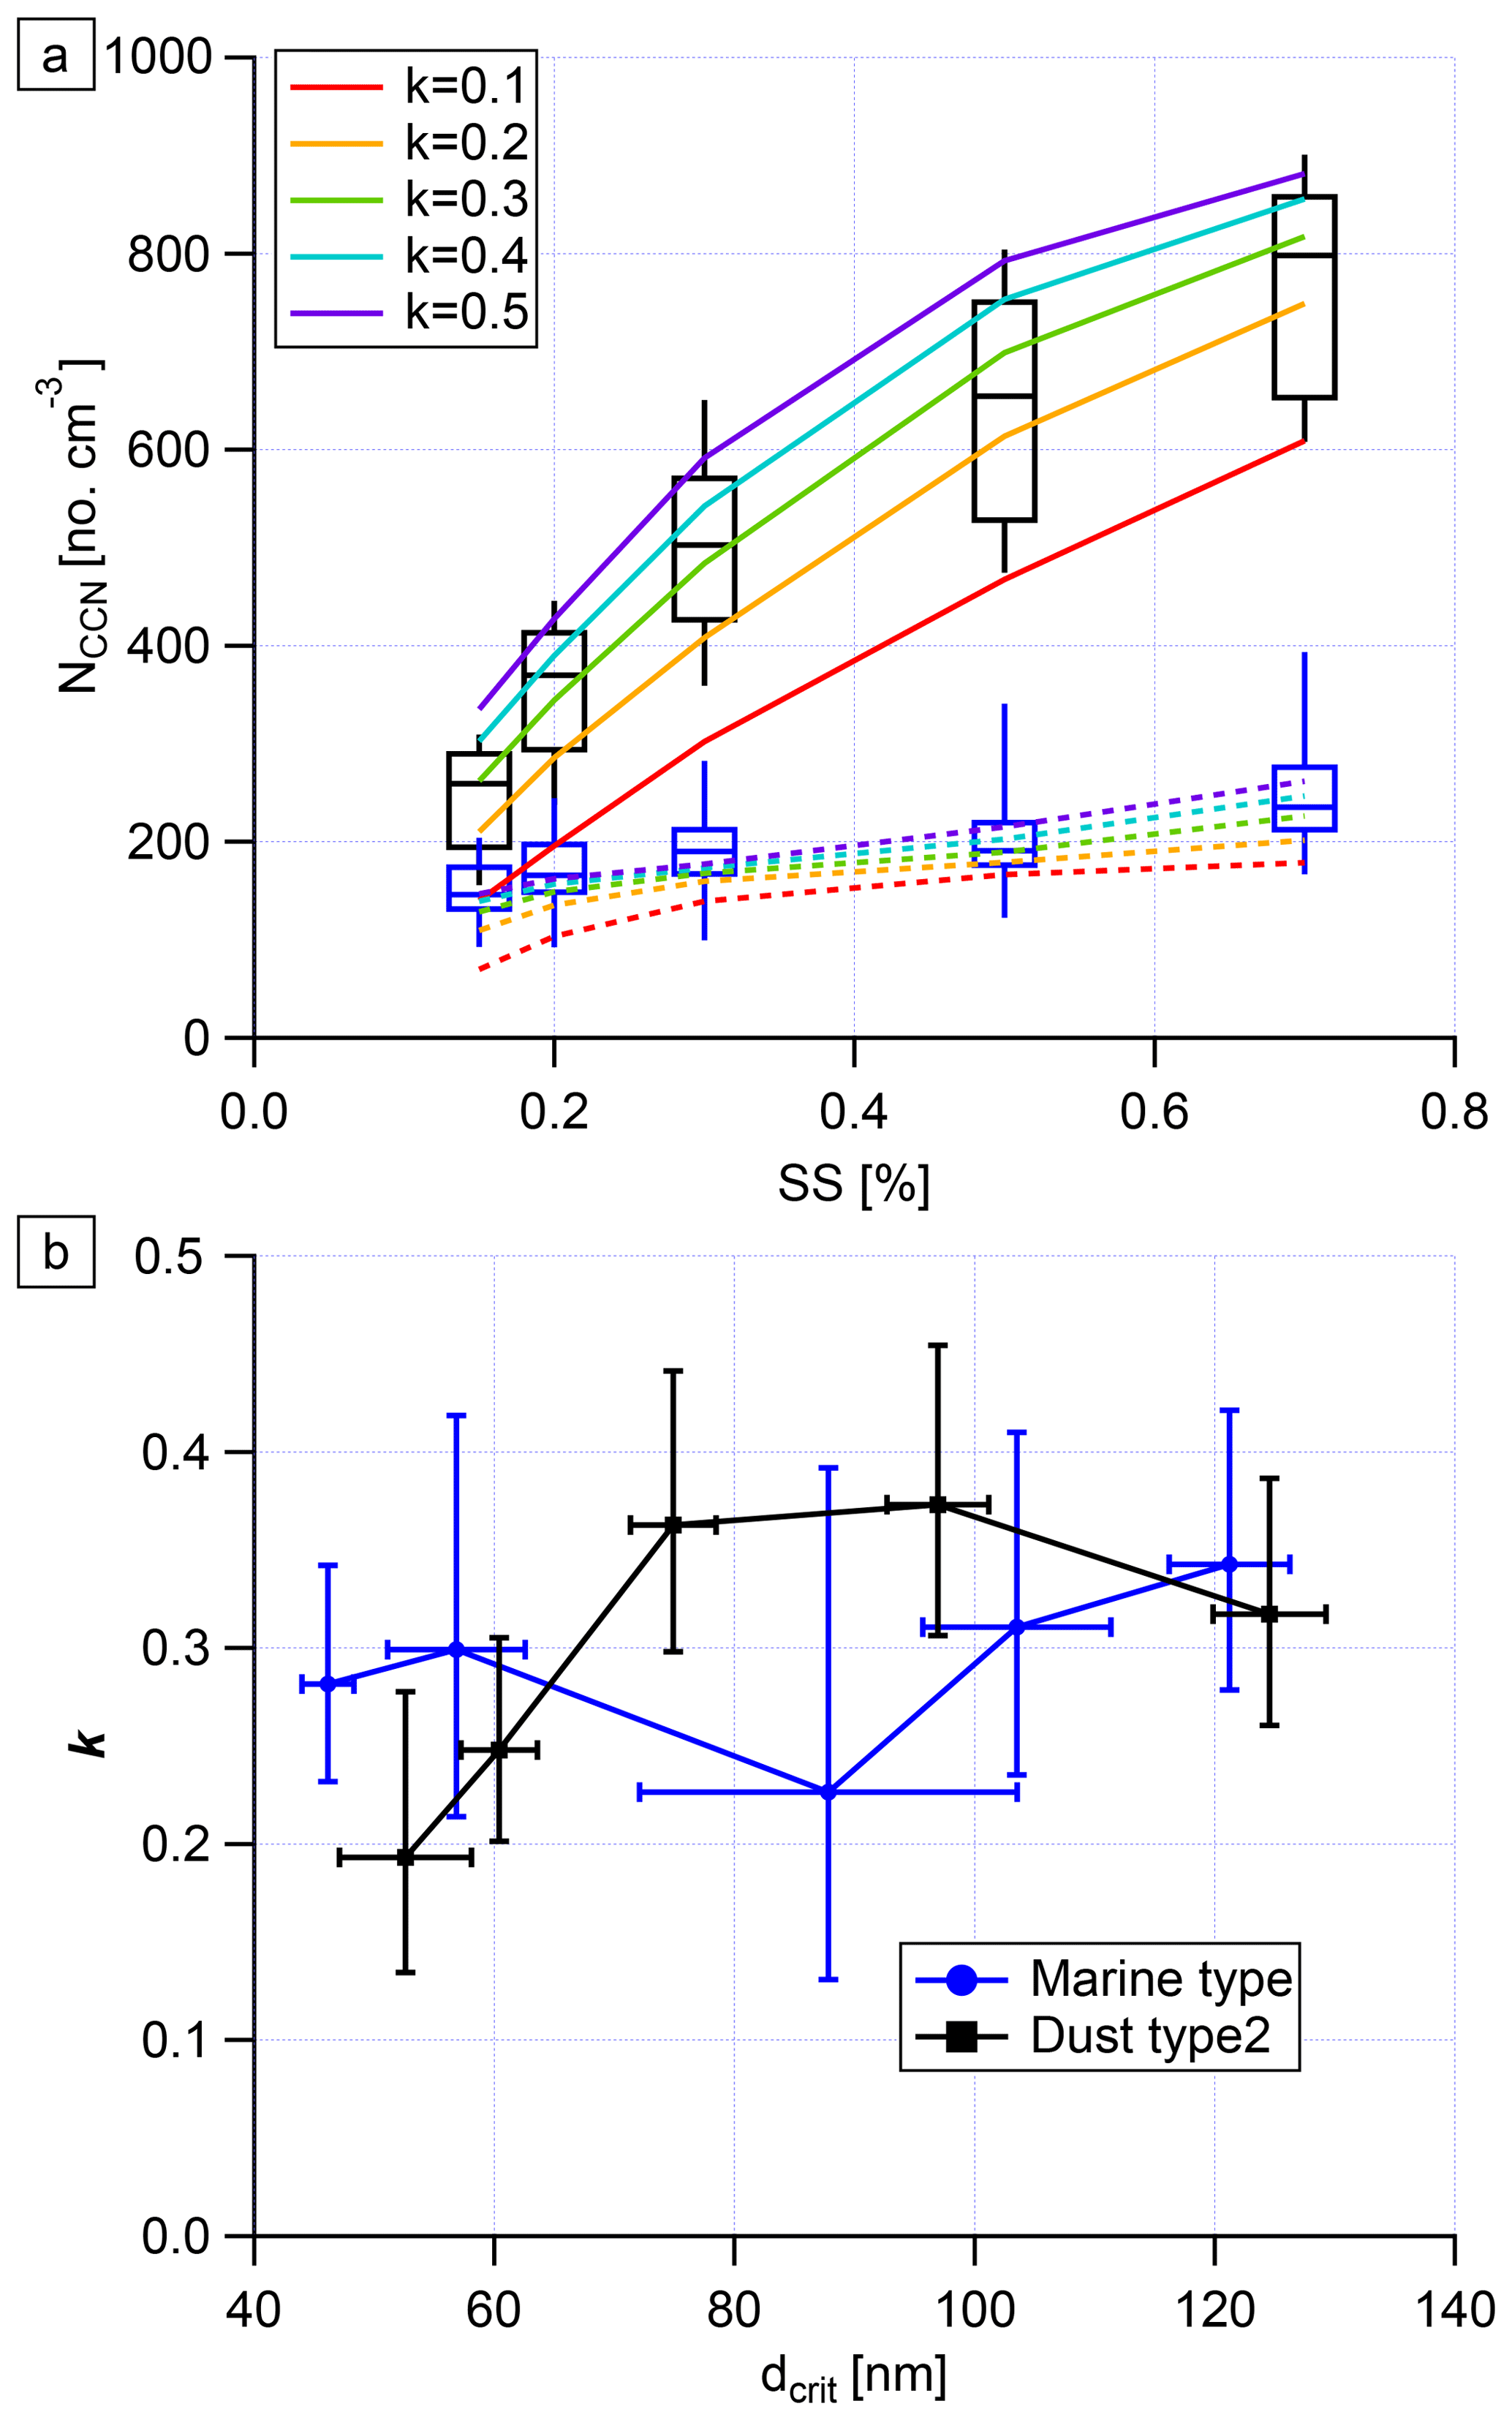
Figure 12(a) Boxplots of NCCN as a function of κ for marine type (blue) and dust type2 (black). Whiskers show the 10th to 90th percentiles. The predicted NCCN based on median PNSD and different κ values (0.1, 0.2, 0.3, 0.4 and 0.5) are shown in solid (during dust type2 period) and dashed lines (during marine period). (b) κ as a function of dcrit for marine type (blue) and dust type2 (black). Error bars of dcrit and κ show 1 standard deviation and 1 geometric standard deviation, respectively.
κ as a function of dcrit is shown in Fig. 12b. The error bars of dcrit and κ show SD and geoSD, respectively. During dust type2, slightly increasing κ with increasing dcrit was observed, similar to the overall trend we described above. κ featured lower values from 0.13 to 0.31 for Aitken mode particles, while higher values from 0.26 to 0.45 were found for accumulation mode particles. Until now, the only field measurement of particle hygroscopicity during a dust plume at Cabo Verde was carried out by Schladitz et al. (2011a), who found that hygroscopic particles featured a κ value (based on hygroscopic growth factor of particles) from 0.35 to 0.65. Our CCN-derived κ values in this study for the aerosol influenced by dust are therefore comparable to the values reported by Schladitz et al. (2011a).
No clear trend of κ with dcrit was observed during marine type periods (as shown in Fig. 12), during which κ averaged 0.30. Larger error bars of κ and dcrit at the supersaturation of 0.30 % were observed, as in this case the dcrit is close to the Hoppel minimum, where a small change in NCCN causes a comparably large change in dcrit (explained in the Supplement). Kristensen et al. (2016) found that, for the marine aerosol on Barbados in June and July 2013, values for κ of 0.2 to 0.5 were derived, which are consistent with this study. When considering the scatter observed in κ (see the error bars in Fig. 12), κ during the dust type2 period still agreed with that of the marine period within uncertainty. Therefore, no distinguishable differences in κ during marine and dust periods in the size range from 40 to 140 nm were found during this campaign.
We additionally derived NCCN based on PNSDs. For that, we assumed values for κ of 0.1, 0.2, 0.3, 0.4 or 0.5, and we calculated the corresponding dcrit at different supersaturations. The integrated particle number concentrations in the size range larger than dcrit were derived from the median PNSDs during dust type2 and marine periods. These particle number concentrations also can be treated as the predicted NCCN at different supersaturations, as shown in solid (dust type2) and dashed (marine type) lines with different colors (indicating different κ) in Fig. 12a. As expected, the thusly derived NCCN values were within the measured NCCN range. Comparing the solid and dashed lines, it can be seen that different aerosol types, i.e., different PNSDs, played an important role in NCCN variation. When looking at the results from the different κ values, we found that the particle chemical composition did not control NCCN, especially when the particle number concentration was very low. These colored solid and dashed lines connected the κ and NCCN, which can be helpful for NCCN predictions in modeling studies.
To summarize Sect. 3.4, overall there is a slight increase in κ with particle size, indicating the addition of soluble, likely inorganic, material during cloud processing. κ values in this study are comparable to previous model work and field measurements. NCCN during the heaviest observed dust periods is much higher than that during marine periods, while κ values for these two periods show no significant difference.
The MarParCloud campaign took place in September and October 2017 on Cabo Verde to investigate the aerosols prevailing in the Atlantic Ocean. As the first in a series of publications to come from the MarParCloud campaign, this study provides a thorough characterization of the abundance, properties and sources of aerosol particles in general, and CCN in particular, close to both sea-level and cloud-level heights with measurements done at the Cape Verde Atmospheric Observatory (CVAO) and on the top of Monte Verde (MV), respectively.
Ntotal varied from ∼200 to ∼1500 cm−3, with a median of ∼700 cm−3 at CVAO. A trimodal parameterization method was deployed to characterize PNC. Based on number concentrations in different aerosol modes, four well-separable types of PNSDs were found, i.e., the marine type, mixture type, dust type1 and dust type2. These different aerosol types originate from different regions. The marine type aerosol mainly originates from the Atlantic Ocean, while the dust type aerosol mainly comes from the Saharan region. During marine periods, the coarse mode can be attributed to sea spray aerosol, and the corresponding particle number concentration accounted for about 3.7 % of NCCN,0.30 % and for about 1.1 % to 4.4 % of Ntotal. Because of lower wind speeds that were present at CVAO, this value is lower than previous field measurements (Modini et al., 2015; Wex et al., 2016).
A thorough comparison of PNC, PNSDs and NCCN at CVAO and MV clearly showed these parameters to be similar at both stations in the absence of clouds. Cloud events were observed at MV during roughly 58 % of the time. During the cloud events, larger particles (mainly accumulation and coarse mode) are activated to cloud droplets and our data suggest that the maximum supersaturation in the clouds is higher the cleaner the air mass gets, leading to a lower Hoppel minimum. Altogether, it was observed that the boundary layer is generally well mixed; therefore, CVAO can be used to describe the aerosol particles at cloud level.
Overall, κ averaged 0.28, suggesting the presence of organic material in particles. This is consistent with previous model work (Pringle et al., 2010) and field measurements of hygroscopic growth (Schladitz et al., 2011a) done for the location of Cabo Verde. There is a slight increase in κ with particle size, indicating the addition of soluble, likely inorganic, material during cloud processing. When looking at the two most different aerosol types, the marine type and dust type2, κ values for these periods show no significant difference. On the other hand, dust plumes enhanced particle concentrations in the Aitken, accumulation and coarse modes and therefore increased NCCN; NCCN,0.30 % during the strongest observed dust periods is about 2.5 times higher than that during marine periods.
The data are available through the World Data Center PANGAEA (https://doi.pangaea.de/10.1594/PANGAEA.905070, Gong et al., 2019).
The supplement related to this article is available online at: https://doi.org/10.5194/acp-20-1431-2020-supplement.
XG wrote the article with contributions from HW, JV and MvP. KW and XG performed MPSS and APS measurements, and XG performed the data evaluation. KW calibrated MPSS and APS before, during, and after the campaign. FS, HW and XG performed the CCN measurements, and XG performed the data evaluation. SH calibrated CCN before and after the campaign. Balloon measurements and data evaluation were performed by JV and XG. XG, HW and FS discussed the results and further analysis after the campaign. All co-authors proofread and commented on the article.
The authors declare that they have no conflict of interest.
This article is part of the special issue “Marine organic matter: from biological production in the ocean to organic aerosol particles and marine clouds (ACP/OS inter-journal SI)”. It is not associated with a conference.
The work was carried out in the framework of the MarParCloud project. The authors acknowledge the Leibniz Association SAW funding for the project “Marine biological production, organic aerosol particles and marine clouds: a Process Chain (MarParCloud)” (SAW-2016-TROPOS-2). We are grateful to Lucy Carpenter and Katie Read, from the University of York and the Atmospheric Measurement and Observation Facility at the National Centre for Atmospheric Science (NCAS-AMOF), for kindly providing the meteorology data at CVAO.
This research has been supported by the Leibniz Association SAW (MarParCloud (grant no. SAW-2016-TROPOS-2)).
The publication of this article was funded by the
Open Access Fund of the Leibniz Association.
This paper was edited by Kimitaka Kawamura and reviewed by two anonymous referees.
Albrecht, B. A.: Aerosols, cloud microphysics, and fractional cloudiness, Science, 245, 1227–1230, 1989. a
Allan, J. D., Topping, D. O., Good, N., Irwin, M., Flynn, M., Williams, P. I., Coe, H., Baker, A. R., Martino, M., Niedermeier, N., Wiedensohler, A., Lehmann, S., Müller, K., Herrmann, H., and McFiggans, G.: Composition and properties of atmospheric particles in the eastern Atlantic and impacts on gas phase uptake rates, Atmos. Chem. Phys., 9, 9299–9314, https://doi.org/10.5194/acp-9-9299-2009, 2009. a
Andreae, M. and Rosenfeld, D.: Aerosol–cloud–precipitation interactions. Part 1. The nature and sources of cloud-active aerosols, Earth-Sci. Rev., 89, 13–41, 2008. a, b
Brooks, S. D. and Thornton, D. C.: Marine Aerosols and Clouds, Annu. Rev. Mar. Sci., 10, 289–313, https://doi.org/10.1146/annurev-marine-121916-063148, 2018. a
Carpenter, L. J., Fleming, Z. L., Read, K. A., Lee, J. D., Moller, S. J., Hopkins, J. R., Purvis, R. M., Lewis, A. C., Müller, K., Heinold, B., Herrmann, H., Fomba, K. W., van Pinxteren, D., Müller, C., Tegen, I., Wiedensohler, A., Müller, T., Niedermeier, N., Achterberg, E. P., Patey, M. D., Kozlova, E. A., Heimann, M., Heard, D. E., Plane, J. M. C., Mahajan, A., Oetjen, H., Ingham, T., Stone, D., Whalley, L. K., Evans, M. J., Pilling, M. J., Leigh, R. J., Monks, P. S., Karunaharan, A., Vaughan, S., Arnold, S. R., Tschritter, J., Pöhler, D., Frieß, U., Holla, R., Mendes, L. M., Lopez, H., Faria, B., Manning, A. J., and Wallace, D. W. R.: Seasonal characteristics of tropical marine boundary layer air measured at the Cape Verde Atmospheric Observatory, J. Atmos. Chem., 67, 87–140, https://doi.org/10.1007/s10874-011-9206-1, 2010. a, b
Christensen, M. W., Chen, Y.-C., and Stephens, G. L.: Aerosol indirect effect dictated by liquid clouds, J. Geophys. Res.-Atmos., 121, 14636–14650, https://doi.org/10.1002/2016JD025245, 2016. a
Clarke, A. D., Li, Z., and Litchy, M.: Aerosol dynamics in the equatorial Pacific marine boundary layer: Microphysics, diurnal cycles and entrainment, Geophys. Res. Lett., 23, 733–736, https://doi.org/10.1029/96gl00778, 1996. a
DeMott, P. J., Sassen, K., Poellot, M. R., Baumgardner, D., Rogers, D. C., Brooks, S. D., Prenni, A. J., and Kreidenweis, S. M.: African dust aerosols as atmospheric ice nuclei, Geophys. Res. Lett., 30, 1732, https://doi.org/10.1029/2003GL017410, 2003. a
DeMott, P. J., Hill, T. C. J., McCluskey, C. S., Prather, K. A., Collins, D. B., Sullivan, R. C., Ruppel, M. J., Mason, R. H., Irish, V. E., Lee, T., Hwang, C. Y., Rhee, T. S., Snider, J. R., McMeeking, G. R., Dhaniyala, S., Lewis, E. R., Wentzell, J. J. B., Abbatt, J., Lee, C., Sultana, C. M., Ault, A. P., Axson, J. L., Diaz Martinez, M., Venero, I., Santos-Figueroa, G., Stokes, M. D., Deane, G. B., Mayol-Bracero, O. L., Grassian, V. H., Bertram, T. H., Bertram, A. K., Moffett, B. F., and Franc, G. D.: Sea spray aerosol as a unique source of ice nucleating particles, P. Natl. Acad. Sci. USA, 113, 5797–5803, https://doi.org/10.1073/pnas.1514034112, 2016. a
Dusek, U., Frank, G., Hildebrandt, L., Curtius, J., Schneider, J., Walter, S., Chand, D., Drewnick, F., Hings, S., Jung, D., Borrmann, S., and Andreae, M. O.: Size matters more than chemistry for cloud-nucleating ability of aerosol particles, Science, 312, 1375–1378, 2006. a
Fomba, K. W., Müller, K., van Pinxteren, D., and Herrmann, H.: Aerosol size-resolved trace metal composition in remote northern tropical Atlantic marine environment: case study Cape Verde islands, Atmos. Chem. Phys., 13, 4801–4814, https://doi.org/10.5194/acp-13-4801-2013, 2013. a
Fomba, K. W., Müller, K., van Pinxteren, D., Poulain, L., van Pinxteren, M., and Herrmann, H.: Long-term chemical characterization of tropical and marine aerosols at the Cape Verde Atmospheric Observatory (CVAO) from 2007 to 2011, Atmos. Chem. Phys., 14, 8883–8904, https://doi.org/10.5194/acp-14-8883-2014, 2014. a, b, c, d
Fuentes, E., Coe, H., Green, D., and McFiggans, G.: On the impacts of phytoplankton-derived organic matter on the properties of the primary marine aerosol – Part 2: Composition, hygroscopicity and cloud condensation activity, Atmos. Chem. Phys., 11, 2585–2602, https://doi.org/10.5194/acp-11-2585-2011, 2011. a
Gama, C., Tchepel, O., Baldasano, J. M., Basart, S., Ferreira, J., Pio, C., Cardoso, J. a., and Borrego, C.: Seasonal patterns of Saharan dust over Cape Verde – a combined approach using observations and modelling, Tellus B, 67, 24410, https://doi.org/10.3402/tellusb.v67.24410, 2015. a
Garrison, V. H., Majewski, M. S., Foreman, W. T., Genualdi, S. A., Mohammed, A., and Massey Simonich, S. L.: Persistent organic contaminants in Saharan dust air masses in West Africa, Cape Verde and the eastern Caribbean, Sci. Total Environ., 468–469, 530–543, https://doi.org/10.1016/j.scitotenv.2013.08.076, 2014. a
Ginoux, P., Chin, M., Tegen, I., Prospero, J. M., Holben, B., Dubovik, O., and Lin, S.-J.: Sources and distributions of dust aerosols simulated with the GOCART model, J. Geophys. Res.-Atmos., 106, 20255–20273, https://doi.org/10.1029/2000JD000053, 2001. a
Ginoux, P., Prospero, J. M., Gill, T. E., Hsu, N. C., and Zhao, M.: Global-scale attribution of anthropogenic and natural dust sources and their emission rates based on MODIS Deep Blue aerosol products, Rev. Geophys., 50, RG3005, https://doi.org/10.1029/2012RG000388, 2012. a
Gong, X., Wex, H., Voigtländer, J., Fomba, K. W., Weinhold, K., van Pinxteren, M., Henning, S., Müller, T., Herrmann, H., and Stratmann, F.: Ground-based measurements on aerosol particles at Cape Verde (Sep–Oct 2017), PANGAEA, https://doi.org/10.1594/PANGAEA.905070, 2019. a
Gong, X., Wex, H., van Pinxteren, M., Triesch, N., Fomba, K. W., Lubitz, J., Stolle, C., Robinson, T.-B., Müller, T., Herrmann, H., and Stratmann, F.: Characterization of aerosol particles at Cabo Verde close to sea level and at the cloud level – Part 2: Ice-nucleating particles in air, cloud and seawater, Atmos. Chem. Phys., 20, 1451–1468, https://doi.org/10.5194/acp-20-1451-2020, 2020. a
Goudie, A. S. and Middleton, N. J.: Saharan dust storms: nature and consequences, Earth-Sci. Rev., 56, 179–204, https://doi.org/10.1016/S0012-8252(01)00067-8, 2001. a, b
Gysel, M. and Stratmann, F.: WP3 – NA3: In-situ chemical, physical and optical properties of aerosols, Deliverable D3.11: Standardized protocol for CCN measurements, Tech. rep., available at: http://www.actris.net/Publications/ACTRISQualityStandards/tabid/11271/language/en-GB/Default.aspx (last access: 4 February 2020), 2013. a
Heinold, B., Tegen, I., Schepanski, K., Tesche, M., Esselborn, M., Freudenthaler, V., Gross, S., Kandler, K., Knippertz, P., Müller, D., Schladitz, A., Toledano, C., Weinzierl, B., Ansmann, A., Althausen, D., Müller, T., Petzold, A., and Wiedensohler, A.: Regional modelling of Saharan dust and biomass-burning smoke, Tellus B, 63, 781–799, https://doi.org/10.1111/j.1600-0889.2011.00570.x, 2011. a
Herenz, P., Wex, H., Henning, S., Kristensen, T. B., Rubach, F., Roth, A., Borrmann, S., Bozem, H., Schulz, H., and Stratmann, F.: Measurements of aerosol and CCN properties in the Mackenzie River delta (Canadian Arctic) during spring–summer transition in May 2014, Atmos. Chem. Phys., 18, 4477–4496, https://doi.org/10.5194/acp-18-4477-2018, 2018. a
Hoppel, W., Frick, G., and Larson, R.: Effect of nonprecipitating clouds on the aerosol size distribution in the marine boundary layer, Geophys. Res. Lett., 13, 125–128, https://doi.org/10.1029/GL013i002p00125, 1986. a
Hoppel, W. A., Frick, G. M., Fitzgerald, J. W., and Larson, R. E.: Marine boundary layer measurements of new particle formation and the effects nonprecipitating clouds have on aerosol size distribution, J. Geophys. Res.-Atmos., 99, 14 443–14 459, https://doi.org/10.1029/94JD00797, 1994. a
Huang, J., Lin, B., Minnis, P., Wang, T., Wang, X., Hu, Y., Yi, Y., and Ayers, J. K.: Satellite-based assessment of possible dust aerosols semi-direct effect on cloud water path over East Asia, Geophys. Res. Lett., 33, L19802, https://doi.org/10.1029/2006GL026561, 2006. a
Jaenicke, R. and Schütz, L.: Comprehensive study of physical and chemical properties of the surface aerosols in the Cape Verde Islands region, J. Geophys. Res.-Oceans, 83, 3585–3599, https://doi.org/10.1029/JC083iC07p03585, 1978. a
Kaaden, N., Massling, A., Schladitz, A., Müller, T., Kandler, K., Schütz, L., Weinzierl, B., Petzold, A., Tesche, M., Leinert, S., Deutscher, C., Ebert, M., Weinbruch, S., and Wiedensohler, A.: State of mixing, shape factor, number size distribution, and hygroscopic growth of the Saharan anthropogenic and mineral dust aerosol at Tinfou, Morocco, Tellus B, 61, 51–63, https://doi.org/10.1111/j.1600-0889.2008.00388.x, 2009. a
Kalivitis, N., Kerminen, V.-M., Kouvarakis, G., Stavroulas, I., Bougiatioti, A., Nenes, A., Manninen, H. E., Petäjä, T., Kulmala, M., and Mihalopoulos, N.: Atmospheric new particle formation as a source of CCN in the eastern Mediterranean marine boundary layer, Atmos. Chem. Phys., 15, 9203–9215, https://doi.org/10.5194/acp-15-9203-2015, 2015. a
Kandler, K., SchüTz, L., Deutscher, C., Ebert, M., Hofmann, H., JäCkel, S., Jaenicke, R., Knippertz, P., Lieke, K., Massling, A., Petzold, A., Schladitz, A., Weinzierl, B., Wiedensohler, A., Zorn, S., and Weinbruch, S.: Size distribution, mass concentration, chemical and mineralogical composition and derived optical parameters of the boundary layer aerosol at Tinfou, Morocco, during SAMUM 2006, Tellus B, 61, 32–50, https://doi.org/10.1111/j.1600-0889.2008.00385.x, 2009. a
Kandler, K., Lieke, K., Benker, N., Emmel, C., Küpper, M., Müller-Ebert, D., Ebert, M., Scheuvens, D., Schladitz, A., Schütz, L., and Weinbruch, S.: Electron microscopy of particles collected at Praia, Cape Verde, during the Saharan Mineral Dust Experiment: particle chemistry, shape, mixing state and complex refractive index, Tellus B, 63, 475–496, https://doi.org/10.1111/j.1600-0889.2011.00550.x, 2011a. a
Kandler, K., Schütz, L., Jäckel, S., Lieke, K., Emmel, C., Müller-Ebert, D., Ebert, M., Scheuvens, D., Schladitz, A., S̆egvić, B., Wiedensohler, A., and Weinbruch, S.: Ground-based off-line aerosol measurements at Praia, Cape Verde, during the Saharan Mineral Dust Experiment: microphysical properties and mineralogy, Tellus B, 63, 459–474, https://doi.org/10.1111/j.1600-0889.2011.00546.x, 2011b. a
Karydis, V. A., Kumar, P., Barahona, D., Sokolik, I. N., and Nenes, A.: On the effect of dust particles on global cloud condensation nuclei and cloud droplet number, J. Geophys. Res.-Atmos., 116, D23204, https://doi.org/10.1029/2011JD016283, 2011. a
Köhler, H.: The nucleus in and the growth of hygroscopic droplets, T. Faraday Soc., 32, 1152–1161, 1936. a
Kristensen, T. B., Müller, T., Kandler, K., Benker, N., Hartmann, M., Prospero, J. M., Wiedensohler, A., and Stratmann, F.: Properties of cloud condensation nuclei (CCN) in the trade wind marine boundary layer of the western North Atlantic, Atmos. Chem. Phys., 16, 2675–2688, https://doi.org/10.5194/acp-16-2675-2016, 2016. a, b, c
Lieke, K., Kandler, K., Scheuvens, D., Emmel, C., Von Glahn, C., Petzold, A., Weinzierl, B., Veira, A., Ebert, M., Weinbruch, S., and Schütz, L.: Particle chemical properties in the vertical column based on aircraft observations in the vicinity of Cape Verde Islands, Tellus B, 63, 497–511, https://doi.org/10.1111/j.1600-0889.2011.00553.x, 2011. a
Modini, R. L., Frossard, A. A., Ahlm, L., Russell, L. M., Corrigan, C. E., Roberts, G. C., Hawkins, L. N., Schroder, J. C., Bertram, A. K., Zhao, R., Lee, A. K. Y., Abbatt, J. P. D., Lin, J., Nenes, A., Wang, Z., Wonaschütz, A., Sorooshian, A., Noone, K. J., Jonsson, H., Seinfeld, J. H., Toom-Sauntry, D., Macdonald, A. M., and Leaitch, W. R.: Primary marine aerosol-cloud interactions off the coast of California, J. Geophys. Res.-Atmos., 120, 4282–4303, https://doi.org/10.1002/2014JD022963, 2015. a, b, c, d, e, f
Nie, W., Ding, A., Wang, T., Kerminen, V.-M., George, C., Xue, L., Wang, W., Zhang, Q., Petäjä, T., Qi, X., Gao, X., Wang, X., Yang, X., Fu, C., and Kulmala, M.: Polluted dust promotes new particle formation and growth, Sci. Rep., 4, 6634, https://doi.org/10.1038/srep06634, 2014. a
Petters, M. D. and Kreidenweis, S. M.: A single parameter representation of hygroscopic growth and cloud condensation nucleus activity, Atmos. Chem. Phys., 7, 1961–1971, https://doi.org/10.5194/acp-7-1961-2007, 2007. a, b
Pfeifer, S., Müller, T., Weinhold, K., Zikova, N., Martins dos Santos, S., Marinoni, A., Bischof, O. F., Kykal, C., Ries, L., Meinhardt, F., Aalto, P., Mihalopoulos, N., and Wiedensohler, A.: Intercomparison of 15 aerodynamic particle size spectrometers (APS 3321): uncertainties in particle sizing and number size distribution, Atmos. Meas. Tech., 9, 1545–1551, https://doi.org/10.5194/amt-9-1545-2016, 2016. a
Prather, K. A., Bertram, T. H., Grassian, V. H., Deane, G. B., Stokes, M. D., DeMott, P. J., Aluwihare, L. I., Palenik, B. P., Azam, F., Seinfeld, J. H., Moffet, R. C., Molina, M. J., Cappa, C. D., Geiger, F. M., Roberts, G. C., Russell, L. M., Ault, A. P., Baltrusaitis, J., Collins, D. B., Corrigan, C. E., Cuadra-Rodriguez, L. A., Ebben, C. J., Forestieri, S. D., Guasco, T. L., Hersey, S. P., Kim, M. J., Lambert, W. F., Modini, R. L., Mui, W., Pedler, B. E., Ruppel, M. J., Ryder, O. S., Schoepp, N. G., Sullivan, R. C., and Zhao, D.: Bringing the ocean into the laboratory to probe the chemical complexity of sea spray aerosol, P. Natl. Acad. Sci. USA, 110, 7550–7555, https://doi.org/10.1073/pnas.1300262110, 2013. a
Pringle, K. J., Tost, H., Pozzer, A., Pöschl, U., and Lelieveld, J.: Global distribution of the effective aerosol hygroscopicity parameter for CCN activation, Atmos. Chem. Phys., 10, 5241–5255, https://doi.org/10.5194/acp-10-5241-2010, 2010. a, b, c, d
Prospero, J. M., Ginoux, P., Torres, O., Nicholson, S. E., and Gill, T. E.: Environmental characterization of global sources of atmospheric soil dust identified with the nimbus 7 total ozone mapping spectrometer (TOMS) absorbing aerosol product, Rev. Geophys., 40, 2-1–2-31, https://doi.org/10.1029/2000RG000095, 2002. a
Quinn, P. K., Collins, D. B., Grassian, V. H., Prather, K. A., and Bates, T. S.: Chemistry and Related Properties of Freshly Emitted Sea Spray Aerosol, Chem. Rev., 115, 4383–4399, https://doi.org/10.1021/cr500713g, 2015. a, b
Quinn, P. K., Coffman, D. J., Johnson, J. E., Upchurch, L. M., and Bates, T. S.: Small fraction of marine cloud condensation nuclei made up of sea spray aerosol, Nat. Geosci., 10, 674, https://doi.org/10.1038/ngeo3003, 2017. a, b
Roberts, G. C. and Nenes, A.: A Continuous-Flow Streamwise Thermal-Gradient CCN Chamber for Atmospheric Measurements, Aerosol Sci. Technol., 39, 206–221, https://doi.org/10.1080/027868290913988, 2005. a
Rolph, G.: Real-time environmental applications and display system (READY) website, available at: https://www.ready.noaa.gov/index.php (last access: 4 February 2020), 2003. a
Rosati, B., Gysel, M., Rubach, F., Mentel, T. F., Goger, B., Poulain, L., Schlag, P., Miettinen, P., Pajunoja, A., Virtanen, A., Klein Baltink, H., Henzing, J. S. B., Größ, J., Gobbi, G. P., Wiedensohler, A., Kiendler-Scharr, A., Decesari, S., Facchini, M. C., Weingartner, E., and Baltensperger, U.: Vertical profiling of aerosol hygroscopic properties in the planetary boundary layer during the PEGASOS campaigns, Atmos. Chem. Phys., 16, 7295–7315, https://doi.org/10.5194/acp-16-7295-2016, 2016a. a, b
Rosati, B., Herrmann, E., Bucci, S., Fierli, F., Cairo, F., Gysel, M., Tillmann, R., Größ, J., Gobbi, G. P., Di Liberto, L., Di Donfrancesco, G., Wiedensohler, A., Weingartner, E., Virtanen, A., Mentel, T. F., and Baltensperger, U.: Studying the vertical aerosol extinction coefficient by comparing in situ airborne data and elastic backscatter lidar, Atmos. Chem. Phys., 16, 4539–4554, https://doi.org/10.5194/acp-16-4539-2016, 2016b. a, b, c
Rose, D., Gunthe, S. S., Mikhailov, E., Frank, G. P., Dusek, U., Andreae, M. O., and Pöschl, U.: Calibration and measurement uncertainties of a continuous-flow cloud condensation nuclei counter (DMT-CCNC): CCN activation of ammonium sulfate and sodium chloride aerosol particles in theory and experiment, Atmos. Chem. Phys., 8, 1153–1179, https://doi.org/10.5194/acp-8-1153-2008, 2008. a
Salvador, P., Artíñano, B., Molero, F., Viana, M., Pey, J., Alastuey, A., and Querol, X.: African dust contribution to ambient aerosol levels across central Spain: Characterization of long-range transport episodes of desert dust, Atmos. Res., 127, 117–129, https://doi.org/10.1016/j.atmosres.2011.12.011, 2013. a
Salvador, P., Almeida, S. M., Cardoso, J., Almeida-Silva, M., Nunes, T., Cerqueira, M., Alves, C., Reis, M. A., Chaves, P. C., Artíñano, B., and Pio, C.: Composition and origin of PM10 in Cape Verde: Characterization of long-range transport episodes, Atmos. Environ., 127, 326–339, https://doi.org/10.1016/j.atmosenv.2015.12.057, 2016. a, b, c
Sassen, K., DeMott, P. J., Prospero, J. M., and Poellot, M. R.: Saharan dust storms and indirect aerosol effects on clouds: CRYSTAL-FACE results, Geophys. Res. Lett., 30, 1633, https://doi.org/10.1029/2003GL017371, 2003. a
Schladitz, A., Müller, T., Nordmann, S., Tesche, M., Groß, S., Freudenthaler, V., Gasteiger, J., and Wiedensohler, A.: In situ aerosol characterization at Cape Verde, Part 2: Parameterization of relative humidity- and wavelength-dependent aerosol optical properties, Tellus B, 63, 549–572, https://doi.org/10.1111/j.1600-0889.2011.00568.x, 2011a. a, b, c, d
Schladitz, A., Müller, T., Nowak, A., Kandler, K., Lieke, K., Massling, A., and Wiedensohler, A.: In situ aerosol characterization at Cape Verde, Part1: Particle number size distributions, hygroscopic growth and state of mixing of mrine and Saharan dust aerosol, Tellus B, 63, 531–548, https://doi.org/10.1111/j.1600-0889.2011.00569.x, 2011b. a, b, c, d
Seinfeld, J. H. and Pandis, S. N.: Atmospheric chemistry and physics: from air pollution to climate change, John Wiley & Sons, 2016. a, b
Shao, Y., Wyrwoll, K.-H., Chappell, A., Huang, J., Lin, Z., McTainsh, G. H., Mikami, M., Tanaka, T. Y., Wang, X., and Yoon, S.: Dust cycle: An emerging core theme in Earth system science, Aeolian Res., 2, 181–204, https://doi.org/10.1016/j.aeolia.2011.02.001, 2011. a
Stein, A. F., Draxler, R. R., Rolph, G. D., Stunder, B. J. B., Cohen, M. D., and Ngan, F.: NOAA's HYSPLIT Atmospheric Transport and Dispersion Modeling System, B. Am. Meteorol. Soc., 96, 2059–2077, https://doi.org/10.1175/bams-d-14-00110.1, 2015. a
Stocker, T.: Climate change 2013: the physical science basis: Working Group I contribution to the Fifth assessment report of the Intergovernmental Panel on Climate Change, Cambridge University Press, 2014. a
Swap, R., Garstang, M., Greco, S., Talbot, R., and Kallberg, P.: Saharan dust in the Amazon Basin, Tellus B, 44, 133–149, https://doi.org/10.1034/j.1600-0889.1992.t01-1-00005.x, 1992. a
Tanaka, T. Y. and Chiba, M.: A numerical study of the contributions of dust source regions to the global dust budget, Global Planet. Change, 52, 88–104, https://doi.org/10.1016/j.gloplacha.2006.02.002, 2006. a
Tesche, M., Ansmann, A., Müller, D., Althausen, D., Engelmann, R., Freudenthaler, V., and Groß, S.: Vertically resolved separation of dust and smoke over Cape Verde using multiwavelength Raman and polarization lidars during Saharan Mineral Dust Experiment 2008, J. Geophys. Res.-Atmos., 114, D13202, https://doi.org/10.1029/2009JD011862, 2009. a
Twomey, S.: Pollution and the planetary albedo, Atmos. Environ., 8, 1251–1256, 1974. a
van Pinxteren, M., Fomba, K. W., Triesch, N., Stolle, C., Wurl, O., Bahlmann, E., Gong, X., Voigtländer, J., Wex, H., Robinson, T.-B., Barthel, S., Zeppenfeld, S., Hoffmann, E. H., Roveretto, M., Li, C., Grosselin, B., Daële, V., Senf, F., van Pinxteren, D., Manzi, M., Zabalegui, N., Frka, S., Gašparović, B., Pereira, R., Li, T., Wen, L., Li, J., Zhu, C., Chen, H., Chen, J., Fiedler, B., von Tümpling, W., Read, K. A., Punjabi, S., C. Lewis, A. C., Hopkins, J. R., Carpenter, L. J., Peeken, I., Rixen, T., Schulz-Bull, D., Monge, M. E., Mellouki, A., George, C., Stratmann, F., and Herrmann, H.: Marine organic matter in the remote environment of the Cape Verde Islands – An introduction and overview to the MarParCloud campaign, Atmos. Chem. Phys. Discuss., https://doi.org/10.5194/acp-2019-997, in review, 2019. a
von der Weiden, S.-L., Drewnick, F., and Borrmann, S.: Particle Loss Calculator – a new software tool for the assessment of the performance of aerosol inlet systems, Atmos. Meas. Tech., 2, 479–494, https://doi.org/10.5194/amt-2-479-2009, 2009. a
Warneck, P.: Chemistry of the natural atmosphere, 2nd Edn., vol. 71, ISBN 10 0127356320, Elsevier, Academic Press, London, UK, 1999. a
Weinzierl, B., Petzold, A., Esselborn, M., Wirth, M., Rasp, K., Kandler, K., Schütz, L., Koepke, P., and Fiebig, M.: Airborne measurements of dust layer properties, particle size distribution and mixing state of Saharan dust during SAMUM 2006, Tellus B, 61, 96–117, https://doi.org/10.1111/j.1600-0889.2008.00392.x, 2009. a
Wex, H., Dieckmann, K., Roberts, G. C., Conrath, T., Izaguirre, M. A., Hartmann, S., Herenz, P., Schäfer, M., Ditas, F., Schmeissner, T., Henning, S., Wehner, B., Siebert, H., and Stratmann, F.: Aerosol arriving on the Caribbean island of Barbados: physical properties and origin, Atmos. Chem. Phys., 16, 14107–14130, https://doi.org/10.5194/acp-16-14107-2016, 2016. a, b, c, d, e, f, g
Wiedensohler, A.: An approximation of the bipolar charge distribution for particles in the submicron size range, J. Aerosol Sci., 19, 387–389, https://doi.org/10.1016/0021-8502(88)90278-9, 1988. a
Wiedensohler, A., Birmili, W., Nowak, A., Sonntag, A., Weinhold, K., Merkel, M., Wehner, B., Tuch, T., Pfeifer, S., Fiebig, M., Fjäraa, A. M., Asmi, E., Sellegri, K., Depuy, R., Venzac, H., Villani, P., Laj, P., Aalto, P., Ogren, J. A., Swietlicki, E., Williams, P., Roldin, P., Quincey, P., Hüglin, C., Fierz-Schmidhauser, R., Gysel, M., Weingartner, E., Riccobono, F., Santos, S., Grüning, C., Faloon, K., Beddows, D., Harrison, R., Monahan, C., Jennings, S. G., O'Dowd, C. D., Marinoni, A., Horn, H.-G., Keck, L., Jiang, J., Scheckman, J., McMurry, P. H., Deng, Z., Zhao, C. S., Moerman, M., Henzing, B., de Leeuw, G., Löschau, G., and Bastian, S.: Mobility particle size spectrometers: harmonization of technical standards and data structure to facilitate high quality long-term observations of atmospheric particle number size distributions, Atmos. Meas. Tech., 5, 657–685, https://doi.org/10.5194/amt-5-657-2012, 2012. a
Wiedensohler, A., Wiesner, A., Weinhold, K., Birmili, W., Hermann, M., Merkel, M., Müller, T., Pfeifer, S., Schmidt, A., Tuch, T., Velarde, F., Quincey, P., Seeger, S., and Nowak, A.: Mobility particle size spectrometers: Calibration procedures and measurement uncertainties, Aerosol Sci. Technol., 52, 146–164, https://doi.org/10.1080/02786826.2017.1387229, 2018. a
Wilson, T. W., Ladino, L. A., Alpert, P. A., Breckels, M. N., Brooks, I. M., Browse, J., Burrows, S. M., Carslaw, K. S., Huffman, J. A., Judd, C., Kilthau, W. P., Mason, R. H., McFiggans, G., Miller, L. A., Najera, J. J., Polishchuk, E., Rae, S., Schiller, C. L., Si, M., Temprado, J. V., Whale, T. F., Wong, J. P. S., Wurl, O., Yakobi-Hancock, J. D., Abbatt, J. P. D., Aller, J. Y., Bertram, A. K., Knopf, D. A., and Murray, B. J.: A marine biogenic source of atmospheric ice-nucleating particles, Nature, 525, 234–238, https://doi.org/10.1038/nature14986, 2015. a