the Creative Commons Attribution 4.0 License.
the Creative Commons Attribution 4.0 License.
 | 18 Nov 2019
Profiles of cloud condensation nuclei, dust mass concentration, and ice-nucleating-particle-relevant aerosol properties in the Saharan Air Layer over Barbados from polarization lidar and airborne in situ measurements
Adrian Walser
Albert Ansmann
Maximilian Dollner
Dietrich Althausen
Daniel Sauer
David Farrell
Bernadett Weinzierl
The present study aims to evaluate lidar retrievals of cloud-relevant aerosol properties by using polarization lidar and coincident airborne in situ measurements in the Saharan Air Layer (SAL) over the Barbados region. Vertical profiles of the number concentration of cloud condensation nuclei (CCN), large particles (diameter d>500 nm), surface area, mass, and ice-nucleating particle (INP) concentration are derived from the lidar measurements and compared with CCN concentrations and the INP-relevant aerosol properties measured in situ with aircraft. The measurements were performed in the framework of the Saharan Aerosol Long-range Transport and Aerosol-Cloud-Interaction Experiment (SALTRACE) in summer 2013.
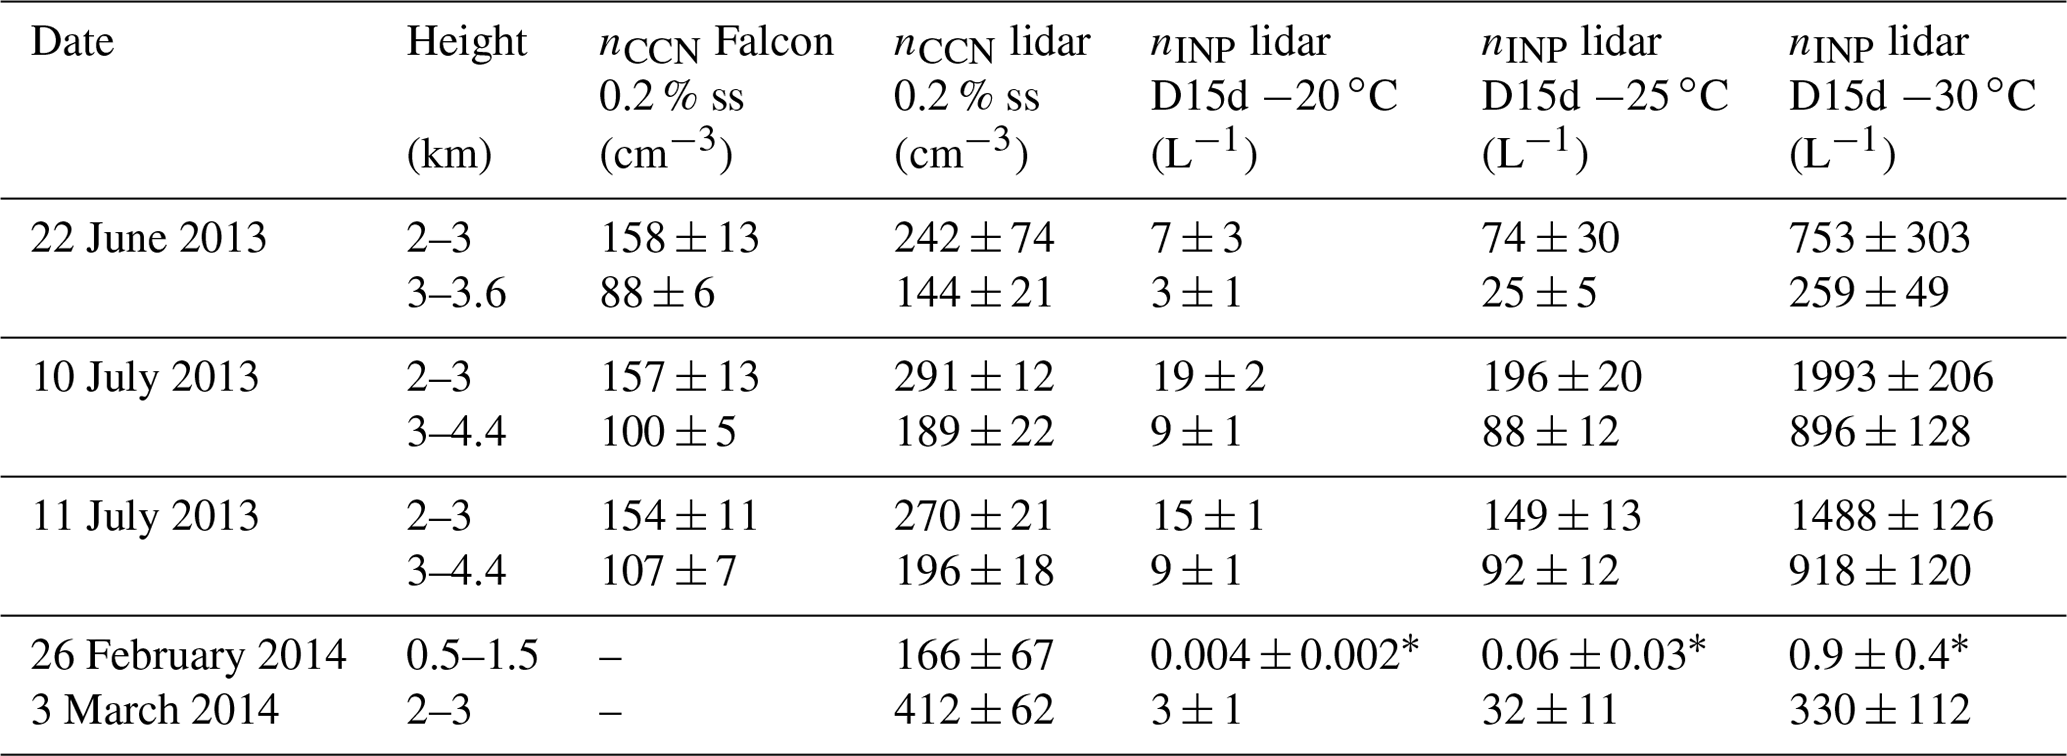
The CCN number concentrations derived from lidar observations were up to a factor of 2 higher than the ones measured in situ aboard the research aircraft Falcon. Possible reasons for the difference are discussed. The number concentration of particles with a dry radius of more than 250 nm and the surface-area concentration obtained from the lidar observations and used as input for the INP parameterizations agreed well (<30 %–50 % deviation) with the aircraft measurements. In a pronounced lofted dust layer during summer (10 July 2013), the lidar retrieval yielded 100–300 CCN per cubic centimeter at 0.2 % water supersaturation and 10–200 INPs per liter at −25 ∘C. Excellent agreement was also obtained in the comparison of mass concentration profiles.
During the SALTRACE winter campaign (March 2014), the dust layer from Africa was mixed with smoke particles which dominated the CCN number concentration. This example highlights the unique lidar potential to separate smoke and dust contributions to the CCN reservoir and thus to identify the sensitive role of smoke in trade wind cumuli developments over the tropical Atlantic during the winter season.
- Article
(12663 KB) - Full-text XML
- BibTeX
- EndNote


Climate predictions are highly uncertain (IPCC, 2013). One of the reasons is our poor knowledge of the impact of atmospheric aerosol on cloud processes. To improve our understanding of aerosol–cloud interaction, new techniques for profiling of cloud condensation nuclei (CCN) and ice-nucleating particles (INPs) are required. Lidar permits regular and continuous monitoring of the cloud-relevant aerosol properties up to the tropopause height. Methods have been developed to retrieve CCN- and INP-relevant particle microphysical properties from particle extinction coefficients measured with lidar (Mamouri and Ansmann, 2016; Sawamura et al., 2017; Lv et al., 2018). In the case of INP profiling, particle extinction coefficients are converted to particle number concentrations n250 (particles with dry radius >250 nm) and particle surface-area concentrations s. The n250 profile is input in the INP parameterization schemes of DeMott et al. (2010, 2015) and Tobo et al. (2013), and s profiles are input in respective INP parameterizations by Niemand et al. (2012), Steinke et al. (2015), Ullrich et al. (2017), McCluskey et al. (2018), and Harrison et al. (2019). The entire lidar-based INP retrieval procedure is described by Mamouri and Ansmann (2016). The first comparisons of the CCN lidar retrievals with airborne in situ observations over a polluted central European site are presented by Düsing et al. (2018). Sawamura et al. (2017) found good agreement of the lidar-derived surface-area and volume concentration with coincident airborne in situ observations focusing on air quality and explicitly excluding periods with the presence of dust particles. Airborne INP studies in the Cabo Verde region found around 100 INPs per liter at −23 ∘C in the Saharan Air Layer (SAL; Price et al., 2018). The first comparisons of lidar and in situ observations in dusty environments (Eastern Mediterranean) regarding INPs can be found in Schrod et al. (2017) and Marinou et al. (2019).
In this article, we present a detailed comparison of ground-based lidar retrievals to airborne in situ observations of CCN number concentration and INP-relevant aerosol properties. Using observations of transported dust over the remote Atlantic 5000 km west of the source regions in Africa, we demonstrate the capability of the lidar retrievals to predict the aerosol properties relevant to aerosol–cloud interaction. We use the opportunity of the SALTRACE campaign (Saharan Aerosol Long-range Transport and Aerosol-Cloud-Interaction Experiment; Weinzierl et al., 2017), conducted in the Caribbean (Barbados region), for this goal. More than 12 weeks of lidar measurements were performed in June–July 2013 (SALTRACE-1), February–March 2014 (SALTRACE-2), and June–July 2014 (SALTRACE-3). A triple-wavelength polarization Raman lidar (Haarig et al., 2017a) of the Leibniz Institute for Tropospheric Research (TROPOS) was operated at the Caribbean Institute for Meteorology and Hydrology (CIMH), north of Bridgetown, Barbados (13.15∘ N, 59.62∘ W; 110 m a.s.l.). Airborne in situ measurements were performed during SALTRACE-1. An overview of the instrumentation aboard the research aircraft Falcon of the German Aerospace Center (Deutsches Zentrum für Luft- und Raumfahrt – DLR) is given by Weinzierl et al. (2017).
SALTRACE observations of the long-range transported Saharan dust have been published in the SALTRACE special issue (Groß et al., 2015; Haarig et al., 2017a; Gasteiger et al., 2017; Kandler et al., 2018). The lofted dust plumes in the SAL occur between the 1.5 and 5 km height. Many simultaneous measurements with aircraft and the ground-based lidar have been realized during SALTRACE. For our study, we use the Falcon observations of the particle size distribution and of the CCN number concentration. In the lidar-Falcon comparisons, three case studies are analyzed. CCN properties have been studied previously in the Caribbean but without involving vertical profiling with lidar (Siebert et al., 2013; Kristensen et al., 2016; Wex et al., 2016; Jung et al., 2016). A dust–smoke mixture and a pure marine case from the SALTRACE-2 (winter campaign) are presented in addition to contrast the almost pure dust conditions prevailing during the summer half-year. This comparison highlights the strong impact of smoke particles on the CCN levels over the remote tropical Atlantic during the winter half-year (biomass-burning season). In contrast, the pristine marine case demonstrates the aerosol conditions without long-range transport of African aerosol to the Caribbean.
The paper is structured as follows: in Sect. 2, the ground-based and airborne instrumentation and the lidar retrieval are shortly presented. Then the three Saharan dust cases (used in our comparison study) are described with respect to dust layering, the meteorological context, and air mass transport (Sect. 3). In Sect. 4, CCN concentrations and particle number, surface area, and mass concentrations obtained from the aircraft and lidar measurements are compared. In Sect. 5, summer and winter lidar observations are contrasted. A summary and concluding remarks are given in the last section.
2.1 Lidar retrievals of CCN and INP concentrations
The triple-wavelength polarization Raman lidar BERTHA (Backscatter, Extinction, lidar Ratio, Temperature, Humidity profiling Apparatus) described in Haarig et al. (2017a) measures the backscatter coefficient at three wavelengths (355, 532, and 1064 nm) and the extinction coefficient at 355 and 532 nm and in a new configuration also at 1064 nm (Haarig et al., 2016). The depolarization ratio is measured at 355, 532, and 1064 nm simultaneously. The inelastic (Raman) channels at 387 and 607 nm enabling the independent measurement of the extinction coefficient (Ansmann et al., 1992) can be used at night only. The sunlight causes an enhanced background noise level due to the broad interference filter (3 nm width). In order to have coincident observations of lidar and aircraft, daytime measurements had to be used in the present study. The closest nighttime observation (always from the same date) provided the extinction-to-backscatter ratio (lidar ratio) to constrain the daytime observations. For daytime measurements, the calculation of the backscatter coefficient from the elastic signals at 355, 532, and 1064 nm was performed via the Fernald–Klett method (Klett, 1981; Fernald, 1984).
The conversion from backscatter coefficient and particle linear depolarization ratio (PLDR) to particle number and surface-area concentration follows the method described in Mamouri and Ansmann (2015, 2016). The particle depolarization ratio is used to separate the contributions of different aerosol types to the backscatter coefficient: mineral dust (d) with a high depolarization ratio (around 0.3), marine aerosol (m) with a low depolarization ratio in the humid state (≤0.05), and continental aerosol (c) with a low depolarization ratio (≤0.05). By multiplication with an appropriate extinction-to-backscatter ratio (lidar ratio; Müller et al., 2007; Groß et al., 2013; Baars et al., 2016), the backscatter coefficients are converted into extinction coefficients (see also description in Marinou et al., 2019). These extinction coefficients were verified independently by BERTHA's Raman lidar measurements at night. Long-term AERONET observations (columnar particle number concentrations and aerosol optical depth – AOD; Holben et al., 1998) are used to derive empirical conversion factors from extinction coefficients to particle number and surface-area concentrations (Mamouri and Ansmann, 2016; Ansmann et al., 2019). The respective equations and the conversion factors are listed in Table 1. The AERONET data are filtered for dust events (Ångström exponent AE < 0.3, AOT > 0.1, at 500 nm) and pure marine (0.25 < AE < 0.6, AOT < 0.07) and continental (AE > 1.6) conditions. It should be mentioned that the conversion factor for small continental aerosol particles (; particles with radius >50 nm) is obtained using AERONET data from Leipzig (central Europe), but with a factor of 0.5 to best approximate the African rural aerosol conditions (Shinozuka et al., 2015).
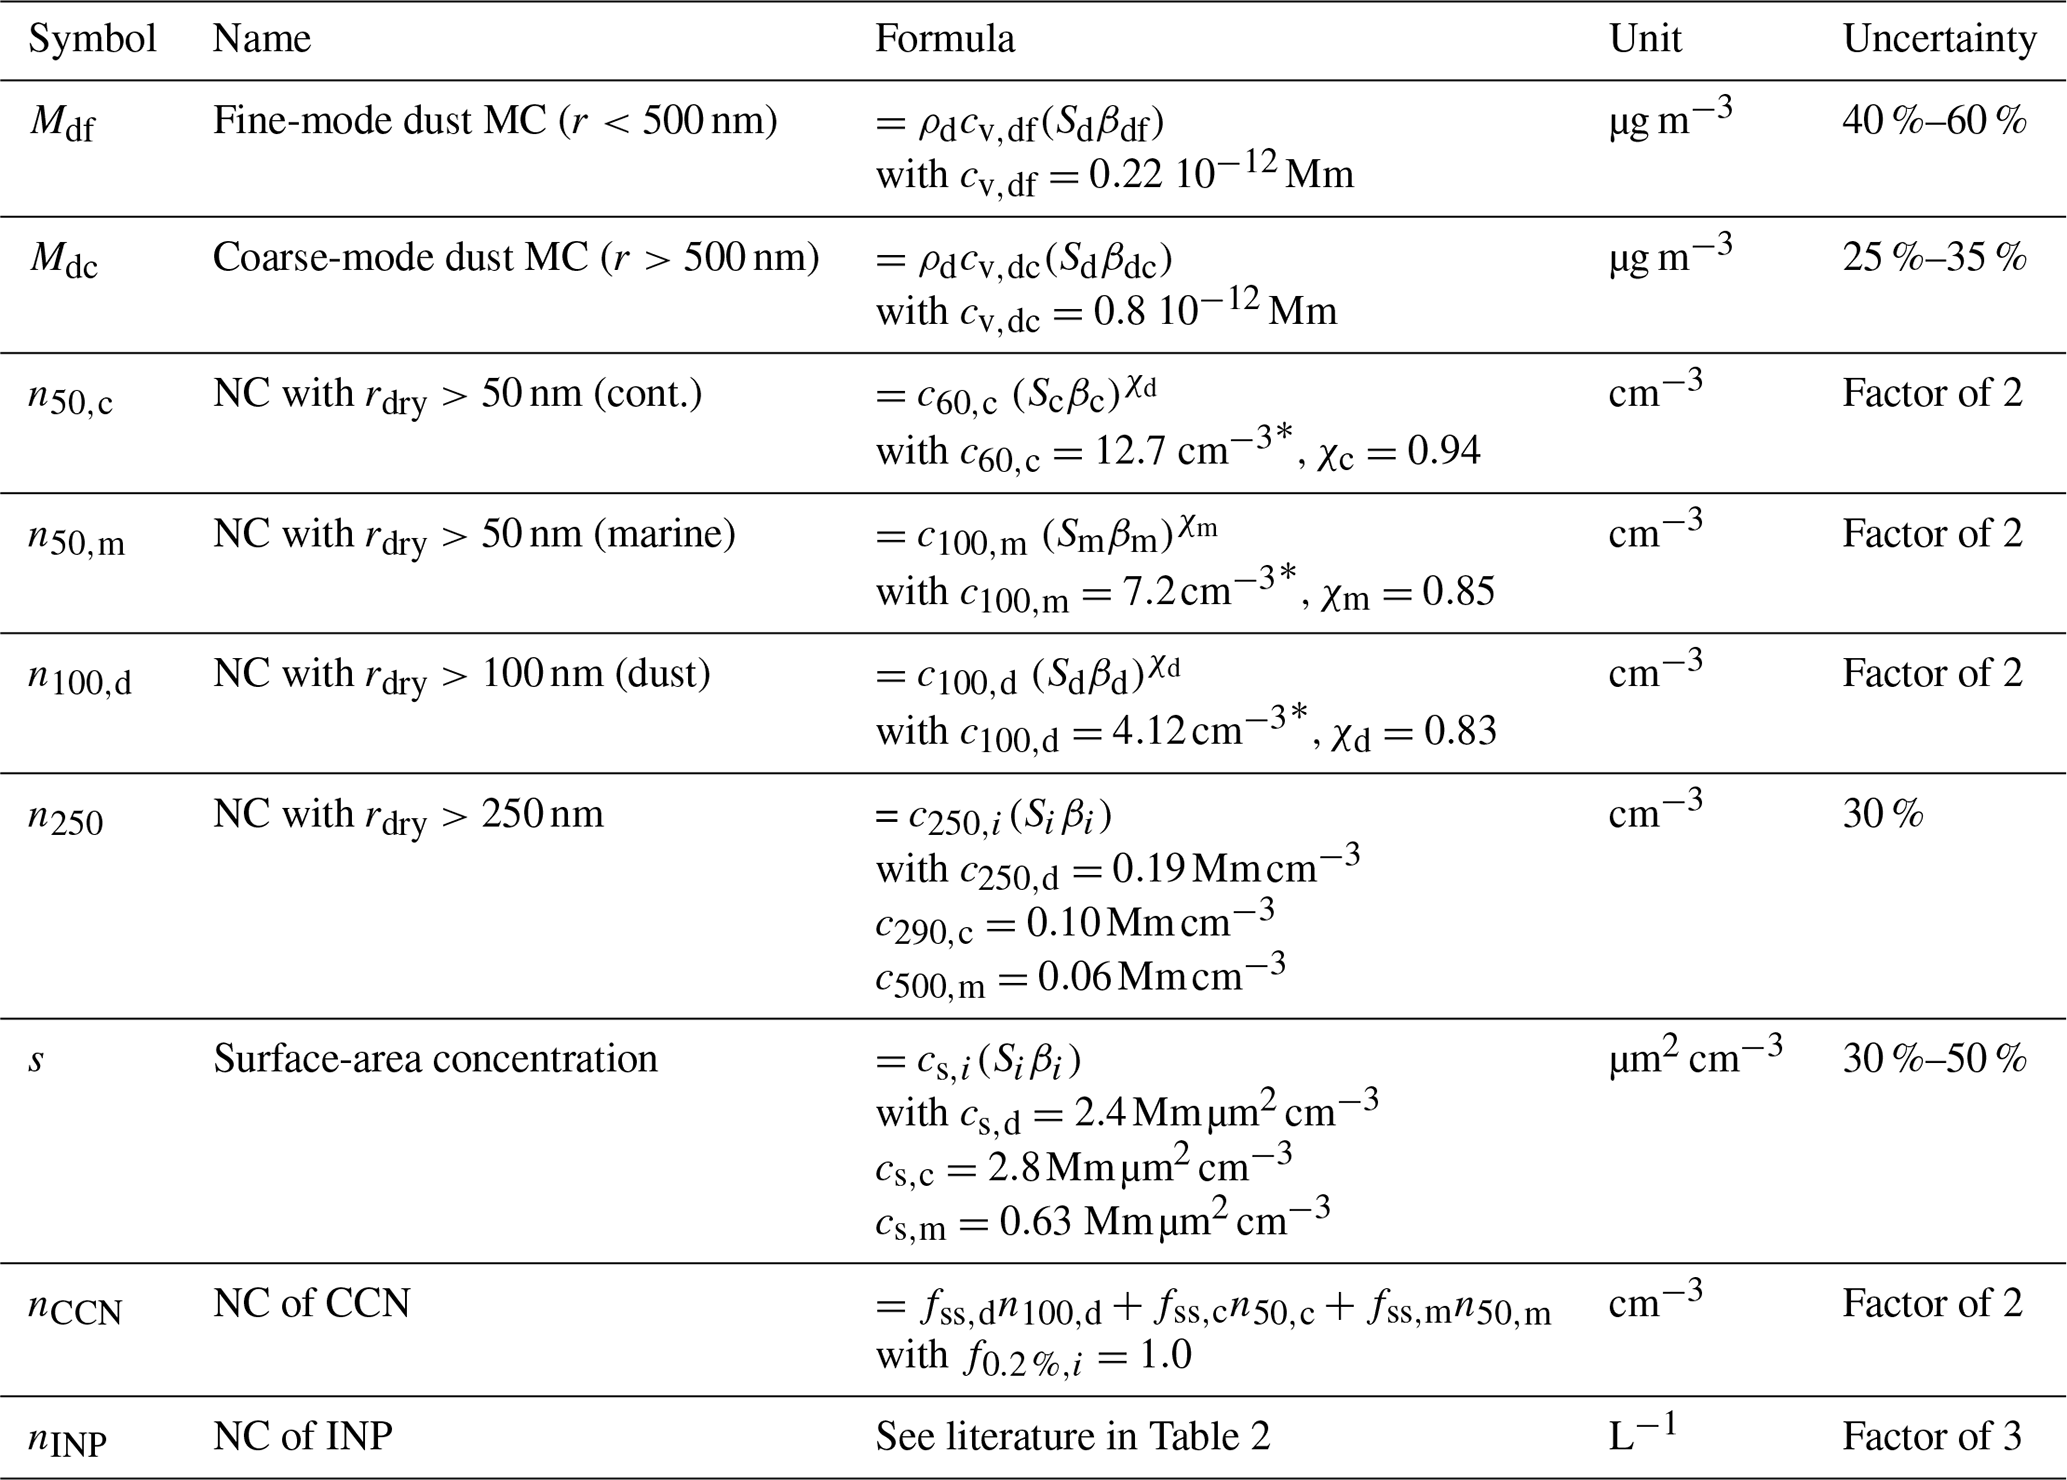
Table 1List of abbreviations, formulas, and uncertainties for the lidar-derived input parameters to estimate CCN and INP number concentrations (Mamouri and Ansmann, 2016) and for the separation of fine- and coarse-mode mass concentration (Mamouri and Ansmann, 2017). For Saharan dust the updated conversion factors of Ansmann et al. (2019) are used. All conversion factors are given for a lidar wavelength of 532 nm. In the following, the indices d, c, and m represent the aerosol types dust (df – fine-mode dust – r<500 nm; dc – coarse-mode dust – r>500 nm) and continental and marine particles, respectively. The extinction coefficient is calculated as the product of the lidar ratio Si (Sd=55 sr; Sc=50 sr; Sm=20 sr) and the backscatter coefficient βi of the aerosol component i. NC and MC stand for particle number concentration and mass concentration, respectively. The density ρd of dust is 2.6 g cm−3.
* For an extinction coefficient of 1 Mm−1.
Table 2The INP parameterizations for immersion freezing, with their references and valid temperature intervals. In the case of immersion freezing, ice nucleation starts via an INP immersed into a liquid droplet.
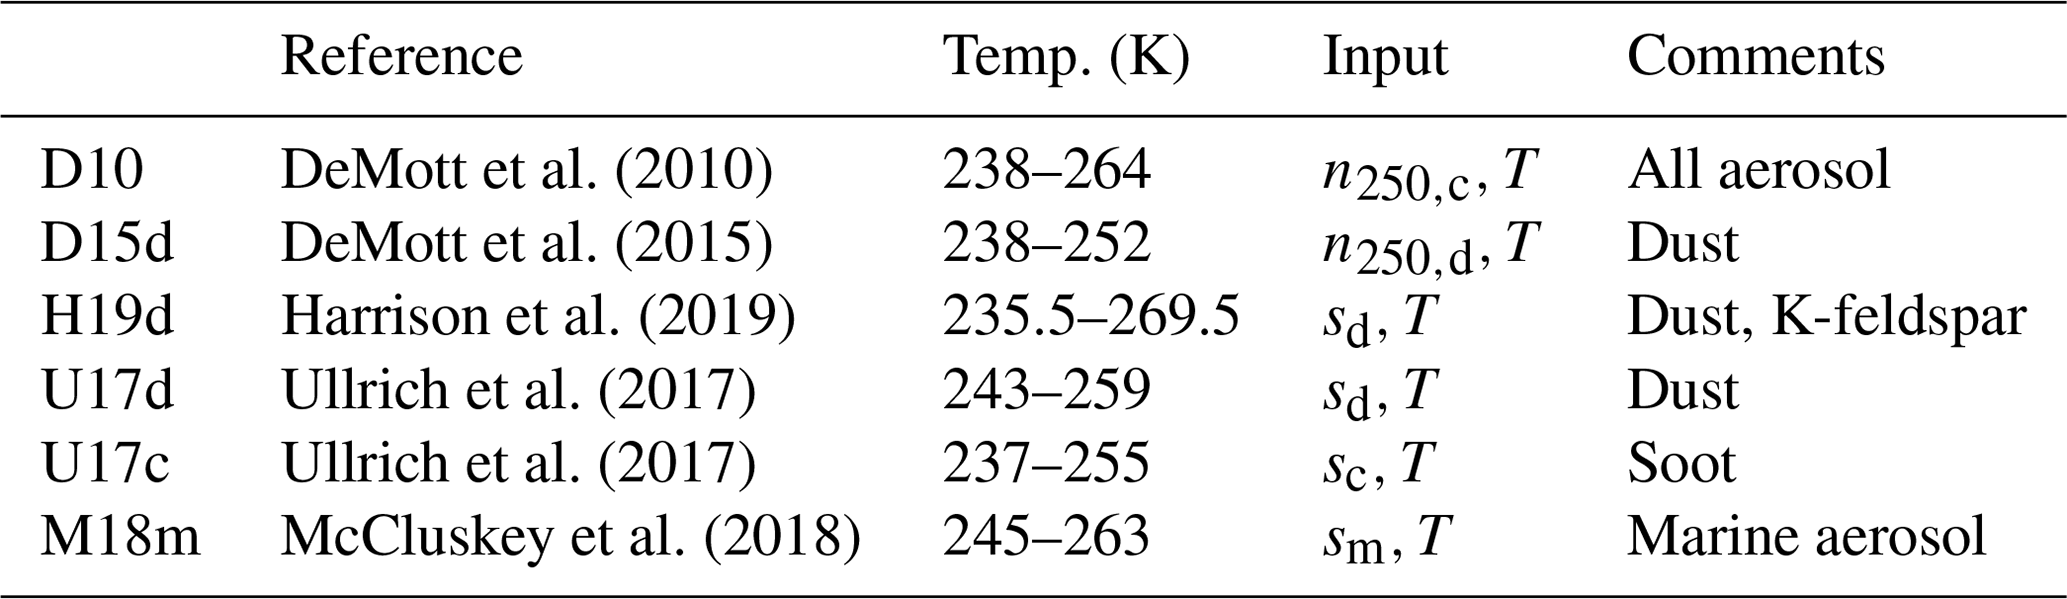
In the next step, INP and CCN concentrations are retrieved. INP parameterizations were developed for the aerosol types dust, soot, and marine particles (see Table 2). The number concentration n250 and the surface-area concentration s are the aerosol-relevant input parameters which are obtained by conversion of the lidar-derived particle extinction profiles. In the present study, we focus on immersion freezing, i.e., ice nucleation by an INP immersed into a liquid-water droplet. The parameterization by DeMott et al. (2010) is used for the dust and non-dust (continental or marine) particles with a radius of more than 250 nm, whereas the DeMott et al. (2015) parameterization is explicitly developed for dust particles. Harrison et al. (2019) developed a parameterization for the very ice-active mineral K-feldspar, which is part of the Saharan dust. Mineralogical measurements at Barbados show that only 1 % of the dust particles consist of K-feldspar (Kandler et al., 2018). Therefore, we assume that the K-feldspar parameterization by Harrison et al. (2019) is valid for 1 % of the total surface area of dust. The surface-area-based INP parameterization developed by Ullrich et al. (2017) leads to much higher values and is not shown in this study. McCluskey et al. (2018) developed a parameterization for marine aerosol with samples from the Atlantic Ocean. The INP parameterizations and input parameters are listed in Table 2.
To estimate the CCN number concentration nCCN, Mamouri and Ansmann (2016) use a dry activation diameter of 200 nm for dust and 100 nm for continental pollution and marine particles at 0.15 %–0.2 % water supersaturation. An enhancement factor fss determined in Mamouri and Ansmann (2016) from various laboratory and field studies (activation diameter and supersaturation) is used to retrieve nCCN for different supersaturation levels (Table 1). The supersaturation of 0.2 % with respect to water is motivated by the findings of Wex et al. (2016), who reported this as a typical value for trade wind cumuli in the Barbados region. CCN concentrations at the same supersaturation (0.2 %) were measured in situ with a CCN counter aboard the Falcon research aircraft.
Table 3Dry activation diameter dact for various chemical compositions calculated with kappa-Köhler theory (Petters and Kreidenweis, 2007). The κ values are estimated from literature (Ko09 – Koehler et al., 2009; He09 – Herich et al., 2009; Ku11a – Kumar et al., 2011a; Ku11b – Kumar et al., 2011b; Pe&Kr07 – Petters and Kreidenweis, 2007; Pe09 – Petters et al., 2009; Kr12 – Kristensen et al., 2012). The uncertainty in κ can be considerable especially for Saharan dust and organics.
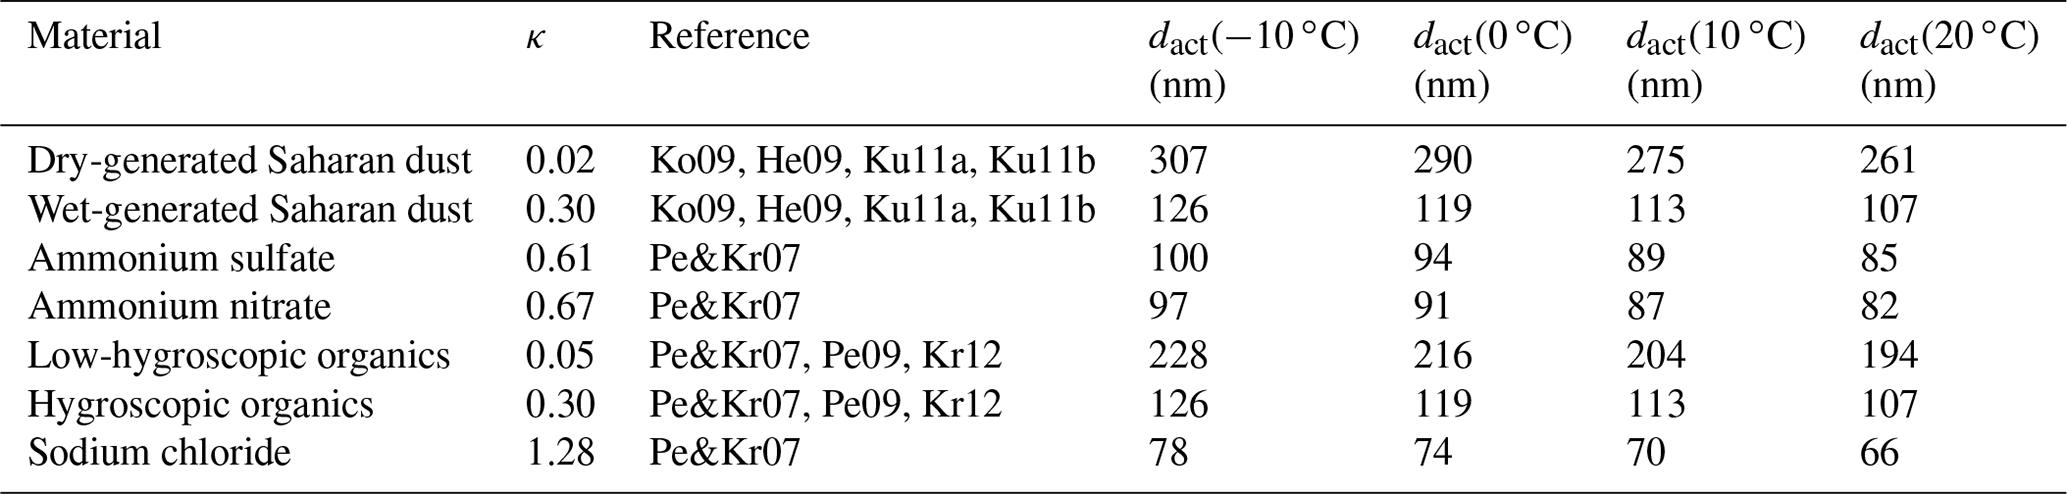
The use of the different activation diameters (100 nm for continental pollution aerosol and for marine particles; 200 nm for dust) is motivated by the following facts. Based on kappa-Köhler theory (Petters and Kreidenweis, 2007), we computed the activation diameter for 0.2 % water supersaturation and temperatures from −10 to 20 ∘C for various materials and chemical compositions (Table 3), in which 10 ∘C is the most realistic value within the SAL, as indicated by local radiosondes. Fresh Saharan dust mimicked by dry-generated dust is very hydrophobic (low-hygroscopicity parameter κ) so that the activation diameter is around 275 nm (at 10 ∘C). Cloud-processed Saharan dust particles (mimicked by wet-generated dust samples) may have changed their hygroscopic properties (higher κ value) so that their CCN efficacy increased. Laboratory studies with wet-generated dust particles (in contrast to dry-generated fresh dust particles) reported higher κ values (Koehler et al., 2009; Herich et al., 2009; Kumar et al., 2011b). However, although the Saharan dust was transported over several thousands of kilometers across the Atlantic Ocean, observations suggest that the dust in the SAL remained nearly unprocessed (Lieke et al., 2011; Denjean et al., 2015; Weinzierl et al., 2017; Kandler et al., 2018). Therefore, κ should not change significantly during transport and be closer to the value for fresh Saharan dust which is taken from laboratory studies (Koehler et al., 2009; Herich et al., 2009; Kumar et al., 2011a, b). Twohy et al. (2009) found good agreement for their CCN measurements with a κ of 0.05 in the eastern Atlantic. Herich et al. (2009) concluded that the activation diameter for Saharan dust (dry generated) is most probably 200 nm at a supersaturation of 0.2 %. This is confirmed by studies of Shinozuka et al. (2015) and Lv et al. (2018). Following this discussion, we assume an activation diameter of 200 nm for Saharan dust at Barbados, which corresponds to a κ value of approximately 0.05.
The activation diameter for continental aerosol particles (fine-mode pollution) depends on their chemical composition. Kandler et al. (2018) found sulfate particles to be a dominant contribution of continental pollution aerosol in the SAL, but the instrumentation was not suitable for detecting organics. Considering ammonium sulfate with a small contribution of less-hydrophilic organic particles to be continental aerosol within the SAL, a dry activation diameter of 100 nm at a supersaturation of 0.2 % is a suitable estimate and therefore used in this study.
We assume sea salt to be the dominant component of the marine aerosol and prescribe an activation diameter of 70 nm (Table 3; at 0.2 % supersaturation and 10 ∘C). In contrast, Mamouri and Ansmann (2016) estimated a dry activation diameter of 100 nm based on literature. Going from 100 to 70 nm as activation diameter would increase nCCN by a factor of approximately 1.5.
In conclusion, we used a dry activation diameter of 200 nm for Saharan dust and a diameter of 100 nm for continental and marine particles, assuming a supersaturation of 0.2 % in the SALTRACE studies.
The polarization lidar–photometer networking technique (POLIPHON) introduced by Mamouri and Ansmann (2014, 2017) delivers mass concentrations of fine- and coarse-mode dust, i.e, dust particles with diameter d<1 and d>1 µm, respectively (Table 1). The PLDR at 532 nm is used to separate the contributions of non-dust aerosol (PLDR = 0.05), fine-mode dust (PLDR = 0.16), and coarse-mode dust (PLDR = 0.35). The lidar-derived extinction coefficient of the fine- and coarse-mode dust component is converted into volume concentration using long-term AERONET datasets and finally to mass concentration using the mass density of dust (2.6 g cm−3; Mamouri and Ansmann, 2014, 2017).
2.2 Airborne in situ aerosol measurements
A full list and details of the instrumentation installed aboard the research aircraft Falcon of the DLR are given in Weinzierl et al. (2017). Information on size-resolved particle number concentrations is obtained from condensation particle counters and optical particle spectrometers. The condensation particle counters were operated at slightly different cutoff diameters around 10 nm. The spectrometer setup included an airborne version of the Ultra-High Sensitivity Aerosol Spectrometer (Cai et al., 2008; Brock et al., 2011; Kupc et al., 2018), a Grimm model 1.129 SkyOPC, and a Cloud and Aerosol Spectrometer (Baumgardner et al., 2001). The combination of these spectrometers covers the complete range of particle diameters, from about 70 nm to 50 µm. Particle number size distributions (NSDs) are derived from the entirety of these data using a consistent Bayesian inversion method (Walser et al., 2017). Here, the NSDs are approximated by trimodal log-normal distributions. In situ cloud condensation nuclei concentrations are measured with a Cloud Condensation Nuclei Counter (Roberts and Nenes, 2005; Lance et al., 2006) operated at a water vapor supersaturation of 0.2 %. These concentrations are corrected for losses of large CCN at the aircraft's isokinetic aerosol inlet.
Three cases of the SALTRACE summer 2013 campaign were selected for in-depth comparisons of lidar and aircraft observations: 22 June, 10 July, and 11 July 2013. The criteria for the selection were based on the low spatial distance between the lidar site and the Falcon aircraft (flight patterns in the Barbados region; see Fig. 1). The time–height displays of the volume depolarization ratio at 532 nm shown in Fig. 2 indicate very homogeneous dust structures in the SAL on these 3 selected days and thus good conditions for comparisons. Daytime lidar observations are used to have coincident measurements with the Falcon aircraft. Below 2 km height, trade wind cumuli attenuated the lidar signals. Only the cloud-free profiles were used to calculate the mean backscatter coefficient and depolarization ratio. Table 4 contains information about the measurement periods of the Falcon aircraft and the lidar, including the mean horizontal distance of the Falcon from the lidar site and flight height levels. Except for two flight legs, the mean distance was below 100 km. In the SAL, winds from eastward directions with a wind speed between 10 and 18 m s−1 prevailed. The lidar profiles were averaged over 100–140 min, which corresponds to a spatial average of 60–150 km considering the wind speed. Therefore, the Falcon aircraft and the ground-based lidar observed in principle the same dust layer at these selected days.
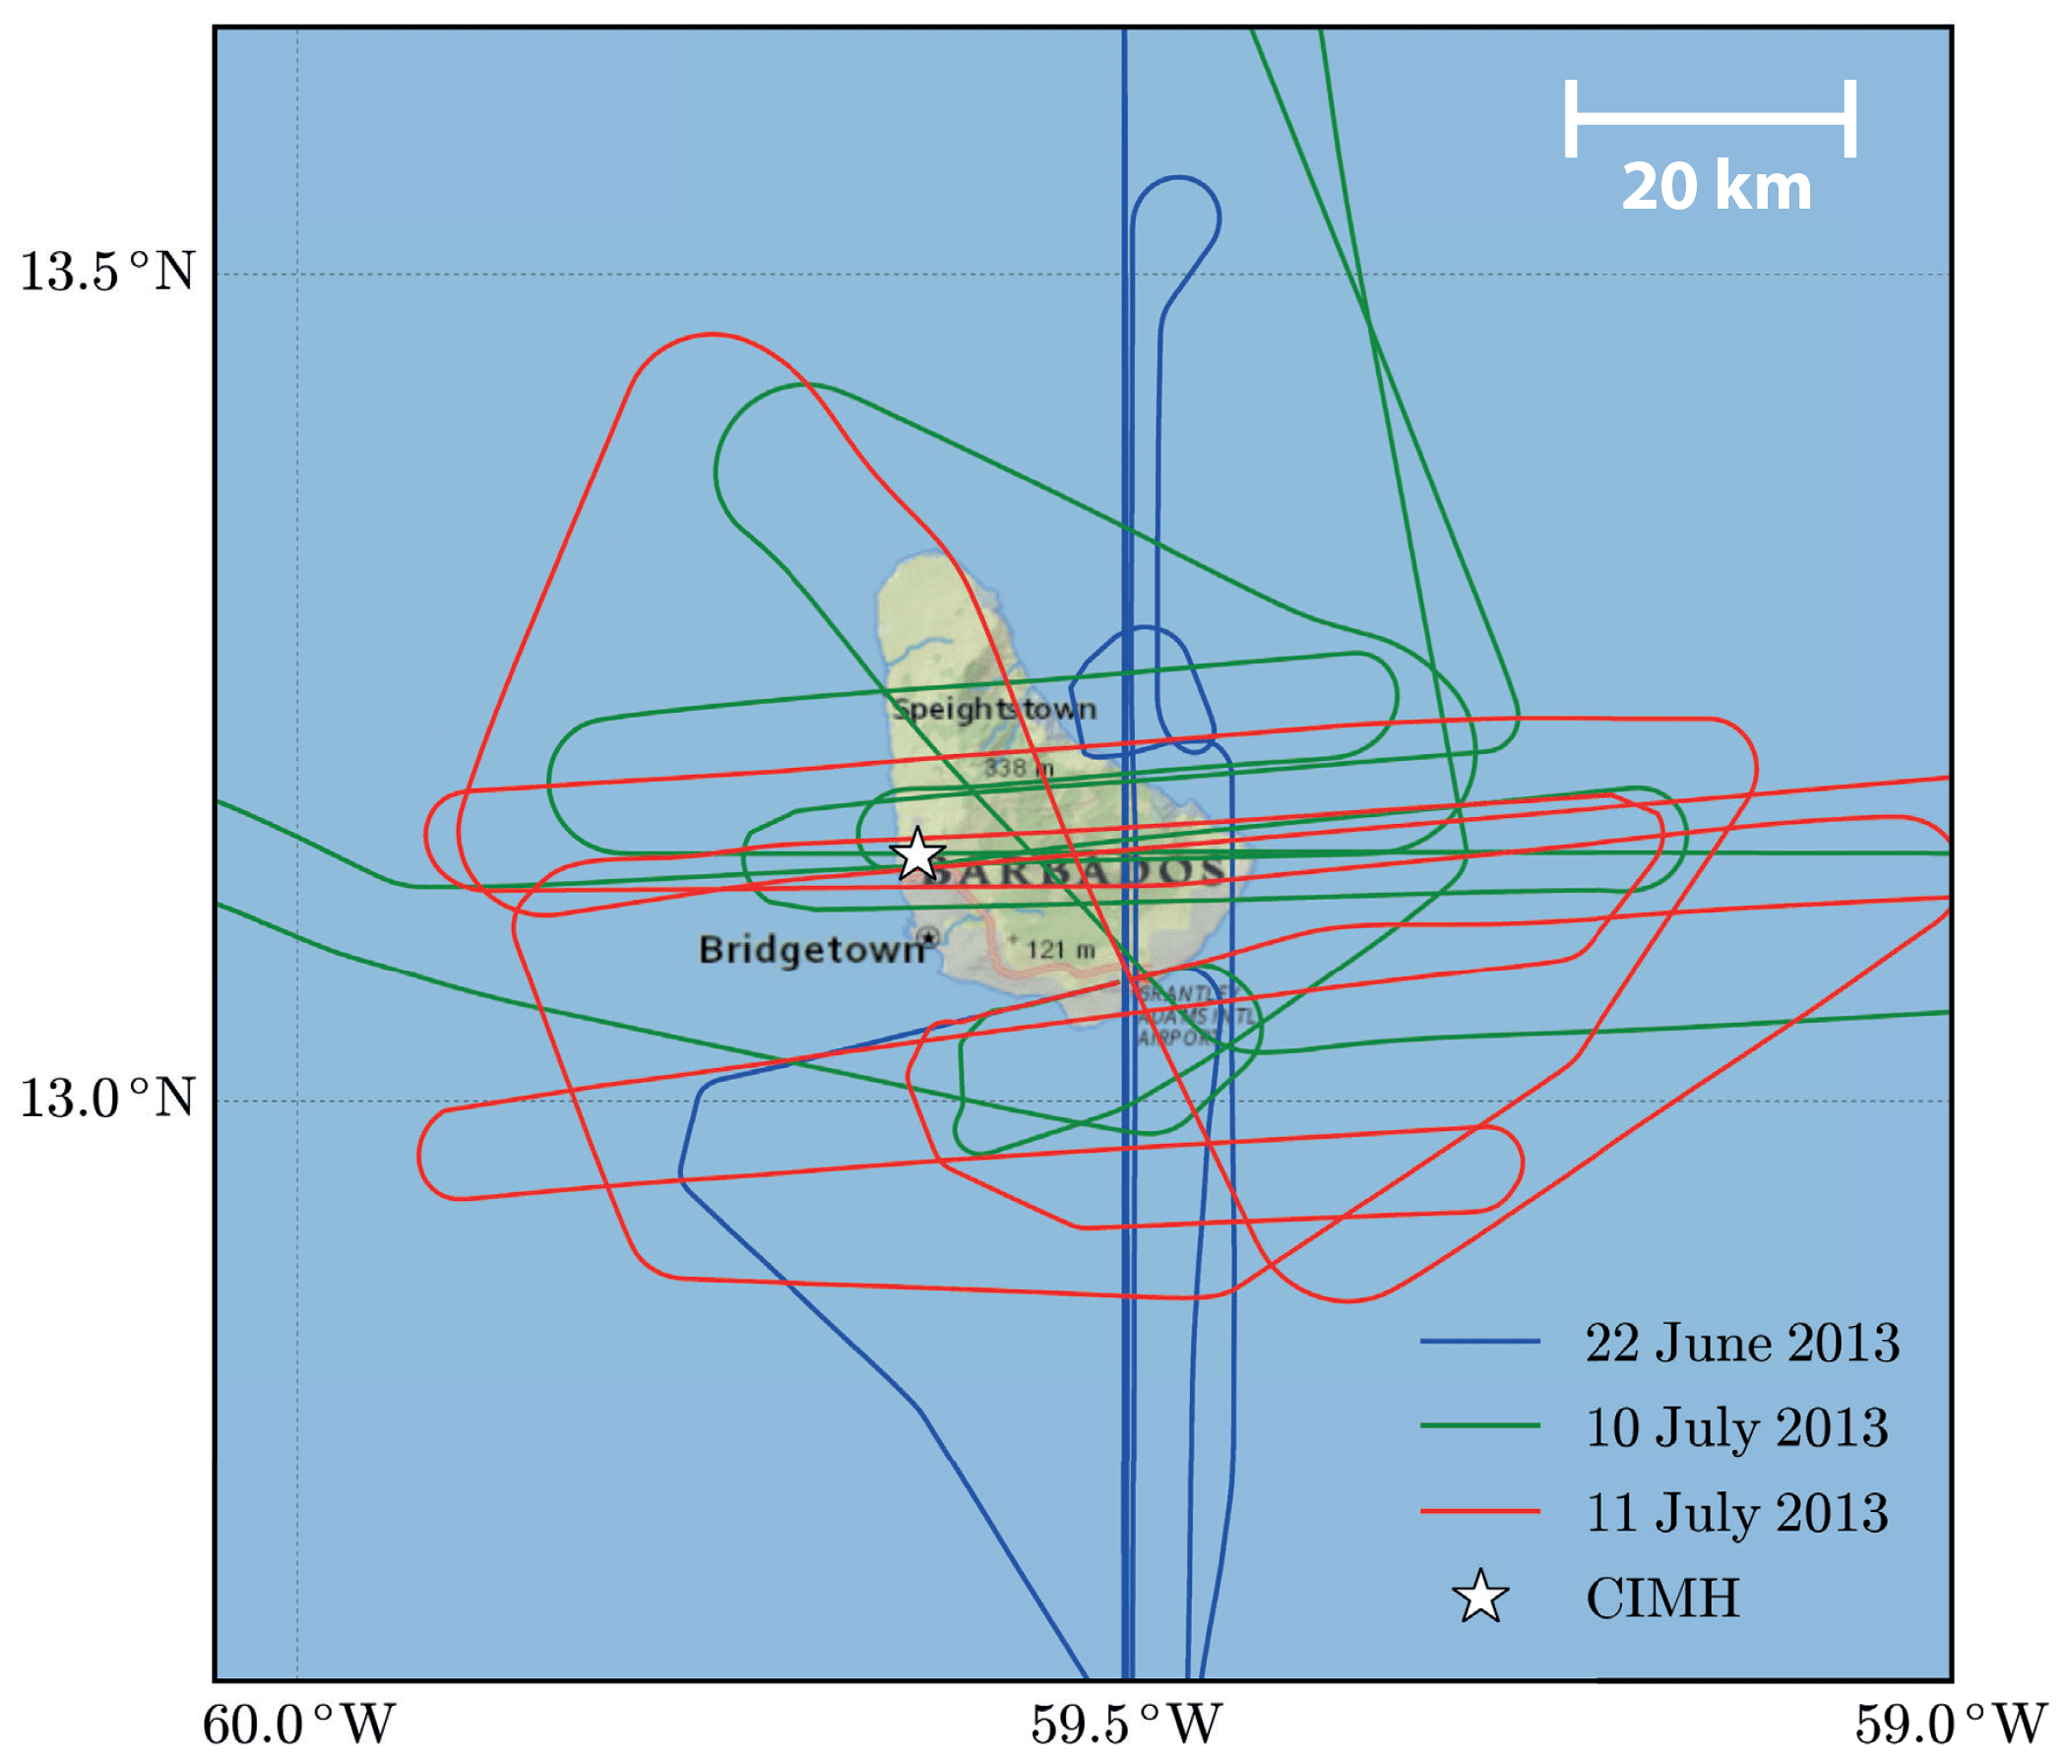
Figure 1Falcon flight tracks in the Barbados region on 22 June, 10 July, and 11 July 2013. The white star marks the lidar site at the Caribbean Institute for Meteorology and Hydrology (CIMH), located north of the capital Bridgetown. Comparisons of Falcon aircraft versus BERTHA lidar are based on the observations listed in Table 4.
Table 4Lidar and Falcon aircraft measurement periods. The mean distance (with standard deviation) of the Falcon from the lidar observation site is given. Local radiosonde launches provide the wind direction (WD) and wind speed (WS) at the altitude of Falcon aircraft.
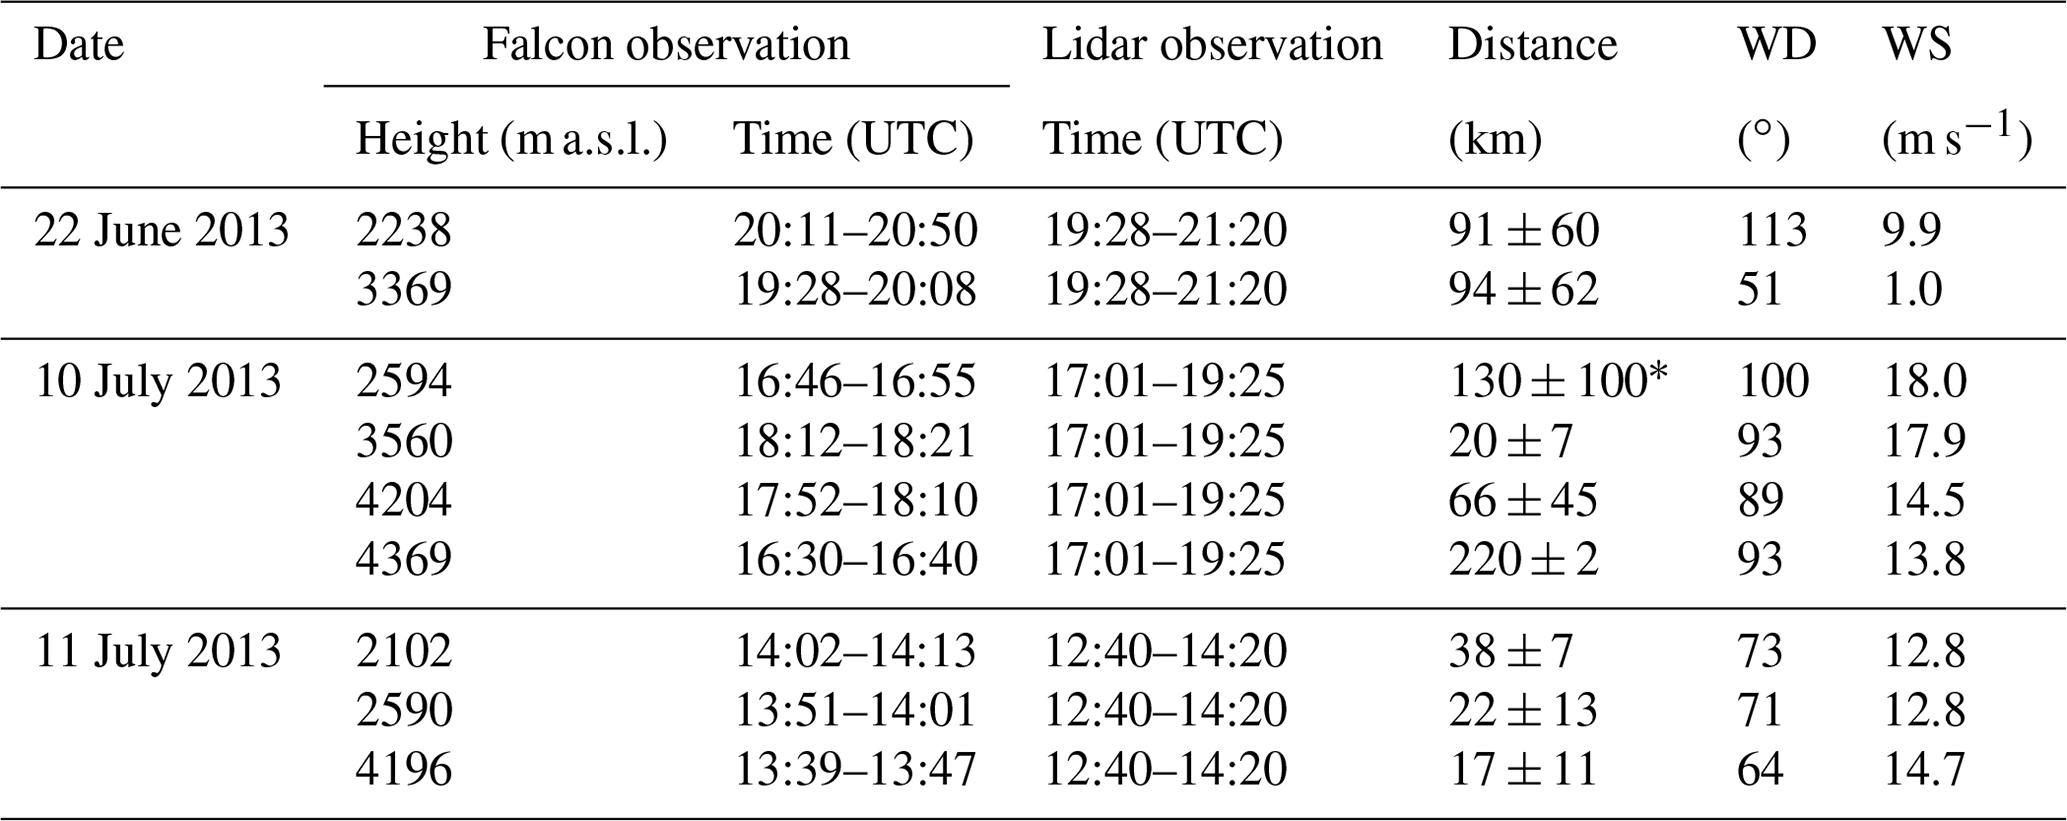
* Consists of two measurement periods: one around 220 km away (16:46–16:55 UTC) and one around 30 km away (18:23–18:32 UTC).
A weak dust outbreak was observed on 22 June 2013 (Fig. 2a–b), belonging to the first out of four main dust periods during SALTRACE-1 (Groß et al., 2015). The trajectories (not shown) indicate a possible dust uptake over Mali and Mauritania 8–9 d prior to the arrival at Barbados. In contrast to the later two cases, these air masses spent more time in the populated coastal region of western Africa (Senegal), and so the probability of anthropogenic influence was high.

Figure 2SALTRACE lidar observations of the Saharan Air Layer (SAL) above the marine boundary layer on 22 June (a–b), 10 July (c–d), and 11 July (e–f) 2013. Time–height displays of the volume depolarization ratio at 532 nm (a, c, e) and the corresponding cloud-screened mean profiles (b, d, f) of the particle backscatter coefficient (green line; lower x axis) and particle linear depolarization ratio (black line; upper x axis) at 532 nm are shown. Low-level trade wind cumuli (dark blue in a, c, and e) strongly attenuated the laser light, indicated by the noise above the clouds. The strong increase in the depolarization ratio indicates the lower boundary of the SAL at approximately 1.8–2.0 km height. The top of the SAL was about 3.7 km (22 June), 5.0 km (10 July), and 4.5 km (11 July). Local time is UTC −4 h.
After the passage of the tropical storm Chantal (Weinzierl et al., 2017), a strong and stable flow of Saharan dust towards the Caribbean was established and lasted for more than 4 d (10–13 July 2013). We use the 10 and 11 July observations for the comparison study. The SAL extended vertically from 1.8 km to almost 5 km height, as shown in Fig. 2c–f. As already discussed in Haarig et al. (2017a) based on backward trajectory analysis and the particle depolarization ratio measurements, pure dust conditions (with rather low probability of contamination with anthropogenic pollution) were given. The dust traveled 5–7 d over the Atlantic Ocean.
The CCN and INP parameterizations are aerosol-type-dependent. Therefore, a separation into dust and non-dust (continental or marine aerosol) is necessary, as done in Mamouri and Ansmann (2016) and Marinou et al. (2019). Pure Saharan dust has a PLDR at 532 nm of 0.31±0.03 (Freudenthaler et al., 2009), whereas continental pollution and smoke and marine aerosol have PLDR ≤ 0.05 (Groß et al., 2013; Baars et al., 2016). The particle depolarization ratio is the best indicator for the presence of dust. Its vertical profile (Fig. 2) indicates that not only dust but also a mixture of dust and non-dust were transported in the SAL. On 10 and 11 July 2013, however, only a rather small non-dust component was present (layer mean PLDR at 532 nm of 0.29 ± 0.02 and 0.31 ± 0.02, respectively). In contrast, on 22 June 2013 the non-dust component was significant (PLDR of 0.25 ± 0.03). The indicated uncertainty considers systematic errors and statistic uncertainties in the lidar data analysis. Because of the geographical location of Barbados, backward trajectories were not sufficient in deciding whether the non-dust component was of a marine or continental origin. Instead the method described in Ansmann et al. (2017) was applied, which uses the fact that continental aerosol particles have a significantly higher lidar ratio (50 sr) due to considerable light absorption and much smaller particle sizes than the ones of marine aerosol particles (20 sr). The independently measured total particle extinction coefficient from our Raman lidar measurements (Ansmann et al., 1992) is compared to the sum of the extinction coefficients obtained by multiplying the type-separated backscatter coefficients with the respective type-dependent lidar ratios. An example will be shown in Sect. 5. A good agreement was found for continental pollution aerosol in the SAL (>2 km height) and marine aerosol in the marine aerosol layer below (<2 km height). Often Raman lidar observations could not be performed in bright daylight conditions. In these cases, we had to use Raman lidar measurements after sunset to check the non-dust aerosol type in the SAL.
We begin with comparisons of CCN concentrations (nCCN) in Sect. 4.1. Particle number concentrations n250 of large particles and surface-area concentrations s are then compared in Sect. 4.2. In Sect. 4.3, we show simultaneous observed profiles of fine-mode and coarse-mode mass concentrations.
4.1 CCN profiles
In Fig. 3, the lidar-derived number concentration of CCN for dust nCCN,d (red line) and continental pollution particles nCCN,c (olive line) are presented. The total CCN number concentration nCCN (black line; lidar) can be compared with measurements of the Cloud Condensation Nuclei Counter aboard the Falcon aircraft (black squares) at the same supersaturation. In Table 5, the vertically averaged values are compared. The lidar-derived nCCN values are up to twice as large as the in situ measured values. However, the lidar retrieval uncertainty is quite large (factor 2). The retrieval uncertainty results from the uncertainty in determining the extinction-to-number-concentration conversion factor for small particles (r≥50 or r≥100 nm) using AERONET-derived AOD and columnar number concentrations (n50, n100) as described in Mamouri and Ansmann (2016). Besides the large retrieval uncertainty, other uncertainty sources may have contributed to the systematic bias between the lidar and airborne in situ observations: (i) The lidar conversion factors are derived for AERONET stations close to the Sahara. These conversion factors may not be applicable to aged dust after long-range transport and may overestimate the occurring accumulation-mode dust particle number concentration and thus n100,d. (ii) The used dust activation diameter (ddry=200 nm) may have been too low, and the true one was much larger than 200 nm (see Table 3; ddry=275 nm for dry-generated (fresh) dust), and thus fewer dust particles were activated in the Cloud Condensation Nuclei Counter aboard the Falcon than estimated by lidar. (iii) Horizontal and temporal inhomogeneities in the dust concentration along the flight tracks and over the lidar site may have also contributed to the differences found. (iv) Although the Falcon data are corrected for the particles losses at the inlets (Spanu et al., 2019), there are several uncertainty sources in the in situ CCN measurement that may have contributed to the bias found.
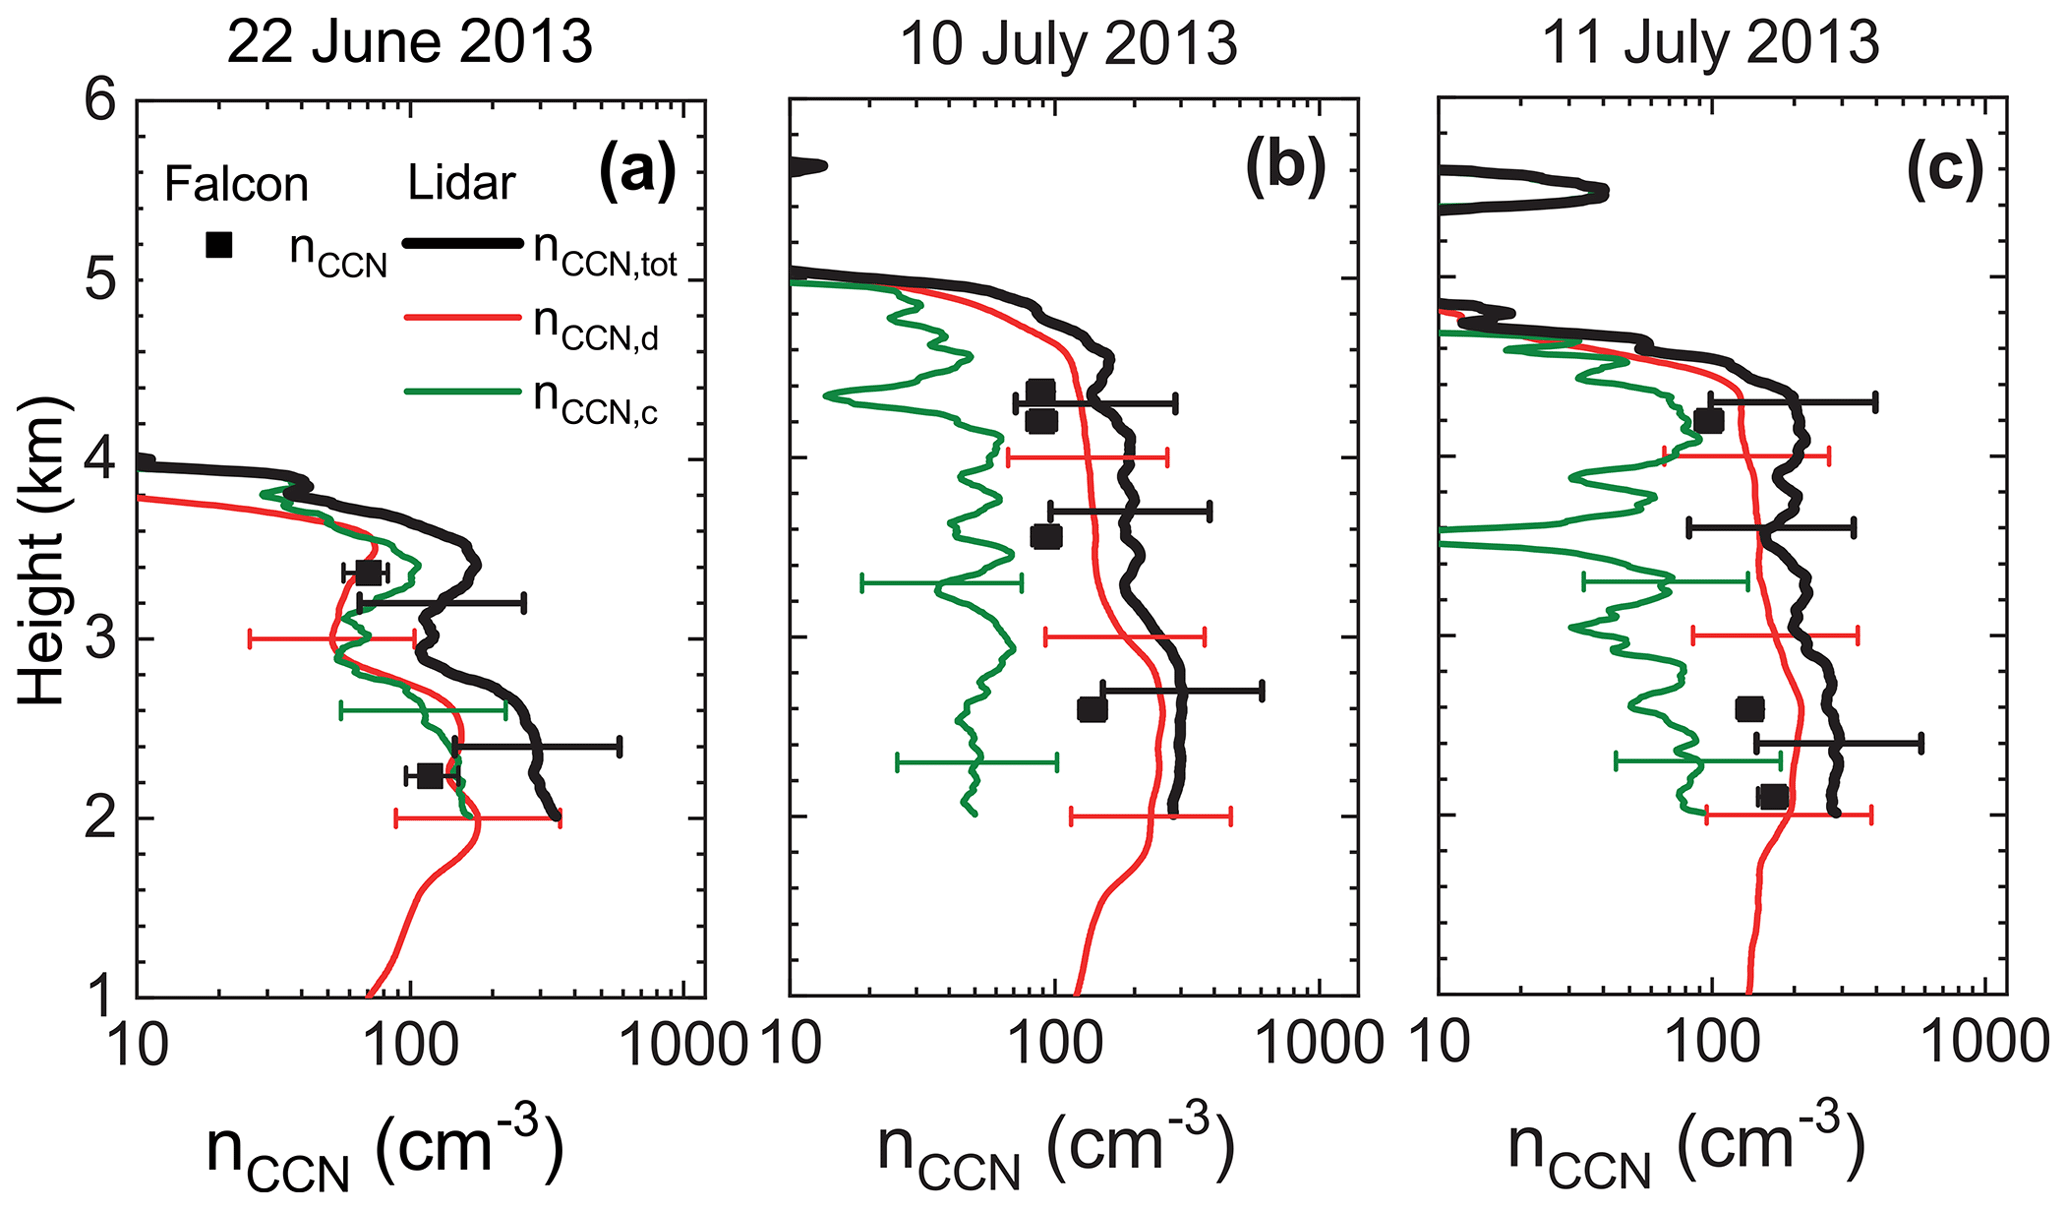
Figure 3Lidar-derived CCN number concentrations at 0.2 % supersaturation (black line) with contributions from dust (red line; critical dry diameter of 200 nm) and continental pollution aerosol (olive line; critical dry diameter of 100 nm) compared to coincident airborne in situ measurements (black squares) during SALTRACE-1. The error bars of the lidar profiles indicate an uncertainty of a factor of 2. The error bars of the in situ measurements indicate the 16th and 84th percentile.
Table 5Layer mean CCN and INP concentrations (nCCN; nINP) in the upper (>3 km) and lower (2–3 km) part of the SAL from lidar and Falcon (nCCN only). The standard deviation of the layer mean is given. The uncertainty range for the lidar retrieval is a factor of 2 for nCCN and 3 for nINP (not indicated). The immersion-freezing INP parameterization of D15d for dust at a constant temperature is used to give an estimate. CCN concentrations are given for 0.2 % water supersaturation (ss). nCCN and nINP values for the observed dust–smoke mixture and the pure marine conditions (INP from M18m) measured at Barbados on 3 March 2014 and 26 February 2014, respectively, are added.
* INP concentration calculated with McCluskey et al. (2018) for marine particles.
Overall, the CCN number concentration for the three presented dust cases agrees within a factor of 2 between the in situ measurement and the lidar retrieval. As the behavior is the same for all three comparison studies, it is expected to be representative of Saharan dust episodes in the Caribbean.
4.2 INP-relevant aerosol profiles
In Fig. 4a–c, the profiles of the sum of n250,d and n250,c are compared with the integral values of the particle number size distribution for rdry>250 nm measured aboard the Falcon aircraft. The in situ values are transformed to the pressure and temperature at the measurement altitude to be comparable with the lidar observations. As can be seen, the in situ and lidar values agree well, except on 22 June and 11 July in the lower part of the SAL, where horizontal inhomogeneities in the dust load (see Fig. 2) may have partly caused the differences between the two measurements. The contribution of continental smoke and pollution aerosol to n250 was less than 3 % in the SAL during the strong dust outbreak on 10–11 July 2013 and about 10 % on 22 June 2013. In total, there were fewer than 40 particles (rdry>250 nm) per cubic centimeter in all three cases over the remote Atlantic.
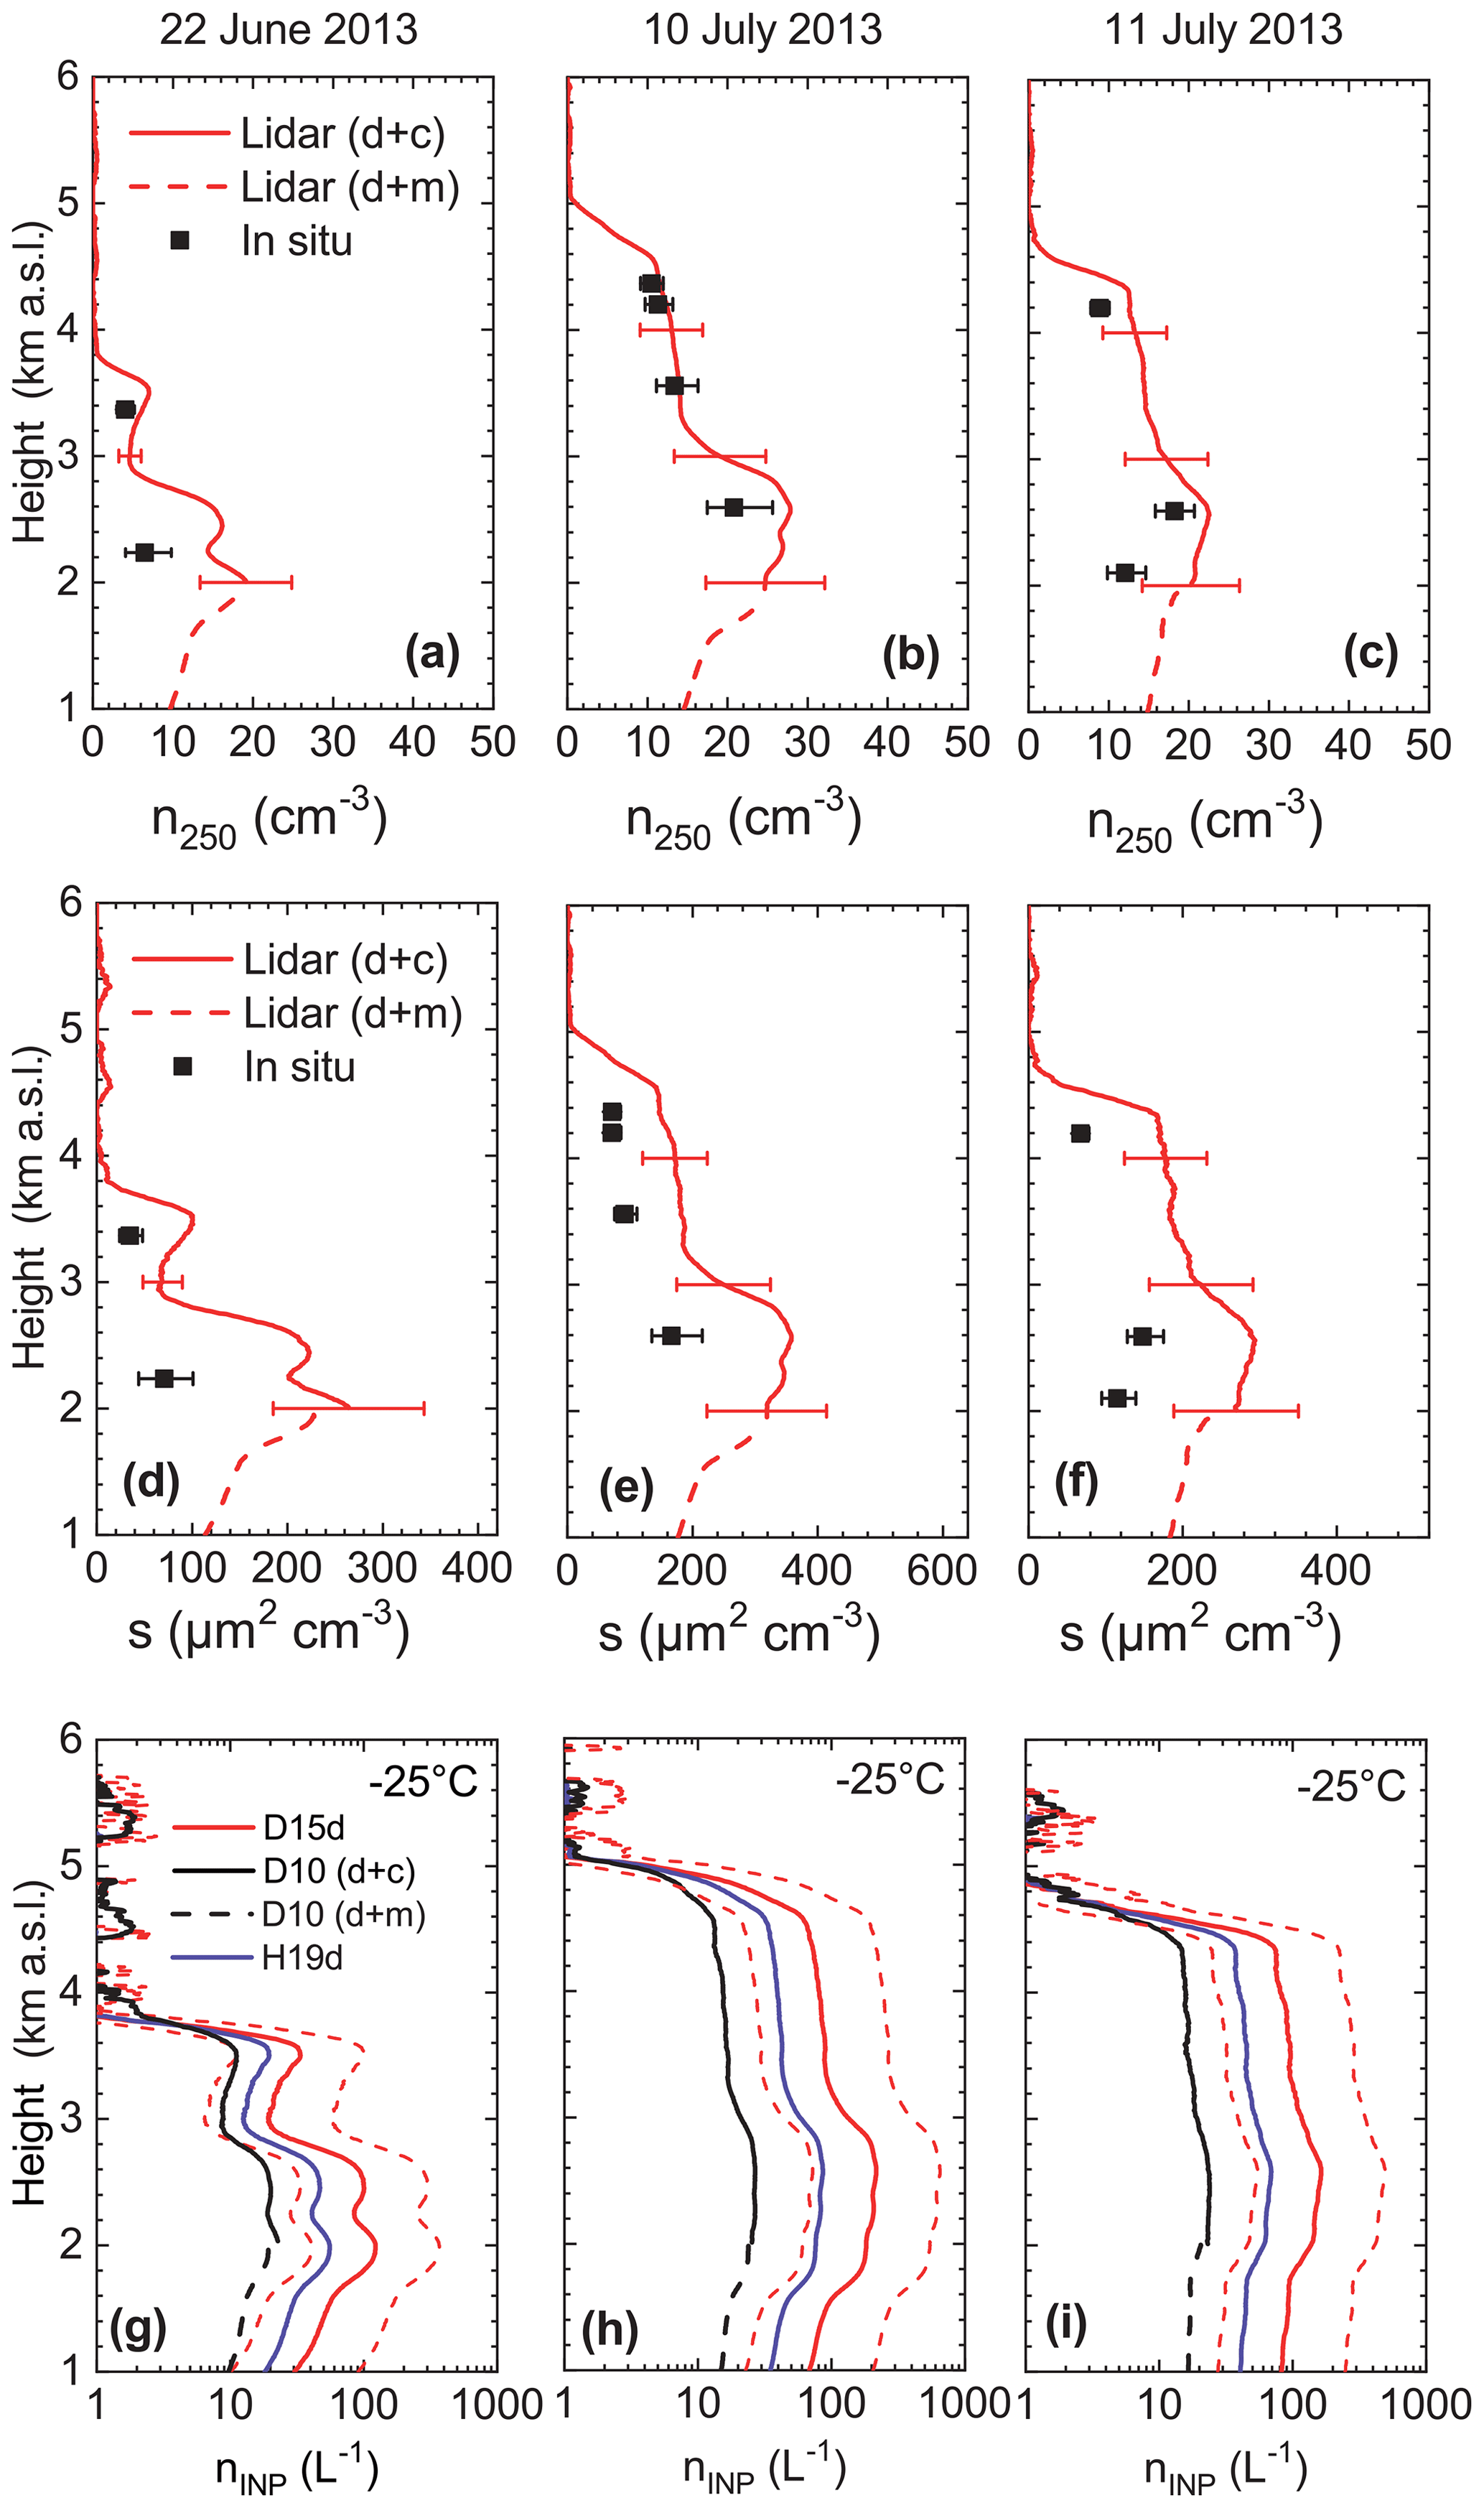
Figure 4Number concentration n250 for particles with a radius of more than 250 nm (a–c) and surface-area concentration s (d–f) measured aboard the Falcon aircraft (black squares) and derived from the lidar measurements (red profiles; solid line – sum of dust and continental pollution particles above 2 km; dashed line – sum of dust and marine particles below 2 km). The three SALTRACE case studies are shown: 22 June (a, d, g), 10 July (b, e, h), and 11 July 2013 (c, f, i). INP concentrations (g–i) are given at −25 ∘C for the immersion-freezing parameterizations of D10d + c (input ; above approx. 2 km), D10d + m (input ; below approx. 2 km), D15d (input n250,d), and H19d (input sd; see Table 2). The 1 % K-feldspar contribution was used for H19d. The uncertainty in the lidar-derived n250 and s values is 30 %. For the INP concentration an uncertainty of a factor of 3 is indicated by the dashed lines for the D15d profile. The error bars of the in situ measurements indicate the 16th and 84th percentile.
Figure 4d–f compares the profiles of the total surface-area concentration derived from lidar extinction coefficients and from the airborne in situ measured number size distribution. Here, the contribution of the continental pollution particles to s within the SAL is 4 %–6 % during the strong dust outbreak (10–11 July) and 20 % on 22 June 2013. The lidar values are considerably larger than the in situ values. The use of conversion factors that are too large (based on AERONET observations close to the Sahara) may be one of the reasons for the disagreement.
An example on INP profiling is given in Fig. 4g–i at a temperature of −25 ∘C. The DeMott et al. (2010) and DeMott et al. (2015) parameterizations (including the correction factor of 3) are used with and n250,d profiles as input, respectively. Furthermore, the Harrison et al. (2019) parameterization for K-feldspar was added with a 1 % contribution of K-feldspar to the dust surface-area concentration as indicated by Kandler et al. (2018). The uncertainty range (factor 3) is exemplarily indicated for the DeMott et al. (2015) parameterization by the dashed line. As can be seen, the SAL contains INP concentrations of 10–200 L−1 at −25 ∘C (Table 5).
4.3 Fine- and coarse-mode mass concentrations
As an additional feature to the CCN and INP profiles, the dust mass concentration can be derived from the lidar measurements separately for fine- and coarse-mode dust (Table 1). The comparison with airborne in situ observations is shown in Fig. 5. The mass concentrations are calculated from the lidar-derived and in situ measured volume concentration by assuming a dust mass density of 2.6 g cm−3. An excellent agreement is obtained for the coarse mode. This indicates that the Falcon measurements capture the large particles in the SAL well (Spanu et al., 2019). The coarse-mode mass concentration from POLIPHON is around 16 times higher than the fine-mode mass concentration, leading to a mass fine-mode fraction of 0.06. For the optical properties, such as the backscatter coefficient, the fine-mode fraction is 0.2. These mass (or volume) and backscatter fractions are in full agreement with simultaneous AERONET sun photometer observations of the fine-mode volume and AOD fractions at Ragged Point, Barbados. Again, for the fine-particle-dominated quantities, i.e., the fine-mode mass concentration, the lidar derives higher values than observed in situ. Uncertainties in the in situ aerosol measurements or in the lidar conversion factors might be the reason. However, a good agreement of the lidar products with AERONET observations is found and corroborates the quality of the lidar products.
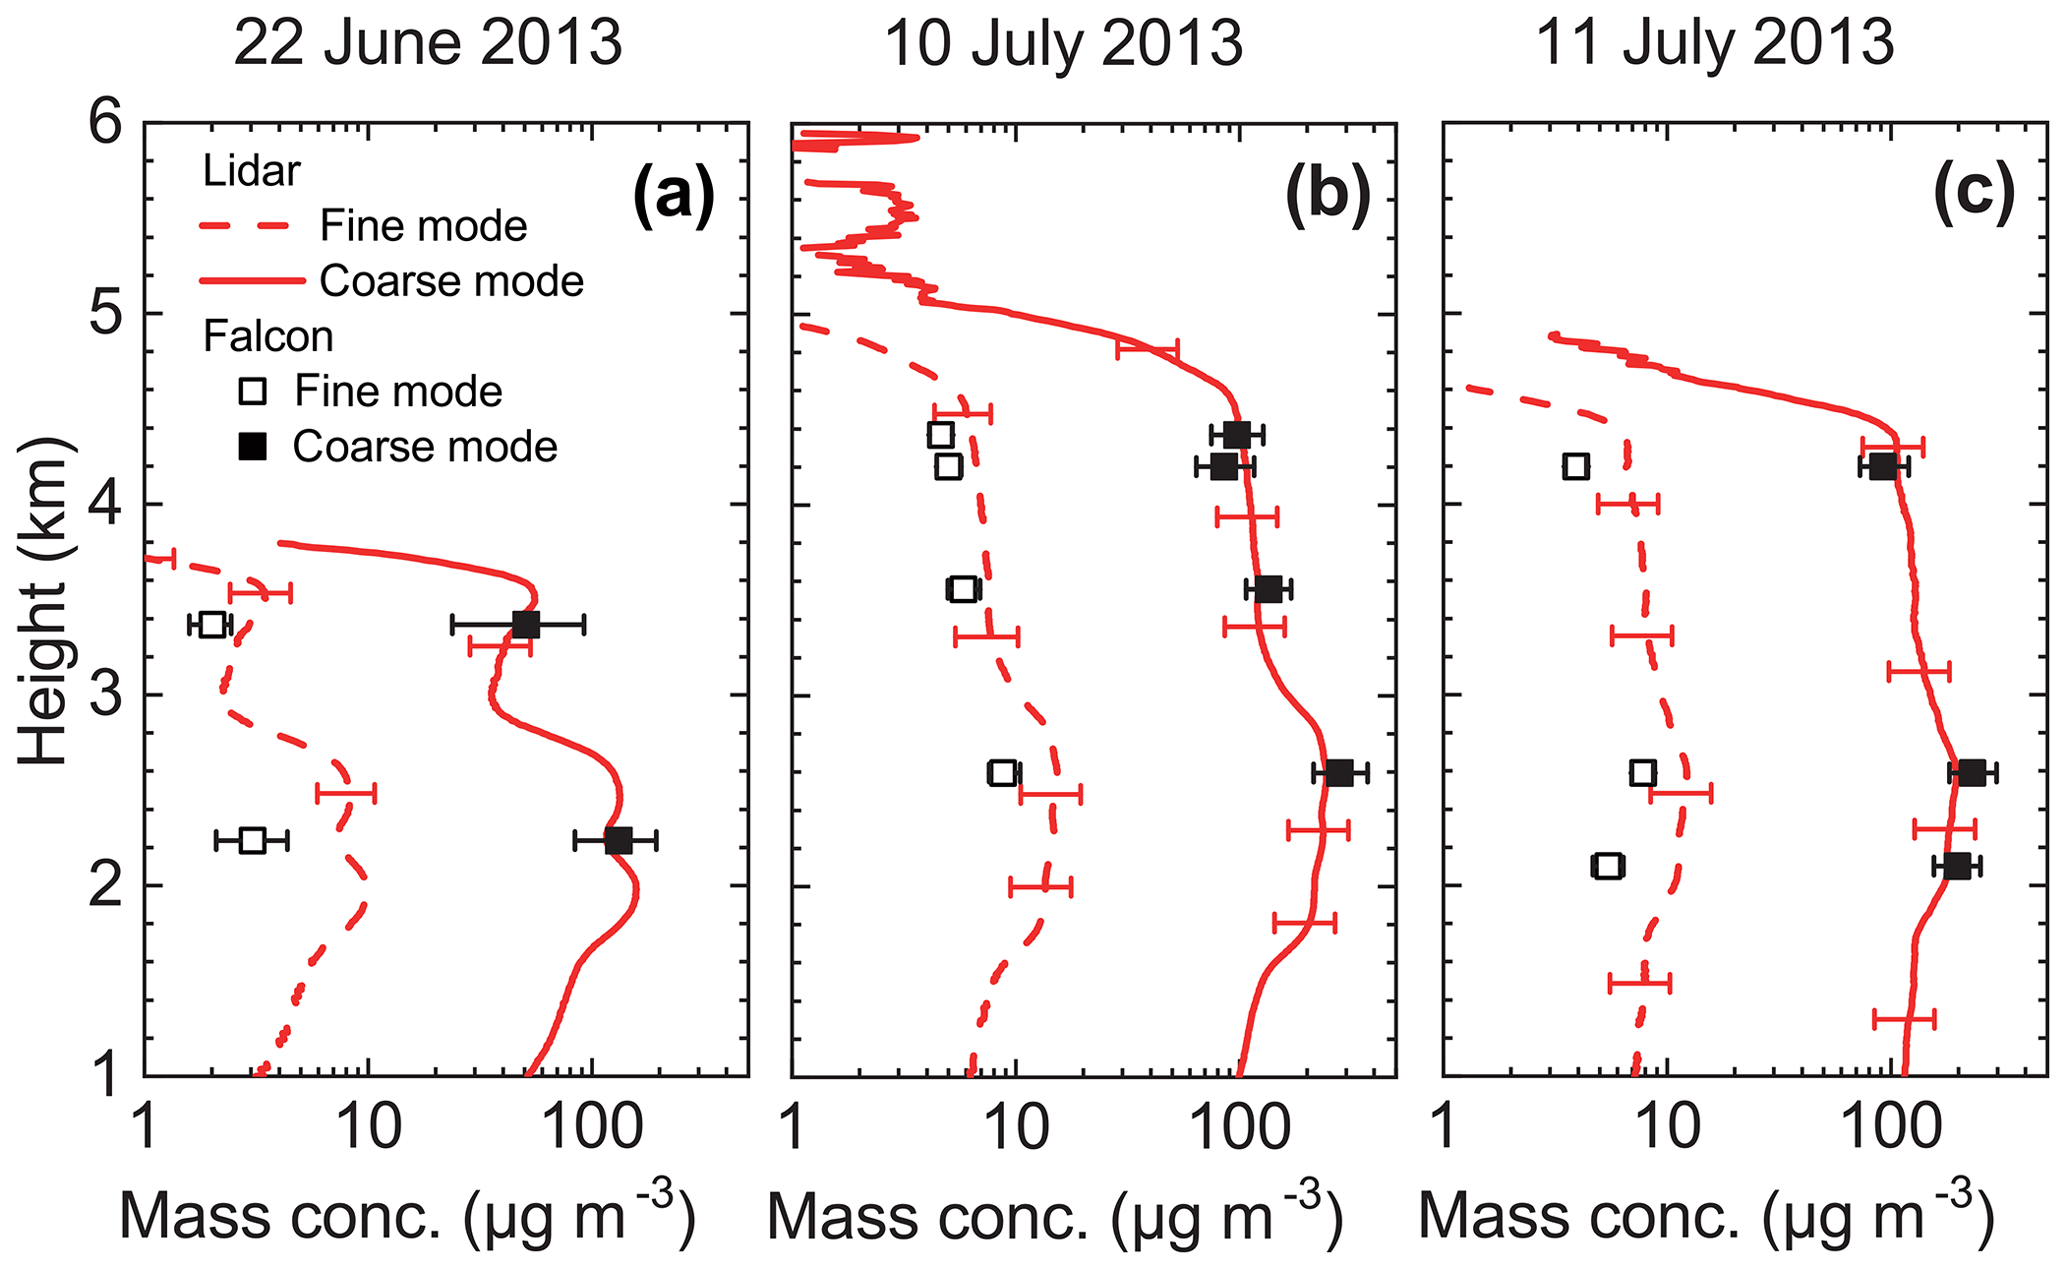
Figure 5Mass concentration of fine-mode (r<500 nm; dashed line) and coarse-mode (r>500 nm; solid line) dust derived from airborne in situ measurements (black squares) and lidar observations (red profiles) for the three SALTRACE-1 days. The error bars of the in situ measurements indicate the 16th and 84th percentile.
We use the opportunity of SALTRACE to contrast the presented dust-dominated cases during summer (SALTRACE-1) with a pristine marine measurement and a dust–smoke mixture during the SALTRACE-2 winter campaign (Haarig et al., 2017b). No aircraft measurements are available for SALTRACE-2.
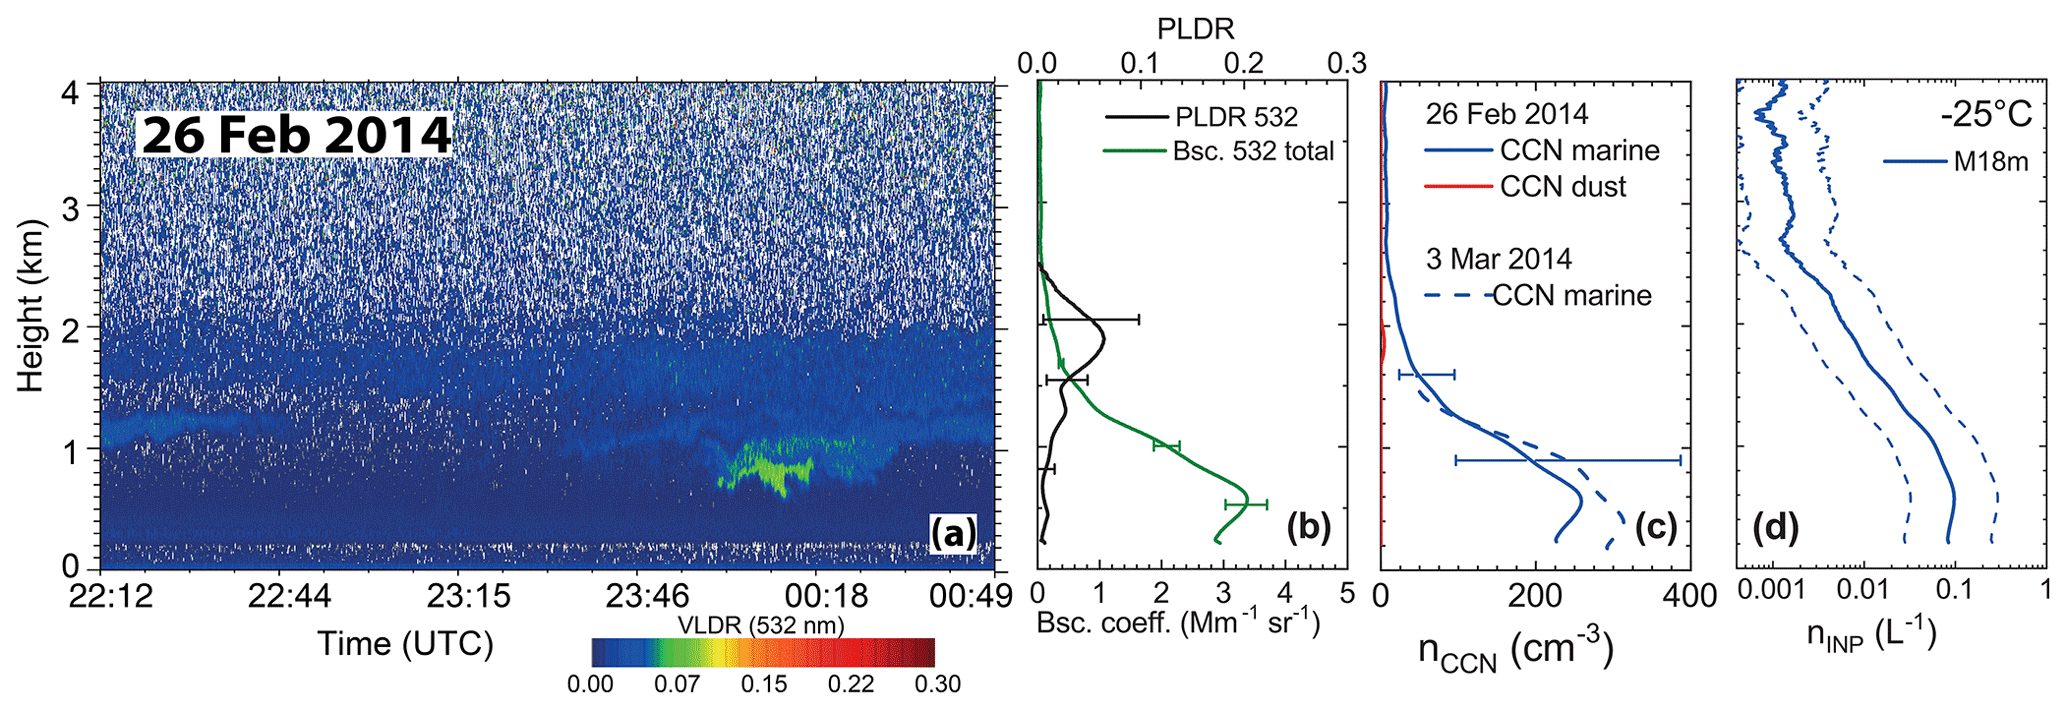
Figure 6Pristine marine observation during the SALTRACE winter campaign on 26 February 2014, 22:12–00:49 UTC. (a) Time–height display of the 532 nm volume depolarization ratio, (b) particle backscatter coefficient (green line) and particle linear depolarization ratio (black line) at 532 nm, (c) CCN number concentrations at water supersaturation of 0.2 %, and (d) immersion-freezing INP concentrations at −25 ∘C for M18 marine. The dashed line indicates the uncertainty range (factor 3) of the INP parameterization.
5.1 Pristine marine conditions
Caribbean background cases without aerosol transport from Africa were found during SALTRACE-2. At the end of February 2014, pristine marine conditions prevailed at Barbados, as already discussed in Haarig et al. (2017b); 26 February 2014 was chosen for the present study, as the influence of dry marine particles (Haarig et al., 2017b) was less pronounced than the days before (23 and 24 February 2014). The results are presented in Fig. 6. The marine aerosol reached 2 km height (Fig. 6a). The low values of PLDR (≤0.03) shown in Fig. 6b increased at the top of the marine aerosol layer to values of 0.06, indicating the presence of dry marine particles with a non-spherical shape, as discussed in Haarig et al. (2017b). These particles are misclassified as a very small dust contribution, as can be seen in Fig. 6c for the CCN number concentration. Otherwise the CCN reservoir consists of marine aerosol only (up to 250 per cm3). The dashed line in Fig. 6c indicates the lidar-retrieved nCCN from 3 March 2014 showing a similar behavior. The INP reservoir at −25 ∘C (Fig. 6d) derived with the parameterization of McCluskey et al. (2018) consists of 0.002–0.1 INPs per liter, which is around 3 orders of magnitude lower than in presence of Saharan dust. These findings from a remote-sensing perspective show the influence of Saharan dust on the cloud properties in the Caribbean and are corroborated by previous helicopter-based in situ measurements in the framework of the CARRIBA (Cloud, Aerosol, Radiation and tuRbulence in the trade wInd regime over BArbados; Siebert et al., 2013) project. The observations of February 2014 without aerosol long-range transport from Africa may be representative throughout the year for the marine contribution in the marine aerosol layer (below the temperature inversion at around 1.5–2.0 km). If dust is present in the SAL above, especially in summer, dust particles are mixed downwards in the marine aerosol layer and added to the marine (background) particles, significantly influencing the CCN and INP reservoir.
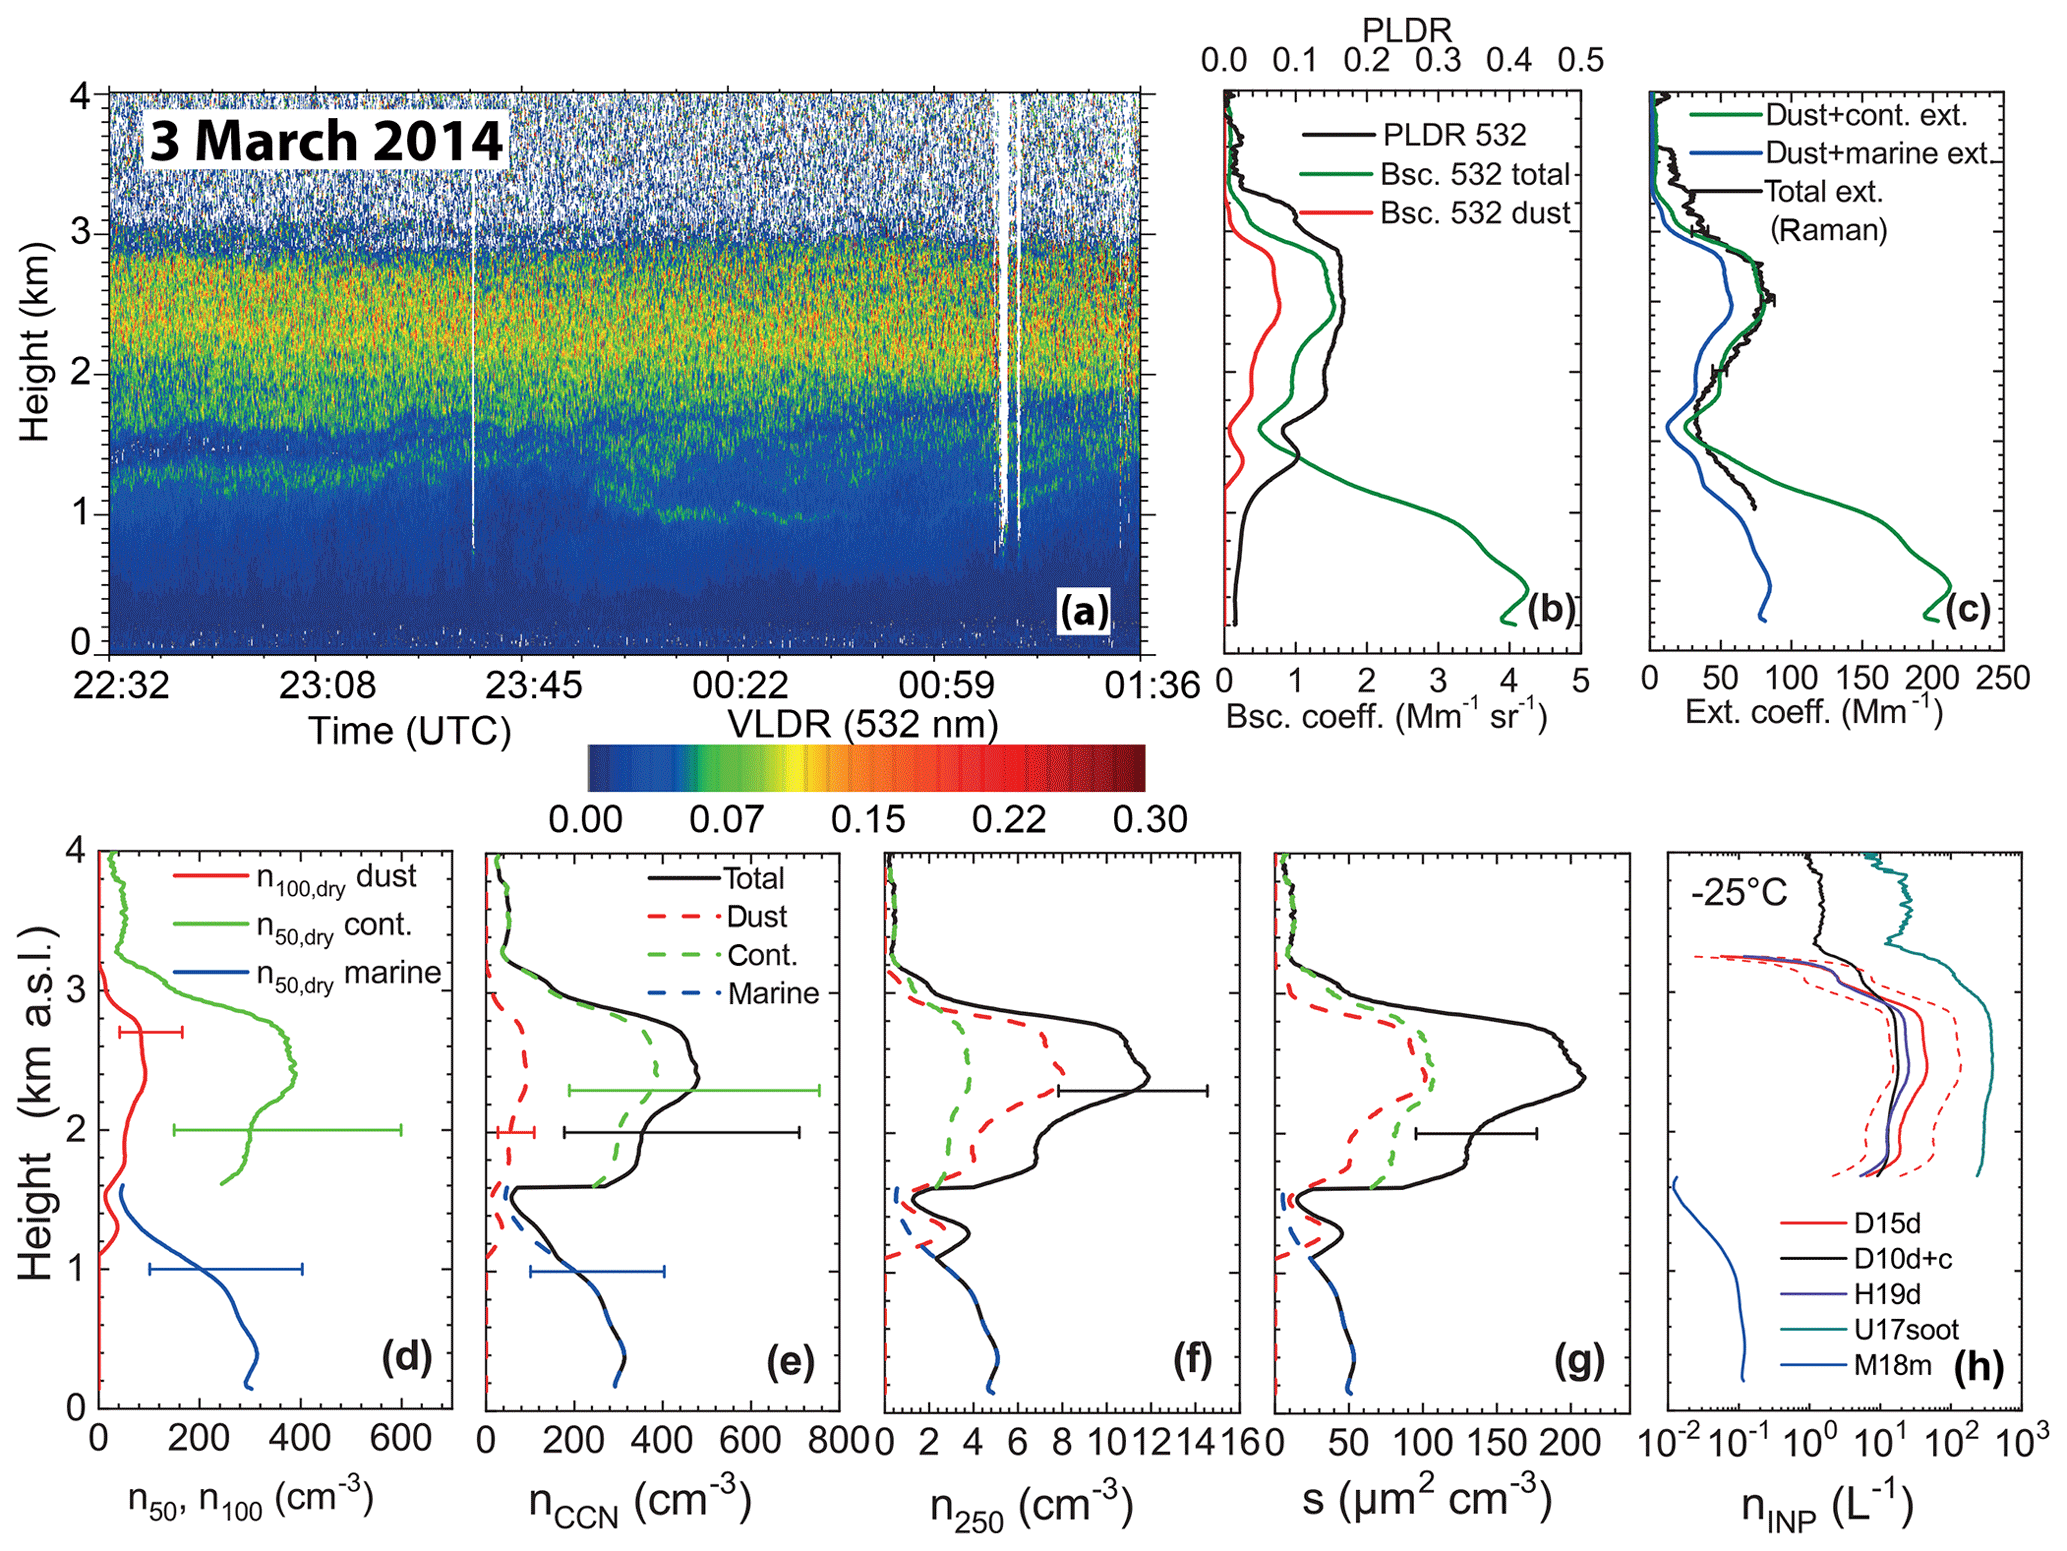
Figure 7Dust–smoke mixture observed during the SALTRACE winter campaign on 3 March 2014, 22:30–23:20 UTC. (a) Time–height display of the 532 nm volume linear depolarization ratio (VLDR; only the first 40 min are averaged for the profiles in b–h), (b) particle backscatter coefficient (green line) including its dust contribution (red line) and particle linear depolarization ratio (black line) at 532 nm, (c) sum of dust and continental pollution extinction coefficient (green line) using a smoke lidar ratio of 50 sr and sum of dust and marine particle extinction coefficient (blue line) using a marine lidar ratio of 20 sr compared to the total extinction coefficient (black line) independently measured with BERTHA (Raman lidar method). Above the height of 1.6 km a dust–smoke mixture fits best; below this height, the dust–marine mixture (with a small contribution of smoke or pollution) agrees better with the Raman extinction solution. (d) Number concentration n100,d for dust (red), n50,c for smoke (green), and n50,m for marine particles (blue); (e) CCN number concentrations at water supersaturation of 0.2 % for the three components and the total CCN concentration (black line) above 1.6 km for dust–smoke and below for dust–marine; (f) n250 values (colors as before); (g) surface-area concentration (colors as before); and (h) immersion-freezing INP concentrations at −25 ∘C for D10 cont. + dust, D15 dust, H19 dust, M18 marine, and U17 soot. For the INP concentration an uncertainty of a factor of 3 is indicated as dashed lines for the D15d profile.
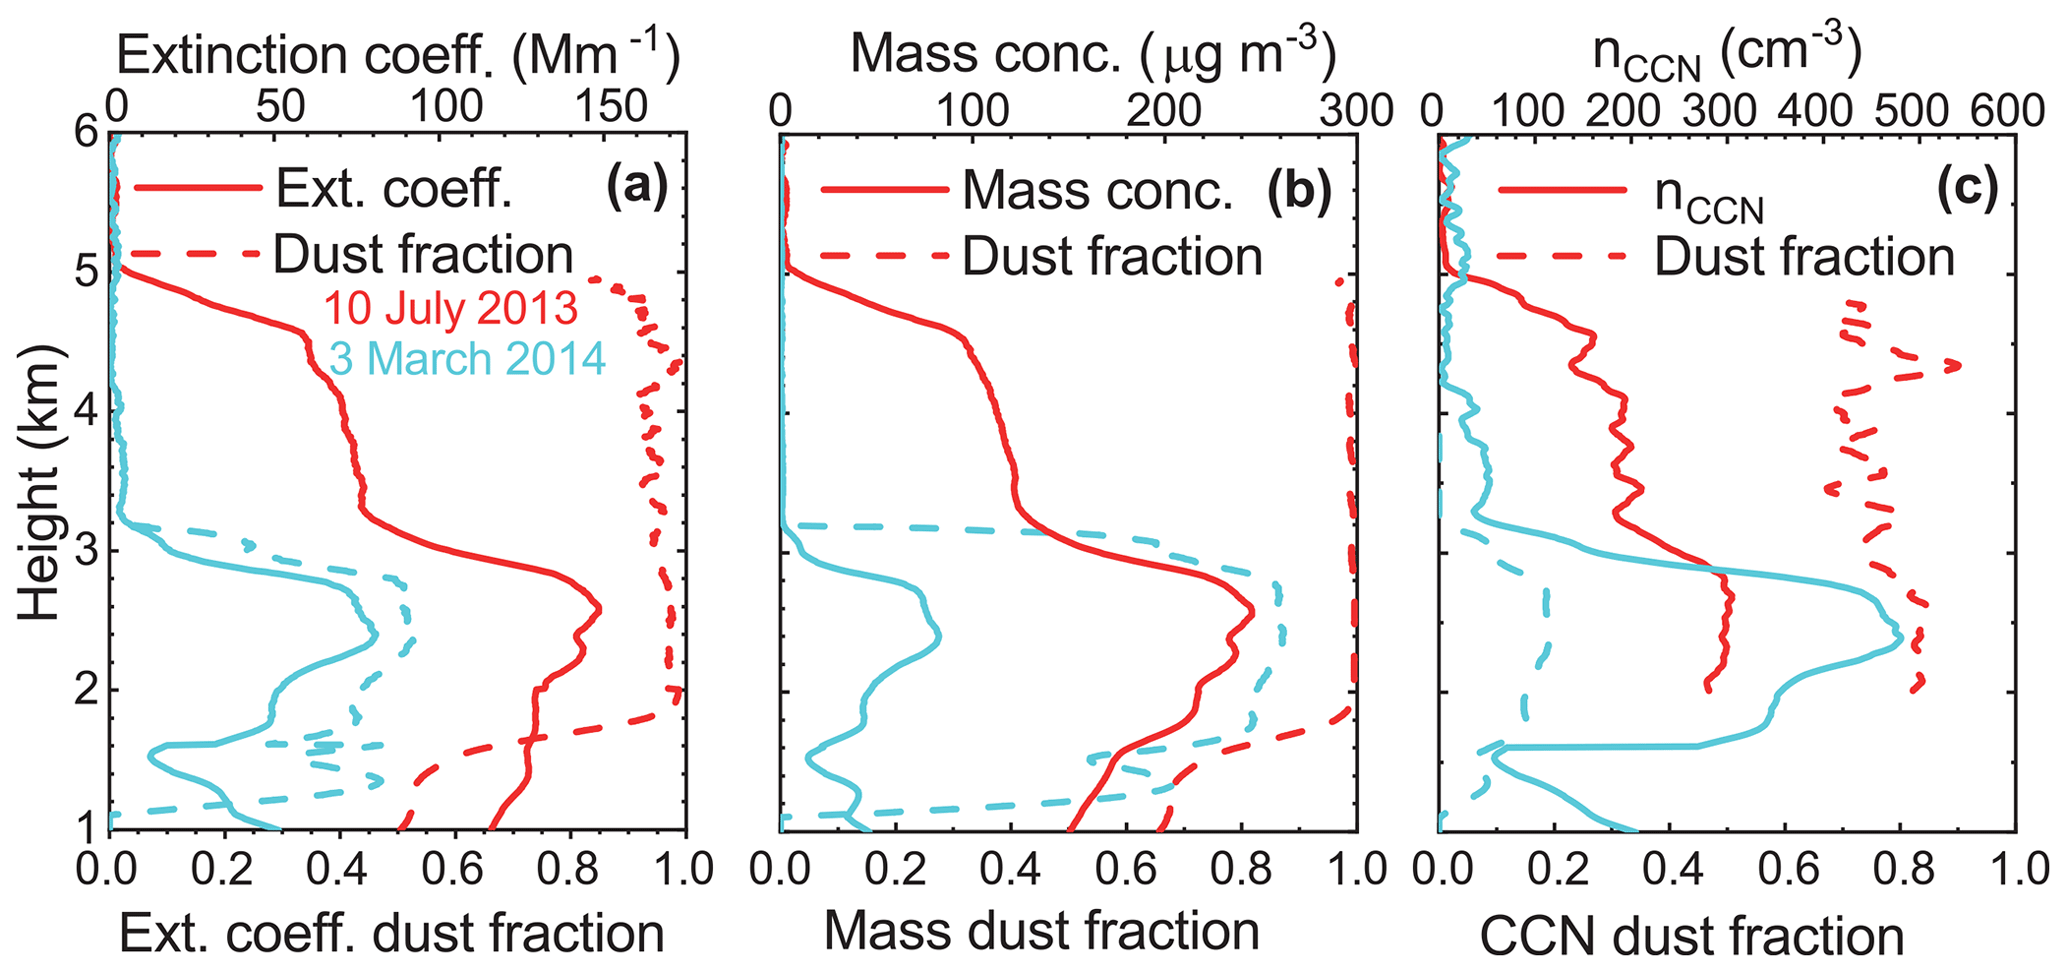
Figure 8Summer (10 July 2013; red) versus winter (3 March 2014; cyan) aerosol conditions in the SAL. (a) Total particle extinction coefficient (solid line) and relative dust contribution to the total particle extinction coefficient (dashed line). (b) Same as (a) except for dust mass concentration. (c) Same as (a) except for CCN concentration.
5.2 Dust–smoke mixture
A pronounced outbreak of aerosol from Africa reached Barbados in the beginning of March 2014. The trajectories ending at 2000 m a.g.l. on 3 March 2014 (not shown) point to the Sahara as the dust source and to western Africa (Senegal and Guinea) as the source region for biomass-burning smoke. The transport across the Atlantic Ocean took around 2 weeks. We use the opportunity of the dust–smoke aerosol mixtures to highlight the strong impact of smoke on the CCN conditions. The transport of biomass-burning smoke from Africa towards South America and the Caribbean during wintertime has been previously reported (Ansmann et al., 2009; Baars et al., 2011). An indication for the strong smoke contribution to the measured backscatter signal was the relatively low particle depolarization ratio (≤0.17). Fine-mode smoke does not depolarize laser light (PLDR ≤ 0.05). Figure 7 gives an overview of the measurements on 3 March 2014. A lofted layer (1.6–3.1 km height) of dust and smoke was found above the marine aerosol layer, reaching 1.6 km height. The vertical profiles in Fig. 7b and c show mean values for the time interval from 22:30 to 23:20 UTC. The particle backscatter coefficient (Fig. 7b) is separated into a dust component and a non-dust component using the PLDR separation technique as described in Sect. 2. To estimate whether the non-dust component is of marine or continental origin, the extinction coefficient was calculated from the different contributions to the backscatter coefficient as previously described in Sect. 2 and in Ansmann et al. (2017). The dust-related backscatter coefficient was multiplied by the dust lidar ratio (Sd=55 sr), and the non-dust backscatter coefficient was multiplied by the lidar ratio for marine particles (Sm=20 sr; contributing to the blue curve in Fig. 7c) and for continental pollution particles (Sc=50 sr; contributing to the green curve in Fig. 7c). The sum of the extinction coefficient (dust plus marine and dust plus continental) is then compared with the total extinction coefficient (black curve in Fig. 7c) derived independently with the Raman lidar method (Ansmann et al., 1992). As can be seen, the lofted aerosol layer obviously contains a mixture of dust and smoke, whereas the layer below is dominated by marine particles.
In the next step, n100,d, n50,c, and n50,m (Fig. 7d) are computed, and the resulting nCCN (Fig. 7e) at 0.2 % supersaturation is calculated. The continental pollution contribution to the CCN number concentration is 4 times stronger than the one from the dust aerosol. Thus, in the winter half-year with significant smoke contribution from Africa, rather different CCN conditions are found across the Atlantic, leading to likely changes in trade wind cumulus cloud microphysical properties compared to the summer months when dust particles dominate the CCN reservoir.
In contrast, n250 is dominated by mineral dust (Fig. 7f). The lidar-derived contributions to the surface-area concentration (Fig. 7g) of dust and smoke are equal. The INP concentration at −25 ∘C estimated in Fig. 7h shows a weak contribution of marine particles (McCluskey et al., 2018), with less efficiency than the dust particles in the lofted layer by 3–5 orders of magnitude. The immersion-freezing INP parameterizations based on n250 (DeMott et al., 2010, 2015) lead to values around 10 L−1. The results are added in Table 5.
Figure 8 highlights the sensitive impact of smoke aerosol on the CCN concentration. The dust contribution to the optical properties (Fig. 8a) is almost 100 % in summer during strong dust outbreaks and around 50 % during the biomass-burning season, which is in full agreement with AERONET observations. Dust dominates the aerosol mass concentration in the SAL (Fig. 8b) throughout the year, disregarding summer or winter conditions. In strong contrast, the smoke CCN concentration (Fig. 8c) derived with lidar strongly varies between summer and winter. CCN levels of 200–300 cm−3 are derived during the strong dust outbreaks in summer (dust contribution around 80 %) but are close to 500 cm−3 in the March 2014 event, with a strong contribution of smoke particles (80 %).
For the first time, we compared lidar-derived concentrations of CCN, particle number (n250) and total surface-area concentration, and fine-mode and coarse-mode dust mass concentration with airborne in situ measurements in vertically deep plumes of aged mineral dust. The study was based on observations in the Saharan Air Layer over Barbados in the Caribbean, more than 5000 km west of the dust source in Africa. We found good agreement in the case of mass concentrations and large particle number concentrations (n250), which serve as input in the INP parameterizations of DeMott et al. (2010, 2015). Differences were observed regarding CCN concentrations. The reason for the differences could not be easily reconciled because many error sources can potentially contribute to the overall uncertainty. The assumptions in the lidar retrieval lead, for example, to an uncertainty range within a factor of 2. Considering this uncertainty, the agreement with the airborne CCN in situ observations is good. We applied several INP parameterization schemes available in literature. The range of solutions provided insight into the uncertainties in the lidar-based INP retrieval. In the case of fine-mode and coarse-mode mass concentrations an excellent agreement between the lidar and the in situ observations was obtained. This agreement demonstrates the capability of the airborne measurements to capture the large particles as well as the ability to derive accurate dust mass concentrations from lidar observations.
The dominating contribution of smoke particles to the CCN concentration in the wintertime SAL was demonstrated. Furthermore, a lidar observation during pure marine background conditions over Barbados in winter was discussed. At marine conditions the INP concentration is about 3 orders of magnitude lower than during dusty conditions.
As an outlook, further comparisons of lidar and in situ airborne observations of aerosol microphysical properties and CCN and INP concentrations are required predominantly in complex aerosol mixtures of mineral dust and anthropogenic pollution to confirm the robustness of the lidar retrieval and the usefulness of the lidar products. We tested the lidar method for dust (and thus the coarse-mode dominated dust conversion factors), but in the next step we need to extend the studies towards complex aerosol mixtures including fine-mode-dominated aerosol types such as smoke and urban pollution. Fine-mode conversion factors are very different from the ones for dust. Our validation effort will be continued in the Eastern Mediterranean, where complex mixtures of anthropogenic haze and Middle Eastern and Saharan dust (partly aged and polluted and partly freshly emitted) are present. The simultaneous observations of a lidar in Limassol, Cyprus, and the Falcon aircraft performed in the framework of the A-LIFE campaign (Absorbing aerosol layers in a changing climate: aging, lifetime and dynamics) in April 2017 will be used for this study.
Once the lidar retrievals are validated and refined by airborne in situ observations, cloud-relevant aerosol properties such as nCCN and nINP can be monitored with organized lidar networks such as the European Aerosol Research Lidar Network (EARLINET; Pappalardo et al., 2014) or continuously operating lidar systems in the framework of PollyNET (Baars et al., 2016). Furthermore, global lidar observations, e.g., from space with CALIPSO (Winker et al., 2009) and in the future with EarthCARE (Illingworth et al., 2015), will benefit from the well-tested CCN and INP lidar retrievals. Such datasets are needed for improved aerosol–cloud interaction studies and as input in weather and future climate predictions to better consider aerosol particles in respective modeling efforts.
The lidar observations (level 0 data and measured signals) and the analysis products are available at TROPOS upon request (info@tropos.de). The aircraft data are available via the University of Vienna upon request.
MH analyzed the lidar data and performed, together with DA and AA, the lidar measurements. AW, together with MD, DS, and BW, performed the in situ measurements and analyzed the data. MH prepared the paper in close cooperation with AA and with the helpful comments and discussions of AW and BW. DF enabled the lidar measurements at the CIMH, Barbados.
The authors declare that they have no conflict of interest.
This article is part of the special issue “The Saharan Aerosol Long‐range Transport and Aerosol‐Cloud‐interaction Experiment (SALTRACE) (ACP/AMT inter-journal SI)”. It is not associated with a conference.
This activity is supported by ACTRIS Research Infrastructure (EU H2020-R&I) under grant agreement number 654109 and by the European Research Council under the European Community's Horizon 2020 research and innovation framework program and ERC grant agreement number 640458 (A-LIFE). The logistical support of the Caribbean Institute for Meteorology and Hydrology (CIMH), Husbands, Barbados, is acknowledged. We thank the two anonymous reviewers for the time and effort put towards the improvement of the paper. We especially thank Paul DeMott for the helpful comments and clarification with respect to the parameterizations developed by his group.
This research has been supported by the Horizon 2020 framework program (ACTRIS-2 (grant no. 654109) and A-LIFE (grant no. 640458)).
The publication of this article was funded by the
Open Access Fund of the Leibniz Association.
This paper was edited by Joshua Schwarz and reviewed by Paul DeMott and two anonymous referees.
Ansmann, A., Wandinger, U., Riebesell, M., Weitkamp, C., and Michaelis, W.: Independent measurement of extinction and backscatter profiles in cirrus clouds by using a combined Raman elastic-backscatter lidar, Appl. Opt., 31, 7113–7131, https://doi.org/10.1364/AO.31.007113, 1992. a, b, c
Ansmann, A., Baars, H., Tesche, M., Müller, D., Althausen, D., Engelmann, R., Pauliquevis, T., and Artaxo, P.: Dust and smoke transport from Africa to South America: Lidar profiling over Cape Verde and the Amazon rainforest, Geophys. Res. Lett., 36, L11802, https://doi.org/10.1029/2009GL037923, 2009. a
Ansmann, A., Rittmeister, F., Engelmann, R., Basart, S., Jorba, O., Spyrou, C., Remy, S., Skupin, A., Baars, H., Seifert, P., Senf, F., and Kanitz, T.: Profiling of Saharan dust from the Caribbean to western Africa – Part 2: Shipborne lidar measurements versus forecasts, Atmos. Chem. Phys., 17, 14987–15006, https://doi.org/10.5194/acp-17-14987-2017, 2017. a, b
Ansmann, A., Mamouri, R.-E., Hofer, J., Baars, H., Althausen, D., and Abdullaev, S. F.: Dust mass, cloud condensation nuclei, and ice-nucleating particle profiling with polarization lidar: updated POLIPHON conversion factors from global AERONET analysis, Atmos. Meas. Tech., 12, 4849–4865, https://doi.org/10.5194/amt-12-4849-2019, 2019. a, b
Baars, H., Ansmann, A., Althausen, D., Engelmann, R., Artaxo, P., Pauliquevis, T., and Souza, R.: Further evidence for significant smoke transport from Africa to Amazonia, Geophys. Res. Lett., 38, L20802, https://doi.org/10.1029/2011GL049200, 2011. a
Baars, H., Kanitz, T., Engelmann, R., Althausen, D., Heese, B., Komppula, M., Preißler, J., Tesche, M., Ansmann, A., Wandinger, U., Lim, J.-H., Ahn, J. Y., Stachlewska, I. S., Amiridis, V., Marinou, E., Seifert, P., Hofer, J., Skupin, A., Schneider, F., Bohlmann, S., Foth, A., Bley, S., Pfüller, A., Giannakaki, E., Lihavainen, H., Viisanen, Y., Hooda, R. K., Pereira, S. N., Bortoli, D., Wagner, F., Mattis, I., Janicka, L., Markowicz, K. M., Achtert, P., Artaxo, P., Pauliquevis, T., Souza, R. A. F., Sharma, V. P., van Zyl, P. G., Beukes, J. P., Sun, J., Rohwer, E. G., Deng, R., Mamouri, R.-E., and Zamorano, F.: An overview of the first decade of PollyNET: an emerging network of automated Raman-polarization lidars for continuous aerosol profiling, Atmos. Chem. Phys., 16, 5111–5137, https://doi.org/10.5194/acp-16-5111-2016, 2016. a, b, c
Baumgardner, D., Jonsson, H., Dawson, W., O'Connor, D., and Newton, R.: The cloud, aerosol and precipitation spectrometer: a new instrument for cloud investigations, Atmos. Res., 59–60, 251–264, https://doi.org/10.1016/S0169-8095(01)00119-3, 2001. a
Brock, C. A., Cozic, J., Bahreini, R., Froyd, K. D., Middlebrook, A. M., McComiskey, A., Brioude, J., Cooper, O. R., Stohl, A., Aikin, K. C., de Gouw, J. A., Fahey, D. W., Ferrare, R. A., Gao, R.-S., Gore, W., Holloway, J. S., Hübler, G., Jefferson, A., Lack, D. A., Lance, S., Moore, R. H., Murphy, D. M., Nenes, A., Novelli, P. C., Nowak, J. B., Ogren, J. A., Peischl, J., Pierce, R. B., Pilewskie, P., Quinn, P. K., Ryerson, T. B., Schmidt, K. S., Schwarz, J. P., Sodemann, H., Spackman, J. R., Stark, H., Thomson, D. S., Thornberry, T., Veres, P., Watts, L. A., Warneke, C., and Wollny, A. G.: Characteristics, sources, and transport of aerosols measured in spring 2008 during the aerosol, radiation, and cloud processes affecting Arctic Climate (ARCPAC) Project, Atmos. Chem. Phys., 11, 2423–2453, https://doi.org/10.5194/acp-11-2423-2011, 2011. a
Cai, Y., Montague, D. C., Mooiweer-Bryan, W., and Deshler, T.: Performance characteristics of the ultra high sensitivity aerosol spectrometer for particles between 55 and 800 nm: Laboratory and field studies, J. Aerosol Sci., 39, 759–769, https://doi.org/10.1016/j.jaerosci.2008.04.007, 2008. a
DeMott, P. J., Prenni, A. J., Liu, X., Kreidenweis, S. M., Petters, M. D., Twohy, C. H., Richardson, M. S., Eidhammer, T., and Rogers, D. C.: Predicting global atmospheric ice nuclei distributions and their impacts on climate, P. Natl. Acad. Sci. USA, 107, 11217–11222, https://doi.org/10.1073/pnas.0910818107, 2010. a, b, c, d, e, f
DeMott, P. J., Prenni, A. J., McMeeking, G. R., Sullivan, R. C., Petters, M. D., Tobo, Y., Niemand, M., Möhler, O., Snider, J. R., Wang, Z., and Kreidenweis, S. M.: Integrating laboratory and field data to quantify the immersion freezing ice nucleation activity of mineral dust particles, Atmos. Chem. Phys., 15, 393–409, https://doi.org/10.5194/acp-15-393-2015, 2015. a, b, c, d, e, f, g
Denjean, C., Caquineau, S., Desboeufs, K., Laurent, B., Maille, M., Quiñones Rosado, M., Vallejo, P., Mayol-Bracero, O. L., and Formenti, P.: Long-range transport across the Atlantic in summertime does not enhance the hygroscopicity of African mineral dust, Geophys. Res. Lett., 42, 7835–7843, https://doi.org/10.1002/2015GL065693, 2015. a
Düsing, S., Wehner, B., Seifert, P., Ansmann, A., Baars, H., Ditas, F., Henning, S., Ma, N., Poulain, L., Siebert, H., Wiedensohler, A., and Macke, A.: Helicopter-borne observations of the continental background aerosol in combination with remote sensing and ground-based measurements, Atmos. Chem. Phys., 18, 1263–1290, https://doi.org/10.5194/acp-18-1263-2018, 2018. a
Fernald, F. G.: Analysis of atmospheric lidar observations: some comments, Appl. Opt., 23, 652–653, https://doi.org/10.1364/AO.23.000652, 1984. a
Freudenthaler, V., Esselborn, M., Wiegner, M., Heese, B., Tesche, M., Ansmann, A., Müller, D., Althausen, D., Wirth, M., Fix, A., Ehret, G., Knippertz, P., Toledano, C., Gasteiger, J., Garhammer, M., and Seefeldner, M.: Depolarization ratio profiling at several wavelengths in pure Saharan dust during SAMUM 2006, Tellus B, 61, 165–179, https://doi.org/10.1111/j.1600-0889.2008.00396.x, 2009. a
Gasteiger, J., Groß, S., Sauer, D., Haarig, M., Ansmann, A., and Weinzierl, B.: Particle settling and vertical mixing in the Saharan Air Layer as seen from an integrated model, lidar, and in situ perspective, Atmos. Chem. Phys., 17, 297–311, https://doi.org/10.5194/acp-17-297-2017, 2017. a
Groß, S., Esselborn, M., Weinzierl, B., Wirth, M., Fix, A., and Petzold, A.: Aerosol classification by airborne high spectral resolution lidar observations, Atmos. Chem. Phys., 13, 2487–2505, https://doi.org/10.5194/acp-13-2487-2013, 2013. a, b
Groß, S., Freudenthaler, V., Schepanski, K., Toledano, C., Schäfler, A., Ansmann, A., and Weinzierl, B.: Optical properties of long-range transported Saharan dust over Barbados as measured by dual-wavelength depolarization Raman lidar measurements, Atmos. Chem. Phys., 15, 11067–11080, https://doi.org/10.5194/acp-15-11067-2015, 2015. a, b
Haarig, M., Engelmann, R., Ansmann, A., Veselovskii, I., Whiteman, D. N., and Althausen, D.: 1064 nm rotational Raman lidar for particle extinction and lidar-ratio profiling: cirrus case study, Atmos. Meas. Tech., 9, 4269–4278, https://doi.org/10.5194/amt-9-4269-2016, 2016. a
Haarig, M., Ansmann, A., Althausen, D., Klepel, A., Groß, S., Freudenthaler, V., Toledano, C., Mamouri, R.-E., Farrell, D. A., Prescod, D. A., Marinou, E., Burton, S. P., Gasteiger, J., Engelmann, R., and Baars, H.: Triple-wavelength depolarization-ratio profiling of Saharan dust over Barbados during SALTRACE in 2013 and 2014, Atmos. Chem. Phys., 17, 10767–10794, https://doi.org/10.5194/acp-17-10767-2017, 2017a. a, b, c, d
Haarig, M., Ansmann, A., Gasteiger, J., Kandler, K., Althausen, D., Baars, H., Radenz, M., and Farrell, D. A.: Dry versus wet marine particle optical properties: RH dependence of depolarization ratio, backscatter, and extinction from multiwavelength lidar measurements during SALTRACE, Atmos. Chem. Phys., 17, 14199–14217, https://doi.org/10.5194/acp-17-14199-2017, 2017b. a, b, c, d
Harrison, A. D., Lever, K., Sanchez-Marroquin, A., Holden, M. A., Whale, T. F., Tarn, M. D., McQuaid, J. B., and Murray, B. J.: The ice-nucleating ability of quartz immersed in water and its atmospheric importance compared to K-feldspar, Atmos. Chem. Phys., 19, 11343–11361, https://doi.org/10.5194/acp-19-11343-2019, 2019. a, b, c, d, e
Herich, H., Tritscher, T., Wiacek, A., Gysel, M., Weingartner, E., Lohmann, U., Baltensperger, U., and Cziczo, D. J.: Water uptake of clay and desert dust aerosol particles at sub- and supersaturated water vapor conditions, Phys. Chem. Chem. Phys., 11, 7804–7809, https://doi.org/10.1039/B901585J, 2009. a, b, c, d
Holben, B., Eck, T., Slutsker, I., Tanré, D., Buis, J., Setzer, A., Vermote, E., Reagan, J., Kaufman, Y., Nakajima, T., Lavenu, F., Jankowiak, I., and Smirnov, A.: AERONET–A Federated Instrument Network and Data Archive for Aerosol Characterization, Remote Sensing of Environment, 66, 1–16, https://doi.org/10.1016/S0034-4257(98)00031-5, 1998. a
Illingworth, A. J., Barker, H. W., Beljaars, A., Ceccaldi, M., Chepfer, H., Clerbaux, N., Cole, J., Delanoë, J., Domenech, C., Donovan, D. P., Fukuda, S., Hirakata, M., Hogan, R. J., Huenerbein, A., Kollias, P., Kubota, T., Nakajima, T., Nakajima, T. Y., Nishizawa, T., Ohno, Y., Okamoto, H., Oki, R., Sato, K., Satoh, M., Shephard, M. W., Velázquez-Blázquez, A., Wandinger, U., Wehr, T., and van Zadelhoff, G.-J.: The EarthCARE Satellite: The Next Step Forward in Global Measurements of Clouds, Aerosols, Precipitation, and Radiation, B. Am. Meteor. Soc., 96, 1311–1332, https://doi.org/10.1175/BAMS-D-12-00227.1, 2015. a
IPCC: Climate Change 2013: The Physical Science Basis, Contribution of Working Group 1 to the Fifth Assessment Report of the Intergovernmental Panel on Climate Change, Cambridge University Press, New York, USA, available at: http://www.ipcc.ch/report/ar5/ (last access: 14 December 2017), 2013. a
Jung, E., Albrecht, B. A., Feingold, G., Jonsson, H. H., Chuang, P., and Donaher, S. L.: Aerosols, clouds, and precipitation in the North Atlantic trades observed during the Barbados aerosol cloud experiment – Part 1: Distributions and variability, Atmos. Chem. Phys., 16, 8643–8666, https://doi.org/10.5194/acp-16-8643-2016, 2016. a
Kandler, K., Schneiders, K., Ebert, M., Hartmann, M., Weinbruch, S., Prass, M., and Pöhlker, C.: Composition and mixing state of atmospheric aerosols determined by electron microscopy: method development and application to aged Saharan dust deposition in the Caribbean boundary layer, Atmos. Chem. Phys., 18, 13429–13455, https://doi.org/10.5194/acp-18-13429-2018, 2018. a, b, c, d, e
Klett, J. D.: Stable analytical inversion solution for processing lidar returns, Appl. Opt., 20, 211–220, https://doi.org/10.1364/AO.20.000211, 1981. a
Koehler, K. A., Kreidenweis, S. M., DeMott, P. J., Petters, M. D., Prenni, A. J., and Carrico, C. M.: Hygroscopicity and cloud droplet activation of mineral dust aerosol, Geophys. Res. Lett., 36, L08805, https://doi.org/10.1029/2009GL037348, 2009. a, b, c
Kristensen, T. B., Wex, H., Nekat, B., Nojgaard, J. K., van Pinxteren, D., Lowenthal, D. H., Mazzoleni, L. R., Dieckmann, K., Bender Koch, C., Mentel, T. F., Herrmann, H., Gannet Hallar, A., Stratmann, F., and Bilde, M.: Hygroscopic growth and CCN activity of HULIS from different environments, J. Geophys. Res., 117, D22203, https://doi.org/10.1029/2012jd018249, 2012. a
Kristensen, T. B., Müller, T., Kandler, K., Benker, N., Hartmann, M., Prospero, J. M., Wiedensohler, A., and Stratmann, F.: Properties of cloud condensation nuclei (CCN) in the trade wind marine boundary layer of the western North Atlantic, Atmos. Chem. Phys., 16, 2675–2688, https://doi.org/10.5194/acp-16-2675-2016, 2016. a
Kumar, P., Sokolik, I. N., and Nenes, A.: Measurements of cloud condensation nuclei activity and droplet activation kinetics of fresh unprocessed regional dust samples and minerals, Atmos. Chem. Phys., 11, 3527–3541, https://doi.org/10.5194/acp-11-3527-2011, 2011a. a, b
Kumar, P., Sokolik, I. N., and Nenes, A.: Cloud condensation nuclei activity and droplet activation kinetics of wet processed regional dust samples and minerals, Atmos. Chem. Phys., 11, 8661–8676, https://doi.org/10.5194/acp-11-8661-2011, 2011b. a, b, c
Kupc, A., Williamson, C., Wagner, N. L., Richardson, M., and Brock, C. A.: Modification, calibration, and performance of the Ultra-High Sensitivity Aerosol Spectrometer for particle size distribution and volatility measurements during the Atmospheric Tomography Mission (ATom) airborne campaign, Atmos. Meas. Tech., 11, 369–383, https://doi.org/10.5194/amt-11-369-2018, 2018. a
Lance, S., Nenes, A., Medina, J., and Smith, J. N.: Mapping the Operation of the DMT Continuous Flow CCN Counter, Aerosol Sci. Technol., 40, 242–254, https://doi.org/10.1080/02786820500543290, 2006. a
Lieke, K., Kandler, K., Scheuvens, D., Emmel, C., Von Glahn, C., Petzold, A., Weinzierl, B., Veira, A., Ebert, M., Weinbruch, S., and Schütz, L.: Particle chemical properties in the vertical column based on aircraft observations in the vicinity of Cape Verde Islands, Tellus B, 63, 497–511, https://doi.org/10.1111/j.1600-0889.2011.00553.x, 2011. a
Lv, M., Wang, Z., Li, Z., Luo, T., Ferrare, R., Liu, D., Wu, D., Mao, J., Wan, B., Zhang, F., and Wang, Y.: Retrieval of Cloud Condensation Nuclei Number Concentration Profiles From Lidar Extinction and Backscatter Data, J. Geophys. Res.-Atmos., 123, 6082–6098, https://doi.org/10.1029/2017JD028102, 2018. a, b
Mamouri, R. E. and Ansmann, A.: Fine and coarse dust separation with polarization lidar, Atmos. Meas. Tech., 7, 3717–3735, https://doi.org/10.5194/amt-7-3717-2014, 2014. a, b
Mamouri, R. E. and Ansmann, A.: Estimated desert-dust ice nuclei profiles from polarization lidar: methodology and case studies, Atmos. Chem. Phys., 15, 3463–3477, https://doi.org/10.5194/acp-15-3463-2015, 2015. a
Mamouri, R.-E. and Ansmann, A.: Potential of polarization lidar to provide profiles of CCN- and INP-relevant aerosol parameters, Atmos. Chem. Phys., 16, 5905–5931, https://doi.org/10.5194/acp-16-5905-2016, 2016. a, b, c, d, e, f, g, h, i, j
Mamouri, R.-E. and Ansmann, A.: Potential of polarization/Raman lidar to separate fine dust, coarse dust, maritime, and anthropogenic aerosol profiles, Atmos. Meas. Tech., 10, 3403–3427, https://doi.org/10.5194/amt-10-3403-2017, 2017. a, b, c
Marinou, E., Tesche, M., Nenes, A., Ansmann, A., Schrod, J., Mamali, D., Tsekeri, A., Pikridas, M., Baars, H., Engelmann, R., Voudouri, K.-A., Solomos, S., Sciare, J., Groß, S., Ewald, F., and Amiridis, V.: Retrieval of ice-nucleating particle concentrations from lidar observations and comparison with UAV in situ measurements, Atmos. Chem. Phys., 19, 11315–11342, https://doi.org/10.5194/acp-19-11315-2019, 2019. a, b, c
McCluskey, C. S., Ovadnevaite, J., Rinaldi, M., Atkinson, J., Belosi, F., Ceburnis, D., Marullo, S., Hill, T. C. J., Lohmann, U., Kanji, Z. A., O'Dowd, C., Kreidenweis, S. M., and DeMott, P. J.: Marine and Terrestrial Organic Ice-Nucleating Particles in Pristine Marine to Continentally Influenced Northeast Atlantic Air Masses, J. Geophys. Res.-Atmos., 123, 6196–6212, https://doi.org/10.1029/2017JD028033, 2018. a, b, c, d, e, f
Müller, D., Ansmann, A., Mattis, I., Tesche, M., Wandinger, U., Althausen, D., and Pisani, G.: Aerosol-type-dependent lidar ratios observed with Raman lidar, J. Geophys. Res.-Atmos., 112, D16202, https://doi.org/10.1029/2006JD008292, 2007. a
Niemand, M., Möhler, O., Vogel, B., Vogel, H., Hoose, C., Connolly, P., Klein, H., Bingemer, H., DeMott, P., Skrotzki, J., and Leisner, T.: A Particle-Surface-Area-Based Parameterization of Immersion Freezing on Desert Dust Particles, J. Atmos. Sci., 69, 3077–3092, https://doi.org/10.1175/JAS-D-11-0249.1, 2012. a
Pappalardo, G., Amodeo, A., Apituley, A., Comeron, A., Freudenthaler, V., Linné, H., Ansmann, A., Bösenberg, J., D'Amico, G., Mattis, I., Mona, L., Wandinger, U., Amiridis, V., Alados-Arboledas, L., Nicolae, D., and Wiegner, M.: EARLINET: towards an advanced sustainable European aerosol lidar network, Atmos. Meas. Tech., 7, 23–2409, https://doi.org/10.5194/amt-7-2389-2014, 2014. a
Petters, M. D. and Kreidenweis, S. M.: A single parameter representation of hygroscopic growth and cloud condensation nucleus activity, Atmos. Chem. Phys., 7, 1961-1971, https://doi.org/10.5194/acp-7-1961-2007, 2007. a, b, c
Petters, M. D., Carrico, C. M., Kreidenweis, S. M., Prenni, A. J., DeMott, P. J., Collett Jr., J. L., and Moosmüller, H.: Cloud condensation nucleation activity of biomass burning aerosol, J. Geophys. Res., 114, D22205, https://doi.org/10.1029/2009jd012353, 2009. a
Price, H. C., Baustian, K. J., McQuaid, J. B., Blyth, A., Bower, K. N., Choularton, T., Cotton, R. J., Cui, Z., Field, P. R., Gallagher, M., Hawker, R., Merrington, A., Miltenberger, A., Neely III, R. R., Parker, S. T., Rosenberg, P. D., Taylor, J. W., Trembath, J., Vergara-Temprado, J., Whale, T. F., Wilson, T. W., Young, G., and Murray, B. J.: Atmospheric Ice-Nucleating Particles in the Dusty Tropical Atlantic, J. Geophys. Res.-Atmos., 123, 2175–2193, https://doi.org/10.1002/2017JD027560, 2018. a
Roberts, G. C. and Nenes, A.: A Continuous-Flow Streamwise Thermal-Gradient CCN Chamber for Atmospheric Measurements, Aerosol Sci. Technol., 39, 206–221, https://doi.org/10.1080/027868290913988, 2005. a
Sawamura, P., Moore, R. H., Burton, S. P., Chemyakin, E., Müller, D., Kolgotin, A., Ferrare, R. A., Hostetler, C. A., Ziemba, L. D., Beyersdorf, A. J., and Anderson, B. E.: HSRL-2 aerosol optical measurements and microphysical retrievals vs. airborne in situ measurements during DISCOVER-AQ 2013: an intercomparison study, Atmos. Chem. Phys., 17, 7229–7243, https://doi.org/10.5194/acp-17-7229-2017, 2017. a, b
Schrod, J., Weber, D., Drücke, J., Keleshis, C., Pikridas, M., Ebert, M., Cvetković, B., Nickovic, S., Marinou, E., Baars, H., Ansmann, A., Vrekoussis, M., Mihalopoulos, N., Sciare, J., Curtius, J., and Bingemer, H. G.: Ice nucleating particles over the Eastern Mediterranean measured by unmanned aircraft systems, Atmos. Chem. Phys., 17, 4817–4835, https://doi.org/10.5194/acp-17-4817-2017, 2017. a
Shinozuka, Y., Clarke, A. D., Nenes, A., Jefferson, A., Wood, R., McNaughton, C. S., Ström, J., Tunved, P., Redemann, J., Thornhill, K. L., Moore, R. H., Lathem, T. L., Lin, J. J., and Yoon, Y. J.: The relationship between cloud condensation nuclei (CCN) concentration and light extinction of dried particles: indications of underlying aerosol processes and implications for satellite-based CCN estimates, Atmos. Chem. Phys., 15, 7585–7604, https://doi.org/10.5194/acp-15-7585-2015, 2015. a, b
Siebert, H., Beals, M., Bethke, J., Bierwirth, E., Conrath, T., Dieckmann, K., Ditas, F., Ehrlich, A., Farrell, D., Hartmann, S., Izaguirre, M. A., Katzwinkel, J., Nuijens, L., Roberts, G., Schäfer, M., Shaw, R. A., Schmeissner, T., Serikov, I., Stevens, B., Stratmann, F., Wehner, B., Wendisch, M., Werner, F., and Wex, H.: The fine-scale structure of the trade wind cumuli over Barbados – an introduction to the CARRIBA project, Atmos. Chem. Phys., 13, 10061–10077, https://doi.org/10.5194/acp-13-10061-2013, 2013. a, b
Spanu, A., Dollner, M., Gasteiger, J., Bui, T. P., and Weinzierl, B.: Flow-induced errors in airborne in-situ measurements of aerosols and clouds, Atmos. Meas. Tech. Discuss., https://doi.org/10.5194/amt-2019-27, in review, 2019. a, b
Steinke, I., Hoose, C., Möhler, O., Connolly, P., and Leisner, T.: A new temperature- and humidity-dependent surface site density approach for deposition ice nucleation, Atmos. Chem. Phys., 15, 3703–3717, https://doi.org/10.5194/acp-15-3703-2015, 2015. a
Tobo, Y., Prenni, A. J., DeMott, P. J., Huffman, J. A., McCluskey, C. S., Tian, G., Pöhlker, C., Pöschl, U., and Kreidenweis, S. M.: Biological aerosol particles as a key determinant of ice nuclei populations in a forest ecosystem, J. Geophys. Res.-Atmos., 118, 10100–10110, https://doi.org/10.1002/jgrd.50801, 2013. a
Twohy, C. H., Kreidenweis, S. M., Eidhammer, T., Browell, E. V., Heymsfield, A. J., Bansemer, A. R., Anderson, B. E., Chen, G., Ismail, S., DeMott, P. J., and Van Den Heever, S. C.: Saharan dust particles nucleate droplets in eastern Atlantic clouds, Geophys. Res. Lett., 36, L01807, https://doi.org/10.1029/2008GL035846, 2009. a
Ullrich, R., Hoose, C., Möhler, O., Niemand, M., Wagner, R., Höhler, K., Hiranuma, N., Saathoff, H., and Leisner, T.: A New Ice Nucleation Active Site Parameterization for Desert Dust and Soot, J. Atmos. Sci., 74, 699–717, https://doi.org/10.1175/JAS-D-16-0074.1, 2017. a, b, c, d
Walser, A., Sauer, D., Spanu, A., Gasteiger, J., and Weinzierl, B.: On the parametrization of optical particle counter response including instrument-induced broadening of size spectra and a self-consistent evaluation of calibration measurements, Atmos. Meas. Tech., 10, 4341–4361, https://doi.org/10.5194/amt-10-4341-2017, 2017. a
Weinzierl, B., Ansmann, A., Prospero, J. M., Althausen, D., Benker, N., Chouza, F., Dollner, M., Farrell, D., Fomba, W. K., Freudenthaler, V., Gasteiger, J., Groß, S., Haarig, M., Heinold, B., Kandler, K., Kristensen, T. B., Mayol-Bracero, O. L., Müller, T., Reitebuch, O., Sauer, D., Schäfler, A., Schepanski, K., Spanu, A., Tegen, I., Toledano, C., and Walser, A.: The Saharan Aerosol Long-range Transport and Aerosol-Cloud-Interaction Experiment (SALTRACE): overview and selected highlights, B. Am. Meteor. Soc., 98, 1427–1451, https://doi.org/10.1175/BAMS-D-15-00142.1, 2017. a, b, c, d, e
Wex, H., Dieckmann, K., Roberts, G. C., Conrath, T., Izaguirre, M. A., Hartmann, S., Herenz, P., Schäfer, M., Ditas, F., Schmeissner, T., Henning, S., Wehner, B., Siebert, H., and Stratmann, F.: Aerosol arriving on the Caribbean island of Barbados: physical properties and origin, Atmos. Chem. Phys., 16, 14107–14130, https://doi.org/10.5194/acp-16-14107-2016, 2016. a, b
Winker, D. M., Vaughan, M. A., Omar, A., Hu, Y., Powell, K. A., Liu, Z., Hunt, W. H., and Young, S. A.: Overview of the CALIPSO Mission and CALIOP Data Processing Algorithms, J. Atmos. Ocean. Tech., 26, 2310–2323, https://doi.org/10.1175/2009JTECHA1281.1, 2009. a
- Abstract
- Introduction
- Instrumentation and methods
- Lidar observations of SAL dust layering: comparison days
- Lidar retrievals versus airborne in situ aerosol observations
- Contrasting pure dust with mixed dust–smoke and pristine marine conditions
- Summary and conclusion
- Data availability
- Author contributions
- Competing interests
- Special issue statement
- Acknowledgements
- Financial support
- Review statement
- References