the Creative Commons Attribution 4.0 License.
the Creative Commons Attribution 4.0 License.
 | 20 Aug 2018
Extreme levels of Canadian wildfire smoke in the stratosphere over central Europe on 21–22 August 2017
Albert Ansmann
Holger Baars
Alexandra Chudnovsky
Ina Mattis
Igor Veselovskii
Moritz Haarig
Patric Seifert
Ronny Engelmann
Ulla Wandinger
Light extinction coefficients of 500 Mm−1, about 20 times higher than after the Pinatubo volcanic eruptions in 1991, were observed by European Aerosol Research Lidar Network (EARLINET) lidars in the stratosphere over central Europe on 21–22 August 2017. Pronounced smoke layers with a 1–2 km vertical extent were found 2–5 km above the local tropopause. Optically dense layers of Canadian wildfire smoke reached central Europe 10 days after their injection into the upper troposphere and lower stratosphere which was caused by rather strong pyrocumulonimbus activity over western Canada. The smoke-related aerosol optical thickness (AOT) identified by lidar was close to 1.0 at 532 nm over Leipzig during the noon hours on 22 August 2017. Smoke particles were found throughout the free troposphere (AOT of 0.3) and in the pronounced 2 km thick stratospheric smoke layer at an altitude of 14–16 km (AOT of 0.6). The lidar observations indicated peak mass concentrations of 70–100 µg m−3 in the stratosphere. In addition to the lidar profiles, we analyzed Moderate Resolution Imaging Spectroradiometer (MODIS) fire radiative power (FRP) over Canada, and the distribution of MODIS AOT and Ozone Monitoring Instrument (OMI) aerosol index across the North Atlantic. These instruments showed a similar pattern and a clear link between the western Canadian fires and the aerosol load over Europe. In this paper, we also present Aerosol Robotic Network (AERONET) sun photometer observations, compare photometer and lidar-derived AOT, and discuss an obvious bias (the smoke AOT is too low) in the photometer observations. Finally, we compare the strength of this record-breaking smoke event (in terms of the particle extinction coefficient and AOT) with major and moderate volcanic events observed over the northern midlatitudes.
- Article
(5450 KB) - Companion paper
- BibTeX
- EndNote


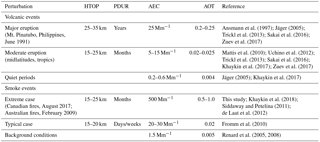
Exceptionally dense Canadian wildfire smoke layers that caused an aerosol optical thickness (AOT) close to 1.0 at 532 nm crossed central Europe at a height of 3–17 km on 21–22 August 2017. Stratospheric light-extinction coefficients observed at a height of 14–16 km, about 3–4 km above the local tropopause, were 20 times higher than the maximum extinction values observed in the stratosphere over central Europe in the winters of 1991 and 1992 after the strong Mt. Pinatubo eruption in June 1991 (Ansmann et al., 1997; Jäger, 2005). We had never observed such a strong perturbation of stratospheric aerosol conditions with our lidars before; therefore, we document this record-breaking event in this paper. North American aerosol signatures are usually detected at altitudes between 3 and 8 km over central Europe during the summer seasons (Mattis et al., 2003, 2008) with AOTs of 0.02–0.05; there have only been a few cases of enhanced smoke-related extinction coefficients being observed just above the tropopause. Table 1 gives an overview of extreme and moderate events of stratospheric perturbations (related to volcanic eruptions and wildfire periods) and corroborates the extraordinarily heavy contamination of the lower stratosphere over central Europe on 21–22 August 2017 (more details in Sect. 4).
Ansmann et al. (1997); Jäger (2005)Trickl et al. (2013); Sakai et al. (2016)Zuev et al. (2017)Mattis et al. (2010); Uchino et al. (2012)Trickl et al. (2013); Sakai et al. (2016)Khaykin et al. (2017); Zuev et al. (2017)Jäger (2005); Khaykin et al. (2017)Khaykin et al. (2018)Siddaway and Petelina (2011)de Laat et al. (2012)Fromm et al. (2010)Renard et al. (2005, 2008)Table 1Comparison of extreme and moderate events of stratospheric aerosol perturbations (volcanic eruptions and pyrocumulonimbus-related smoke events) as observed using lidar over northern midlatitudes. Characteristic values for maximum layer top height (HTOP), typical observable duration of the stratospheric aerosol perturbation (PDUR), maximum 532 nm aerosol extinction coefficient (AEC), and AOT (above the tropopause) are given. For background aerosol conditions, mean AEC and AOT values are shown. The extraordinarily strong (“Black Saturday”) wildfire smoke event in Australia is included in the comparison. Balloon-borne in situ observations are also considered (smoke events, background conditions). More explanations are given in Sect. 4.
Record-breaking intensive fires combined with the formation of exceptionally strong and well organized pyrocumulonimbus clusters in western Canada (https://visibleearth.nasa.gov/view.php?id=90759, https://earthdata.nasa.gov/fire-and-smoke-in-canada, last access: 10 July 2018) were responsible for these unprecedented, optically thick stratospheric smoke layers reaching Europe. Fromm et al. (2000, 2003) and Rosenfeld et al. (2007) showed that large amounts of fire smoke can be lifted up to the tropopause within a short time period (less than 1 h) and can partly reach the lower stratosphere via the formation of pyrocumulonimbus clouds that are associated with strong updrafts with vertical wind velocities of 10–30 m s−1 (Fromm et al., 2010; Peterson et al., 2017). Self-lifting effects (Boers et al., 2010; Siddaway and Petelina, 2011; de Laat et al., 2012) and gravito-photophoresis forces (Rohatschek, 1996; Pueschel et al., 2000; Cheremisin et al., 2005; Renard et al., 2008) lead to a further ascent of the soot-containing layers.
The 2017 wildfire season (April–September) was the worst ever burning season in British Columbia, Canada, since recording began in 1950 (https://globalnews.ca/news/3675434/2017-officially-b-c-s-worst-ever-wildfire-season/, last access: 10 July 2018), and even exceeded the year 1958 (855 000 ha area burned) with about 900 000 ha of forest burned. Recent studies suggest a direct link between increasing fire activity in the northwestern United States and Canada and changing climate and weather conditions (Liu et al., 2009, 2014; Kitzberger et al., 2017). The summer season of 2017 was unusually dry in western Canada and helped to create a hot, dry environment with a large reservoir of underbrush which is favorable burning material.
According to spaceborne CALIPSO (Cloud-Aerosol Lidar and Infrared Pathfinder Satellite Observation) lidar observations presented by Khaykin et al. (2018) the fire aerosol traveled eastward after entering the upper troposphere and lower stratosphere, crossed the North Atlantic, Europe, northern Asia, and circled around the globe within less than 20 days. Khaykin et al. (2018) further pointed out that the optically dense smoke plumes obviously ascended by about 2–3 km per day during the first few days following their injection into the upper troposphere and lower stratosphere. The smoke layers were observed throughout Europe by the ground-based lidar systems of the European Aerosol Research Lidar Network (EARLINET) (Pappalardo et al., 2014) and further lidars operated in a long-term mode (Khaykin et al., 2018). Traces of stratospheric smoke were continuously detected over Europe until the end of 2017.
Large volcanic eruptions were long considered to be the only process by which significant amounts of aerosols and gases could abruptly enter the lower stratosphere. Pyrocumulonimbus-related smoke injections, as reported here, may foster discussion on the role and relevance of alternative path ways for massive perturbations of the stratospheric aerosol conditions. The extreme August 2017 fire period provides an ideal opportunity to test atmospheric transport models regarding long-range smoke transport, spread and removal, and the direct and indirect impact of the soot layers on climate. Volcanic and smoke aerosols show very different chemical, physical, and morphological characteristics. In contrast to the liquid (spherical) sulfuric acid droplets of volcanic origin, stratospheric soot particles are solid, non-spherical, and can significantly absorb solar radiation and ascend to greater heights. Soot particles influence the evolution of ice clouds by serving as ice-nucleating particles in heterogeneous (deposition) freezing processes (Hoose and Möhler, 2012), whereas liquid sulfuric acid droplets influence cirrus occurrence and evolution via homogeneous ice nucleation (Jensen and Toon, 1992; Sassen et al., 1995; Liu and Penner, 2002). The complex transport features and climatic influences of stratospheric soot layers make it necessary to compare simulated smoke scenarios and the evolution of the smoke layer during long-range transport with available observations. Recent advances in ground-based and spaceborne active and passive remote sensing, which equates to an increase in the availability of a dense set of observations of the biomass burning material, will allow for detailed model validation studies.
This paper is organized as follows: data analysis and product information are provided in Sect. 2. In Sect. 3 (observations), we begin with an overview of the fire situation in western Canada in August 2017 and the transport of smoke across the Atlantic towards Europe based on Moderate Resolution Imaging Spectroradiometer (MODIS) and Ozone Monitoring Instrument (OMI) measurements. Next, the lidar observations performed from 21 to 23 August 2017, (episode with maximum stratospheric pollution) are presented, and smoke observations at three lidar stations in central Europe (Leipzig, Hohenpeissenberg near Munich, and Kosetice near Prague) are shown. Finally, Aerosol Robotic Network (AERONET) observations in central Europe and MODIS AOT values around the Leipzig EARLINET/AERONET station are used to complement the documentation of the extraordinarily strong wildfire smoke event.
2.1 Lidar data analysis
Three Polly (Portable lidar system) type (Althausen et al., 2009; Engelmann et al., 2016; Baars et al., 2016) aerosol lidars were run at the following locations: the Leipzig EARLINET station (51.3∘ N, 12.4∘ E, 110 m a.s.l., Leibniz Institute for Tropospheric Research, TROPOS); the Hohenpeissenberg EARLINET station (47.8∘ N, 11.0∘ E, 1000 m a.s.l., Meteorological Observatory Hohenpeissenberg, German Weather Service), about 60 km southwest of Munich; and at Kosetice (49.6∘ N, 15.1∘ E, 500 m a.s.l.), Czech Republic. A triple-wavelength Polly was operated by TROPOS at Kosetice, 75 km southeast of Prague and about 275 km southeast of Leipzig, for three months in the framework of an aerosol field campaign spanning from July to October 2017. During the smoke event northwesterly winds prevailed in the stratosphere and the air masses crossed Leipzig about 3–4 h before reaching Kosetice.
The so-called Fernald method (Fernald, 1984) was used to derive height profiles of the particle extinction coefficient from the lidar observations at daytime. The reference height was set to around 10–11 km (tropopause region). The particle extinction-to-backscatter ratio (lidar ratio) is needed as input. We used a value of 70 sr for 532 nm. This lidar ratio of 70 sr was measured with our Raman lidars after sunset on 22 August 2017 (Haarig et al., 2018). The uncertainty of the extinction profile obtained is almost directly dependent on the lidar ratio uncertainty. Thus, a 15 % uncertainty in the lidar ratio input parameter (assuming variations of 10 sr around 70 sr) leads to a relative uncertainty of about 15 % in the smoke extinction values.
To reduce the influence of signal noise the signal profiles have to be smoothed. We used vertical gliding averaging window lengths of 185 m in the boundary layer (up to 2.5 km height) and 750 m above the boundary layer (up to 17 km height). The sensitivity tests with different smoothing lengths of 175, 350, and 750 m in the free troposphere revealed that the main layering features are well resolved using the comparably large vertical window length of 750 m. The large smoothing length was necessary because the densest smoke layers crossed the lidar at Leipzig during the noon hours when the signal noise due to sunlight was the highest.
Temperature and pressure profiles are required in the lidar data analysis to correct for Rayleigh extinction and backscattering. This information is taken from the GDAS (Global Data Assimilation System) database which contains profiles of temperature and pressure from the National Weather Service's National Centers for Environmental Prediction (NCEP) (GDAS, 2018) with a horizontal resolution of 1∘. We ignore a minor ozone absorption effect at 532 and 607 nm in the determination of the smoke extinction coefficient which results in an additional uncertainty of a few percent. As an alternative to the GDAS profiles, we selected nearby radiosonde temperature and pressure profiles (Munich, Prague, Lindenberg) in the extinction profile retrieval to check the impact of potential temperature and pressure uncertainties on the results. We found rather small deviations between the different particle extinction profiles (of <3 %) for 22 August 2017. However, one should emphasize that the GDAS data set is based on all available radiosonde observations (in central Europe). The radiosonde profiles are assimilated into the atmospheric model so that the GDAS data (providing temperature and pressure profiles every 3 h for distances generally 20–30 km from the lidar stations) are more representative of the actual meteorological conditions over the lidar sites than the few radiosonde profiles providing the meteorological state for regions; these radiosonde profiles are typically 60–180 km from the lidar site and are for fixed times (usually for 00:00 and 12:00 UTC), which results in a coarse temporal resolution.
In Sect. 3, we also show height–time displays of the volume linear depolarization ratio. This quantity is defined as the ratio of the cross-polarized to the co-polarized backscatter coefficient. “Co” and “cross” denote the planes of polarization (for which the receiver channels are sensitive) parallel and orthogonal to the plane of linear polarization of the transmitted laser pulses, respectively. The volume linear depolarization ratio is easily obtained from the lidar raw signals and enables us to identify non-spherical particles such as ice crystals and irregularly shaped smoke particles. The depolarization ratio is comparably high when the particles are non-spherical and very low (almost zero) if the particles are spherical (sulfuric acid droplets, soot particles with a liquid shell).
2.2 AERONET products
The EARLINET stations at Leipzig and Hohenpeissenberg are collocated with an Aerosol Robotic Network site (Holben et al., 1998). For a comparison of the Kosetice lidar observations with respective AERONET measurements we used the data collected at the AERONET Brno site, which is 115 km southeast of Kosetice (downwind of the lidar site at a height of 14–16 km from 21–22 August 2018). The AERONET sun/sky photometer measures AOT at eight wavelengths from 339 to 1638 nm (AERONET, 2018). Sky radiance observations at four wavelengths complete the AERONET observations. From the spectral AOT distribution for the wavelength range from 440 to 870 nm the wavelength dependence of AOT expressed in terms of the Ångström exponent AE is obtained. Furthermore, the 500 nm fine-mode fraction FMF (fraction of 500 nm fine-mode AOT to total AOT), and particle size distribution for the entire vertical column is derived (O'Neill et al., 2003; Dubovik et al., 2006). Fine-mode particles have, per definition, a diameter of ≤1 µm.
2.3 Satellite-derived products: MODIS and OMI retrievals
Next, we analyzed the spatial and temporal pattern of the MODIS AOT, the MODIS-derived fire radiative power (FRP), and the Ozone Monitoring Instrument (OMI) aerosol index (AI, 354 nm) observed over the area that covers western Canada and extends to Europe in August 2017. MODIS AOT values (at 550 nm) were generated using the GES-DISC Interactive Online Visualization and Analysis Infrastructure (GIOVANNI) developed by the National Aeronautics and Space Administration (NASA) Goddard Earth Sciences (GES) Data and Information Services Center (DISC) (Acker and Leptoukh, 2007; Berrick et al., 2009). GIOVANNI provides Level 3 (e.g., 1∘ spatial resolution pixel size) product that is aggregated and averaged from the Level 2 product (e.g., 0.1∘ resolution pixel size).
The OMI AI values for the entire August 2017 period were also produced with GIOVANNI. Positive values of AI are associated with UV absorbing aerosols, mainly mineral dust, smoke, and volcanic aerosols. Negative values of AI are associated with non-absorbing aerosols (for example sulfate and sea-salt particles) from both natural and anthropogenic sources (Torres et al., 1998; Buchard et al., 2015; Hammer et al., 2016). Values near zero indicate cloud fields.
The FRP product enables the distinction between fires of different strengths at a 1 km resolution using the Terra and Aqua satellites (Ichoku et al., 2008). Instantaneous FRP values range between 0.02 and 1866 MW per 1 km×1 km pixel, with global daily means ranging between 20 and 40 MW (Ichoku et al., 2008). As recently shown by Freeborn et al. (2014), MODIS FRP have an uncertainty of 26.6 % at the 1σ level. We used active fire products from the MODIS (MCD14DL) product in shapefile formats (https://earthdata.nasa.gov/earth-observation-data/near-real-time/firms/active-fire-data, last access: 10 July 2018). Only high quality FRP values above 50 MW (and exceeding accuracy levels of >65 %) were mapped.
Finally, we used 550 nm AOT images for the Leipzig region for 22 August 2017, obtained with the MODIS combined DT (dark target) and DB (deep blue) algorithms (Remer et al., 2013). The most recently released MODIS Collection 6 product MOD04_3K (for Terra) and MYD04_3K (for Aqua) contains AOT at a 3 km horizontal resolution in addition to the L2 10 km product (Remer et al., 2013; Levy et al., 2015). The retrieval algorithm of the higher resolution product is similar to that of the 10 km standard product with several exceptions (for more details, see https://modis-atmos.gsfc.nasa.gov/MOD04_L2, last access: 10 July 2018). Validation against a surface sun photometer shows that two-thirds of the 3 km retrievals fall within the expected error on a regional comparison but with a high bias of 0.06, especially over urban surfaces. The uncertainty in the retrieved AOT is AOT for AOT ≤1.0 (Levy et al., 2010, 2013). In this study, we use the MODIS Collection 6 (C006) AOT retrievals at 3 km×3 km (at nadir) spatial resolution collected with Terra (10:30 local equatorial crossing time) and Aqua (13:30 local equatorial crossing time) over Leipzig on 22 August 2017 (MODIS, 2018). In addition, we also used a Sentinel-2 multi-spectral instrument (MSI) RGB (red green blue) image collected on 22 August to get the cloud cover and ground conditions over Leipzig.
3.1 Overview: the smoke situation in August 2017 as seen with MODIS and OMI
Figure 1 shows the distribution of fire clusters throughout Canada in August 2017 together with the maps of the 354 nm aerosol index (OMI) and 550 nm AOT (MODIS) for the main corridor of smoke transport across the North Atlantic towards Europe. The number of fire pixels with FRP >50 MW (for 1 km×1 km pixels) was of the order of 10 000 in August 2017. The fire activity was highest in British Columbia.
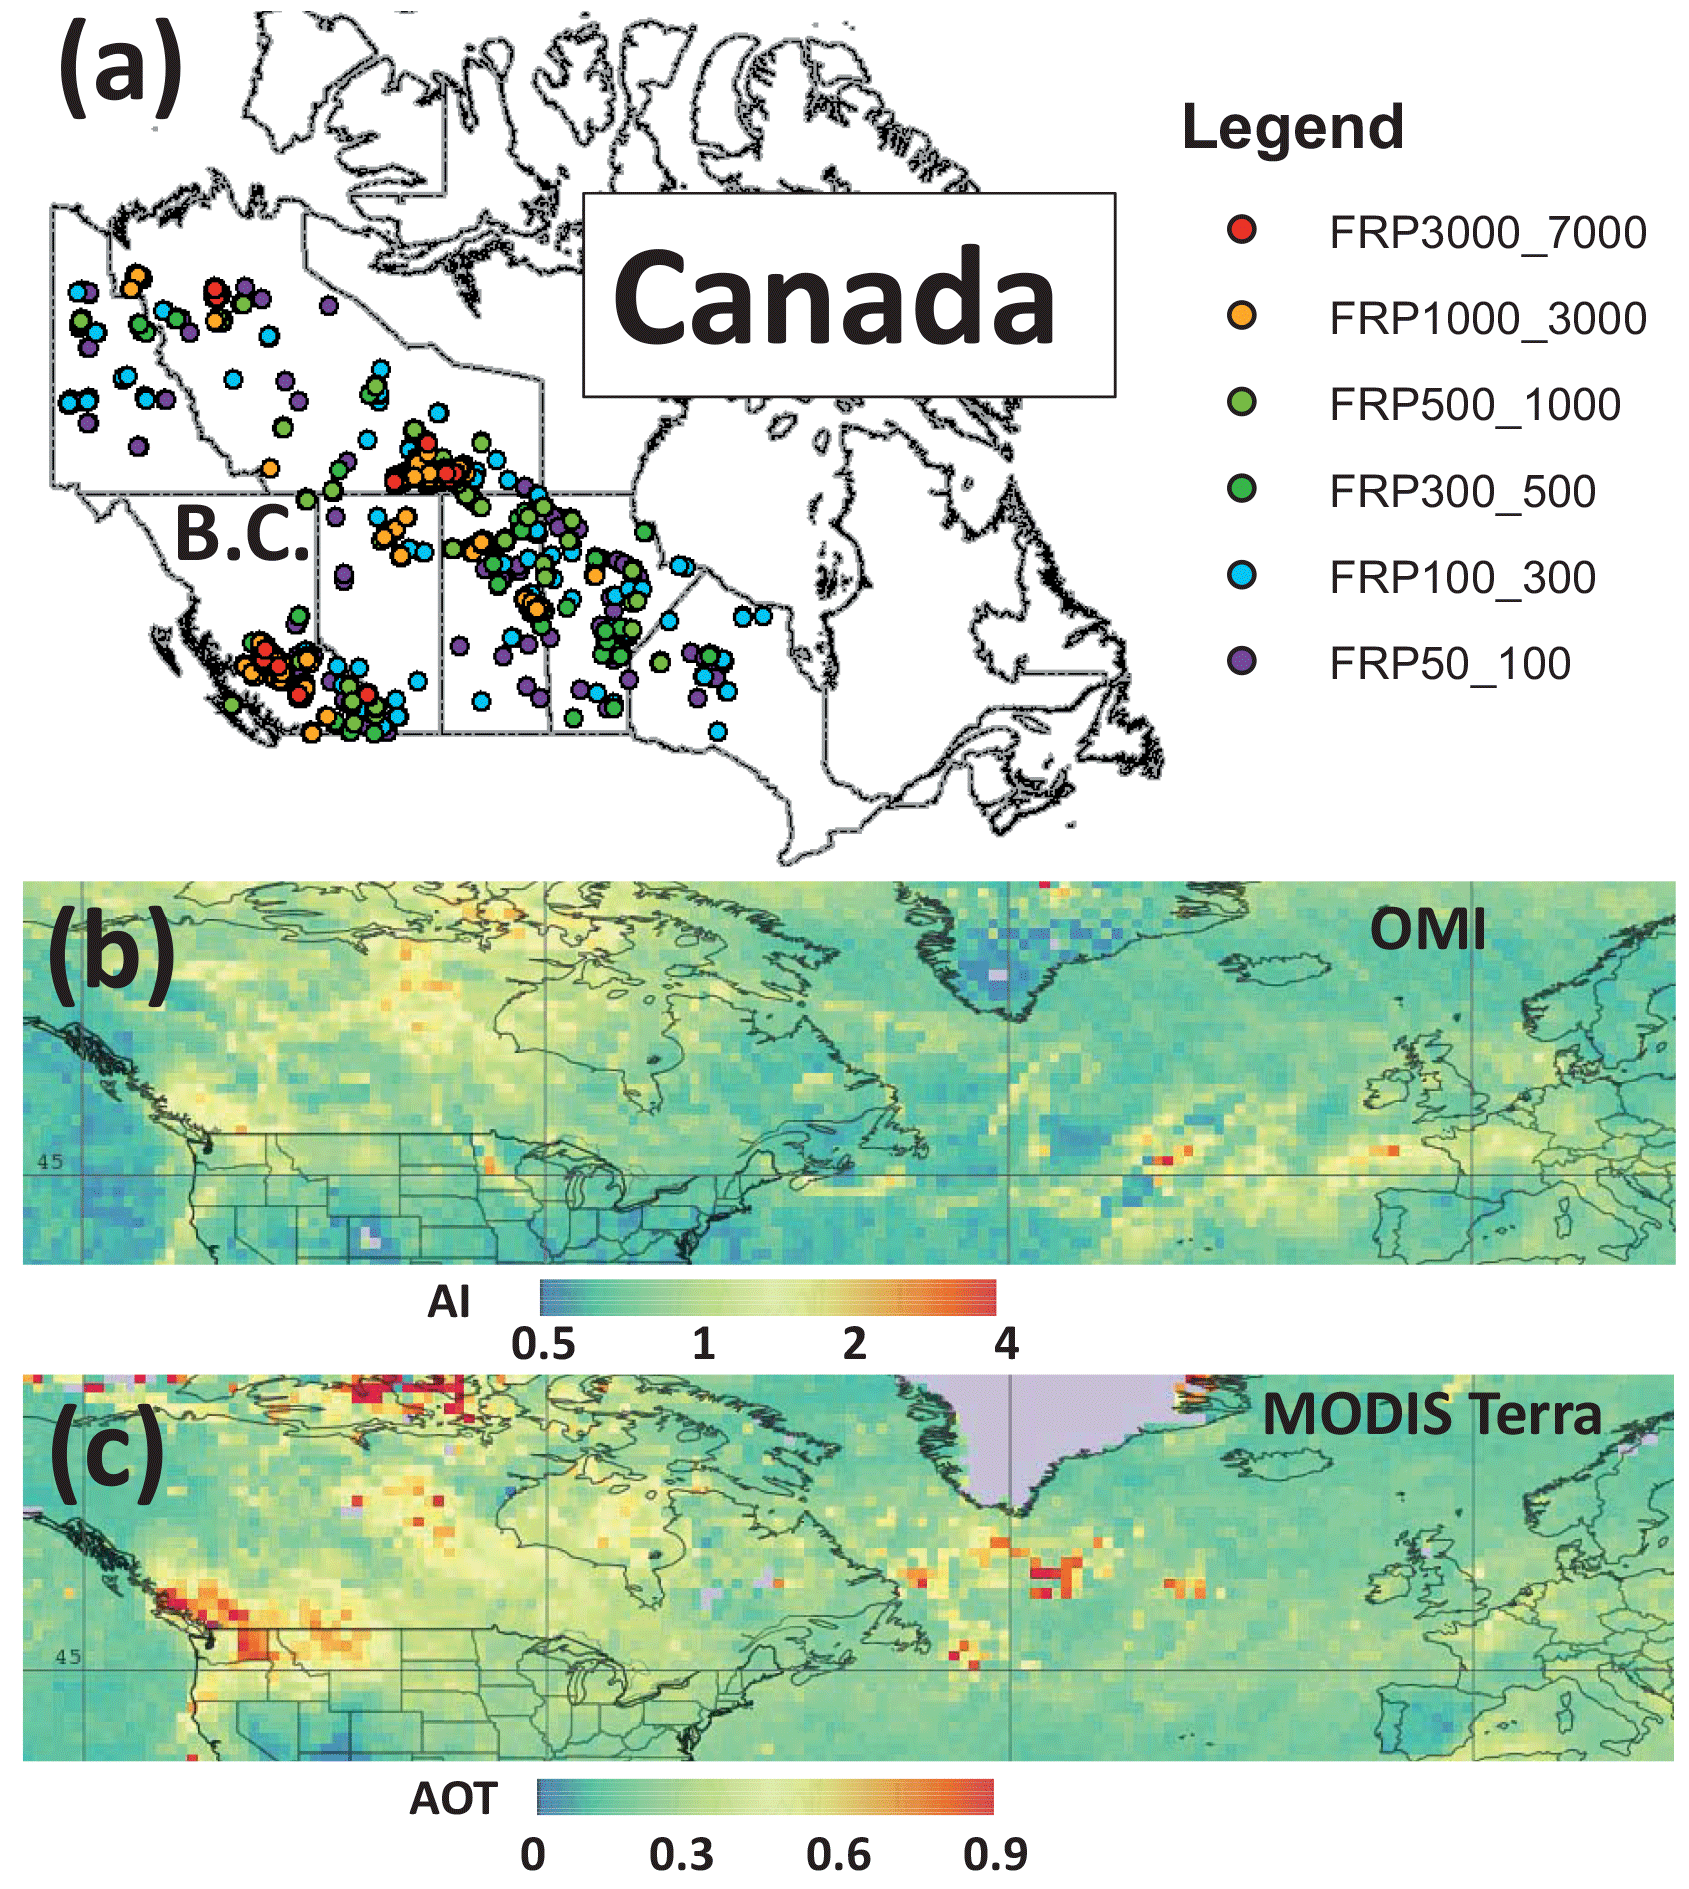
Figure 1(a) Fires detected with MODIS aboard the Terra and Aqua satellites over Canada in the period from 1 to 31 August 2017. The six color-coded classes of FRP (numbers define the range of values in MW) indicate different fire strengths (intensity of biomass burning). Intense wildfires accumulated in the southern part of British Columbia (B.C.). (b) August 2017 mean AI (aerosol index, OMI) at 354 nm, and (c) August 2017 mean 550 nm AOT (MODIS) (Acker and Leptoukh, 2007).
Figure 1b and c show enhanced values of OMI 354 nm AI and MODIS 550 nm AOT (August 2017 mean values) over the entire region from western Canada to Europe. The spatial features of fire clusters over western Canada match the elevated AOT and AI values over this region. Furthermore, as also evident from Fig. 1, both satellite systems (MODIS, OMI) independently show similar results (a similar pattern) in terms of AI and AOT. The smoke which crossed central Europe on 21–22 August 2017, originated from the westernmost part of Canada. The source identification aspect is discussed in more detail in Sect. 3.3.
Note that the AOT shown is composed of contributions from aerosol particles in the planetary boundary layer (PBL, about 0.05 over the Atlantic and 0.1–0.3 over the continents), from smoke and anthropogenic haze in the free troposphere (FT, about 0.05–0.25), and from the smoke particles in the stratosphere (S). Thus, tropospheric 550 nm AOT ranges from about 0.05 to 0.5 which makes the interpretation of the satellite-based AOT and AI maps concerning the stratospheric aerosol load difficult. The August 2017 mean anthropogenic and marine AOT contribution may have been of the order of 0.1–0.3 at 550 nm. Therefore, smoke dominated the AOT pattern in August 2017, and the AOT values frequently exceeded 0.5.
High AI values are a clear sign of the presence of absorbing wildfire smoke particles. AI frequently exceeded 1.0 during the study period and indicated a strongly absorbing aerosol. The impact of anthropogenic haze and marine particles on the absorption of radiation at 354 nm is comparably low. AI typically ranges from −0.5 to 0.2 over North America and Europe in the absence of biomass burning (Hammer et al., 2018).
3.2 The 21–23 August 2017 smoke event over central Europe
Figure 2 shows the aerosol layering over Kosetice, Czech Republic, from 20 to 23 August 2017. Coherent smoke structures were observed in the troposphere as well as in the stratosphere over more than one day. Unfortunately, clouds at a height between 1 and 4 km disturbed aerosol and cloud profiling considerably during the daytime periods. The tropopause height (indicated by white lines in Fig. 2) was primarily between 10 and 11.5 km from 20 to 23 August. The extreme event with particle extinction coefficients (mostly from 250 to 500 Mm−1) in the lower stratospheric layer lasted from 21 August, 15:00 UTC until 23 August, 05:00 UTC. At the beginning of the event, the 2 km thick smoke layer was detected at a height of 12 km, and at the end of the event the smoke layer was observed at a height of 15–16 km. Particle extinction coefficients in the free troposphere (between a height of 2 and 7 km) were about 20–50 Mm−1 from 21 to 23 August, as we will discuss in more detail in Sect. 3.4.
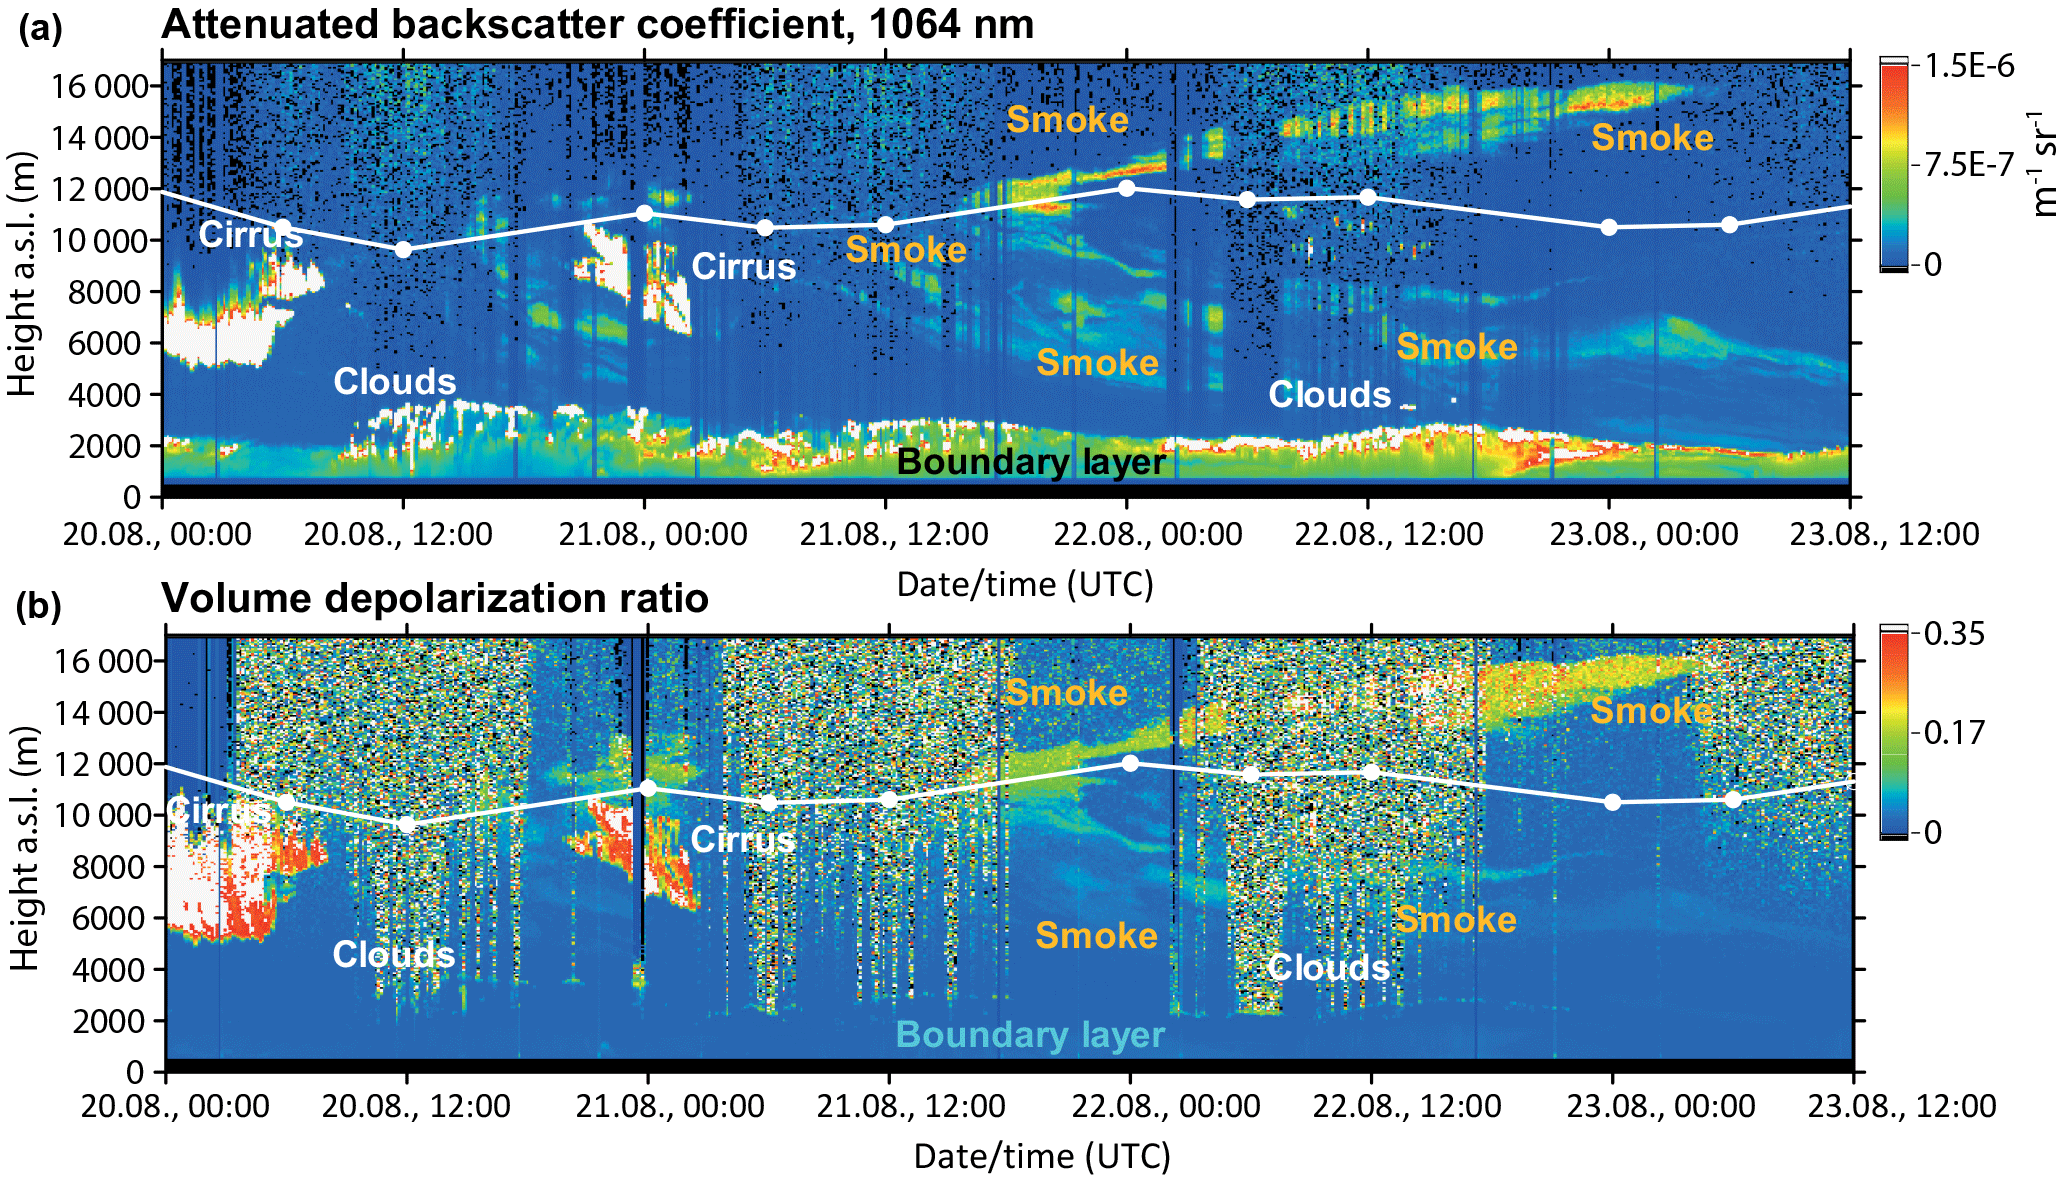
Figure 2Canadian wildfire smoke layers in the troposphere and stratosphere over Kosetice, Czech Republic, observed with lidar from 20 to 23 August 2017. The uncalibrated attenuated backscatter coefficient (range-corrected signal) at 1064 nm (a) and the volume linear depolarization ratio at 532 nm (b) are shown as a function of height above sea level (a.s.l.). Particle extinction coefficients at 532 nm ranged from 250 to 500 Mm−1 in the stratospheric layer at a height of 12 to 16 km (21 August, 21:00 UTC to 23 August, 05:00 UTC). The tropopause height according to the Prague radiosonde, launched daily at 00:00, 06:00, and 12:00 UTC (see full circles), is given by white lines.
The apparently ascending stratospheric soot layer (observed from 21 to 23 August) is the results of two different influences. Khaykin et al. (2018) found that the smoke plumes ascended rapidly over the first few days following their injection into the upper troposphere with a rate of 2–3 km per day. This cross isentropic ascent was caused by radiative heating of smoke aerosols (Boers et al., 2010). The second aspect is that the wind velocity decreases with height from the tropopause to an altitude of 16 km (GDAS, 2018) as well as from the tropopause to the middle troposphere (5 km height). Because of the higher wind velocities in the tropopause region first smoke layers arrived over Kosetice at 12 km height. The plumes in the middle troposphere and in the stratosphere at a height of 15–16 km arrived one day later. According to the Prague radiosonde launched on 22 August, 12:00 UTC and 23 August 2017, 00:00 UTC, wind speeds were of the order of 50 m s−1 at tropopause levels and about 15–20 m s−1 at an altitude of 15–16 km.
The volume linear depolarization ratio, shown in Fig. 2 (bottom), contains information on particle shape. The depolarization ratio is highest in the cirrus clouds (consisting of strongly light-depolarizing hexagonal ice crystals) and is also significantly enhanced in the stratospheric smoke layer caused by irregularly shaped and most probably dry and non-coated soot particles. Observations (including photographs) of stratospheric smoke particles indicate that stratospheric soot particles can be rather irregular in shape (Strawa et al., 1999). The 532 nm volume linear depolarization ratio was mostly between 0.1 and 0.2 at heights from 12 to 16 km. The relationship between particle shape and particle linear depolarization ratio is discussed in Haarig et al. (2018).
In contrast to stratospheric particles, tropospheric smoke particles are almost spherical which means that the volume depolarization ratio is significantly <0.1. Chemical processing and interaction with particles and trace gases in the troposphere lead to changes in the shape properties of the fire smoke particles. They are partly coated, embedded, or partially encapsulated after long-range transport (China et al., 2015). Smoke particles with a solid soot kernel and a spherical (liquid) sulfuric acid shell (Dahlkötter et al., 2014) would cause a depolarization ratio close to zero.
3.3 Identification of the smoke source regions
The HYSPLIT backward trajectories (Stein et al., 2015; Rolph et al., 2017; HYSPLIT, 2018) in Fig. 3 provide an impression of the upper tropospheric air flow between North America and central Europe during the 10 days from 12 to 21 August 2017. According to the backward trajectories, the smoke traveled for about 7–10 days from western Canada to central Europe. This is in good agreement with the travel time derived from the spaceborne CALIPSO lidar observation presented by Khaykin et al. (2018).
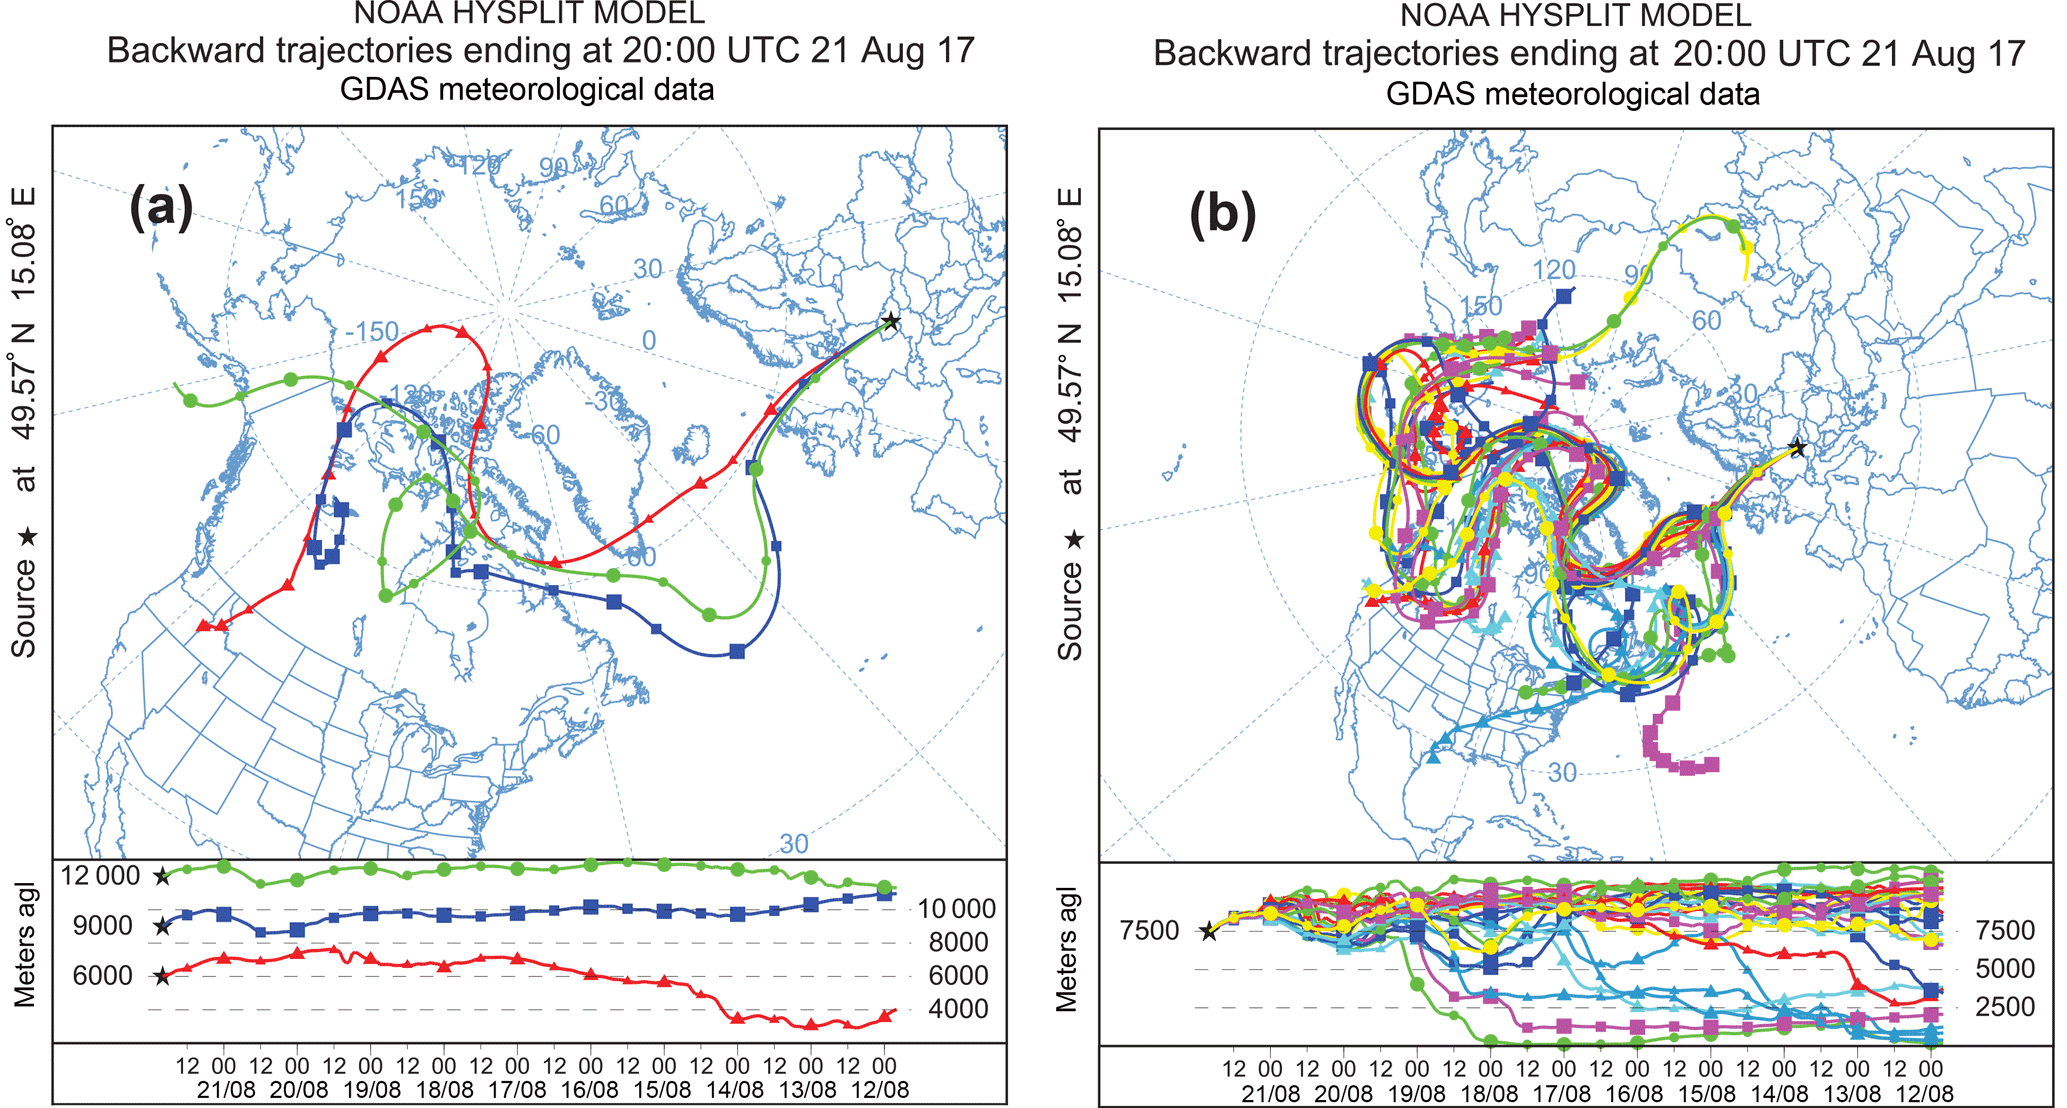
Figure 3Ten-day backward trajectories (Stein et al., 2015; HYSPLIT, 2018) arriving at Kosetice, Czech Republic, on 21 August 2017, 20:00 UTC at heights of (a) 6 km (red), 9 km (blue), and 12 km (green) above ground level, and (b) an ensemble of trajectories for the arrival height of 7.5 km. The trajectories show that the smoke source region is the North American continent.
To identify the source regions of the wildfire smoke observed over Europe we inspected HYSPLIT forward trajectories starting over a fire region in western Canada. We combined the analysis of forward trajectories with daily maps of OMI AI, MODIS 550 nm AOT, and the UV aerosol index (UVAI) obtained from observations with the spaceborne OPMS (Ozone Mapping and Profiler Suite) as presented in the Supporting Information S2 of Khaykin et al. (2018). Our study was guided by the fact that a rather strong pyrocumulonimbus complex (generated from five thunderstorms) developed over the fire areas in southern-central British Columbia (see B.C. region in Fig. 1) and the northwestern United States on the afternoon of 12 August 2017, and lasted about 5 hours. It was the biggest pyrocumulonimbus event ever observed, the most significant fire-driven thunderstorm event in history (personal communication, David Peterson, U.S. Naval Research Laboratory, Monterey, California, April 2017). This event obviously triggered the formation of an optically thick smoke layer (probably with an AOT of > 2–3) in the upper troposphere and lower stratosphere over British Columbia (see also Hu et al., 2018). According to the forward HYSPLIT trajectories started over southern-central British Columbia on the afternoon of 12 August 2017, between a height of 5 and 12 km these dense smoke plumes traveled northward over the next two days. This is in agreement with the UVAI maps (Khaykin et al., 2018) that show a large region with very high UVAI over northern Canada extending from about 65 to 75∘ N and 90 to 140∘ W on 14 August 2017 (early afternoon). As further shown in the day-by-day OMPS UVAI maps, the smoke fields then crossed Canada, the Atlantic, and split into at least two branches over the eastern Atlantic. One one of these branches crossed central Europe on 21–22 August 2017.
3.4 Vertical profiling of smoke
Figure 4 shows the height profiles of the particle extinction coefficient at 532 nm as measured over the three Polly lidar sites in southern and central-eastern Germany and the Czech Republic on 21–22 August 2017. The locations of the two EARLINET stations at Hohenpeissenberg and Leipzig, and the third station at Kostice are shown in Fig. 5. Maximum extinction coefficients reached 500 Mm−1 at all three stations. Values of the stratospheric AOT are given in Fig. 5. As mentioned in Sect. 2.1, the uncertainty in the particle extinction coefficients and AOT(s) values is almost directly proportional to the uncertainty in the lidar ratio assumption. We used a smoke lidar ratio of 70 r in the extinction coefficient retrieval (3–17 km height range) as measured with several Raman lidars at Leipzig on the evening of 22 August 2017, (Haarig et al., 2018) and also found over Hohenpeissenberg and Kosetice on the nights on 21–22 August and 22–23 August 2017, respectively. By assuming a realistic smoke lidar ratio from 60 to 80 sr for 532 nm, the uncertainty in the extinction profiles is of the order of 15 %.
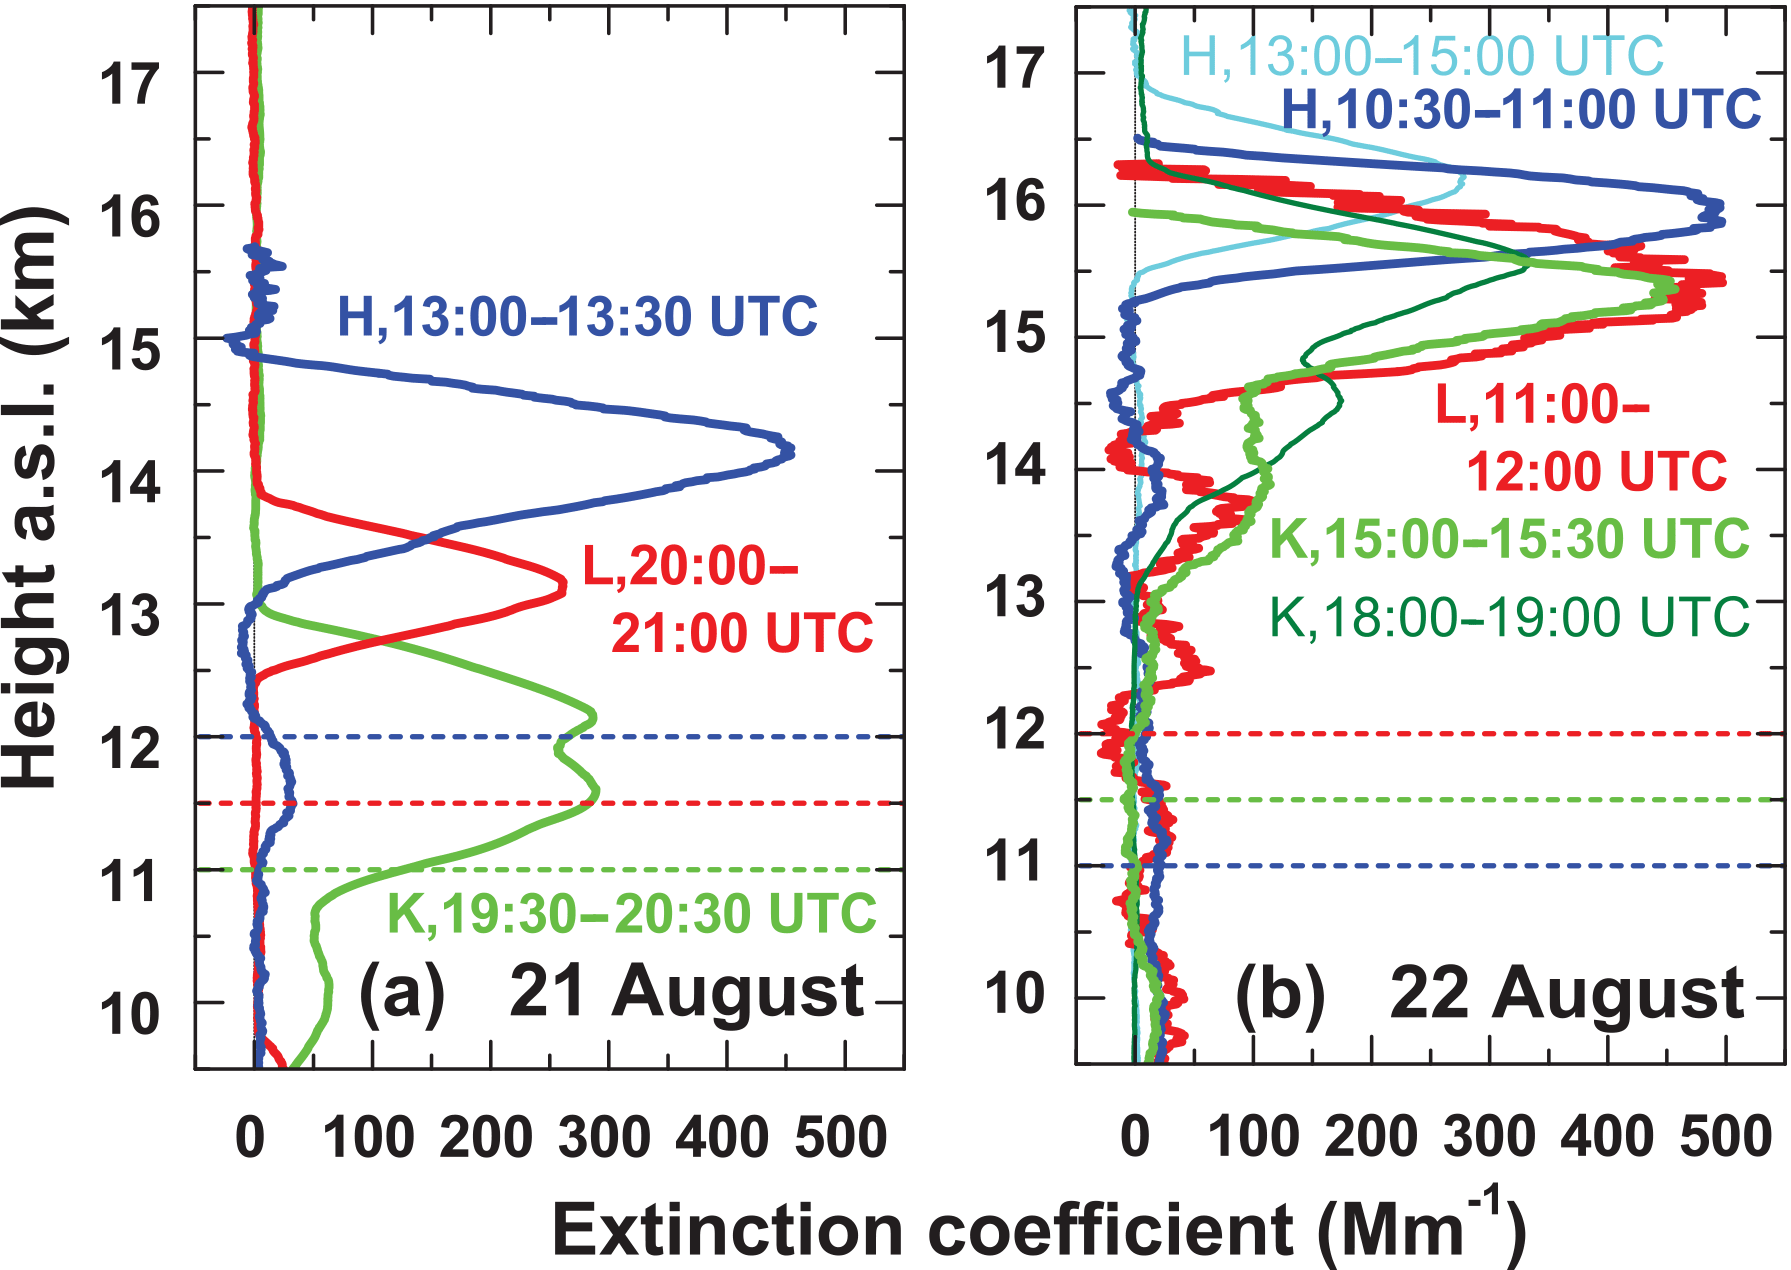
Figure 4Height profile of the particle extinction coefficient at 532 nm over Hohenpeissenberg (H), Leipzig (L), and Kosetice (K) on (a) 21 and (b) 22 August 2017. Time periods (in UTC) indicate signal averaging time periods. The Fernald method was applied to compute the extinction profiles. An input lidar ratio of 70 sr (in agreement with nighttime Raman lidar observations of the smoke lidar ratio) was used. The uncertainty in the stratospheric extinction coefficients is estimated to be 15 %. The horizontal dashed lines indicate the tropopause heights over the different lidar sites of Hohenpeissenberg (blue), Leipzig (red), and Kosetice (green) estimated from nearby radiosonde temperature and humidity profiles.
The record-breaking smoke event began over Hohenpeissenberg on 21 August (07:00 UTC) and ended on 22 August, 19:00 UTC; thus, it occurred 8–10 h earlier than over Kosetice and 3–5 h earlier than over Leipzig (upwind of Kosetice). On 21 August, when the first smoke layers arrived over central Europe, the layers were found close to the tropopause. One day later the layers crossed the lidar stations at much greater heights and accumulated in the height range from 14 to 17 km, 2 to 5 km above the local tropopause. These smoke layers traveled at a much lower wind speed than those at heights close to the tropopause observed one day earlier. The stratospheric 532 nm AOT in Fig. 5 ranged from 0.37 to 0.59 during the passage of the densest stratospheric smoke plumes on 21–22 August 2017.
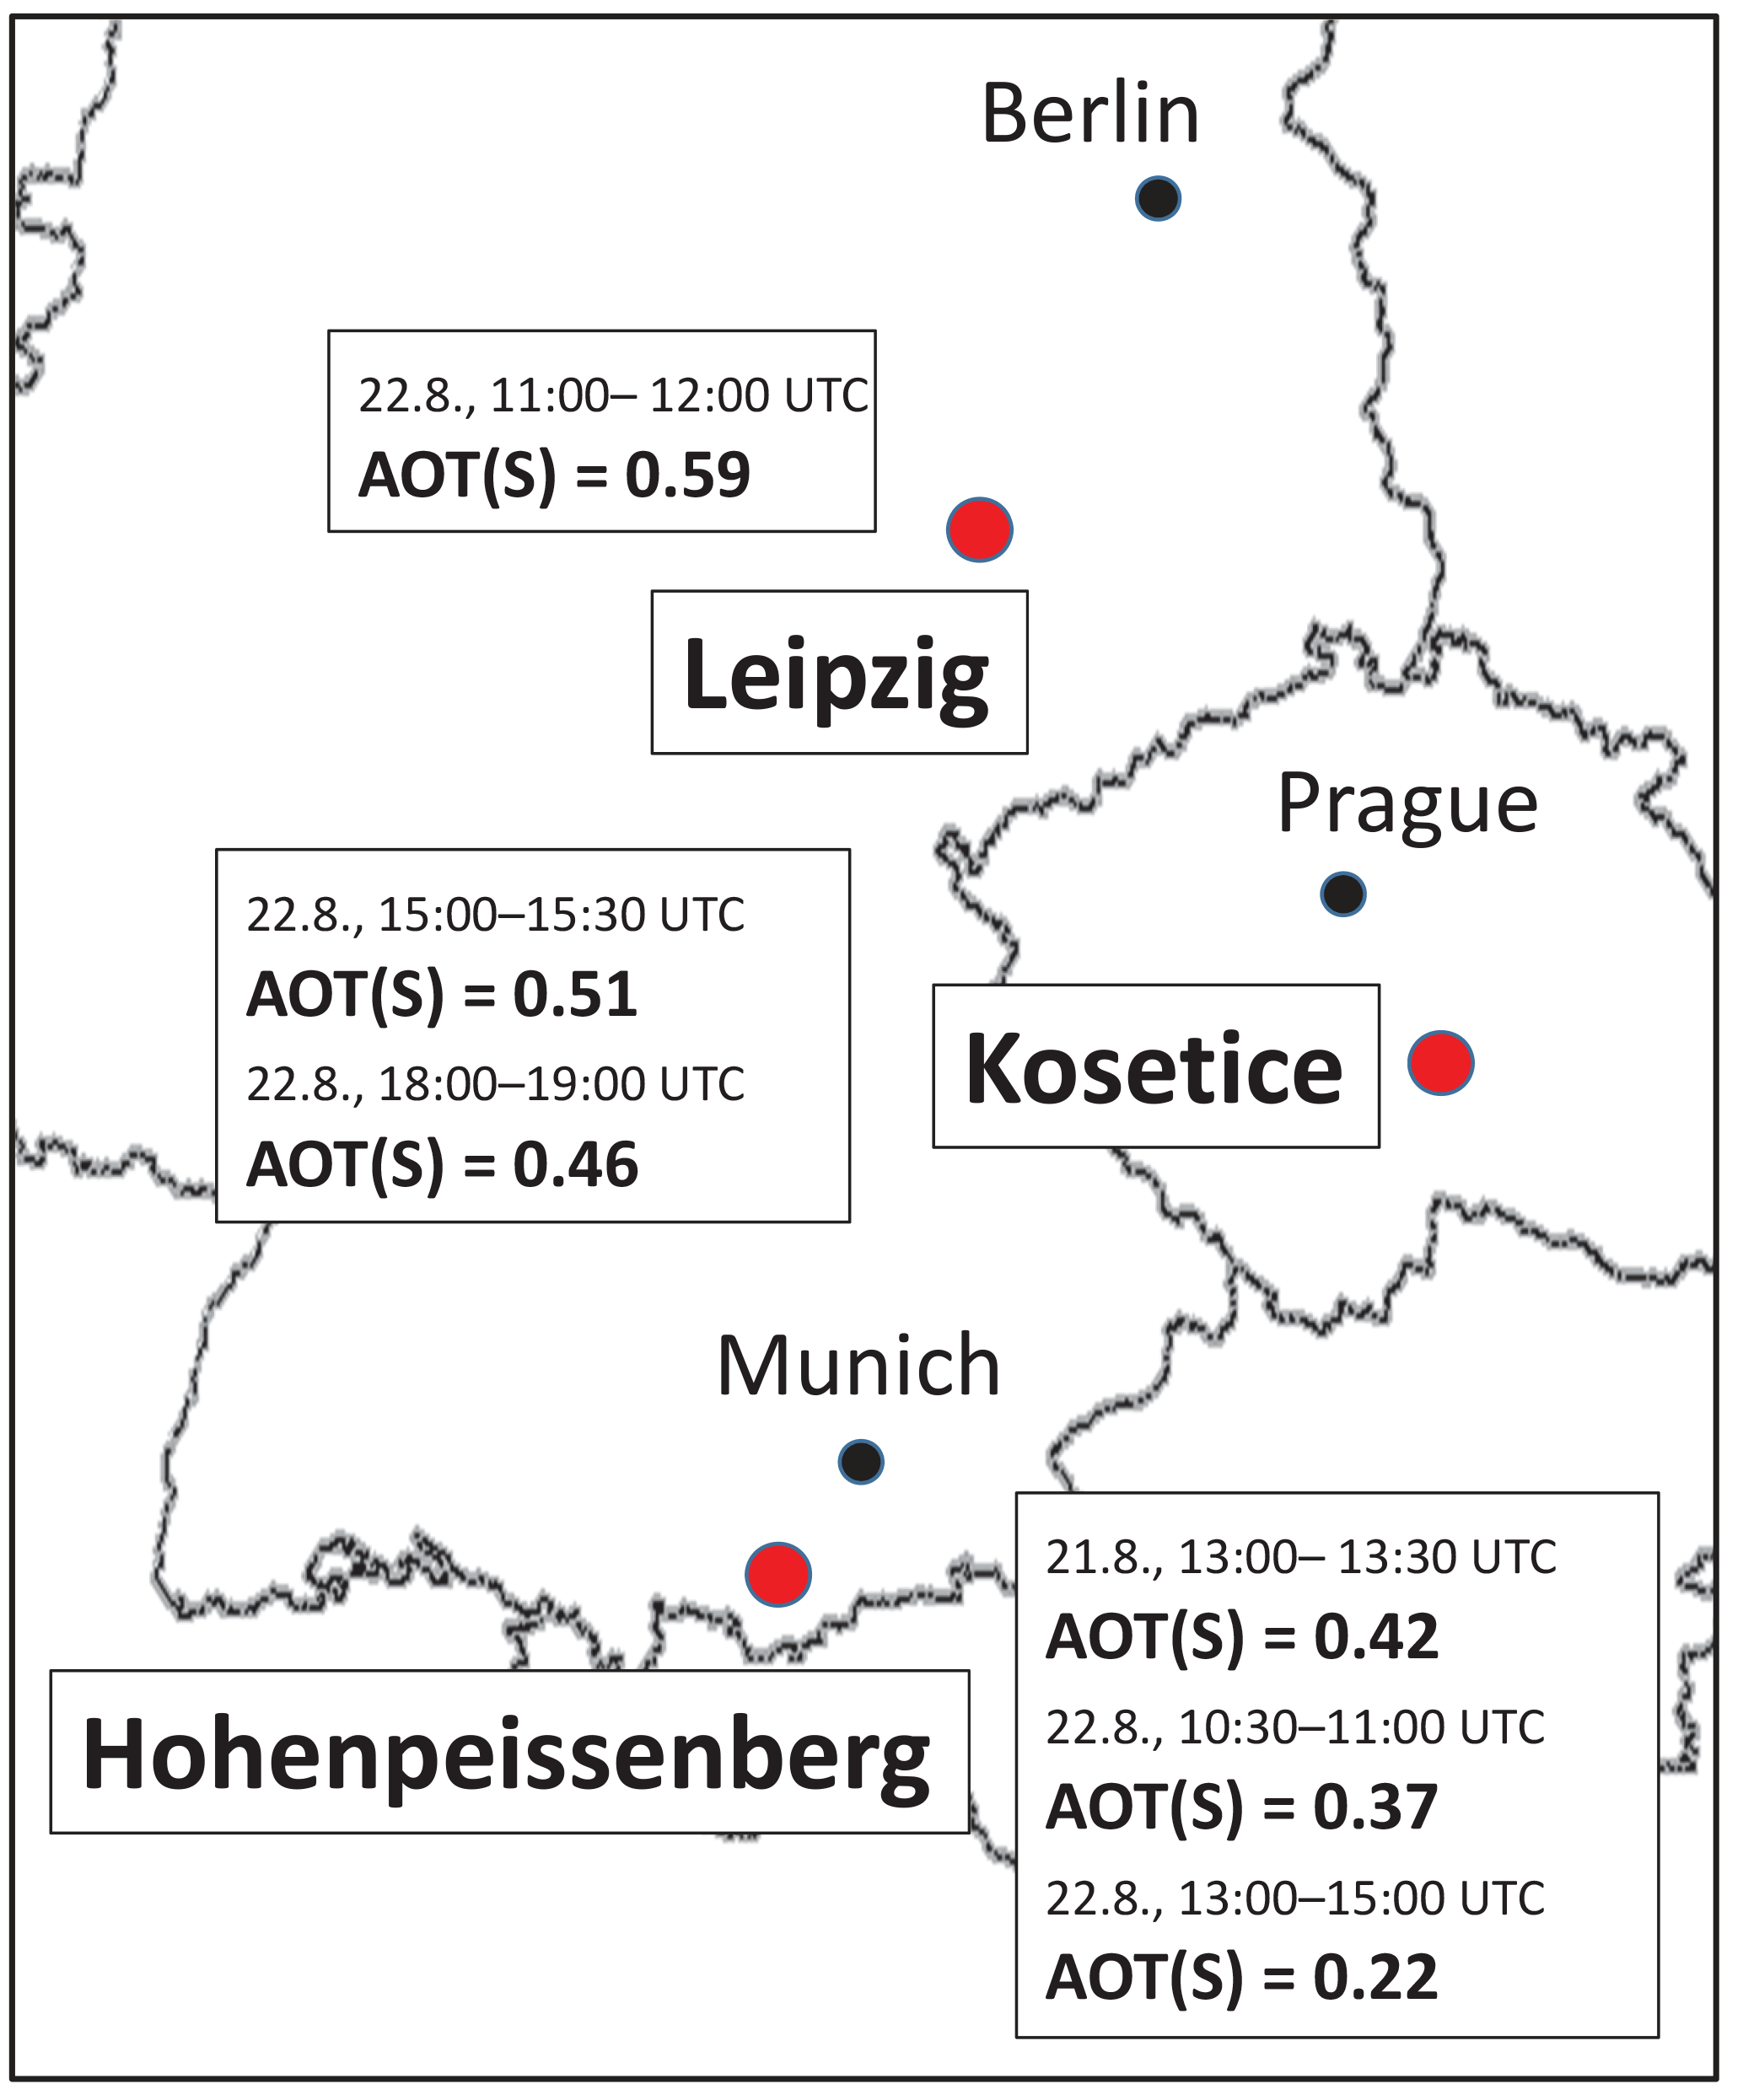
Figure 5Lidar stations (red circles) in Germany and the Czech Republic. AOT(S) denotes the AOT at 532 nm of the stratospheric smoke layer as observed on 21 August (21.8.) and 22 August (22.8.), 2017, for the indicated time periods in UTC.
Note that light-extinction coefficients of the order of 500 Mm−1 indicate a horizontal visibility of around 6 km at a height of 14–16 km. At these stratospheric heights the visibility is usually several hundreds of kilometers. Peak mass concentrations were of the order of 70–100 µg m−3 in the lower stratosphere over central Europe around noon on 22 August 2017 (Haarig et al., 2018). Particle extinction values close to 500 Mm−1 in combination with lidar ratios around 70 sr correspond to backscatter ratios (total-to-Rayleigh backscatter) of up to 25–30 at 532 nm at a height of 15 km. Khaykin et al. (2018) reported backscatter ratios around 10 (ground-based lidar) and almost 20 (CALIPSO lidar) for measurements over southern France in the second half of August and the first half of September 2017.
Figure 6 shows noon and evening lidar profiles for the entire atmosphere over Leipzig from the ground to a height of 18 km. At noon (11:00–12:00 UTC), the entire free troposphere contained traces of smoke. The 532 nm AOT was 0.3 in the free troposphere and about 0.6 in the stratosphere for the height range from the tropopause up to 16.2 km. The smoke-related AOT was significantly lower in the evening hours (blue curve) with a free tropospheric contribution of 0.08 and a stratospheric contribution of 0.2–0.25. The evening measurements at Leipzig (22 August, 20:40–23:00 UTC) with three polarization/Raman lidars are presented and discussed in Haarig et al. (2018).
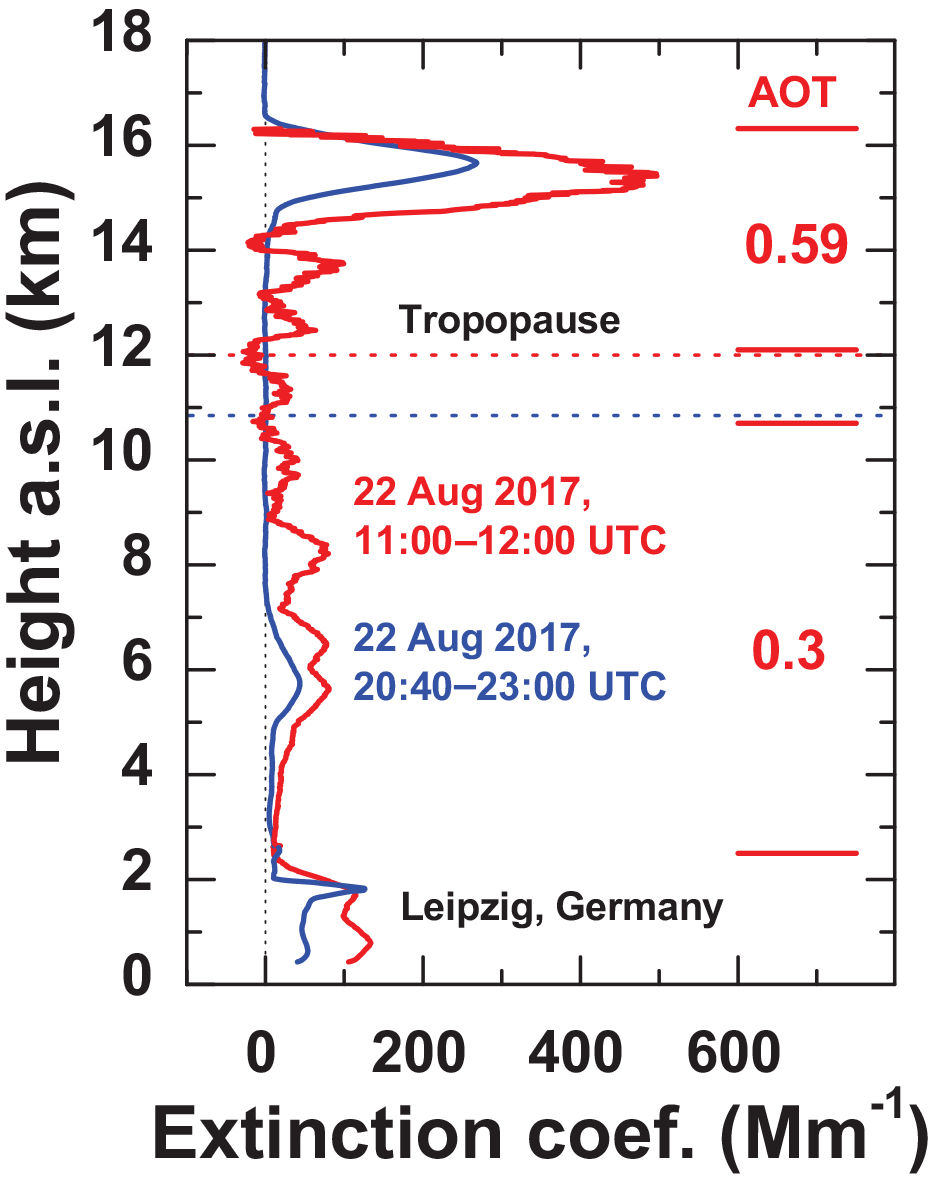
Figure 6The height profile of the particle extinction coefficient at 532 nm over Leipzig on 22 August 2017, measured with lidar close to noon (red profile), when the optically densest stratospheric smoke layers crossed the lidar site, and at nighttime (blue profile). The nighttime observations from three lidars will be discussed in detail in Haarig et al. (2018). The data analysis is the same as in Fig 4. The 532 nm AOTs for the free troposphere and lower stratosphere are given as numbers. Horizontal dashed lines indicate the tropopause height around noon and around midnight on 22 August. The uncertainty in the extinction coefficients and AOT values is about 15 %.
The high stratospheric AOT of 0.59 over Leipzig is in good agreement with CALIPSO lidar measurements (Khaykin et al., 2018). The maximum AOT measured with the CALIPSO lidar was of the order of 1.0 at 532 nm. These values occurred over northeastern Canada from 17 to 19 August 2017, which was a few days upstream of central Europe. Khaykin et al. (2018) originally reported maximum AOTs of only 0.7; however, these values were directly estimated from the height profiles of the attenuated backscatter coefficients, and were not corrected for particle extinction influences (i.e., attenuation effects). If we take smoke extinction (according to an AOT of the order of 0.7–1.0) into account in the retrieval, the true profile of the particle backscatter coefficient multiplied by a smoke lidar ratio of 70 sr leads to an AOT about a factor of 1.5 higher than the one given by Khaykin et al. (2018); this equates to values of the order of 1.0.
3.5 AERONET observations at Leipzig
Figure 7 shows the Leipzig AERONET observations from 21 to 23 August 2017. Level 2.0 data are presented (AERONET, 2018). The lidar observations (diamonds in Fig. 7) conducted between 11:00 and 12:00 UTC are in good agreement with the extraordinarily high 500 nm AOT of 1.1 at 10:06 UTC. According to our lidar observations, cirrus clouds were absent during the noon hours of 22 August 2017, which means that the displayed AERONET smoke observations were not affected by any cloud occurrence.
As can be seen in Fig. 7, the 500 nm FMF increased from values below 0.7 in the early morning of 21 August to values close to 1 when the smoke layers arrived and dominated from noon on 21 August to the evening of 22 August. Accordingly, the total AOT was almost equal to the fine-mode AOT caused by anthropogenic haze in the PBL and the smoke in the free troposphere and stratosphere. The Ångström exponent (for the spectral range from 440 to 870 nm) was primarily between 1.1 and 1.4 which is indicative of the presence of a pronounced particle accumulation mode (particles with diameter mostly from 200 to 800 nm, see Haarig et al., 2018 for more details).
The boundary layer 500 nm AOT was around 0.1–0.15 on 21 and 23 August 2017, (before and after the smoke period) and about 0.15–0.2 on 22 August according to the lidar observations at Leipzig. Thus, the fire smoke layers caused a 532 nm AOT close to 1.0 over Leipzig during the noon hours of 22 August 2017.

Figure 7AERONET sun photometer observations at Leipzig (TROPOS) from 21 to 23 August 2017. 500 nm AOT (blue circles), Ångström exponents AE (green circles, for the 440–870 nm wavelength range), and AOT fine-mode fraction FMF (red triangles, for 500 nm AOT) are shown. Gaps in the time series are caused by cloud fields and nighttime hours. Dashed vertical lines indicate the lidar measurement periods around noon and at nighttime (Fig. 6). The lidar-derived 532 nm AOT (blue open diamonds) are also given. AOTs are obtained with an input lidar ratio of 50 sr (AOT of 0.8 on 22 August around noon) and 70 sr (AOT of 1.1 around noon and 0.42 in the night of 22 August). The horizontal line at 1.0 indicates that the FFM values were close to 1.0 during the passage of the smoke layers which meant that the AOT was almost entirely caused by light extinction by fine-mode particles. The overpass times of MODIS Terra and Aqua are indicated above the figure by two arrows. MODIS results are shown in Fig. 8.
During the 11:00–12:00 UTC period AERONET 500 nm AOT values ranged from 0.71 to 0.82 (mean values of 0.76), whereas the lidar-derived 1 h average 532 nm AOT was 1.1. A realistic lidar ratio of 70 sr was used in the lidar retrieval of the particle extinction profile. This lidar ratio was measured with Raman lidars at Leipzig after sunset on 22 August 2017. AERONET obviously considerably underestimated the AOT. In Table 2, we summarize several AERONET/lidar comparisons for the three lidar sites used in this study. In all cases, the AERONET 500 nm AOT was significantly lower than the lidar-derived 532 nm AOT. To identify the reason for the bias in Table 2 we provide information about the AOT contributions of the PBL, the free troposphere (FT), and the lower stratosphere (S). As can be seen, the AERONET AOT values are higher than the overall tropospheric AOT contribution. Thus, the underestimation of total AOT is probably linked to the occurrence of the unusual stratospheric smoke layer.
Table 2Comparison of AOT measured with lidar (at 532 nm) and the AERONET sun photometer (at 500 nm) on 21–22 August 2017. AERONET Level 1.0 (Brno), 1.5 (Hohenpeissenberg, 21 August) and 2.0 (Leipzig, and Hohenpeissenberg, 22 August) are used in the table. AOT contributions of the planetary boundary layer (PBL), the free troposphere (FT), and the stratosphere (S) are also separately listed. In the lidar retrieval, a lidar ratio of 60 sr (PBL) and 70 sr (FT, S) is used. Brno is 115 km southeast (1.5 h downwind at a height of 15 km on 22 August) of the Kosetice lidar site.
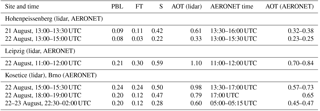
Strong forward scattering of sun light towards the sun photometer with a 1.2∘ full angle receiver FOV (Holben et al., 1998) seems to be the reason for the underestimation. If small-angle forward scattering is ignored in the AERONET data analysis, the derived (effective) AOT will be much lower than the true (single scattering related) AOT when the main aerosol layer (dominating the AOT) is more than 10 km from the sun photometer. According to Table 2, AERONET underestimated the AOT by about 30–50 %.
In contrast to photometers, lidars usually have a very narrow field of view of the order of 0.2–1 mrad (0.01–0.06∘ full angle) so that forward-scattered laser light does not affect the smoke AOT retrieval. As demonstrated by Wandinger et al. (2010), forward scattering effects only affect spaceborne lidar observations of light extinction in mineral dust layers containing large coarse dust particles, i.e., in cases with strong forward scattering of laser light and a lidar more than 500 km away from the dust layers.
It should be mentioned that small and mesoscale horizontal inhomogeneities in the tropospheric and stratospheric aerosol distributions may also have contributed to the discrepancies between the lidar and sun photometer results in Table 2. Furthermore, a perfect match of lidar and photometer measurement periods was often not possible due to cloud occurrence. In addition, Kostice is 115 km away from the Brno AERONET station which means that a direct comparison of the Kosetice lidar and Brno photometer observations is not very trustworthy. Finally, the selected smoke lidar ratio of 70 sr may have been too high in some cases of the lidar extinction retrieval. However, all of these influences should lead to statistical variations in the lidar–photometer AOT difference around zero, rather than to a clear bias as observed.
3.6 MODIS AOT observations over Leipzig
Finally, we analyzed MODIS data around Leipzig. The results are shown in Fig. 8. The MODIS 550 nm AOT values confirm the lidar observation. Many 550 nm AOT values were found above 1.0 during the overflight times (10:10 and 11:55 UTC). The cloud fields in Fig. 8a provide an impression of the cumulus cloud distribution on the morning of 22 August 2017, (10:10 local time) which hampered the AERONET observations and the MODIS retrieval efforts. Only a few AOT values for 3 km×3 km pixels could be retrieved from the MODIS observations. However, these few AOT values in Fig. 8a and b clearly point to AOT values of the order of 1.0 (and higher) at 550 nm in the Leipzig area.
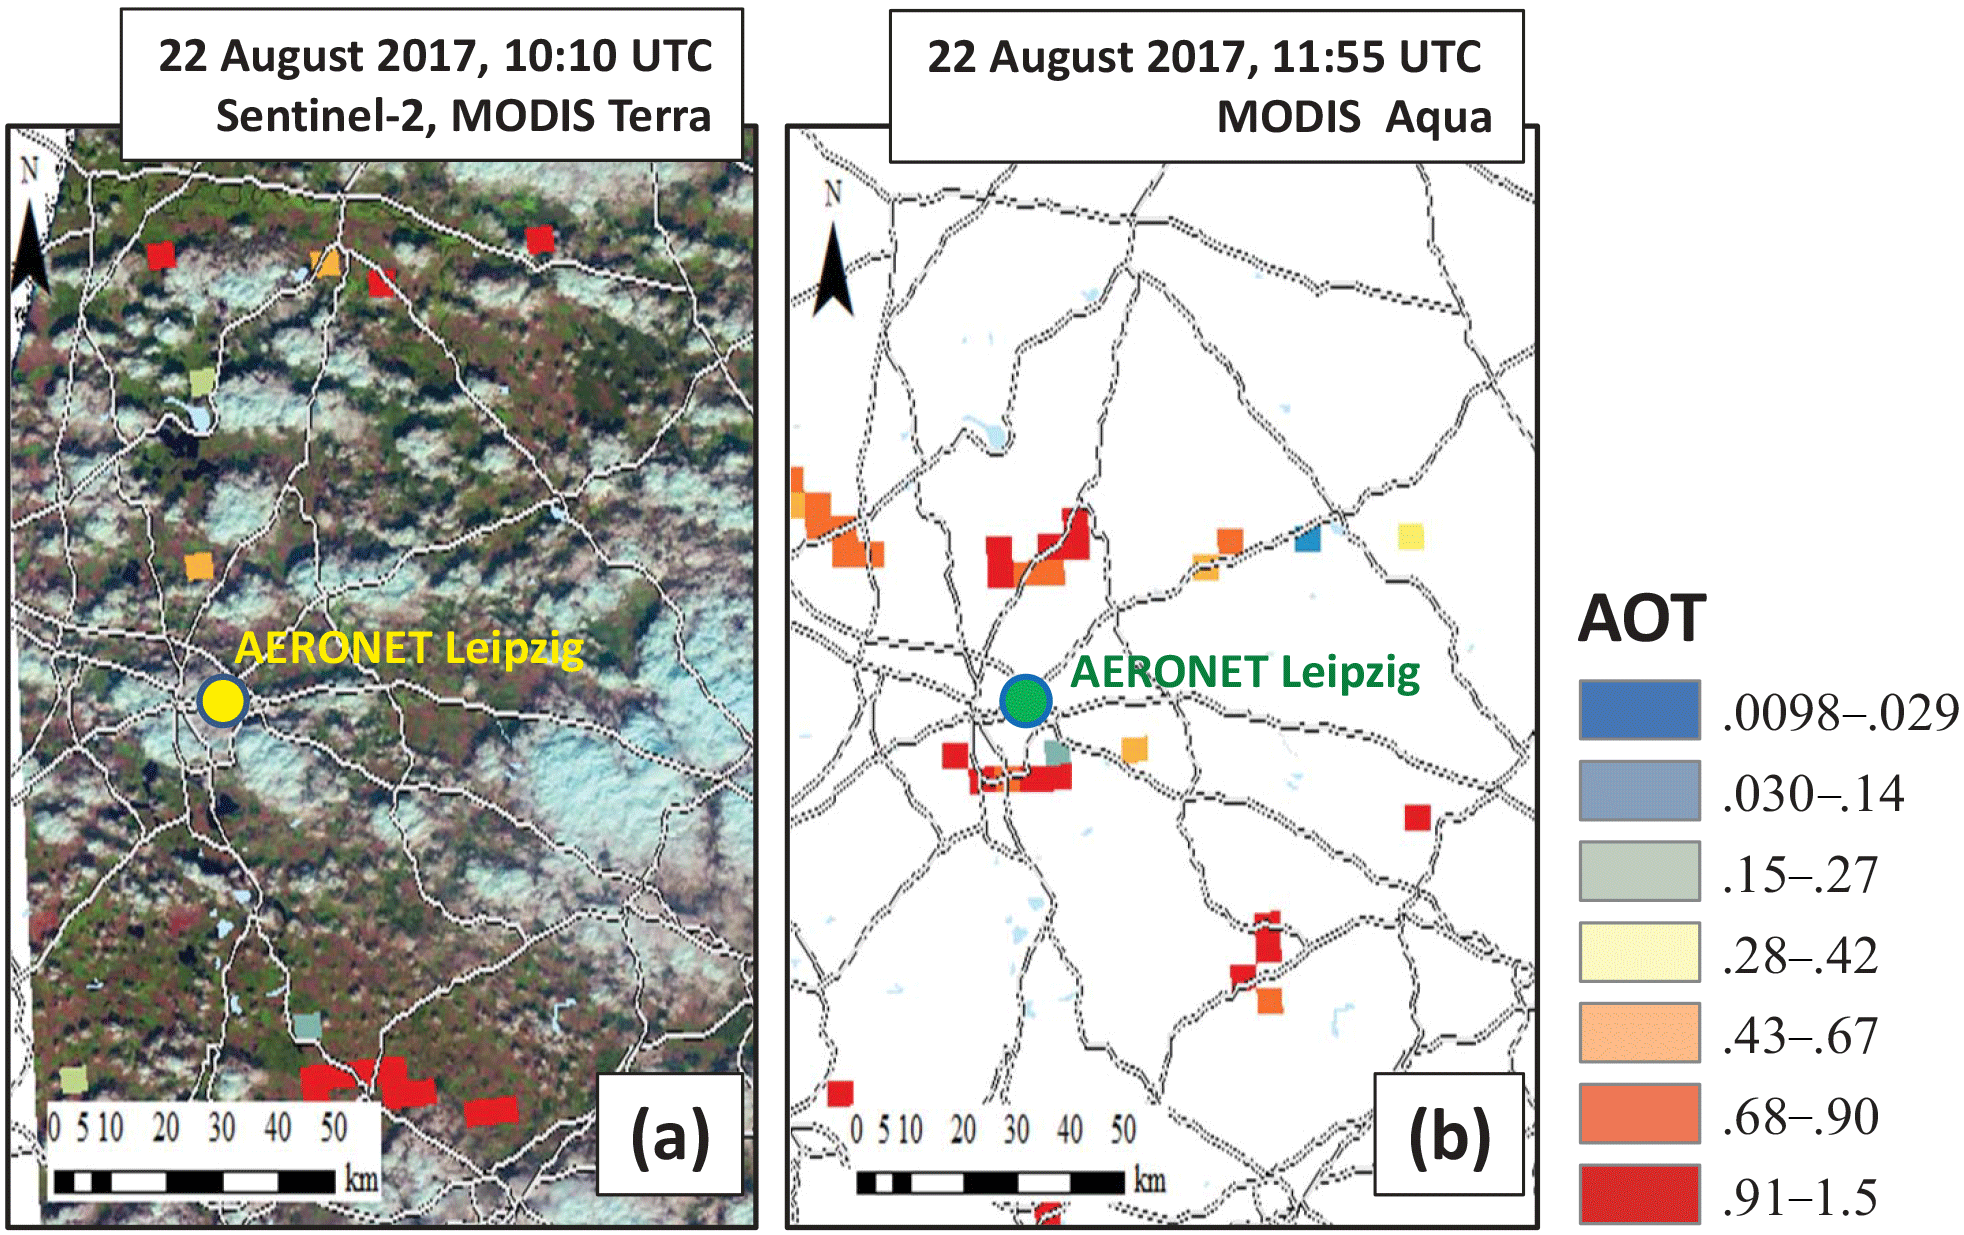
Figure 8(a) Sentinel-2 cumulus cloud fields (bluish-white) and integrated MODIS Terra color-scaled 550 nm AOT values for 3 km×3 km cloud-free areas (Leipzig, overpass at 10:10 UTC), and (b) respective MODIS Aqua 550 nm AOT retrievals (Leipzig, overpass at 11:55 UTC). The yellow (a) and green (b) circles indicate the AERONET Leipzig site. Many red squares (AOT of 0.9–1.5) were retrieved from the MODIS observations north and south of the AERONET station.
In Sect. 1, we introduced Table 1 to compare the influence of major and moderate volcanic eruptions and extreme and more common pyrocumulonimbus-related biomass burning events on the aerosol conditions in the lower stratosphere at northern midlatitudes. The goal was to highlight the tremendous contamination of the lower stratosphere with wildfire smoke over central Europe on 21–22 August 2017.
However, there is no doubt that major volcanic eruptions have by far the largest impact on weather and climate. After the Pinatubo eruption, the sulfuric-acid aerosol was distributed over both hemispheres (Sakai et al., 2016) and the 500 nm AOT at northern mid latitudes was >0.1 for more than 2 years. Particles were present from the tropopause to a height of about 25 km for several years. In contrast, even the extremely large stratospheric smoke contributions caused a mean 532 nm AOT (for the 30–60∘ N region and for the period from 16 August to 3 September, 2017) of the order of 0.01–0.015 (Khaykin et al., 2018). This AOT is comparable with stratospheric AOT values caused by moderate volcanic eruptions (see Table 1). The vertical extent of the detected smoke layers over Europe in August 2017 was typically <2 km; thus, their vertical extent was small compared to that of the thick Pinatubo aerosol layers of more than 10 km during the period from 1991 to 1993 (Ansmann et al., 1997).
Furthermore, pronounced and dense Pinatubo aerosol layers reached central Europe about 4–6 months after the eruption as a result of the slow meridional air mass transport in the stratosphere from the tropics (<20∘ N) to lidar sites at >50∘ N. In contrast, stratospheric particles related to moderate volcanic eruptions and wildfire events at northern midlatitudes are usually advected to central Europe within less than 2 weeks by the dominating westerly winds (Mattis et al., 2010); this means that, in these cases, perturbations close to the maximum impact on the stratospheric aerosol conditions are observable with lidars in Europe. The maximum impact of the Pinatubo aerosol was only visible with lidars over Hawaii (DeFoor et al., 1992; Barnes and Hoffmann, 1997), about 4–6 weeks after the eruption. The maximum stratospheric Pinatubo-related 550 nm AOT was of the order of 1–1.5 and respective maximum AEC values were of the order of 100–200 Mm−1 over tropical regions (Shallcross et al., 2018).
Nevertheless, the results in Sect. 3 and Table 1 clearly show the extent to which wildfires in combination with thunderstorm activity can pollute the lower stratosphere at mid and high northern latitudes. Since the lifting of smoke within convective cumulus towers is so fast (from the fire sources at ground to the upper troposphere and lower stratosphere within <1 h) (Rosenfeld et al., 2007), and only a minor part of the huge amount of smoke particles can be activated to nucleated cloud droplets in these extremely polluted conditions (Daniel Rosenfeld, personal communication, 2018), most of the smoke particles reach the tropopause region without any interaction with trace gases, other aerosol particles, or cloud drops. Our lidar profile measurements of the particle linear depolarization ratio suggest that the majority of the stratospheric smoke particles on 22 August 2017, were uncoated, pure soot particles (Haarig et al., 2018).
In Table 1, we included the extraordinarily strong pyrocumulonimbus-related Australian wildfire event observed in February 2009 (Siddaway and Petelina, 2011; de Laat et al., 2012). Strong bushfires, very high temperatures, low winds, and thunderstorm evolution on 7 February, 2009, (“Black Saturday”) triggered the lifting of enormous amounts of smoke towards the upper troposphere from where the smoke layers ascended by the self-lifting mechanism to a height of 15–20 km (Boers et al., 2010; de Laat et al., 2012). Similar maximum 532 nm AEC and AOT values as measured over central Europe on 21–22 August 2017, were observed with the CALIPSO lidar in the lower stratosphere over the South Pacific east of Australia at heights above the tropopause and below 20 km a few days after 7 February, 2009, (de Laat et al., 2012). The stratospheric perturbation slowly decreased during the following months (February–June 2009) (Siddaway and Petelina, 2011).
Finally, it should be noted that most of the AEC and AOT values in Table 1 are based on standard (elastic-backscatter) lidar observations which only enable the retrieval of profiles of the particle backscatter coefficient and the particle backscatter ratio. A direct measurement of the climate-relevant particle extinction coefficient is not possible with standard lidars. A few Raman lidar studies were available (Ansmann et al., 1997; Mattis et al., 2010) that provided direct AEC and AOT measurements as well as measured extinction-to-backscatter ratios (lidar ratios). In Table 1, we used lidar ratios of 25 sr (Pinatubo) (Jäger and Deshler, 2003), 35 sr (moderate volcanic events) (Mattis et al., 2010), and 50 sr during quiet, non-volcanic times (Khaykin et al., 2017) to convert the 532 nm backscatter ratios and backscatter coefficients (derived from the standard backscatter lidar observation) to AEC and AOT values.
Extreme levels of Canadian fire smoke were observed in the stratosphere, 2–5 km above the local tropopause over central Europe on 21–22 August 2017. Extinction coefficients reached values of 500 Mm−1 and were about a factor of 20 higher than maximum extinction values found over Germany after the Pinatubo eruption. These rather high stratospheric extinction coefficients were caused by an extraordinarily strong pyrocumulonimbus event over British Columbia in western Canada on 12 August 2017. Several heavy thunderstorms developed over areas with strong wildfires. We analyzed AERONET, MODIS, OMI, and lidar observations to document this historical, record-breaking stratospheric smoke event in terms of the 354 nm aerosol index and particle extinction coefficient and optical thickness in the 500–550 nm wavelength range. In an accompanying paper (Haarig et al., 2018), we will deepen the smoke characterization towards microphysical, morphological, and composition-related properties based on observations from three polarization/Raman lidar observations at Leipzig after sunset on 22 August 2017.
This extreme stratospheric aerosol event demonstrates that large amounts of wildfire smoke can reach and pollute the lower stratosphere. Such dense smoke layers disturb chemical processes, radiative fluxes, and even heterogeneous ice formation in the upper troposphere; this may continue over a period of weeks to several months. The black carbon aerosol partly enriches the natural soot particle reservoir between 20 and 30 km by upward motions (Renard et al., 2008).
The unprecedented stratospheric smoke event (observed with EARLINET lidars throughout Europe from mid August 2017 to January–February 2018) provides a favorable opportunity to validate atmospheric circulation models and to improve smoke transport parameterizations. Modeling of the complex life cycle of soot particles (injection, transport, removal by sedimentation, and ascent by self-lifting and gravito-photophoresis effects) and the complex direct and indirect climatic influences is a challenging effort, but of great importance to improve future-climate predictions and to better understand aerosol–cloud interaction in the upper troposphere. However, high quality and trustworthy modeling is only possible in close connection with the vertical profiling of aerosol by means of lidar providing smoke injection heights, smoke burden, size distribution, optical properties, and smoke decay and removal behavior. All of this must also be provided separately for tropospheric and stratospheric heights.
The spread of smoke was monitored with EARLINET over months by ground-based lidars from northern Norway to Crete and from Evora, Portugal, to Haifa, Israel. Never before had such a dense network of ground-based advanced lidars been operated in Europe. A systematic analysis of all measurements is planned. Spaceborne CALIPSO and CATS (Cloud Aerosol Transport System, https://cats.gsfc.nasa.gov/data/, last access: 10 July 2018) lidar observations will also be included in the analysis.
A special goal will be the study of the ascent of the soot layers over time. In August 2017, the layers were about 2–4 km above the tropopause, weeks to months later they were mostly observed at heights >20 km, meaning they were more than 10 km above the tropopause. As mentioned, upward movements of soot containing layers can be the result of heating of the environmental air masses by solar absorption by the soot particles (self-lifting mechanism) and/or by gravito-photophoresis effects.
The Polly lidar data are available at TROPOS upon request (polly@tropos.de). Backward trajectories analysis was supported by air mass transport computation with the NOAA (National Oceanic and Atmospheric Administration) HYSPLIT (HYbrid Single-Particle Lagrangian Integrated Trajectory) model (HYSPLIT, 2018) using GDAS meteorological data (Stein et al., 2015; Rolph et al., 2017). AERONET sun photometer AOT data are downloaded from the AERONET web page (AERONET, 2018). We used the ftp site for the MODIS data download: https://worldview.earthdata.nasa.gov/ (MODIS, 2018). OMI AI and MODIS AOT maps (August 2017 mean value) were produced using the GIOVANNI online data system, developed and maintained by the NASA GES DISC (Acker and Leptoukh, 2007). We used active fire products from the MODIS (MCD14DL product) in shapefile formats (https://earthdata.nasa.gov/earth-observation-data/near-real-time/firms/active-fire-data).
MH, RE, HB, PS, and IM collected the lidar and photometer observations. HB, IV, and AA analyzed the lidar and photometer observations. AC downloaded all satellite observations, prepared and designed the respective figures. UW was involved in the discussion of the optical effects of smoke. AA prepared the manuscript in close cooperation with AC and HB.
The authors declare that they have no conflict of interest.
This article is part of the special issue “EARLINET aerosol profiling: contributions to atmospheric and climate research”. It is not associated with a conference.
The authors thank the teams at Kosetice observatory (in particular Vlastimil
Hanuš, Adéla Holubová Šmejkalová and Vladimír
Ždímal) for their great logistical support. We gratefully
acknowledge the NOAA Air Resources Laboratory (ARL) for the provision of the
HYSPLIT transport and dispersion model. We are also grateful to AERONET for
providing high-quality sun photometer observations, calibrations, and
products. Special thanks to the Lindenberg and Brno AERONET teams that
carefully run the stations. We also acknowledge the MODIS mission scientists
and associated NASA personnel for the production of the data used in this
research effort. This activity is supported by ACTRIS Research Infrastructure
(EU H2020-R&I) under grant agreement no. 654109. The development of the
lidar inversion algorithm was supported by the Russian Science Foundation
(project 16-17-10241).
Edited by: Eduardo
Landulfo
Reviewed by: two anonymous referees
Acker, J. G. and Leptoukh, G.: Online analysis enhances use of NASA Earth Science Data, Eos, Trans. AGU, 88, 14–17, 2007. a, b, c
AERONET: AERONET aerosol data base, available at: http://aeronet.gsfc.nasa.gov/, last access: 20 February 2018. a, b, c
Althausen, D., Engelmann, R., Baars, H., Heese, B., Ansmann, A., Müller, D., and Komppula, M.: Portable Raman Lidar PollyXT for Automated Profiling of Aerosol Backscatter, Extinction, and Depolarization, J. Atmos. Ocean. Tech., 26, 2366–2378, https://doi.org/10.1175/2009JTECHA1304.1, 2009. a
Ansmann, A., Mattis, I., Wandinger, U., Wagner, F. Reichardt, J., and Deshler, T.: Evolution of the Pinatubo Aerosol: Raman Lidar Observations of Particle Optical Depth, Effective Radius, Mass, and Surface Area over Central Europe at 53.48∘ N, J. Atmos. Sci., 54, 2630–2641, https://doi.org/10.1175/1520-0469(1997)054<2630:EOTPAR>2.0.CO;2, 1997. a, b, c, d
Baars, H., Kanitz, T., Engelmann, R., Althausen, D., Heese, B., Komppula, M., Preißler, J., Tesche, M., Ansmann, A., Wandinger, U., Lim, J.-H., Ahn, J. Y., Stachlewska, I. S., Amiridis, V., Marinou, E., Seifert, P., Hofer, J., Skupin, A., Schneider, F., Bohlmann, S., Foth, A., Bley, S., Pfüller, A., Giannakaki, E., Lihavainen, H., Viisanen, Y., Hooda, R. K., Pereira, S. N., Bortoli, D., Wagner, F., Mattis, I., Janicka, L., Markowicz, K. M., Achtert, P., Artaxo, P., Pauliquevis, T., Souza, R. A. F., Sharma, V. P., van Zyl, P. G., Beukes, J. P., Sun, J., Rohwer, E. G., Deng, R., Mamouri, R.-E., and Zamorano, F.: An overview of the first decade of PollyNET: an emerging network of automated Raman-polarization lidars for continuous aerosol profiling, Atmos. Chem. Phys., 16, 5111–5137, https://doi.org/10.5194/acp-16-5111-2016, 2016. a
Barnes, J. E. and Hofmann, D. J.: Lidar measurements of stratospheric aerosol over Mauna Loa Observatory, Geophys. Res. Lett., 24, 1923–1926, https://doi.org/10.1029/97GL01943, 1997. a
Berrick, S., Leptoukh, G., Farley, J., and Rui, H.: Giovanni: A Web services workflow-based data visualization and analysis system, IEEE T. Geosci. Remote, 47, 106–113, https://doi.org/10.1109/TGRS.2008.2003183, 2009. a
Boers, R., de Laat, A. T., Stein Zweers, D. C., and Dirksen, R. J.: Lifting potential of solar-heated aerosol layers, Geophys. Res. Lett., 37, L24802, https://doi.org/10.1029/2010GL045171, 2010. a, b, c
Buchard, V., da Silva, A. M., Colarco, P. R., Darmenov, A., Randles, C. A., Govindaraju, R., Torres, O., Campbell, J., and Spurr, R.: Using the OMI aerosol index and absorption aerosol optical depth to evaluate the NASA MERRA Aerosol Reanalysis, Atmos. Chem. Phys., 15, 5743–5760, https://doi.org/10.5194/acp-15-5743-2015, 2015. a
Cheremisin, A. A., Vassilyev, Yu. V., and Horvath, H.: Gravito-photophoresis and aerosol stratification in the atmosphere, J. Aerosol. Sci., 36, 1277–1299, https://doi.org/10.1016/j.jaerosci.2005.02.003, 2005. a
China, S., Scarnato, B., Owen, R. C., Zhang, B., Ampadu, M. T., Kumar, S., Dzepina, K., Dziobak, M. P., Fialho, P., Perlinger, J. A., Hueber, J., Helmig, D., Mazzoleni, L. R., and Mazzoleni, C.: Morphology and mixing state of aged soot particles at a remote marine free troposphere site: Implications for optical properties, Geophys. Res. Lett., 42, 1243–1250, https://doi.org/10.1002/2014GL062404, 2015. a
Dahlkötter, F., Gysel, M., Sauer, D., Minikin, A., Baumann, R., Seifert, P., Ansmann, A., Fromm, M., Voigt, C., and Weinzierl, B.: The Pagami Creek smoke plume after long-range transport to the upper troposphere over Europe – aerosol properties and black carbon mixing state, Atmos. Chem. Phys., 14, 6111–6137, https://doi.org/10.5194/acp-14-6111-2014, 2014. a
DeFoor, T. E., Robinson, E., and Ryan, S.: Early lidar observations of the June 1991 Pinatubo eruption plume at Mauna Loa Observatory, Hawaii, Geophys. Res. Lett., 19, 187–190, https://doi.org/10.1029/91GL02791, 1992. a
de Laat, A. T. J., Stein Zweers, D. C., Boers, R., and Tuinder, O. N. E.: A solar escalator: Observational evidence of the self-lifting of smoke and aerosols by absorption of solar radiation in the February 2009 Australian Black Saturday plume, J. Geophys. Res., 117, D04204, https://doi.org/10.1029/2011JD017016, 2012. a, b, c, d, e
Dubovik, O., Sinyuk, A., Lapyonok, T., Holben, B., Mishchenko, M., Yang, P., Eck, T., Volten, H., Muñoz, O., Veihelmann, B., van der Zande, W. J., Leon, J. F., Sorokin, M., and Slutsker, I.: Application of spheroid models to account for aerosol particle non-sphericity in remote sensing of desert dust, J. Geophys. Res., 111, D11208, https://doi.org/10.1029/2005JD006619, 2006. a
Engelmann, R., Kanitz, T., Baars, H., Heese, B., Althausen, D., Skupin, A., Wandinger, U., Komppula, M., Stachlewska, I. S., Amiridis, V., Marinou, E., Mattis, I., Linné, H., and Ansmann, A.: The automated multiwavelength Raman polarization and water-vapor lidar PollyXT: the neXT generation, Atmos. Meas. Tech., 9, 1767–1784, https://doi.org/10.5194/amt-9-1767-2016, 2016. a
Fernald, F. G.: Analysis of atmospheric lidar observations: some comments, Appl. Optics, 23, 652–653, https://doi.org/10.1364/AO.23.000652, 1984. a
Freeborn, P. H., Wooster, M. J., Roy, D. P., and Cochrane, M. A.: Quantification of MODIS fire radiative power (FRP) measurement uncertainty for use in satellite-based active fire characterization and biomass burning estimation, Geophys Res. Lett., 41, 1988–1994, https://doi.org/10.1002/2013GL059086, 2014. a
Fromm, M., Alfred, J., Hoppel, K., Hornstein, J., Bevilacqua, R., Shettle, E., Servranckx, R., Li, Z., Stocks, B.: Observations of boreal forest fire smoke in the stratosphere by POAM III, SAGE II, and lidar in 1998, Geophys. Res. Lett., 27, 1407–1410, 2000. a
Fromm, M. D. and Servranckx, R.: Transport of forest fire smoke above the tropopause by supercell convection, Geophys. Res. Lett., 30, 1542, https://doi.org/10.1029/2002GL016820, 2003. a
Fromm, M., Lindsey, D. T., Servranckx, R., Yue, G., Trickl, T., Sica, R., Doucet, P., and Godin-Beekmann, S. E.: The untold story of pyrocumulonimbus, B. Am. Meteorol. Soc., 91, 1193–1209, https://doi.org/10.1175/2010bams3004.1, 2010. a, b
GDAS: Global Data Assimilation System, meteorological data base, available at: https://www.ready.noaa.gov/gdas1.php, last access: 20 February 2018. a, b
Haarig, M., Ansmann, A., Baars, H., Jimenez, C., Veselovskii, I., Engelmann, R., and Althausen, D.: Depolarization and lidar ratios at 355, 532, and 1064 nm and microphysical properties of aged tropospheric and stratospheric Canadian wildfire smoke, Atmos. Chem. Phys., 18, 11847–11861, https://doi.org/10.5194/acp-18-11847-2018, 2018. a, b, c, d, e, f, g, h, i
Hammer, M. S., Martin, R. V., van Donkelaar, A., Buchard, V., Torres, O., Ridley, D. A., and Spurr, R. J. D.: Interpreting the ultraviolet aerosol index observed with the OMI satellite instrument to understand absorption by organic aerosols: implications for atmospheric oxidation and direct radiative effects, Atmos. Chem. Phys., 16, 2507–2523, https://doi.org/10.5194/acp-16-2507-2016, 2016. a
Hammer, M. S., Martin, R. V., Li, C., Torres, O., Manning, M., and Boys, B. L.: Insight into global trends in aerosol composition from 2005 to 2015 inferred from the OMI Ultraviolet Aerosol Index, Atmos. Chem. Phys., 18, 8097–8112, https://doi.org/10.5194/acp-18-8097-2018, 2018. a
Holben, B. N., Eck, T. F., Slutsker, I., Tanré, D., Buis, J. P., Setzer, A., Vermote, E., Reagan, J. A., Kaufman, Y. J., Nakajima, T., Lavenu, F., Jankowiak, I., and Smirnov, A.: AERONET – a federated instrument network and data archive for aerosol characterization, Remote Sens. Environ., 66, 1–16, 1998. a, b
Hoose, C. and Möhler, O.: Heterogeneous ice nucleation on atmospheric aerosols: a review of results from laboratory experiments, Atmos. Chem. Phys., 12, 9817–9854, https://doi.org/10.5194/acp-12-9817-2012, 2012. a
Hu, Q., Goloub, P., Veselovskii, I., Bravo-Aranda, J.-A., Popovici, I., Podvin, T., Haeffelin, M., Lopatin, A., Pietras, C., Huang, X., Torres, B., and Chen, C.: A study of long-range transported smoke aerosols in the Upper Troposphere/Lower Stratosphere, Atmos. Chem. Phys. Discuss., https://doi.org/10.5194/acp-2018-655, in review, 2018. a
HYSPLIT: HYbrid Single-Particle Lagrangian Integrated Trajectory model, backward trajectory calculation tool, available at: http://ready.arl.noaa.gov/HYSPLIT_traj.php, last access: 20 February 2018. a, b, c
Ichoku, C., Giglio, L., Wooster, M. J., and Remer, L. A.: Global characterization of biomass-burning patterns using satellite measurements of fire radiative energy, Remote Sens. Environ., 112, 2950–2962, https://doi.org/10.1016/j.rse.2008.02.009, 2008. a, b
Jäger, H. and Deshler, T.: Correction to Lidar backscatter to extinction, mass and area conversions for stratospheric aerosols based on midlatitude balloonborne size distribution measurements, Geophys. Res. Lett., 30, 1382, https://doi.org/10.1029/2003GL0171892003, 2003. a
Jäger, H.: Long-term record of lidar observations of the stratospheric aerosol layer at Garmisch-Partenkirchen, J. Geophys. Res., 110, D08106, https://doi.org/10.1029/2004JD005506, 2005. a, b, c
Jensen, E. J. and Toon, O. B.: The potential effects of volcanic aerosols on cirrus cloud microphysics, Geophys. Res. Lett., 19, 1759–1762, https://doi.org/10.1029/92GL01936, 1992. a
Khaykin, S. M., Godin-Beekmann, S., Keckhut, P., Hauchecorne, A., Jumelet, J., Vernier, J.-P., Bourassa, A., Degenstein, D. A., Rieger, L. A., Bingen, C., Vanhellemont, F., Robert, C., DeLand, M., and Bhartia, P. K.: Variability and evolution of the midlatitude stratospheric aerosol budget from 22 years of ground-based lidar and satellite observations, Atmos. Chem. Phys., 17, 1829–1845, https://doi.org/10.5194/acp-17-1829-2017, 2017. a, b, c
Khaykin, S. M., Godin-Beekmann, S., Hauchecorne, A., Pelon, J., Ravetta, F., and Keckut, P.: Stratospheric smoke with unprecedentedly high backscatter observed by lidars above southern France, Geophys. Res. Lett., 45, 1639–1646, https://doi.org/10.1002/2017GL076763, 2018. a, b, c, d, e, f, g, h, i, j, k, l, m
Kitzberger, T., Falk, D. A., Swetnam, T. W., and Westerling, L.: Heterogeneous responses of wildfire annual area burned to climate change across western and boreal North America, PLOS One, 12, e0188486, https://doi.org/10.1371/journal.pone.0188486, 2017. a
Levy, R. C., Remer, L. A., Kleidman, R. G., Mattoo, S., Ichoku, C., Kahn, R., and Eck, T. F.: Global evaluation of the Collection 5 MODIS dark-target aerosol products over land, Atmos. Chem. Phys., 10, 10399–10420, https://doi.org/10.5194/acp-10-10399-2010, 2010. a
Levy, R. C., Mattoo, S., Munchak, L. A., Remer, L. A., Sayer, A. M., Patadia, F., and Hsu, N. C.: The Collection 6 MODIS aerosol products over land and ocean, Atmos. Meas. Tech., 6, 2989–3034, https://doi.org/10.5194/amt-6-2989-2013, 2013. a
Levy, R., Hsu, C., et al.: MODIS Atmosphere L2 Aerosol Product, NASA MODIS Adaptive Processing System, Goddard Space Flight Center, USA, https://doi.org/10.5067/MODIS/MOD04_L2.006, 2015. a
Liu, X. and Penner, J. E.: Effect of Mount Pinatubo H2SO4/H2O aerosol on ice nucleation in the upper troposphere using a global chemistry and transport model, J. Geophys. Res., 107, AAC 2-1-AAC 2-18, https://doi.org/10.1029/2001JD000455, 2002. a
Liu, Y., Stanturf, J. A., and Goodrick, S. L.: Trends in global wildfire potential in a changing climate, Forest Ecol. Manag., 259, 685–697, https://doi.org/10.1016/j.foreco.2009.09.002, 2009. a
Liu, Y., Goodrick, S., and Heilman, W.: Wildland fire emissions, carbon, and climate: Wildfire-climate interactions, For. Ecol. Manage., 317, 80–96, https://doi.org/10.1016/j.foreco.2013.02.020, 2014. a
Mattis, I., Ansmann, A., Wandinger, U., and Müller, D.: Unexpectedly high aerosol load in the free troposphere over Central Europe in spring/summer 2003, Geophys. Res. Lett., 30, 2178, https://doi.org/10.1029/2003GL018442, 2003. a
Mattis, I., Müller, D., Ansmann, A., Wandinger, U., Preißler, J., Seifert, P., and Tesche, M.: Ten years of multiwavelength Raman lidar observations of free-tropopsheric aerosol layers over central Europe: Geometrical properties and annual cycle, J. Geophys. Res., 113, D20202, https://doi.org/10.1029/2007JD009636, 2008. a
Mattis, I., Seifert, P., Müller, D., Tesche, M., Hiebsch, A., Kanitz, T., Schmidt, J., Finger, F., Wandinger, U., and Ansmann, A.: Volcanic aerosol layers observed with multiwavelength Raman lidar over central Europe in 2008–2009, J. Geophys. Res., 115, D00L04, https://doi.org/10.1029/2009JD013472, 2010. a, b, c, d
MODIS: MODIS ftp site for data download: https://worldview.earthdata.nasa.gov/, last access: 19 February 2018. a
O'Neill, N. T., Eck, T. F., Smirnov, A., Holben, B. N., and Thulasiraman, S.: Spectral discrimination of coarse and fine mode optical depth, J. Geophys. Res., 108, 4559, https://doi.org/10.1029/2002JD002975, 2003. a
Pappalardo, G., Amodeo, A., Apituley, A., Comeron, A., Freudenthaler, V., Linné, H., Ansmann, A., Bösenberg, J., D'Amico, G., Mattis, I., Mona, L., Wandinger, U., Amiridis, V., Alados-Arboledas, L., Nicolae, D., and Wiegner, M.: EARLINET: towards an advanced sustainable European aerosol lidar network, Atmos. Meas. Tech., 7, 2389–2409, https://doi.org/10.5194/amt-7-2389-2014, 2014. a
Peterson, D. A., Hyer, E. J., Campbell, J. R., Solbrig, J. E., and Fromm, M. D.: A conceptual model for development of intense pyrocumulonimbus in western North America, Mon. Weather Rev., 145, 2235–2255, doi.org/10.1175/MWR-D-16-0232.1, 2017. a
Pueschel, R. F., Verma, S., Rohatschek, H., Ferry, G. V., Boiadjieva, N., Howard, S. D., and Strawa, A. W.: Vertical transport of anthropogenic soot aerosol into the middle atmosphere, J. Geophys. Res., 105, 3727–3736, https://doi.org/10.1029/1999JD900505, 2000. a
Remer, L. A., Mattoo, S., Levy, R. C., and Munchak, L. A.: MODIS 3 km aerosol product: algorithm and global perspective, Atmos. Meas. Tech., 6, 1829–1844, https://doi.org/10.5194/amt-6-1829-2013, 2013. a, b
Renard, J.-B., Ovarlez, J., Berthet, G., Fussen, D., Vanhellemont, F., Brogniez, C., Hadamcik, E., Chartier, M., and Ovarlez, H.: Optical and physical properties of stratospheric aerosols from balloon measurements in the visible and near-infrared domains, III, Presence of aerosols in the middle stratosphere, Appl. Optics, 44, 4086–4095, https://doi.org/10.1364/AO.44.004086, 2005. a
Renard, J.-B., Brogniez, C., Berthet, G., Bourgeois, Q., Gaubicher, B., Chartier, M., Balois, J.-Y., Verwaerde, C., Auriol, F., Francois, P., Daugeron, D., and Engrand, C.: Vertical distribution of the different types of aerosols in the stratosphere: Detection of solid particles and analysis of their spatial variability, J. Geophys. Res., 113, D21303, https://doi.org/10.1029/2008JD010150, 2008. a, b, c
Rohatschek, H.: Levitation of stratospheric and mesospheric aerosols by gravito-photophoresis, J. Aerosol. Sci., 27, 467–475, 1996. a
Rolph, G., Stein, A., and Stunder, B.: Real-time Environmental Applications and Display sYstem: READY, Environ. Modell. Softw., 95, 210–228, https://doi.org/10.1016/j.envsoft.2017.06.025, 2017. a, b
Rosenfeld, D., Fromm, M., Trentmann, J., Luderer, G., Andreae, M. O., and Servranckx, R.: The Chisholm firestorm: observed microstructure, precipitation and lightning activity of a pyro-cumulonimbus, Atmos. Chem. Phys., 7, 645–659, https://doi.org/10.5194/acp-7-645-2007, 2007. a, b
Sakai, T., Uchino, O., Nagai, T., Liley, B., Morino, I., and Fujimoto, T.: Long-term variation of stratospheric aerosols observed with lidars over Tsukuba, Japan, from 1982 and Lauder, New Zealand, from 1992 to 2015, J. Geophys. Res.-Atmos., 121, 10283–10293, https://doi.org/10.1002/2016JD025132, 2016. a, b, c
Sassen, K., Starr, D. O. C. , Mace, G. G., Poellot, M. R., Melfi, S. H., Eberhard, W. L., Spinhirne, J. D., Eloranta, E. W., Hagen, D. E., and Hallett, J.: The 5–6 December 1991 FIRE IFO II jet stream cirrus case study: Possible influences of volcanic aerosols, J. Atmos. Sci., 52, 97–123, 1995. a
Shallcross, S., Mann, G., Neely III, R., Schmidt, A., Marshall, L., Dhomse, S., Haywood, J., Jones, A., Barnes, J., McDermid, S., Carswell, A., and Pal, S.: Global dispersion and microphysical variation of the 1991 Mount Pinatubo plume: A ground-based lidar and interactive modelling analysis, Atmos. Chem. Phys., in review, 2018. a
Siddaway, J. M. and Petelina, S. V.: Transport and evolution of the 2009 Australian Black Saturday bushfire smoke in the lower stratosphere observed by OSIRIS on Odin, J. Geophys. Res., 116, D06203, https://doi.org/10.1029/2010JD015162, 2011. a, b, c, d
Strawa, A. W., Drdla, K., Ferry, G. V., Verma, S., Pueschel, R. F., Yasuda, M., Salawitch, R. J., Gao, R. S., Howard, S. D., Bui, P. T., Loewenstein, M., Elkins, J. W., Perkins, K. K., and Cohen, R.: Carbonaceous aerosol (soot) measured in the lower stratosphere during POLARIS and its role in stratospheric photochemistry, J. Geophys. Res., 104, 26753–26766, https://doi.org/10.1029/1999JD900453, 1999. a
Stein, A. F., Draxler, R. R., Rolph, G. D., Stunder, B. J. B., Cohen, M. D., and Ngan, F.: NOAA's HYSPLIT atmospheric transport and dispersion modeling system, B. Am. Meteorol. Soc., 96, 2059–2077, https://doi.org/10.1175/BAMS-D-14-00110.1, 2015. a, b, c
Torres, O., Bhartia, P. K., Herman, J. R., and Ahmad, Z.: Derivation of aerosol properties from satellite measurements of backscattered ultraviolet radiation, Theoretical Basis, J. Geophys. Res., 103, 17099–17110, https://doi.org/10.1029/98JD00900, 1998. a
Trickl, T., Giehl, H., Jäger, H., and Vogelmann, H.: 35 yr of stratospheric aerosol measurements at Garmisch-Partenkirchen: from Fuego to Eyjafjallajökull, and beyond, Atmos. Chem. Phys., 13, 5205–5225, https://doi.org/10.5194/acp-13-5205-2013, 2013. a, b
Uchino, O., Sakai, T., Nagai, T., Nakamae, K., Morino, I., Arai, K., Okumura, H., Takubo, S., Kawasaki, T., Mano, Y., Matsunaga, T., and Yokota, T.: On recent (2008–2012) stratospheric aerosols observed by lidar over Japan, Atmos. Chem. Phys., 12, 11975–11984, https://doi.org/10.5194/acp-12-11975-2012, 2012. a
Wandinger, U., Tesche, M., Seifert, P., Ansmann, A., Müller, D., and Althausen, D.: Size matters: Influence of multiple scattering on CALIPSO light-extinction profiling in desert dust, Geophys. Res. Lett., 37, L10801, https://doi.org/10.1029/2010GL042815, 2010. a
Zuev, V. V., Burlakov, V. D., Nevzorov, A. V., Pravdin, V. L., Savelieva, E. S., and Gerasimov, V. V.: 30-year lidar observations of the stratospheric aerosol layer state over Tomsk (Western Siberia, Russia), Atmos. Chem. Phys., 17, 3067-3081, https://doi.org/10.5194/acp-17-3067-2017, 2017. a, b