Variability of Cosmogenic 35S in Rain—Resulting Implications for the Use of Radiosulfur as Natural Groundwater Residence Time Tracer


1
Helmholtz Centre for Environmental Research, Permoserstr. 15, 04318 Leipzig, Germany
2
Helmholtz Centre for Environmental Research, Theodor-Lieser-Str. 4, 06120 Halle, Germany
3
Leibniz Institute for Tropospheric Research, Permoserstr. 15, 04318 Leipzig, Germany
4
Belgian Nuclear Research Centre SCK-CEN, Boeretang 200, 2400 Mol, Belgium
*
Author to whom correspondence should be addressed.
Water 2020, 12(10), 2953; https://doi.org/10.3390/w12102953
Submission received: 1 September 2020
/
Revised: 13 October 2020
/
Accepted: 14 October 2020
/
Published: 21 October 2020
(This article belongs to the Special Issue Using Natural Radionuclides as Aquatic Tracers in the Terrestrial and the Coastal/Marine Environment)
Abstract
:Information about groundwater residence times is essential for sustainable groundwater management. Naturally occurring radionuclides are suitable tools for related investigations. While the applicability of several long-lived radionuclides has been demonstrated for the investigation of long residence times (i.e., years, decades, centuries and more), studies that focus on sub-yearly residence times are only scarcely discussed in the literature. This shortage is mainly due to the rather small number of radionuclides that are generally suitable for the purpose and show at the same time adequately short half-lives. A promising innovative approach in this regard applies cosmogenic radiosulfur (35S). 35S is continuously produced in the stratosphere from where it is conveyed to the troposphere or lower atmosphere and finally transferred with the rain to the groundwater. As soon as the meteoric water enters the subsurface, its 35S activity decreases with an 87.4 day half-life, making 35S a suitable time tracer for investigating sub-yearly groundwater ages. However, since precipitation shows a varying 35S activity during the year, setting up a reliable 35S input function is required for sound data evaluation. That calls for (i) an investigation of the long-term variation of the 35S activity in the rain, (ii) the identification of the associated drivers and (iii) an approach for setting up a 35S input function based on easily attainable proxies. The paper discusses 35S activities in the rain recorded over a 12-month period, identifies natural and anthropogenic influences, and suggests an approach for setting up a 35S input function applying 7Be as a proxy.
1. Introduction
The knowledge of groundwater residence times is essential for the sustainable management of groundwater resources. This general fact can be underpinned with three specific aspects: (i) the vulnerability of an aquifer (regarding anthropogenic contamination) depends largely on the travel time needed by the meteoric water to cross the unsaturated soil zone covering the groundwater body. (ii) Sustainable groundwater abstraction management is mainly based on groundwater residence time evaluation. (iii) Groundwater residence time information is essential for evaluating groundwater migration patterns and the associated matter (and contaminant) transport.
Commonly, the investigation of groundwater residence times relies on field surveys that apply environmental tracers, i.e., tracers that occur naturally in the groundwater. Suitable in this regard are components that meet two general requirements: (i) their concentration in groundwater changes as a function of time and (ii) they enter the subsurface (dissolved in the meteoric water or any surface water) either with a time-constant concentration or with a specific time-variant input function.
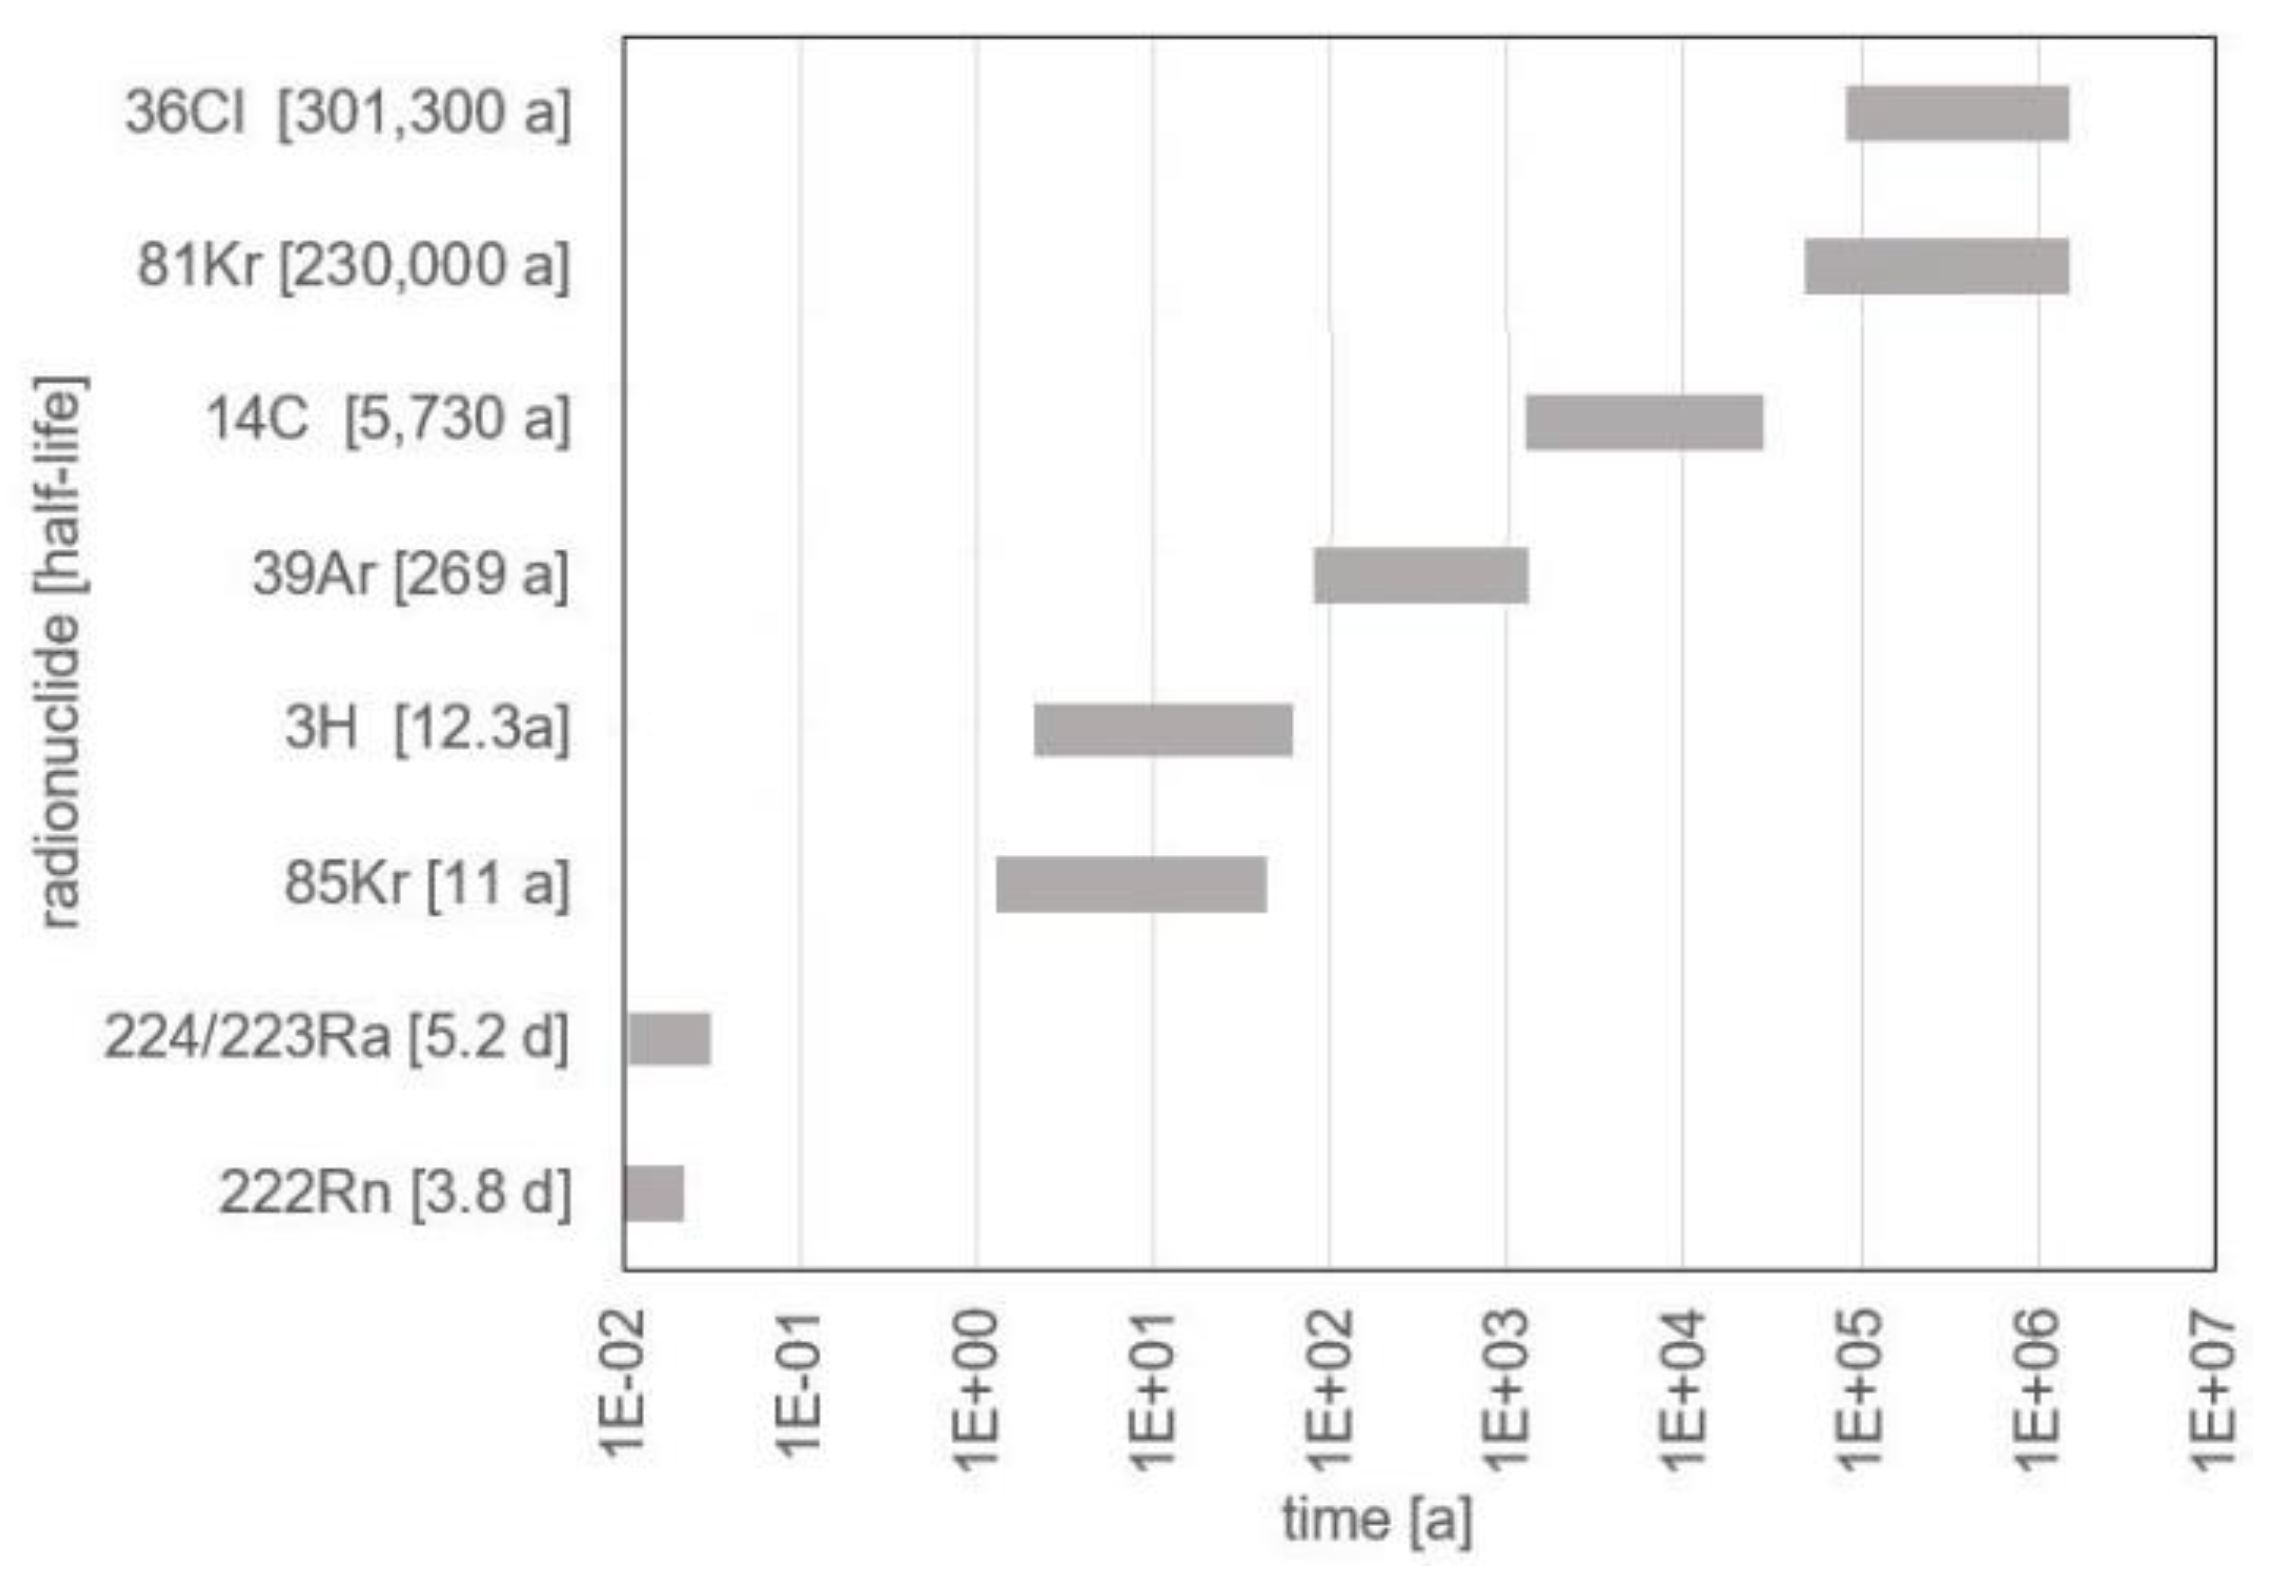
Powerful residence time tracers include (besides stable isotopes such as 40Ar, 3He, δ2H, or δ18O) a range of ubiquitously occurring radionuclides. A key criterion for selecting site-specifically the most suitable radionuclide is its half-life, which should be in the same range as the groundwater residence time expected for the investigated aquifer domain. Rather long-lived radionuclides (such as 3H, 14C, 36Cl, 39Ar, 81Kr, and 85Kr) are generally suitable for investigating high groundwater ages (Figure 1) and a great number of studies that aimed at investigating aquifer systems with water residence times between 10 and 106 years have been published. In contrast, radiotracer-based investigations that focus on sub-yearly groundwater residence times are scarcely discussed in the literature. This is because only a limited number of ubiquitously occurring radionuclides show a half-life short enough for covering the sub-yearly timeframe. Examples of suitable short-lived radionuclides are the frequently applied 222Rn (e.g., [1,2,3]) or the radium species 224Ra and 223Ra (e.g., [4,5]).
The state-of-the-art situation is generally illustrated in Figure 1. The image reveals that the timeframe between about 1 and 12 months is not satisfactorily covered by the radioactive residence time tracers that are conventionally applied.
A potential candidate to fill this gap is the naturally occurring radioisotope beryllium-7 (7Be). It shows a half-life of 53.3 days and is hence (at least in this regard) suitable for investigating groundwater residence times of up to about eight months. 7Be is produced through cosmic ray spallation of mainly oxygen and nitrogen within the upper troposphere and lower stratosphere (UTLS zone) [6,7,8]. There it attaches to aerosols, which are washed out by (dry deposition and) mainly precipitation [9,10]. Since no natural 7Be sources exist in the subsurface, the 7Be activity concentration of the meteoric water declines once it enters the ground. However, 7Be has a high tendency to sorb not only to aerosols in the upper atmosphere but also to the soil matrix. Thus, a substantial and nonquantifiable share of the dissolved beryllium is retarded by the soil matrix [11,12], which (in contrast to its applicability as a tracer for atmospheric dynamics, [10,13]) impedes its applicability as a quantitative aqueous tracer in groundwater.
A promising alternative approach for covering sub-yearly groundwater residence times is based on the application of naturally occurring radioactive sulfur as aqueous tracer (“radiosulfur”; 35S, [14]). Comparable to 7Be, the radionuclide is continuously produced by cosmic ray spallation (of 40Ar) in the stratosphere where it rapidly (ca. one second) oxidizes to sulphate. Due to its short half-life of 87.4 days, some of the produced 35S decays to 35Cl during stratosphere/troposphere air exchange. Still, most 35SO42− gets dissolved in meteoric water and is transferred as precipitation to the earth’s surface and finally to the groundwater [15].
35SO42− activities in rain range generally between about 10 and 150 mBq/L ([16,17,18,19]; own measurements). As soon as the 35S containing meteoric water (C0) enters the subsurface, 35S decay is not supported by 35S production anymore, which makes the decline of the initial 35S activity concentration in the groundwater (Ct) an indicator for its residence time (t) in the ground (determined by the 35S decay constant λ) (Equation (1)).
In contrast to 7Be, sulphate 35SO42− is not retarded by the soil or aquifer matrix. This makes radiosulfur a residence time tracer suitable for groundwater ages between about three and nine months (i.e., between one and three 35S half-lives, [20,21,22]).
Still, scanning the literature reveals that only a few related case studies have been published so far. These studies are generally limited to high geographical elevations, where snowmelt is the dominant hydrological recharge event. This boundary condition limits 35S input into the groundwater to the peak snowmelt, i.e., it simplifies the 35S input to a distinct value [20,21,23,24]. This neglects the fact that 35S is likely to show considerable variability in the rain over the course of a year (e.g., [25,26]).
This variability is mainly due to large-scale atmospheric circulation dynamics, i.e., due to stratosphere/troposphere air mass exchange and convective tropospheric air circulation, which are, to a large degree, bound to seasonal patterns in atmospheric processes [10]. Besides such temporal variations, significant latitudinal variations of 35S in the atmosphere and the rain are also likely. The varying deflection of cosmic rays causes this lateral variability due to the Earth’s magnetic field’s increased strength closer to the equator [10]. Another influential factor for 35S variability in the rain is the rainfall dynamics, i.e., sulphate washout by precipitation [27,28].
The resulting regional and seasonal variability of 35S in the rain suggest that the experiences reported for the use of 35S as aqueous residence time tracer in alpine/subalpine watersheds are of only limited use in moderate climates. That implies that the variability of the 35S activity in the rain (and the associated drivers) needs to be investigated and understood more comprehensively. Setting up region-specific long-term 35S input functions is mandatory. Understanding the challenges related to this requirement calls for (i) an exemplary systematic long-term investigation of the 35S activity in the rain in a certain study region, (ii) the identification of the drivers of the temporal long-term 35S variability and (iii) the suggestion of an easily attainable 35S proxy that can be applied for supporting the setup of a regional 35S input function (the latter is desirable because long-term 35S datasets are hardly ever available and 35S in water analysis is rather laborious).
The presented paper discusses 35S activities in the rain recorded over a 12-month period at a distinct location in Germany and suggests an approach regarding the setup of a regional 35S input function. The approach applies 7Be in atmospheric air as 35S proxy. Furthermore, the results are backed and evaluated based on the time series of the aerosol optical depth (AOD) and the activity concentration of naturally occurring 212Pb in atmospheric air.
2. Materials and Methods
2.1. Radiosulfur Sampling and Measurement
All 35S data of the study was attained in a sampling campaign that aimed at collecting samples from as many major rain events as possible over the course of 12 months (August 2019–July 2020). A sampling station was installed, uncovered by trees, in a rural environment close to the city of Leipzig, Germany. The area is located at an elevation of 155 masl, characterized by an average annual rainfall of 550 mm, and an average annual temperature of 11 °C.
All rain samples were collected from a 31 m2 inclined laminated rain collector plane via a downpipe into a 200-litre HDPE container. Hence, all rain events of up to 6.5 mm precipitation (88% of the 60 sampled rain events) were quantitatively collected. The container was isolated from any other environmental depositions besides rain. The rain collector surface, the downpipe and the container were cleaned regularly, during autumn (leaves) and springtime (pollen) and after storm events.
All related meteorological data was recorded at a professional meteorological station located only 3 km from the rain sampling location. Hence, all samples could be associated with specific rain events and their intensity.
Each rain sample was representatively transferred from the 200-litre sample container into a 20-litre plastic canister. Since no elevated sulphate concentrations were expected in the samples [29], all sample processing and measurement followed the suggestions for low-sulphate sample preparation for liquid scintillation counting (LSC) given by [30]. A Quantulus GCT 6220 liquid scintillation counter was used for all 35S activity measurements. To allow reasonable statistical reliability of the counting results (counting error < 1%), each measurement lasted 24 h. The detection background was counted and subtracted from the sample counts by measuring a 35S-dead (and 3H-dead) background vial before each measurement. To optimize the signal-to-noise-ratio of the measurement results, the specific LSC detection options were set as given in Table 1.
2.2. Using Atmospheric 7Be as 35S Proxy
In Central Europe we usually observe increased activity concentrations of 7Be in the lower atmosphere during the warm and dry summer season. The main reasons for this annual pattern are the following.
- (i)
- (ii)
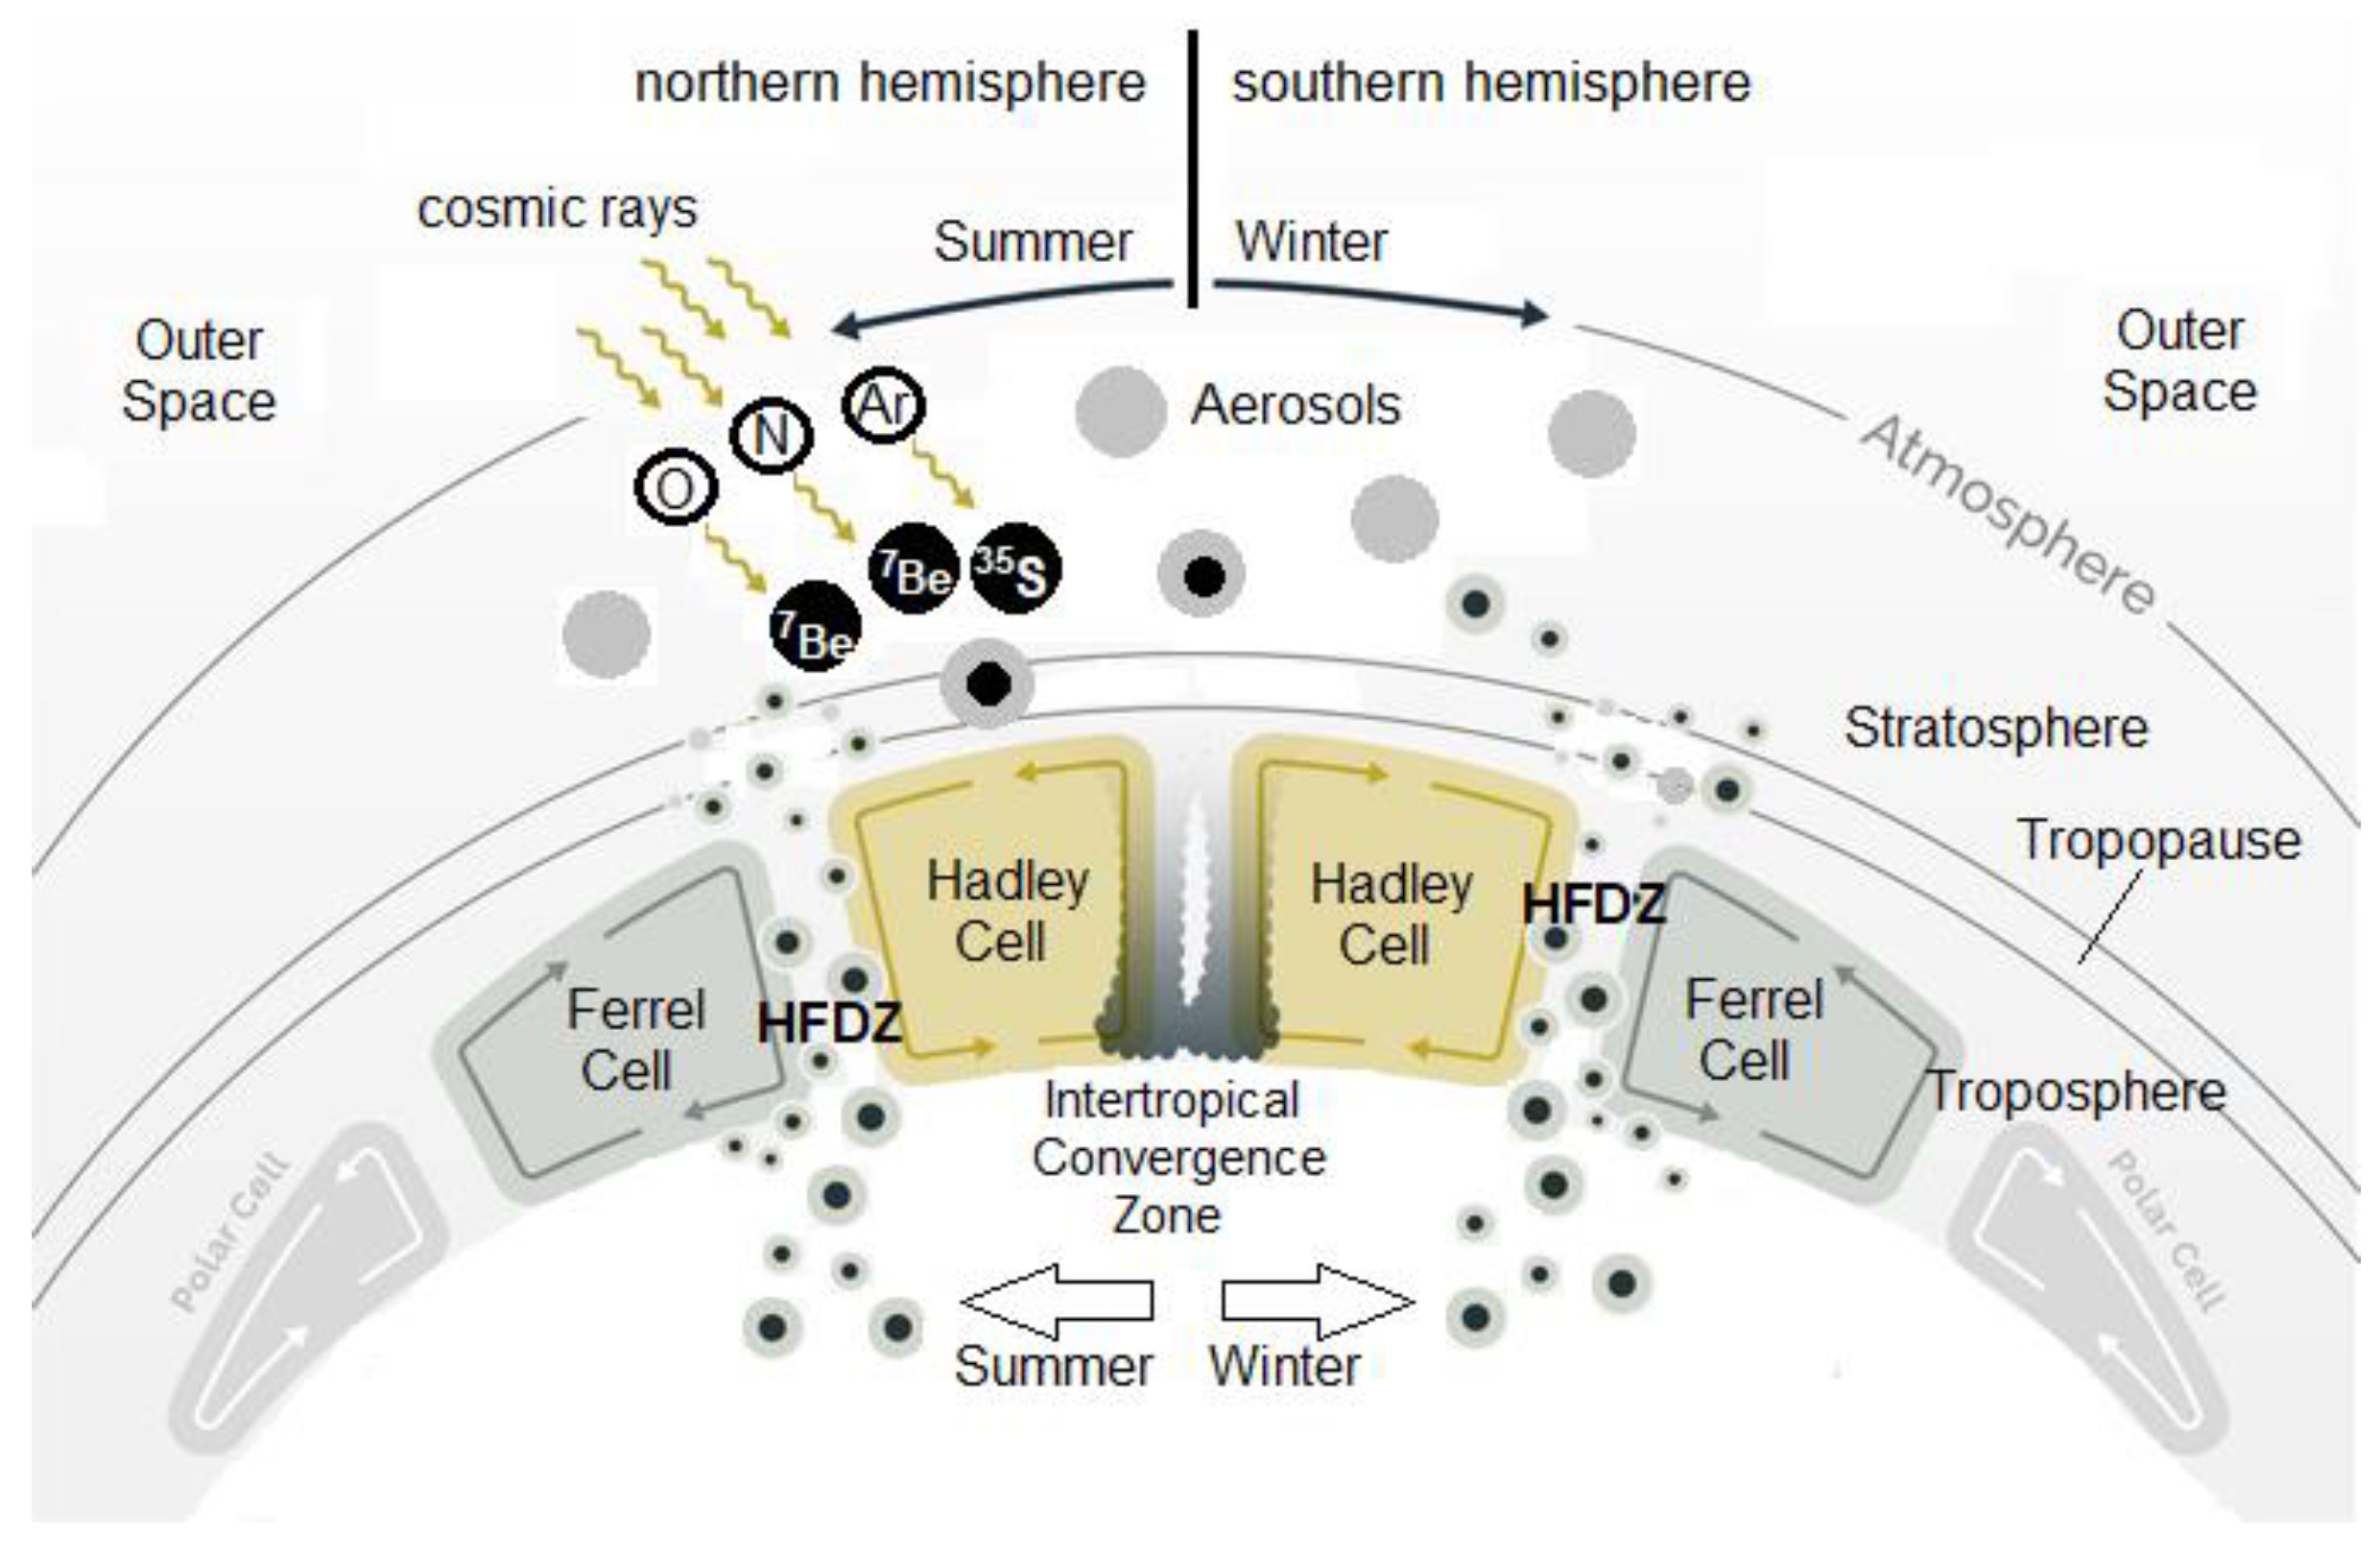
- The zone between the two latitudinal circulation features the Hadley Cell (in the northern hemisphere in the south) and the Ferrel Cell (in the north) is called the Hadley Ferrel Divergence Zone (HFDZ). Within the HFDZ air masses are continuously conveyed from the upper part to the lower part of the troposphere (Figure 2) [32]. While (in the northern hemisphere) the HFDZ is generally active at a latitude of about 30° north it migrates, with the start of the warm season, northward and approaches Central Europe annually during the summer.
As discussed in Section 1, both 7Be and 35S are primarily created in the lower stratosphere both triggered by cosmic ray spallation. It can hence be assumed that their production rates correlate. Furthermore, both nuclides are conveyed by the same abovementioned large-scale atmospheric processes to the troposphere and lower atmosphere as illustrated in Figure 2. Hence, it was postulated that exceptionally high (or low) 7Be activities in the lower atmosphere indicate the simultaneous presence of exceptionally high (or low) 35S activities in the rain.
Long-term 7Be datasets are generally available since the parameter is recorded as a routine parameter by the Comprehensive Nuclear-Test-Ban Treaty Organization (CTBTO). A worldwide network of 80 CTBTO stations has been set up to monitor compliance with the Comprehensive Nuclear-Test-Ban Treaty. The resulting 7Be datasets are freely available [10]. This makes 7Be an easily attainable 35S proxy.
Our study evaluated the recorded 35S dataset versus a 7Be time series recorded at the CTBTO station RN33, located (as sole CTBTO station in Germany) at Mount Schauinsland in the Black Forest Mountains. Due to the large spatial scale of 7Be and 35S production and migration processes in the atmosphere (as discussed in Section 1), the distance between the 7Be and the 35S recording stations (Black Forest Mountains and close to the City of Leipzig, respectively) is of only minor relevance.
2.3. Using the Aerosol Optical Depth (AOD) and 212Pb in Air as Supporting Data
Besides the two large-scale atmospheric processes mentioned above in points (i) and (ii), a third reason can be given for the increase of the activity concentration of 35S in the rain during the warm and dry season: (iii) a less intense 35S washout from the atmosphere by rain. The less rain falls, the less intense is the washout, which results in an increase of the particle concentration in the rain when a rare precipitation event occurs. The triggering dry conditions are usually accompanied by an increased rate of resuspension of mineral dust from the earth’s surface (windblown dust). The intensity of the latter effect can be evaluated based on two parameters: the aerosol optical depth (AOD) and the 212Pb activity concentration in air.
The AOD indicates the attenuation of incoming solar radiation in the atmosphere by mineral dust, sea salts, volcanic ash, smoke from wildfires, pollution from factories and others. The potential sources of these attenuators indicate that the AOD is (regionally and temporarily) impacted by natural extreme events such as dust storms (with a global hotspot on the Arabian Peninsula) and/or anthropogenic activities such as land clearing fires (with a global hotspot in the Amazon Basin), or human-made air pollution (with global hotspots in northern India and eastern China). However, in Central Europe the impact of such effects on the AOD is less pronounced (although windblown atmospheric dust with a remote origin, such as northern Africa, Sahara, can be an issue). Besides, choosing the AOD wavelengths 1640 and 1020 nm for our investigation allowed focusing on the impact of mineral dust.
The AOD is continuously monitored by NASA at several AERONET sites worldwide. For our study, we used a dataset (covering the complete 12-month period of the 35S sampling campaign) recorded as daily averages at an altitude of 115 masl at the Institute for Tropospheric Research, which is located about 30 km north-east of our rain sampling station.
212Pb is a short-lived (half-life 12.64 h) progeny of the 232Th decay chain and is easily detectable by gamma spectrometry due to its strong gamma line at 238.6 keV. Thorium and its progeny occur as a minor constituent of most soils on earth. Therefore, the 212Pb activity concentration in the atmosphere can also be used as an indicator for the presence of terrestrial mineral dust (and hence for its washout by precipitation). Comparable to 7Be, 212Pb is also continuously monitored by the CTBTO as routine parameter. We used a 12-month 212Pb dataset recorded (simultaneously to the 7Be dataset) at the CTBTO station RN33 in the Black Forest Mountains for our study.
2.4. Anthropogenic 35S Sources
Using 35S as an environmental aqueous tracer with a distinct input function requires the consideration of anthropogenic 35S sources and their potential impact. In nuclear facilities (i.e., power plants, reprocessing facilities, and research reactors) minor amounts of 35S are continuously produced via the nuclear reactions 35Cl(n,p)35S [33] and, to a lesser degree, 34S(n,γ)35S [34]. The reactions are triggered by the activation of impurities in coolant liquids or solid reactor materials [35]. Furthermore, 35S is in some nuclear facilities (in low activities) applied as process tracer. Both the unintentional production and the process tracer application of 35S result in releases of the radionuclide from nuclear facilities, which occur with the emission of liquid effluents and/or coolant gas.
An evaluation of the impact of anthropogenic 35S emissions on human health (carried out 43 years ago, [36]) concluded that not more than 4.8 MBq 35S reach the overall group of worldwide adults by food ingestion per year. Due to this minor human exposure, 35S does not belong to the group of radionuclides originating from anthropogenic activities systematically monitored and reported by the CTBTO or any national radiation protection organization. Hence, data on gaseous 35S emissions from nuclear facilities are scarce.
A few historical data exist, though. A report by [35] summarized gaseous 35S emissions from ten (west) German nuclear power plants for the 30-month period between January 1983 and June 1985. The facility-specific annual values ranged between 0.8 and 6.8 GBq/a, summing up to an annual gaseous 35S emission averaged for (west) Germany of 24.7 ± 6.8 GBq/a.
We tried to compare this averaged anthropogenic release rate to the overall 35S inventory of the lower atmosphere. Related atmospheric data is scarce, too. Average values of several-day periods published thirty years ago [25] revealed 35S activities in atmospheric air (both attached to aerosols and as SO2 gas) between about 0.107 and 0.225 MBq/km3. Another available data collection includes atmospheric 35S activities recorded in Germany and Norway between 1970 and 1979 [37]. These datasets revealed activities ranging between about 0.01 MBq/km3 and 0.09 MBq/km3 with an overall mean of 0.034 MBq/km3. However, we consider this data less representative for the troposphere, i.e., our realm of interest, since all air samples were taken at ground level.
Based on the little available information given above, we assume for further estimations an average 35S activity in the precipitation-influenced part of the troposphere over Central Europe of 0.1 MBq/km3. For approximately assessing the impact of anthropogenic gaseous radiosulfur release on the overall 35S inventory of this part of the troposphere, we roughly estimated the atmospheric 35S inventory over Germany for the lower 10 km of the atmosphere (i.e., the layer that is subject to both 35S removals by meteoric water and 35S potential input by anthropogenic activities). If an averaged atmospheric activity of 0.1 MBq/km3 is assumed, the atmospheric 35S inventory over West Germany (with an area of about 249 × 103 km2) sums up to about 249 GBq. Balancing the decay of this activity requires an overall 35S import of 720 GBq/a. This approximate 35S import estimation reveals that the anthropogenic share of it (24.7 ± 6.8 GBq/a as shown above) equals only about 3.4% of the overall 35S input. Even though this estimation is very approximate, we can conclude that anthropogenic 35S release is generally insignificant for the application of 35S as a naturally occurring aqueous tracer. However, as we demonstrate in our study and discuss in more detail below, the possibility of unusual anthropogenic peak releases has nevertheless to be considered.
3. Results
3.1. Cross-Evaluation of the Recorded Time Series
The following five data time series (as introduced above) were recorded simultaneously over a twelve-month period and cross-evaluated: (i) precipitation intensity, (ii) 35S in the rain, (iii) 7Be in air, (iv) 212Pb in air, and (v) AOD at wavelengths 1640 and 1020 nm. The time series (i) and (ii) were recorded and evaluated as discrete values reflecting individual rain events; the time series (iii), (iv) and (v) were obtained as daily values and evaluated as 15-day moving averages. All datasets were collected in Germany; time series (i), (ii) and (v) in the vicinity of the city of Leipzig; time series (iii) and (iv) at CTBTO station RN33, located in the Black Forest Mountains. Due to the immense spatial scale of the investigated atmospheric processes (cf. Figure 2), the distance between the two recording stations (ca. 500 km) is of only minor relevance.
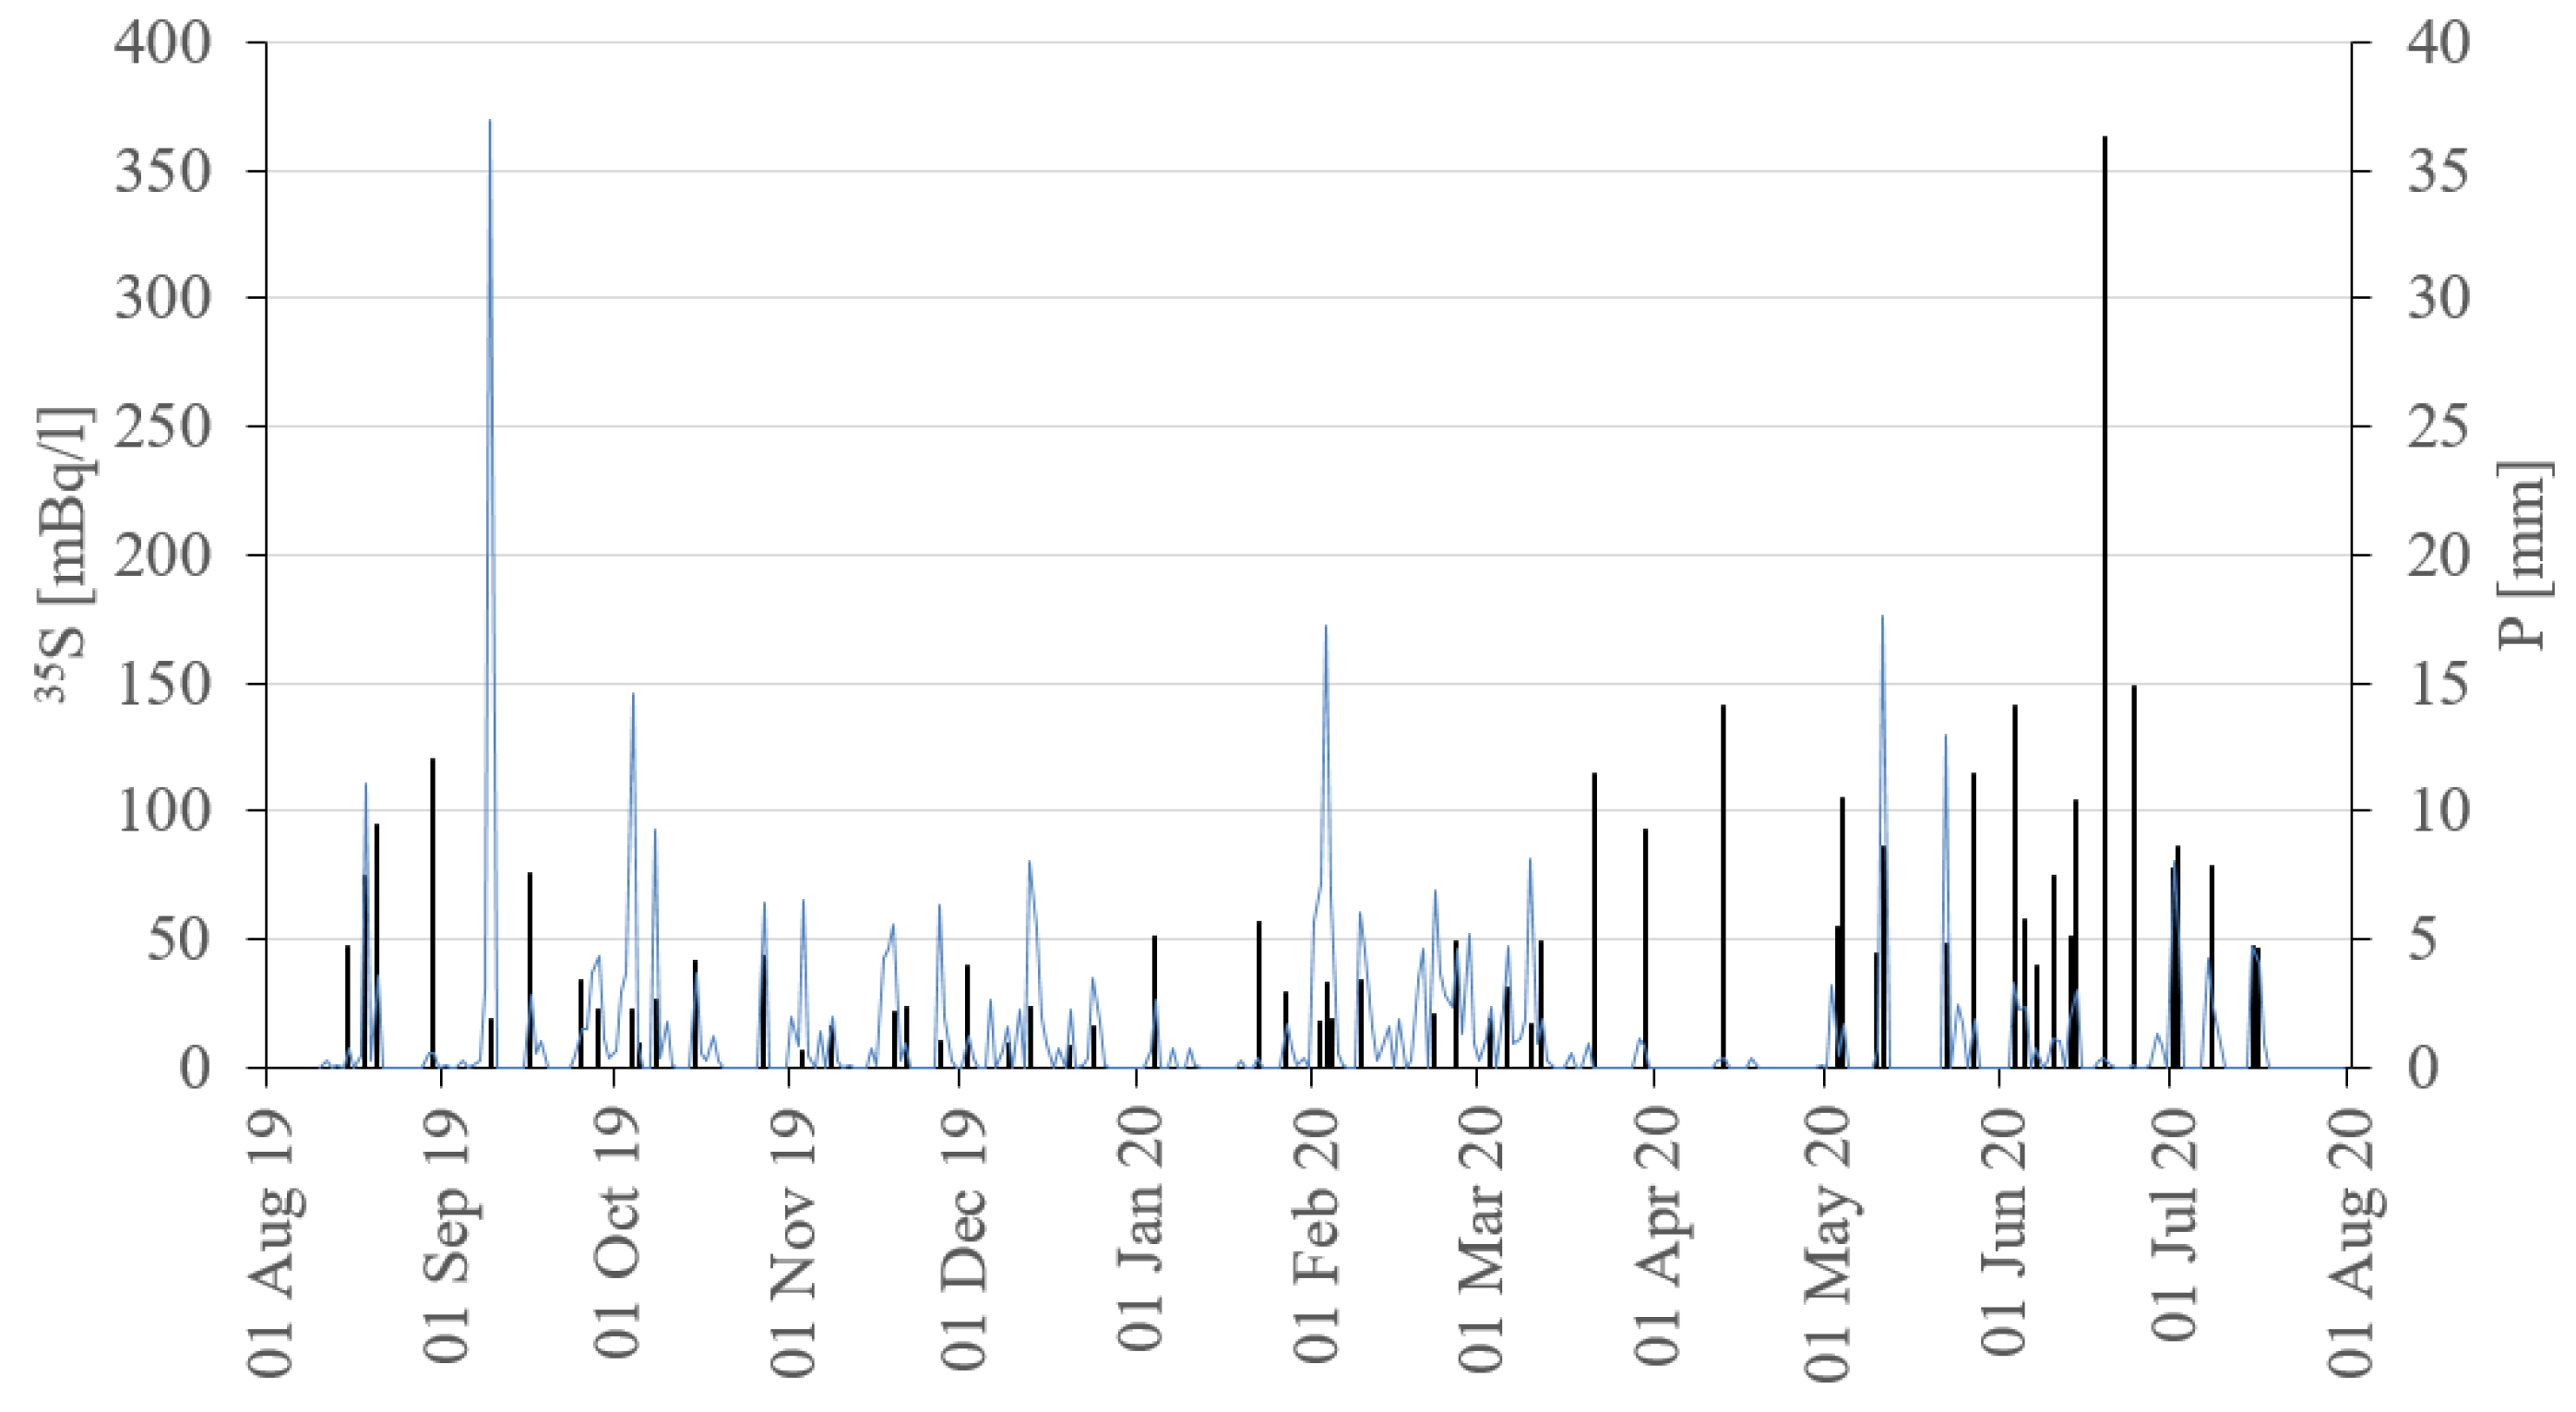
Figure 3 displays the recorded time series (i) rain intensity and (ii) 35S activity concentration in the rain. The plot illustrates that samples for 35S analyses were taken for all major rain events throughout the twelve-month sampling campaign. Furthermore, the figure shows that most rain events (88%) resulted in less than 6.5 mm of precipitation and could be collected quantitatively within the 200-litre HDPE container.
The most intense rain event by far (37 mm) occurred on 9 September 2019 and lasted for the whole day. The related sample represents the rain that fell towards the end of the event. The detected unusually low 35S activity (if compared to the two much less intense rain events that occurred before and after) illustrates the effect of dust and aerosol (and hence 35SO4) washout by the rain during the initial hours of the event, i.e., previous to the event-specific sampling. A similar observation has been made during the major rain event on February 3rd (17.2 mm) that lasted for several hours, too. A sample taken at the beginning of the event showed a 35S activity of 48 mBq/L; a sample taken towards the end of the event contained only 17 mBq/L (the mean value of 33 mBq/L was used related to this event for further evaluations).
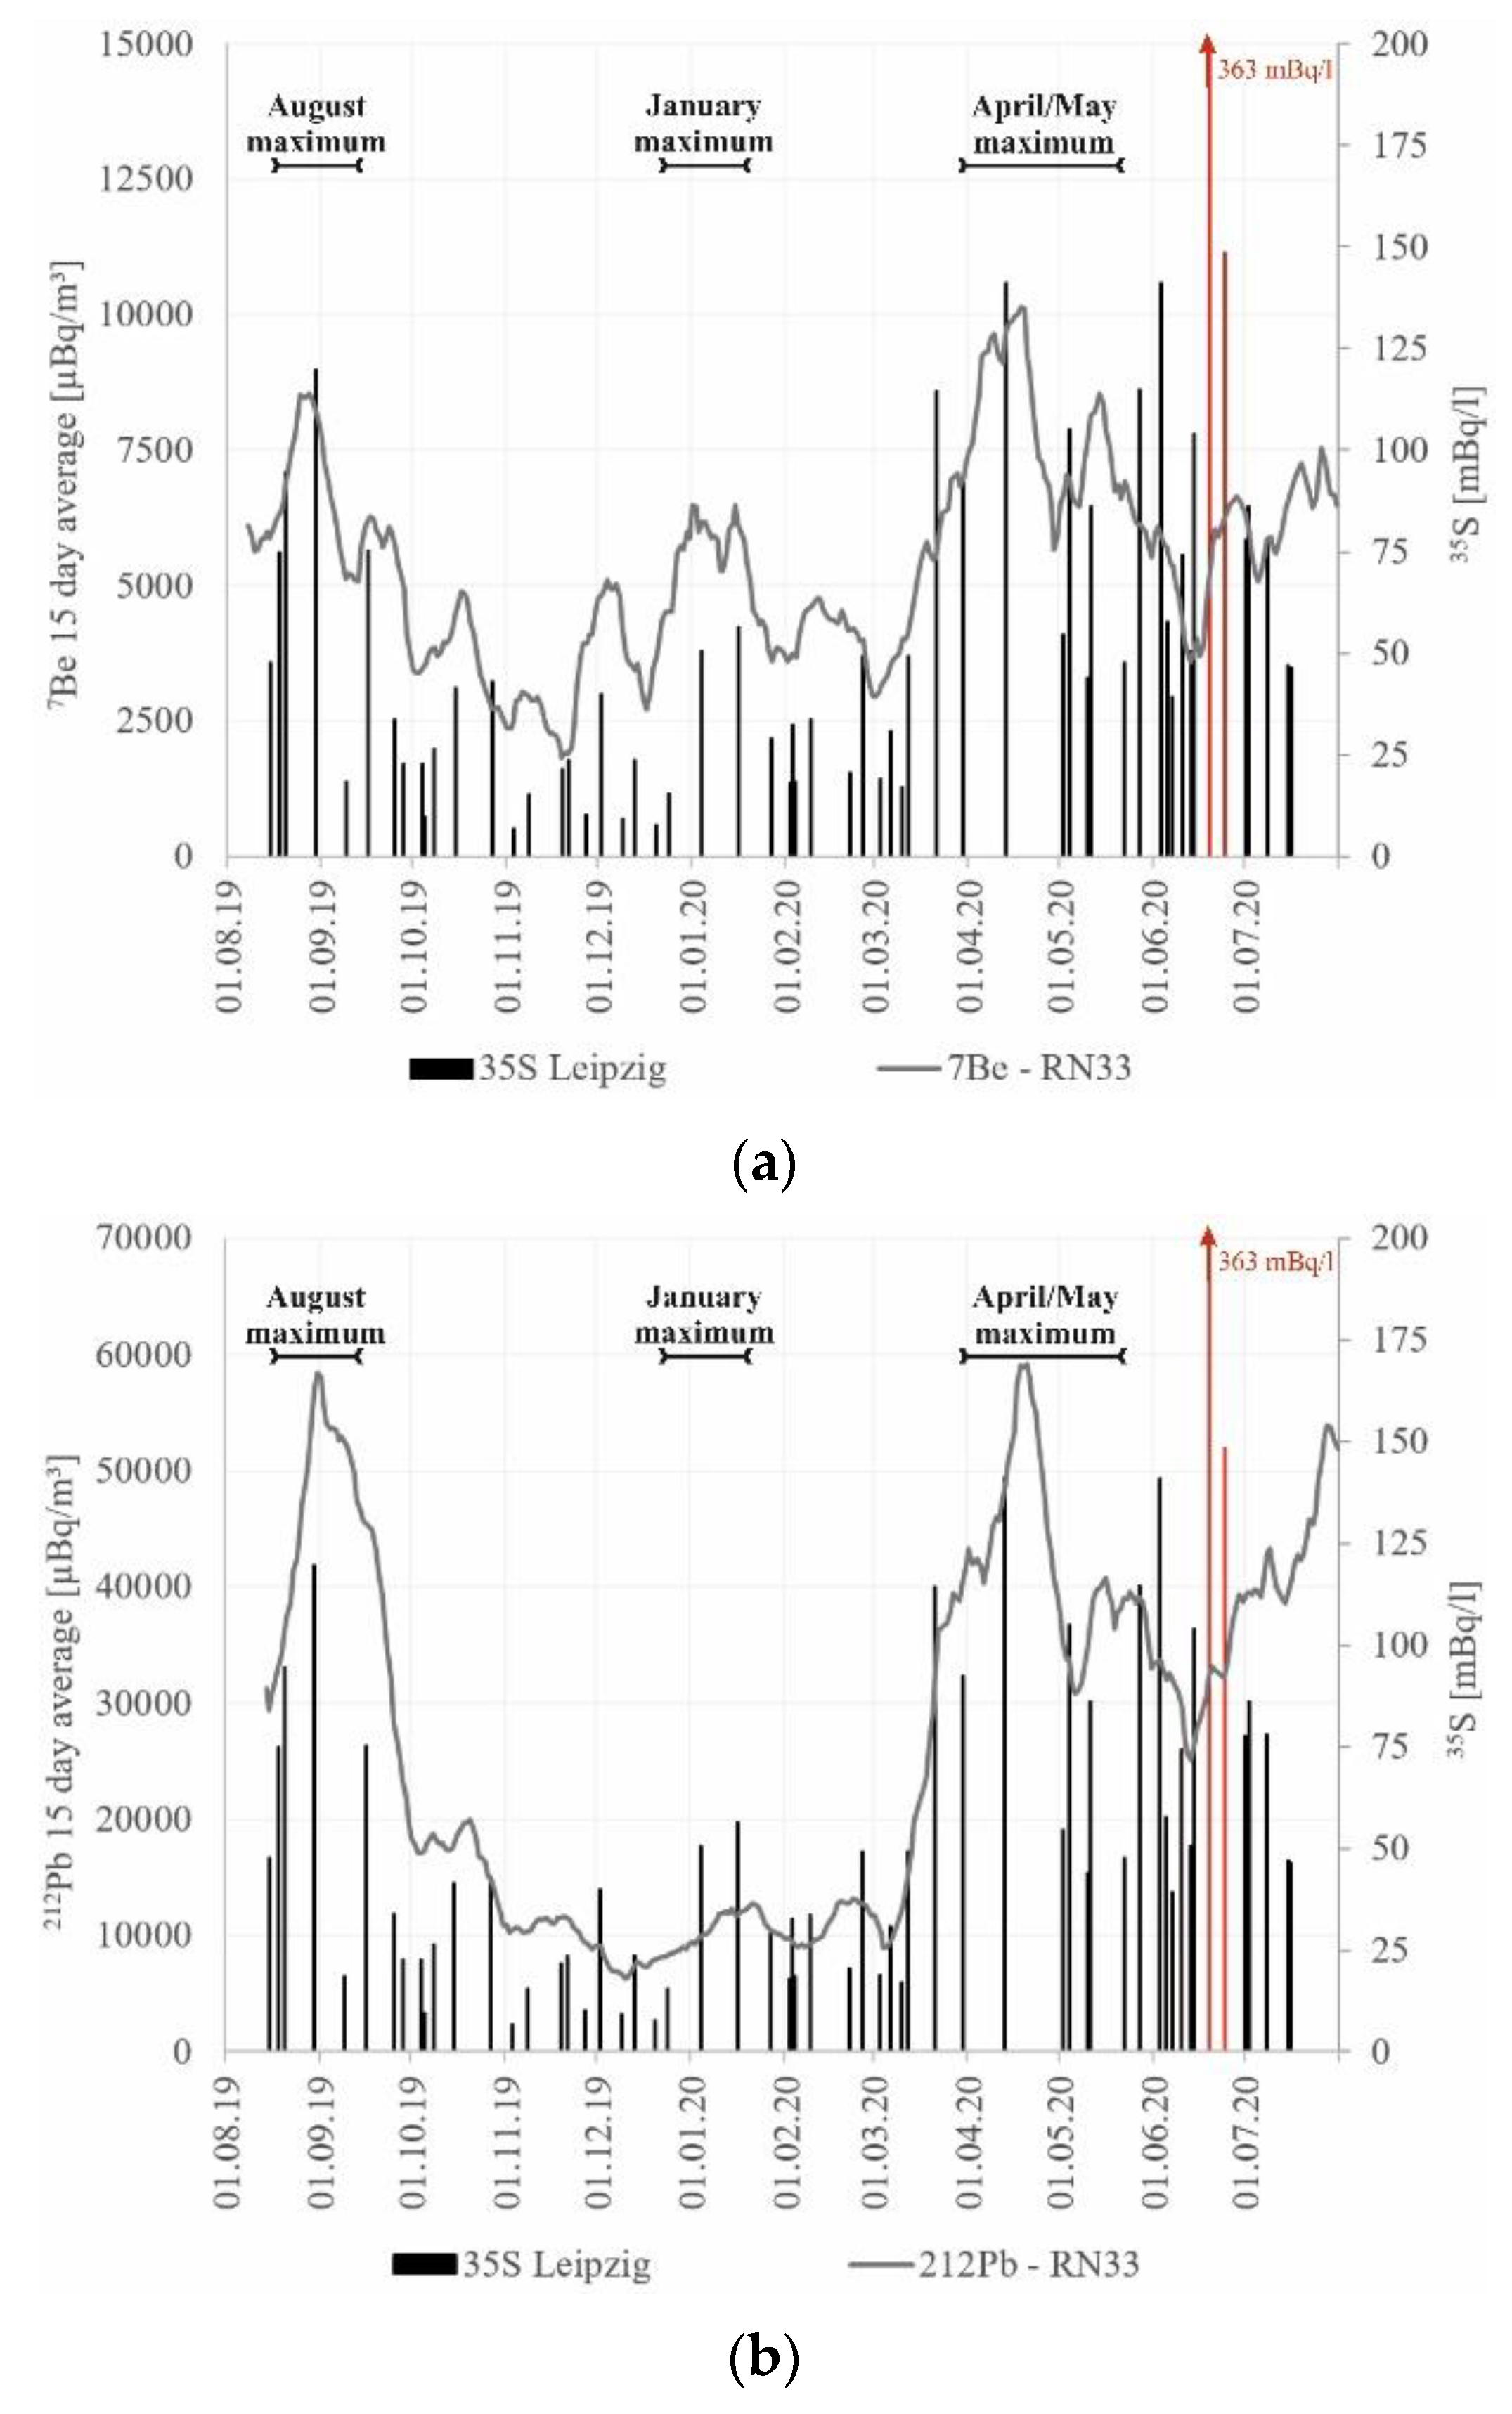
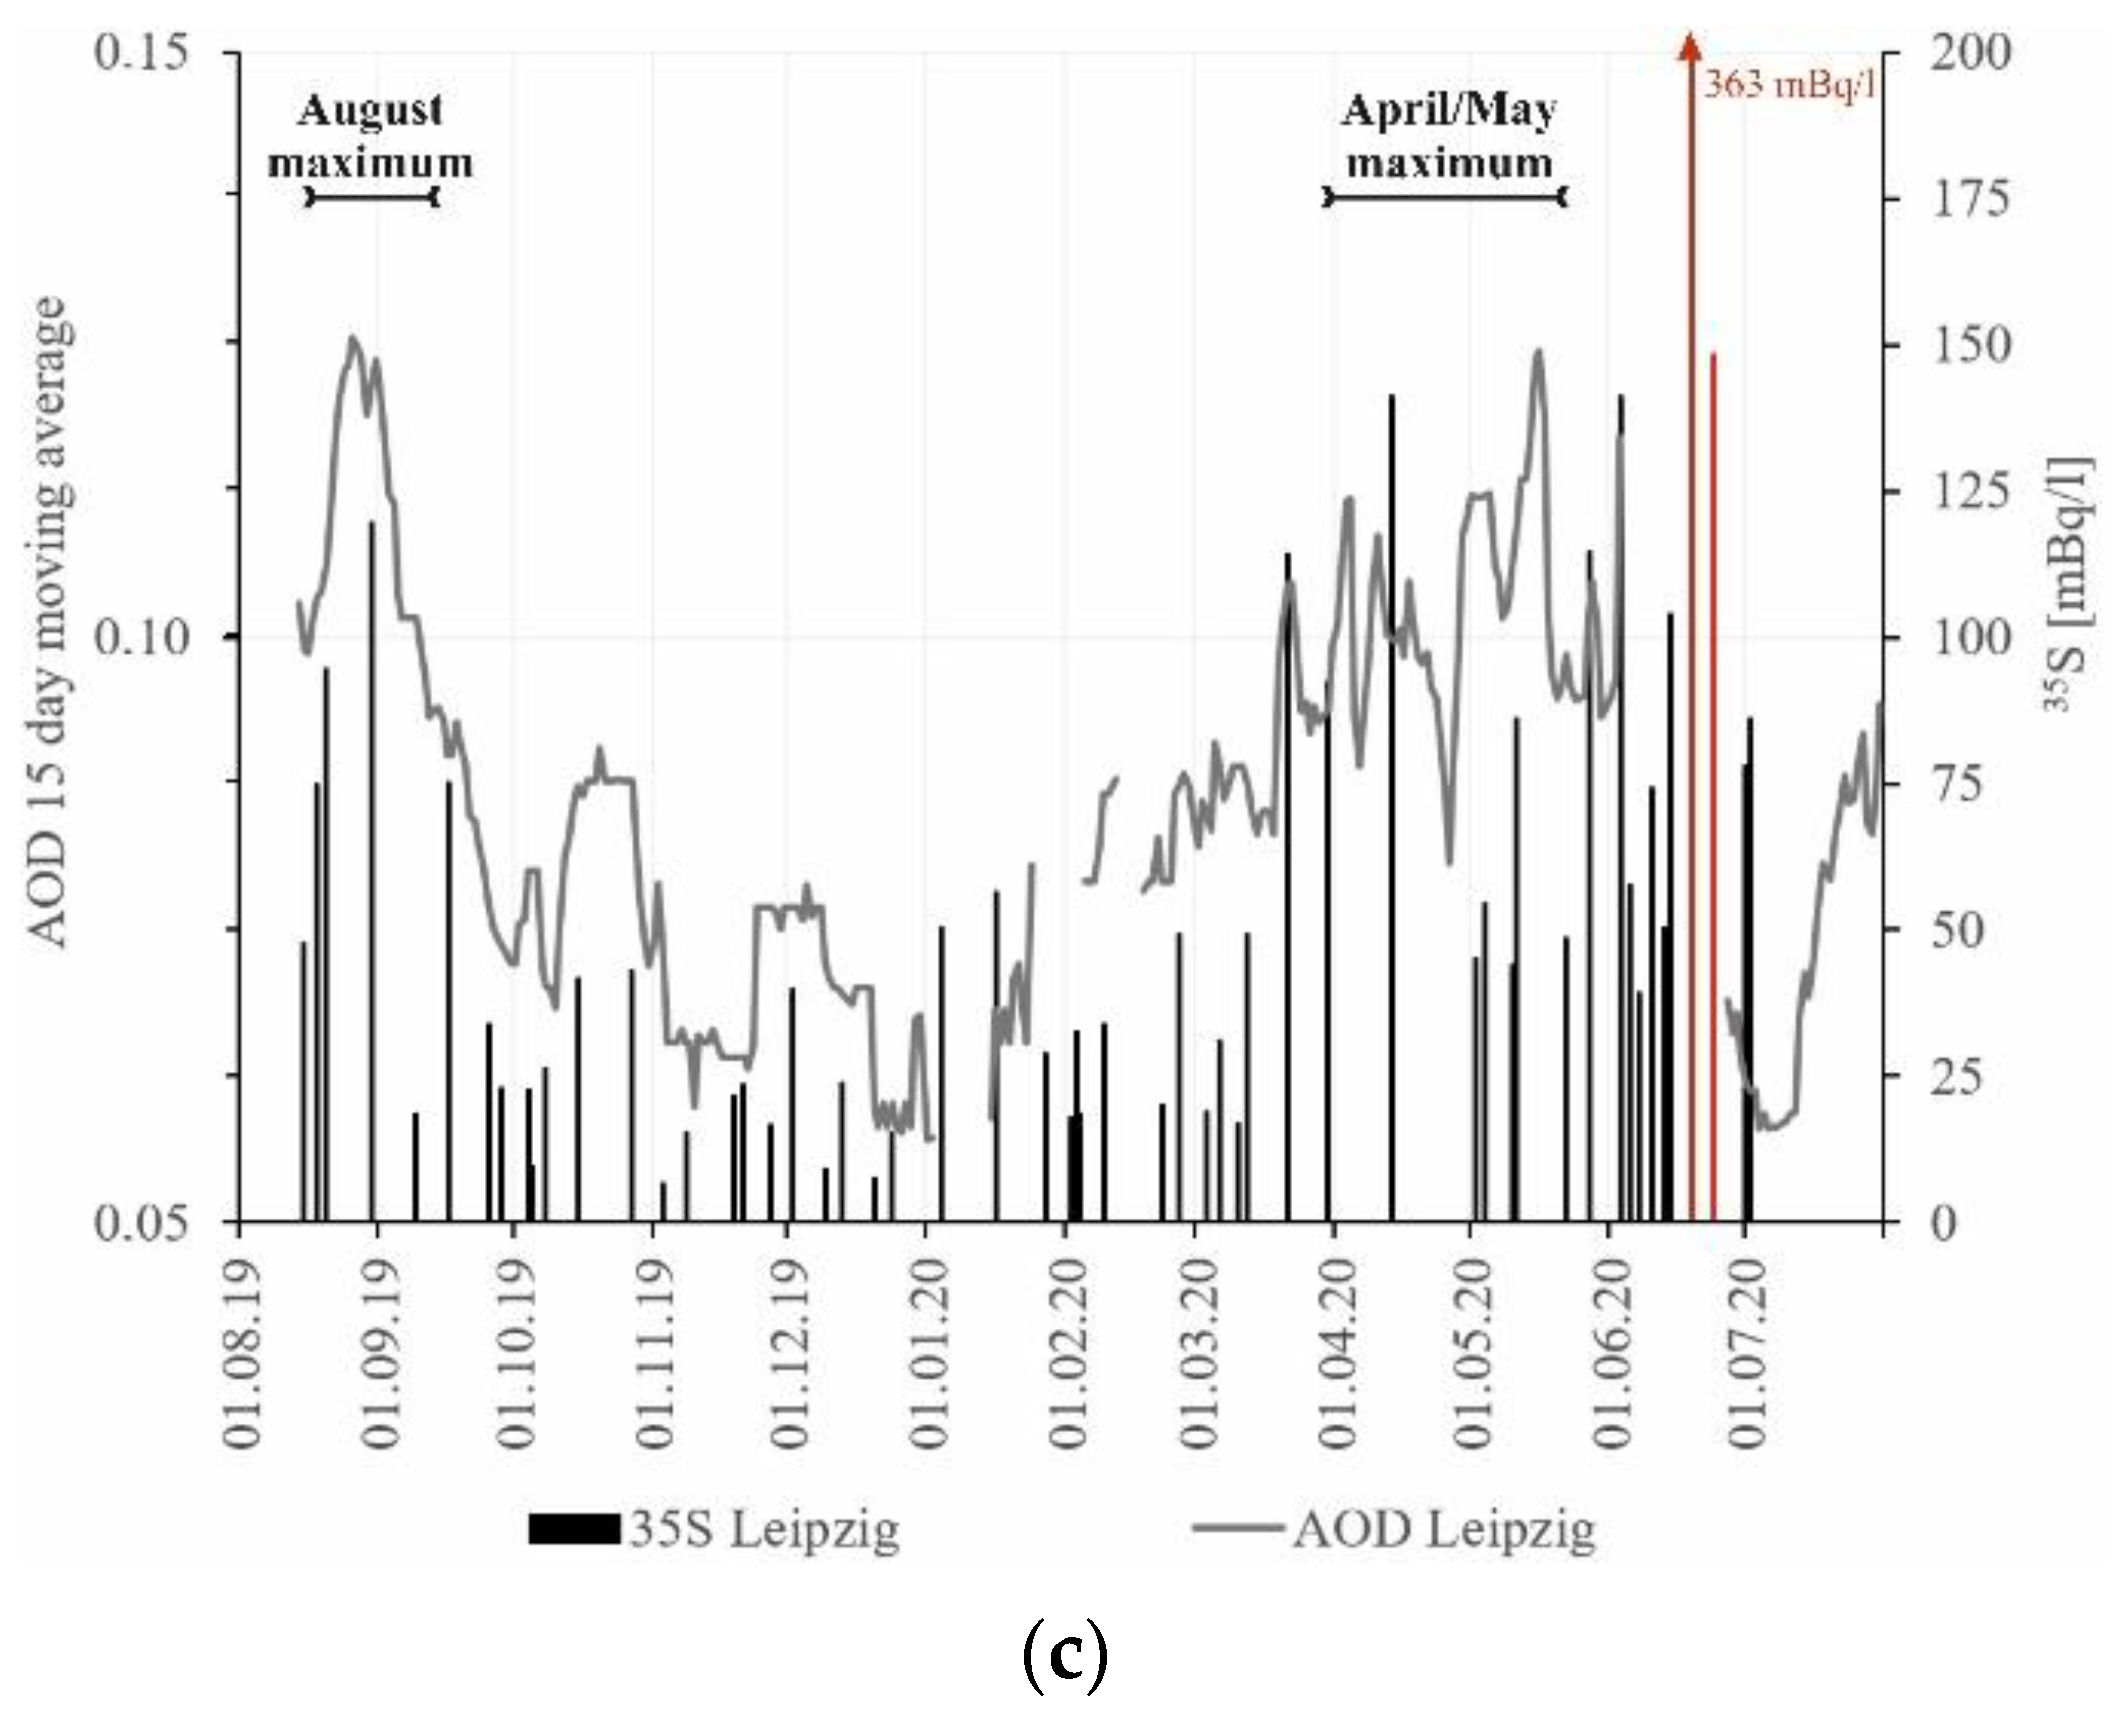
Naturally, the recording of the 35S data was bound to rain events. Due to rather dry conditions, particularly in January 2019 and between mid-March and the end of June 2020, not all periods of the twelve-month monitoring campaign could be documented satisfactorily with 35S samples. Still, the 35S dataset and the continuously recorded time series of 7Be, 212Pb and AOD (Figure 4 and Figure 5; cf. Figure 9) reveal that all four parameters showed maxima in the second half of August 2019 and in April/May 2020. A third less distinct maximum was observed for 35S and 7Be in the first half of January 2020.
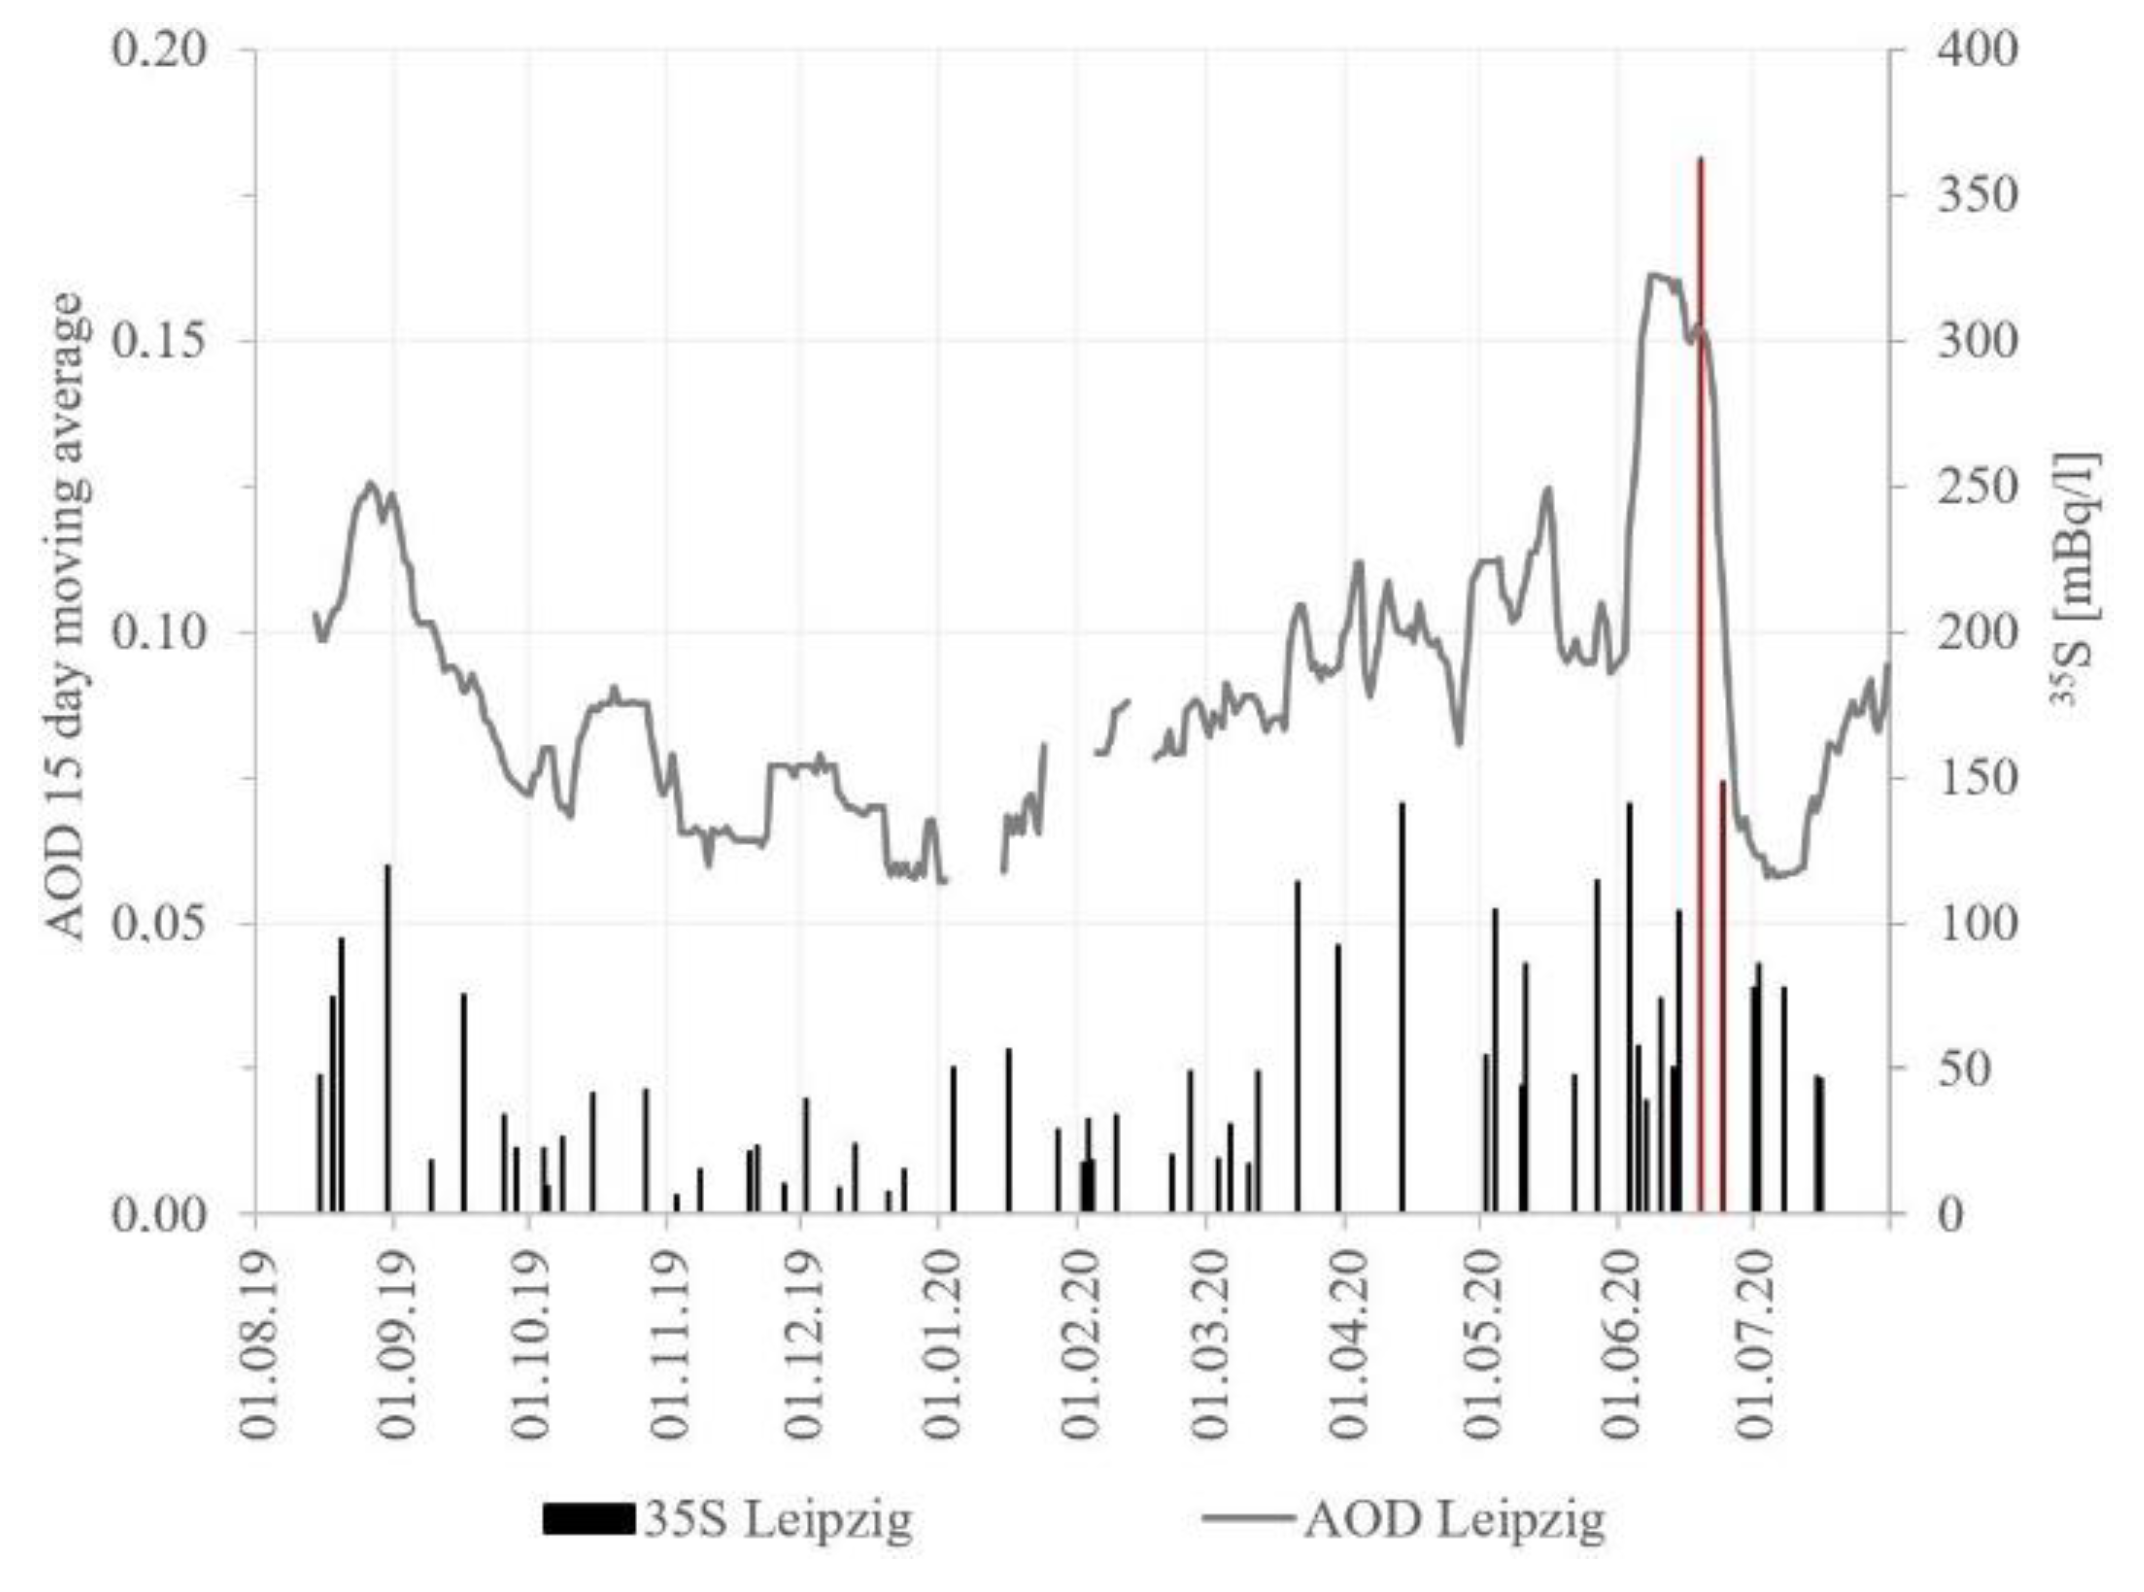
Excluded from this summarizing evaluation is a distinct peak in 35S that was recorded in the second half of June 2020. While 35S showed in the previous months an average value of about 25 mBq/L and reached maximum values around 140 mBq/L, it peaked on 19th June 2020 suddenly at 363 mBq/L declining subsequently to a still considerably high 148 mBq/L (24th June 2020). Figure 4 highlight this event in red. However, in order to illustrate the previous 35S data more clearly, the 35S axis of the three figures is scaled to a maximum value of 200 mBq/L, i.e., the 363 mBq/L peak is not fully shown (it is fully shown in Figure 5, though). Simultaneously to the sudden 35S increase, the AOD rose rather abruptly at the beginning of June. It reached a maximum value of 0.161 (8 June 2020), while the previous top values ranged around 0.125 (this AOD peak is also not shown in Figure 4c but fully displayed in Figure 5. A more detailed look at the AOD dataset reveals that the AOD was dominated by “fine mode” aerosol (90%), which is generally of anthropogenic origin (while “coarse mode” aerosol would rather indicate mineral dust). In contrast to 35S and AOD, 7Be and 212Pb did not show significantly elevated values in the second half of June 2020.
Figure 5 displays the recorded time series 35S and AOD, with the 35S axis scaled to a maximum value of 400 mBq/L; i.e., including the full 35S peak recorded in late June (in red) and also fully displaying the simultaneously recorded (“fine mode” aerosol, i.e., anthropogenic) AOD peak. Back trajectory analysis that allows determining the origin of the related air masses (HYSPLIT Model provided by the Air Resources Laboratory (ARL) of the US National Oceanic and Atmospheric Administration (NOAA)) suggests for the time atmospheric particle transport to the sampling site from the northwest (UK, the Netherlands). However, this general assumption is based on a set of 27 specific back trajectory ensembles (calculated by means of NOAA Hysplit Web Interface), that differ quite substantially in their lateral tracks. In fact, while the end point of all ensembles was defined to be located in Leipzig, Germany (latitude: 51.200000; longitude: 12.200000), the trajectory paths fan out (back in time) in the main to the northwest but with their specific 60 h backward direction starting points scattering over an area ranging in between Brittany in the far southwest (northern France) and the Gdańsk Bay in the far northeast (northern Poland). Hence, their informative value is (at least in the given case) limited. This limitation is, e.g., due to potential vertical mixing of air masses along the way, an uncertainty that is substantially increasing with the backtracking time.
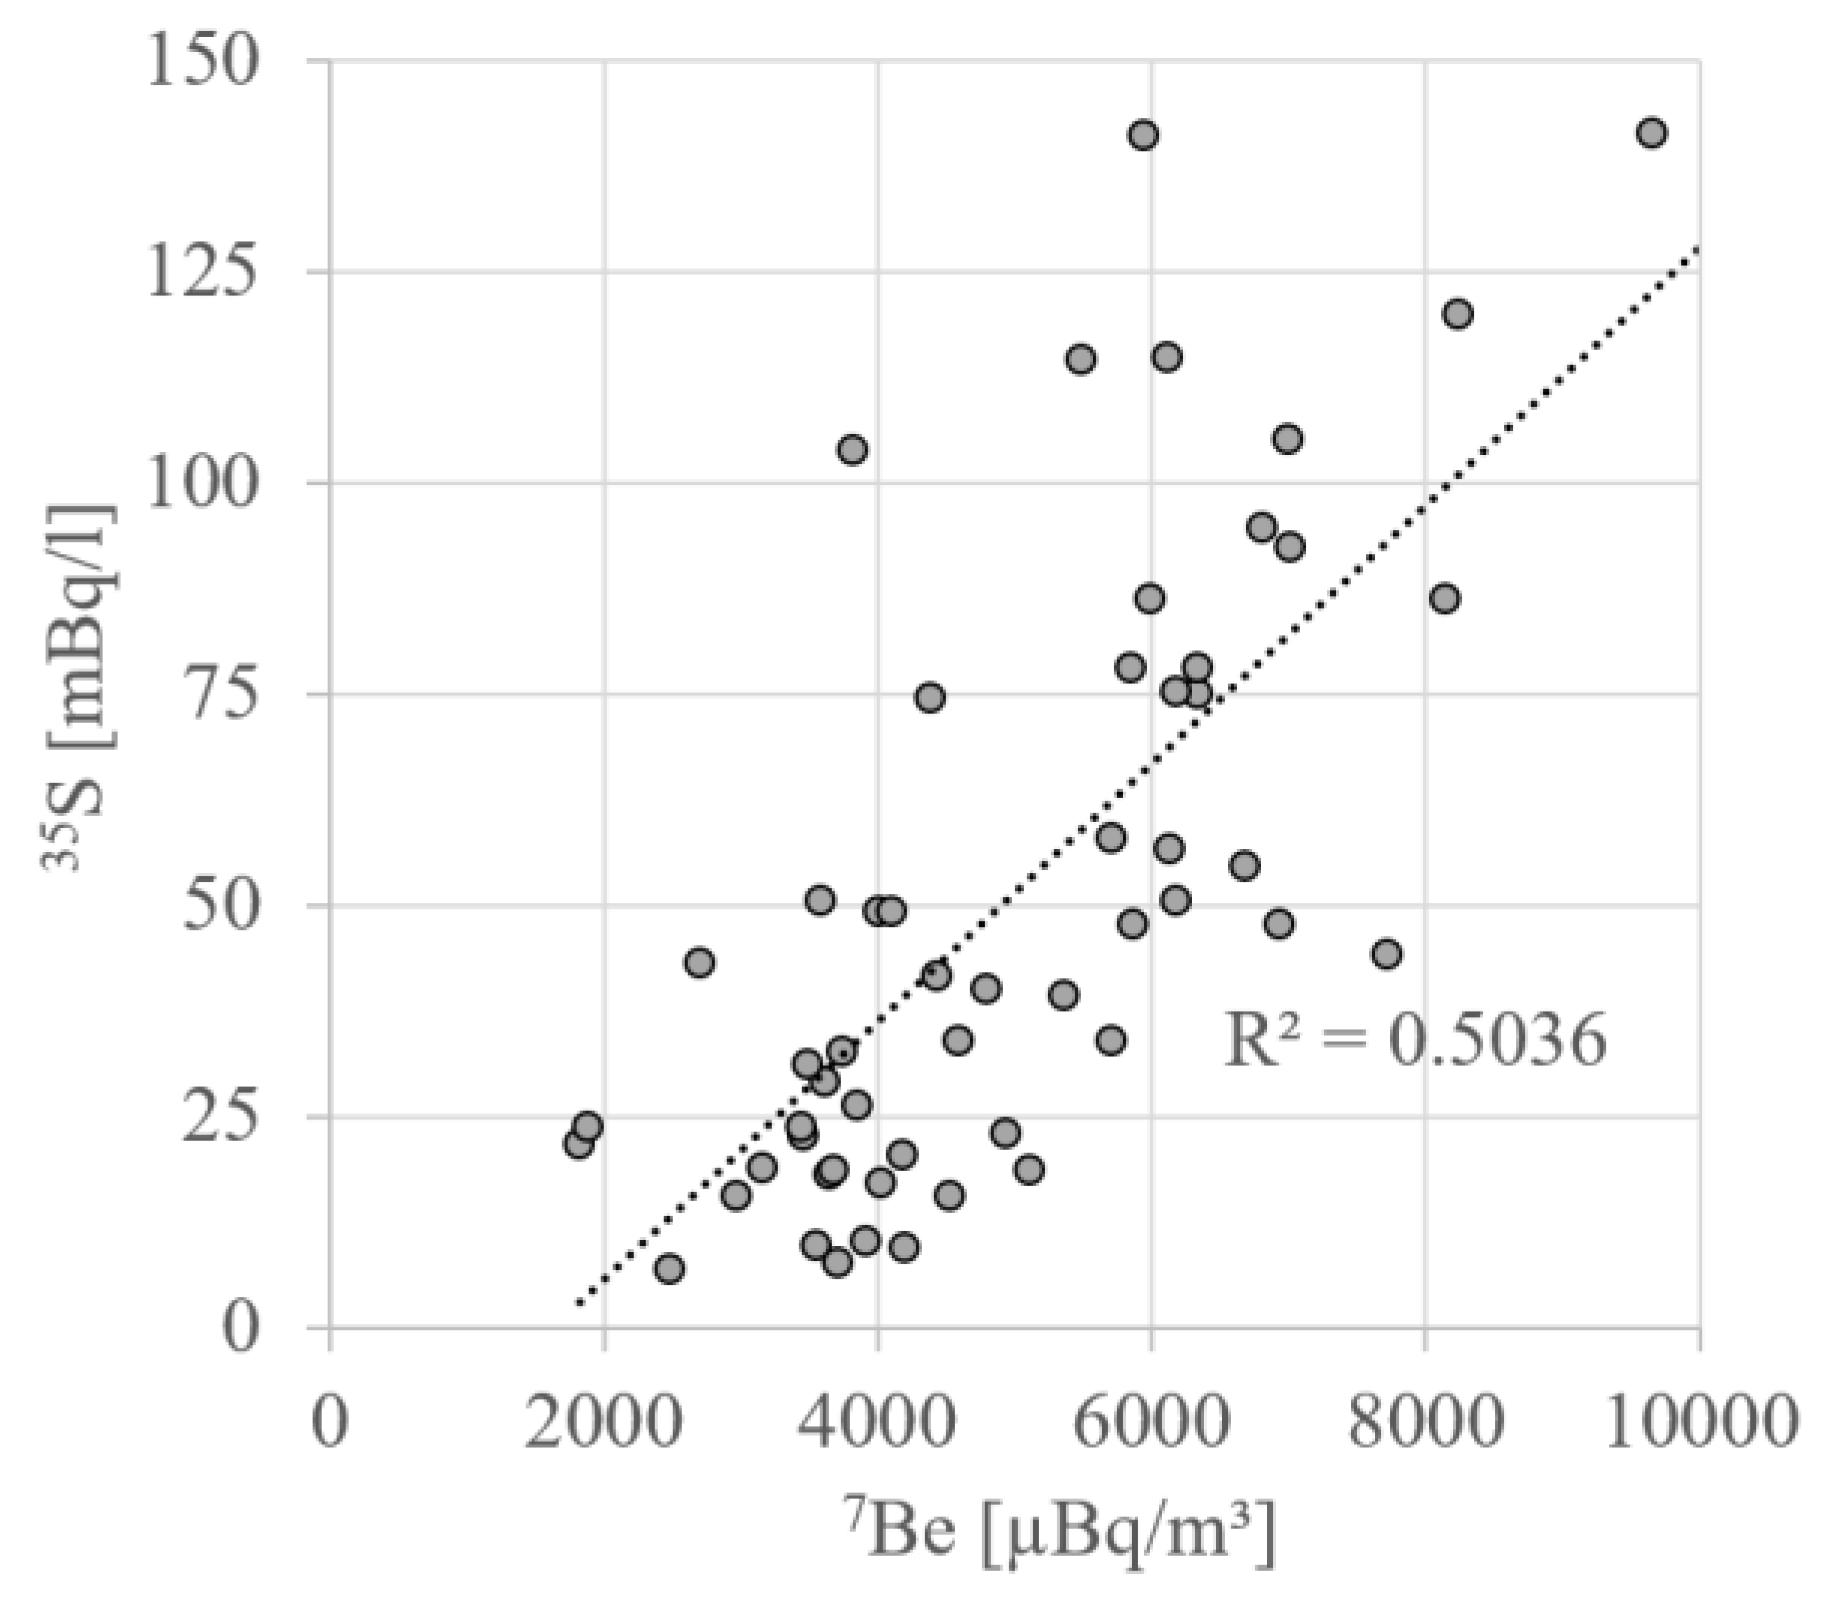
As discussed in Section 2.2, 7Be can be considered a direct proxy for 35S. In general, 35S in rain and 7Be in air correlated reasonably well during the twelve-month period of the study (Figure 4). Still, the resulting correlation coefficient of the recorded twelve-month time series revealed the uncertainty of the information resulting from an evaluation of a 7Be time series (even if supported by 212Pb and AOD datasets) if used as proxy for 35S (Figure 6).
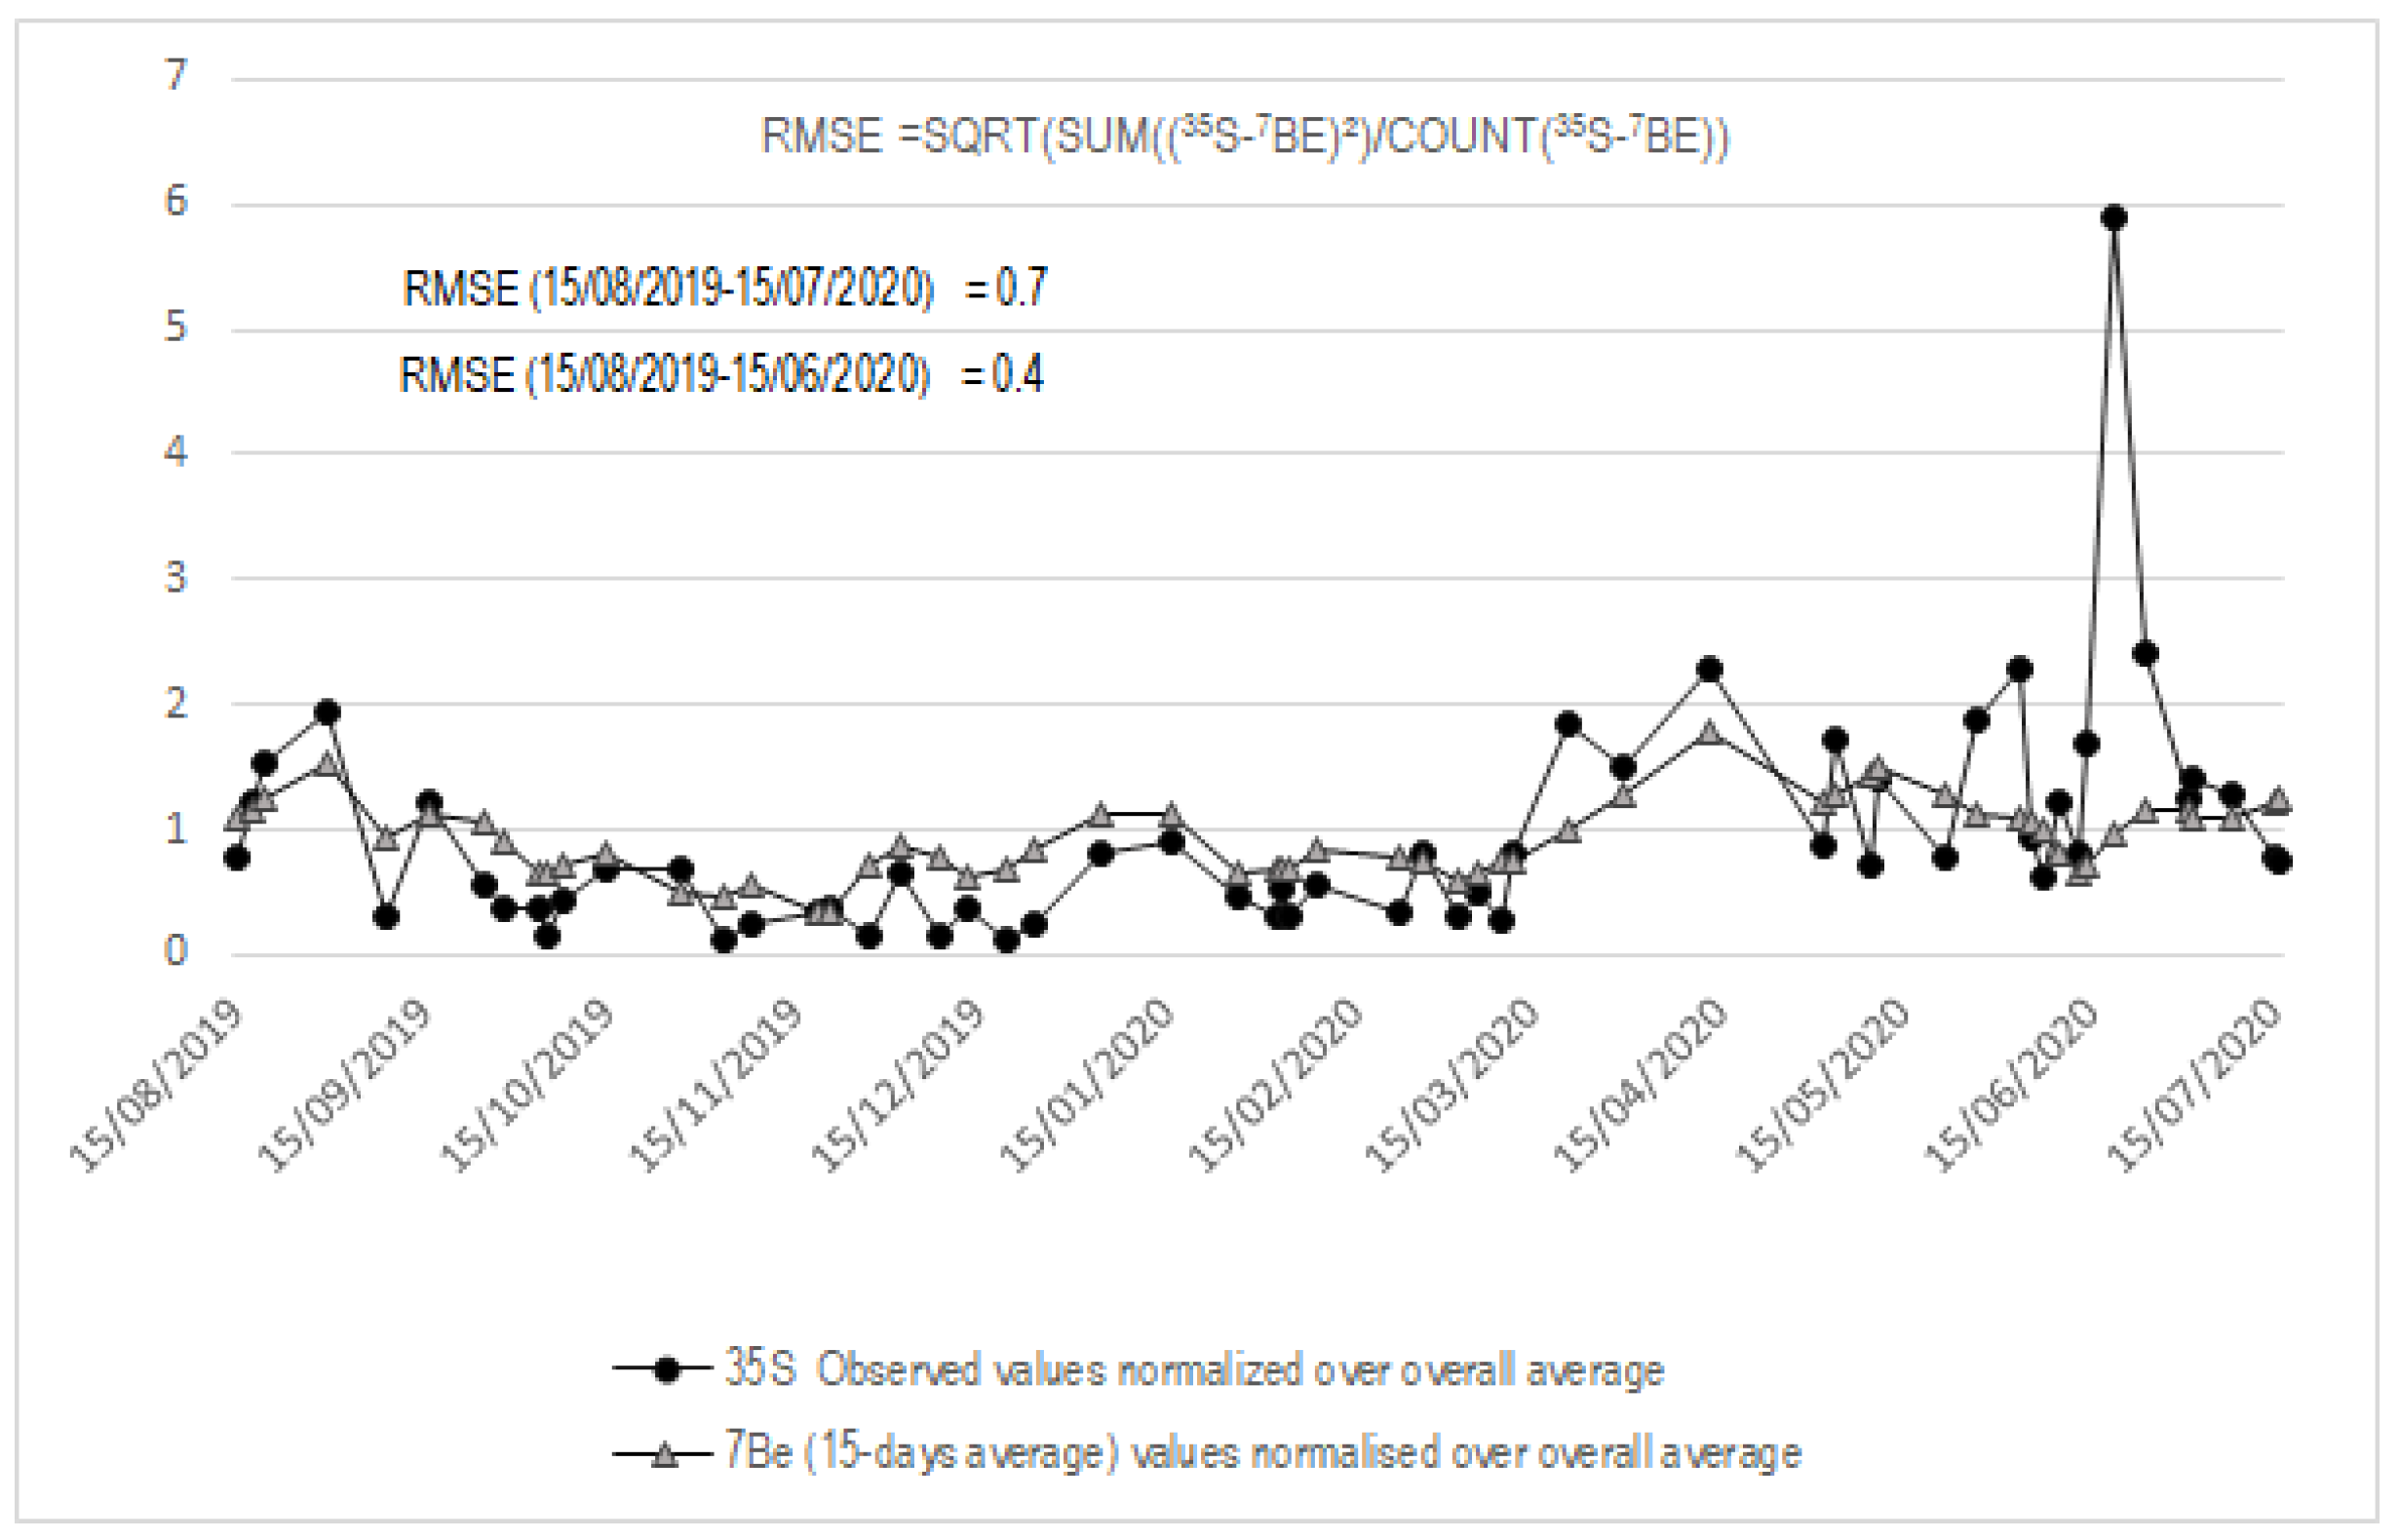
With the aim to improve the predictive power of the recorded 7Be time series, we compared normalized values of the detected 35S time series with normalized values of the 7Be time series (15-day averages), i.e., we compared recorded values with the prediction parameter. Normalization of the individual values was obtained by dividing the individual activity concentrations by the overall average.
As it is shown in Figure 7, both parameters, measured and predicted, followed the same (seasonal) trend during the first 10 months of the campaign. However, from 13–16 June the comparative analysis of both parameters revealed an uncharacteristic behavior of 35S.
While the calculated RMSE of the two time series between 15th August 2019 and 13th June 2020 was 0.4, the RMSE for the complete time series was 0.7. This significantly higher prediction error for the complete period of the measurement campaign was due to the anomalous peak that was observed between June and July 2020.
3.2. Natural Drivers of the Recorded Variations in 35S
The simultaneous maxima of 35S and 7Be recorded in August 2019 and April/May 2020, respectively (Figure 4; cf. Figure 9), indicated a significantly intensified air mass exchange between higher and lower atmosphere during these times. This increased interaction is thought to be bound to two annually recurring processes that trigger an increased aerosol import from the lower stratosphere to the upper troposphere, namely (i) the cyclical altitudinal shift of the tropopause and (ii) the cyclical lateral or latitudinal shift of the HFDZ. In 2019, the HFDZ reached central Germany around late August/September. In 2020 the approach had already occurred in April [38]. This earlier arrival of the HFDZ in 2020 was due to an early northward extension of the Hadley Cell and a corresponding stalling of the jet streams, an effect that is thought to be due to decadal climate variability or/and global warming [13].
Besides these two large-scale atmospheric processes, the less intense washout of 35S and 7Be from the lower atmosphere during the dry season can be named the third reason for the increase of 35S in the rain and 7Be in the air in August 2019 and April/May 2020. The 35S and 7Be datasets alone cannot evaluate the relevance of this effect. However, its substantial impact was revealed by the simultaneous significant increase of the AOD and the even more obvious increase of the 212Pb activity in the air (Figure 4b,c).
The minor increase in 212Pb observed in January 2020 suggests reduced particle washout as the primary reason for the less distinct maxima of 35S and 7Be that were observed simultaneously (AOD data is, unfortunately, missing for these days). During a five-week period starting on 26 December 2019, only minimum amounts of rainfall occurred in the wider area of the rain sampling station (overall 8 mm), thereby building up an increased aerosol concentration within the lower atmosphere.
3.3. Potential Anthropogenic Causes for Recorded Variations in 35S
While the three maxima discussed in Section 3.2 can be associated to natural drivers, the significantly elevated 35S values recorded in June 2020 (displayed in Figure 5) can hardly be explained with natural processes. The unusually high 35S activities, which peaked on June 19th with a value of 363 mBq/L, did not reflect any increase in 7Be, which excludes the stratosphere as the origin of the radiosulfur.
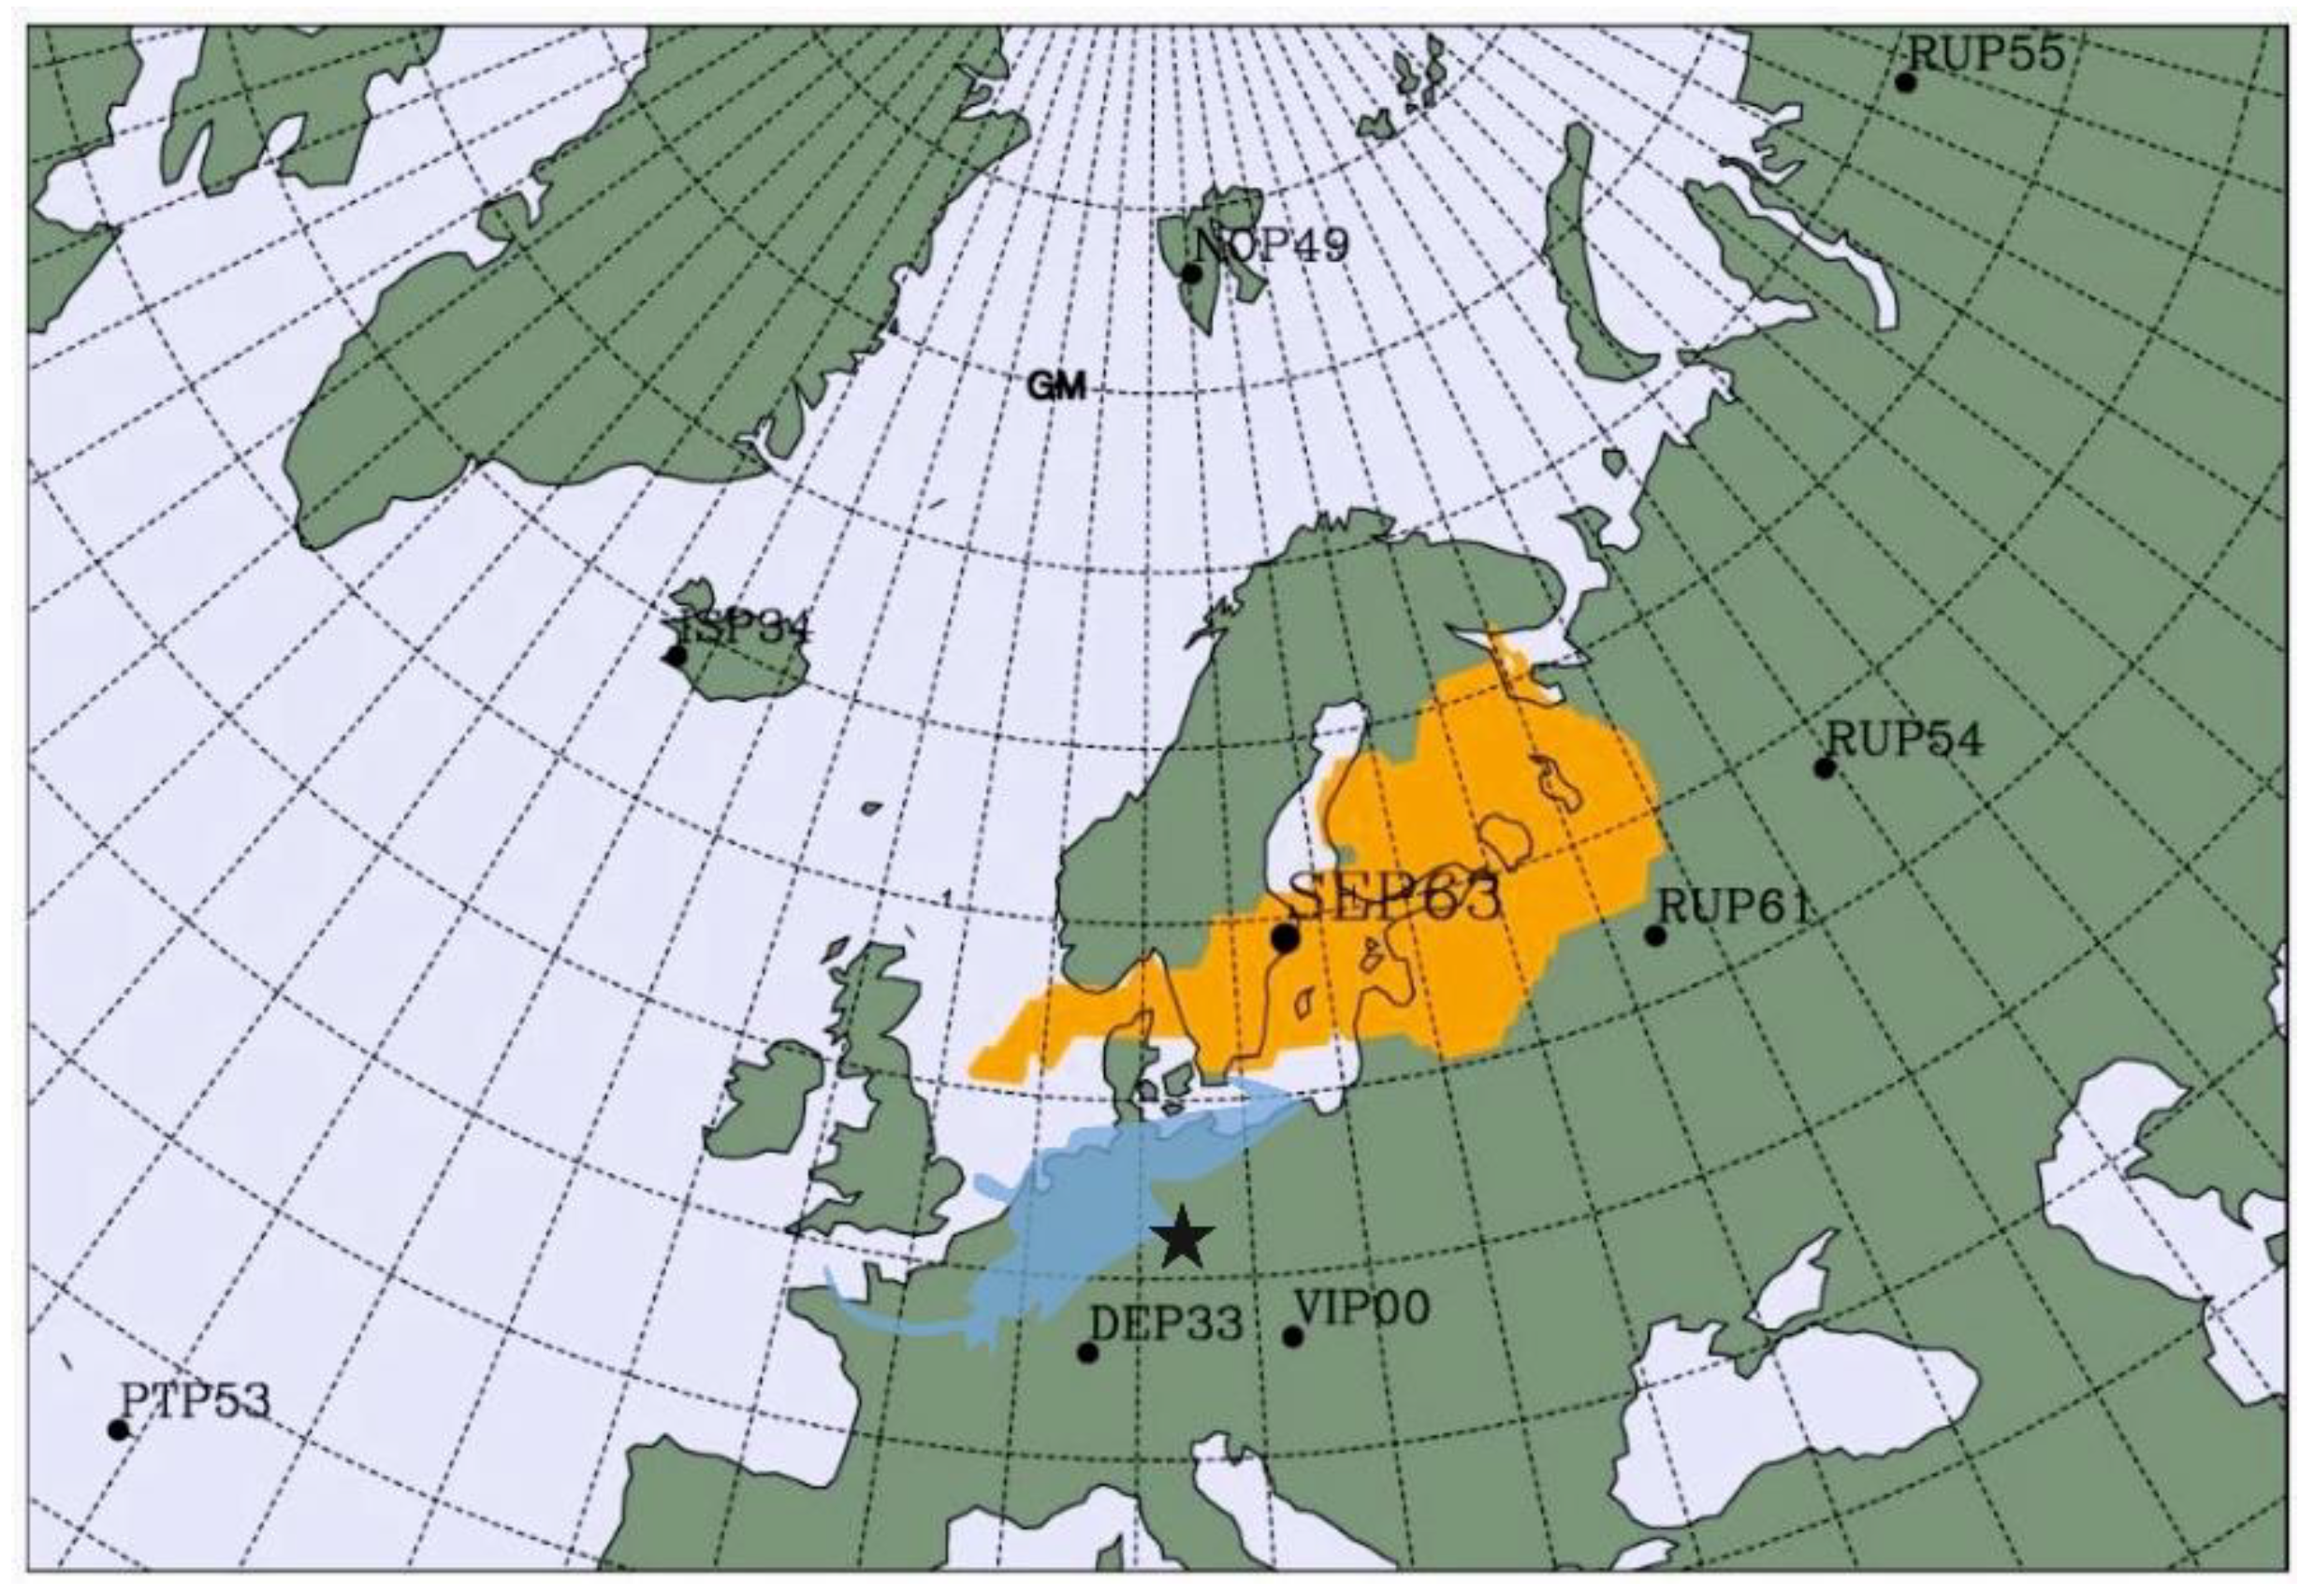
A potential explanation might be derived from related news that was issued in June 2020. Several public media reported at the time that elevated activities of anthropogenic radionuclides (134Cs, 137Cs and 103Ru) had been observed in the lower atmosphere over Northern Europe in mid-June 2020, i.e., simultaneously with the 35S peak in our study (e.g., reported by the CTBTO Executive Secretary Lassina Zerbo, [39]). The unusual activity concentrations had been detected at the CTBTO station RN63 (Stockholm, Sweden) (Figure 8).
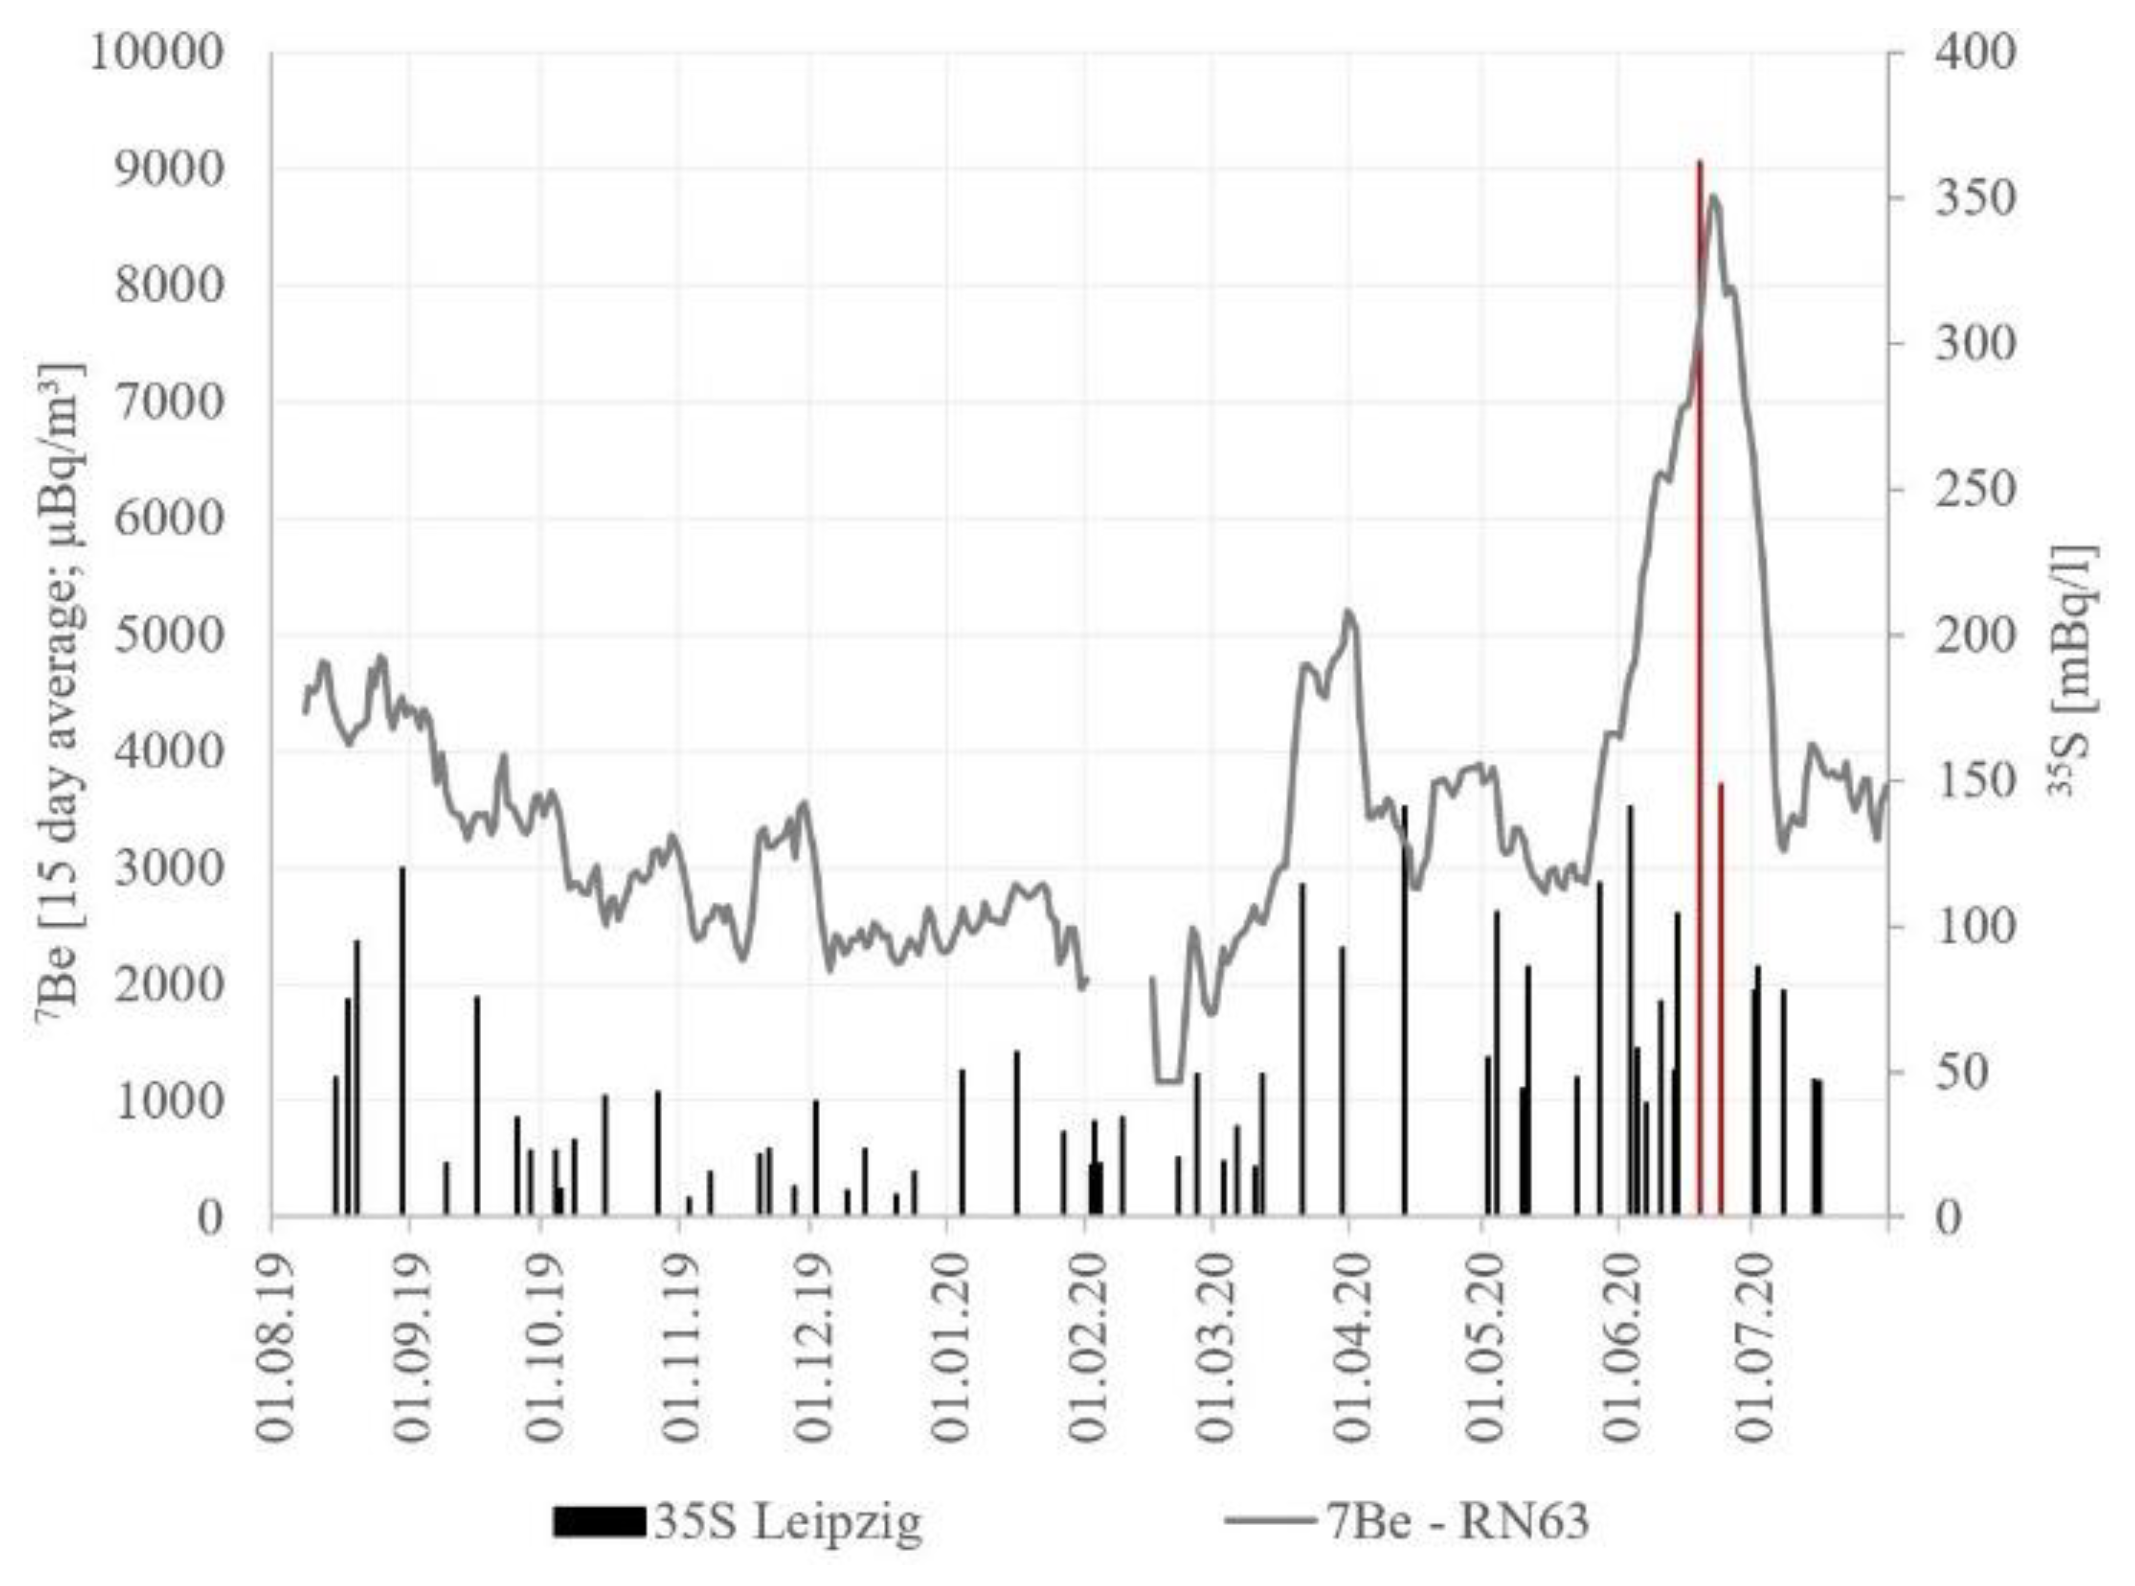
Additionally to the three anthropogenic radionuclides reported by the CTBTO, our own inquiries revealed also an increase in 7Be at the Swedish station RN63 (not at the German station RN33, though) simultaneously to the 35S spike observed in our study (Figure 9). Hence it could be speculated that the CTBTO observation of a minor activity release in Northern Europe points towards the same anthropogenic source responsible for the significantly elevated 35S activities detected in June close to Leipzig. However, evidence for this speculation can neither be provided based on the detected nuclide pattern nor on the modelled 60 h back trajectory ensembles discussed in Section 3.1, which do not overlap with the possible source region as detected by the CTBTO (even though the overall northern direction is the same). Furthermore, we cannot explain, why this observed 35S spike correlates with distinctly elevated AOD values recorded at the Leipzig AERONET site (cf. Figure 5).
4. Conclusions
The aims of our study were (i) to identify the drivers of the long-term variation of the 35S activity concentration in rain and (ii) to evaluate the applicability of the routinely recorded 7Be in air as proxy for setting up a 35S input function that allows the use of 35S as a groundwater residence time tracer. Our twelve-month sampling campaign results reveal that the time series of both 35S and 7Be show generally comparable yearly patterns with elevated values during the warm season. This pattern can be explained with two large-scale seasonal atmospheric processes: (i) the cyclical altitudinal shift of the tropopause and (ii) the cyclical latitudinal shift of the HFDZ. Additionally, the evaluated time series of 212Pb in air and AOD revealed a noteworthy impact of (iii) reduced aerosol washout from the lower atmosphere by rain during the dry season.
Hence, if a groundwater study is to be executed to use 35S as aqueous residence time tracer, we recommend the analysis of at least a few recent rain samples for their 35S activity concentration and set up a 35S input function based on these specific values, considering the general long-term pattern of higher 35S activities in summer and lower 35S activities in winter as indicated by regionally recorded datasets of 7Be, 212Pb and AOD. As a rough estimate we found the 35S activity concentrations during the summer about three times as high as during the winter.
Furthermore, we recommend paying attention to the available time series of anthropogenic radionuclides recorded at CTBTO stations located in the wider area of the study site to become aware of any potential anthropogenic 35S releases.
As the uncertainty in the input function will propagate into the calculation of the water age and age distribution patterns, it needs to be investigated further. Two key issues should be in focus in this regard: (i) dry deposition of 35S and its impact on the input function and (ii) impact of rain duration and intensity on the 35S activity (as shown for 22Na by [40]).
Finally, we want to point out that each rain sample taken to set up a 35S input function should represent the complete rain event. Long-lasting rains can result in a successive decrease in the 35S activity concentration due to a washout of 35SO4 containing dust and aerosols.
Author Contributions
Conceptualization: M.S.; Data curation: M.S., L.T.; Investigation: M.S., K.K.; Methodology: M.S.; L.T., I.T.; Project administration: K.K.; Writing original draft: M.S.; Writing review & editing: M.S. All authors have read and agreed to the published version of the manuscript.
Funding
This research received no external funding.
Conflicts of Interest
The authors declare no conflict of interest.
References
- Treutler, H.C.; Just, G.; Schubert, M.; Weiß, H. Radon as tracer for the determination of mean residence times of groundwater in decontamination reactors. J. Radioanal. Nucl. Chem. 2007, 272, 583–588. [Google Scholar] [CrossRef]
- Schmidt, A.; Gibson, J.J.; Santos, I.R.; Schubert, M.; Tattrie, K.; Weiss, H. The contribution of groundwater discharge to the overall water budget of two typical Boreal lakes in Alberta/Canada estimated from a radon mass balance. Hydrol. Earth Syst. Sci. 2010, 14, 79–89. [Google Scholar] [CrossRef] [Green Version]
- Petermann, E.; Gibson, J.J.; Knöller, K.; Pannier, T.; Weiß, H.; Schubert, M. Determination of groundwater discharge rates and water residence time of groundwater-fed lakes by stable isotopes of water (δ18O, δ2H) and radon (222Rn) mass balances. Hydrol. Process. 2018, 32, 805–816. [Google Scholar] [CrossRef]
- Moore, W.S.; de Oliveira, J. Determination of residence time and mixing processes of the Ubatuba, Brazil, inner shelf waters using natural Ra isotopes. Estuar. Coast. Shelf Sci. 2008, 76, 512–521. [Google Scholar] [CrossRef]
- Rocha, C.; Wilson, J.; Scholten, J.; Schubert, M. Retention and fate of groundwater-borne Nitrogen in a coastal bay (Kinvarra Bay, Western Ireland) during summer. Biogeochemistry 2015, 125, 275–299. [Google Scholar] [CrossRef]
- Lal, D.; Peters, B. Cosmic Ray Produced Radioactivity on the Earth. Kosmische Strahlung II/Cosmic Rays II. Handb. Phys. Encycl. Phys. 1962, 9, 551–612. [Google Scholar]
- Koch, D.; Rind, D. 10Be/7Be as a tracer for atmospheric transport. J. Geophys. Res. 1998, 103, 3907–3917. [Google Scholar] [CrossRef]
- Tilley, D.R.; Cheves, C.; Godwin, J.; Hale, G.; Hofmann, H.; Kelley, J.; Sheu, C.; Weller, H. Energy levels of light nuclei A = 5, 6, 7. Nucl. Phys. A 2002, 708, 3–163. [Google Scholar] [CrossRef]
- Kusmierczyk-Michulec, J.; Gheddou, A.; Nikkinen, M. Influence of precipitation on 7Be concentrations in air as measured by CTBTO global monitoring system. J. Environ. Radioact. 2015, 144, 140–151. [Google Scholar] [CrossRef]
- Terzi, L.; Kalinowski, M. World-wide seasonal variation of 7Be related to large-scale atmospheric circulation dynamics. J. Environ. Radioact. 2017, 178–179, 1–15. [Google Scholar] [CrossRef]
- Landis, J.D.; Renshaw, C.E.; Kaste, J.M. Quantitative retention of atmospherically deposited elements by native vegetation is traced by the fallout radionuclides 7Be and 210Pb. Environ. Sci. Technol. 2014, 48, 12022–12030. [Google Scholar] [CrossRef] [PubMed]
- Kaste, J.M.; Baskaran, M. Meteoric 7Be and 10Be as process tracers in the environment. In Handbook of Environmental Geochemistry; Baskaran, M., Ed.; Springer: Berlin/Heidelberg, Germany, 2012; pp. 61–85. [Google Scholar]
- Terzi, L.; Wotawa, G.; Schoeppner, M.; Kalinowski, M.; Saey, P.R.J.; Steinmann, P.; Luan, L.; Staten, P.W. Radioisotopes demonstrate changes in global atmospheric circulation possibly caused by global warming. Sci. Rep. 2020, 10, 10695. [Google Scholar] [CrossRef] [PubMed]
- Lin, M.; Thiemens, M.H. Accurate Quantification of Radiosulfur in Chemically Complex Atmospheric Samples. Anal. Chem. 2018, 90, 2884–2890. [Google Scholar] [CrossRef] [PubMed]
- Tanaka, N.; Turekian, K.K. Use of cosmogenic 35S to determine the rates of removal of atmospheric SO2. Nature 1991, 352, 226–228. [Google Scholar] [CrossRef]
- Urióstegui, S.H.; Bibby, R.K.; Esser, B.K.; Clark, J.F. Analytical Method for Measuring Cosmogenic 35S in Natural Waters. Anal. Chem. 2015, 87, 6064–6070. [Google Scholar] [CrossRef] [Green Version]
- Cho, H.-M.; Hong, Y.-L.; Kim, G. Atmospheric depositional fluxes of cosmogenic 35S and 7Be: Implications for the turnover rate of sulfur through the biosphere. Atmos. Environ. 2011, 45, 4230–4234. [Google Scholar] [CrossRef]
- Hong, Y.; Kim, G. Measurement of Cosmogenic 35S Activity in Rainwater and Lake Water. Anal. Chem. 2005, 77, 3390–3393. [Google Scholar] [CrossRef]
- Osaki, S.; Tagawa, Y.; Chijiiwa, T.; Sugihara, S.; Maeda, Y. Atmospheric deposition of 35S. J. Radioanal. Nucl. Chem. 1999, 239, 543–547. [Google Scholar] [CrossRef]
- Michel, R.L.; Campbell, D.; Clow, D.; Turk, J.T. Timescales for migration of atmospherically derived sulphate through an alpine/subalpine watershed, Loch Vale, Colorado. Water Resour. Res. 2000, 36, 27–36. [Google Scholar] [CrossRef]
- Sueker, J.K.; Turk, J.T.; Michel, R.L. Use of cosmogenic 35S for comparing ages of water from three alpine/subalpine basins in the Colorado Front Range. Geomorphology 1999, 27, 61–74. [Google Scholar] [CrossRef]
- Visser, A.; Thaw, M.; Deinhart, A.; Bibby, R.; Safeeq, M.; Conklin, M.; Esser, B.; van der Velde, Y. Cosmogenic isotopes unravel the hydrochronology and water storage dynamics of the Southern Sierra Critical Zone. Water Resour. Res. 2019, 55, 1429–1450. [Google Scholar] [CrossRef]
- Shanley, J.B.; Mayer, B.; Mitchell, M.J.; Michel, R.L.; Bailey, S.W.; Kendall, C. Tracing sources of streamwater sulphate during snowmelt using S and O isotope ratios of sulphate and 35S activity. Biogeochemistry 2005, 76, 161–185. [Google Scholar] [CrossRef]
- Cooper, L.W.; Olsen, C.R.; Solomon, D.K.; Larsen, I.L.; Cook, R.B.; Grebmeier, J.M. Stable isotopes of oxygen and natural and fallout radionuclides used for tracing runoff during snowmelt in an Arctic watershed. Water Resour. Res. 1991, 27, 2171–2179. [Google Scholar] [CrossRef]
- Turekian, K.K.; Tanaka, N. The use of atmospheric cosmogenic 35S and 7Be in determining depositional fluxes of SO2. Geophys. Res. Lett. 1992, 19, 1767–1770. [Google Scholar] [CrossRef]
- Plummer, L.N.; Busenberg, E.; Bohlke, J.K.; Nelms, D.L.; Michel, R.L. Groundwater residence times in Shenandoah National Park, Blue Ridge Mountains, Virginia, USA: A multi-tracer approach. Chem. Geol. 2001, 179, 93–111. [Google Scholar] [CrossRef]
- Taylor, A.; Keith-Roach, M.J.; Iurian, A.R.; Mabit, L.; Blake, W.H. Temporal variability of beryllium-7 fallout in southwest UK. J. Environ. Radioact. 2016, 160, 80–86. [Google Scholar] [CrossRef]
- Chae, J.; Kim, G. Large seasonal variations in fine aerosol precipitation rates revealed using cosmogenic 7Be as a tracer. Sci. Total Environ. 2019, 673, 1–6. [Google Scholar] [CrossRef]
- Schubert, M.; Kopitz, J.; Knöller, K. Improved approach for LSC detection of 35S aiming at its application as tracer for short groundwater residence times. J. Environ. Radioact. 2019, 208–209, 106022. [Google Scholar] [CrossRef]
- Schubert, M.; Kopitz, J.; Knöller, K. Low-sulphate water sample preparation for LSC detection of 35S avoiding sulphate precipitation. J. Environ. Radioact. 2020, 213, 106153. [Google Scholar] [CrossRef]
- Delaygue, G.; Bekki, S.; Bard, E. Modelling the stratospheric budget of beryllium isotopes. Tellus B 2015, 67, 28582. [Google Scholar] [CrossRef] [Green Version]
- Terzi, L.; Kalinowski, M.; Schoeppner, M.; Wotawa, G. How to predict seasonal weather and monsoons with radionuclide monitoring. Sci. Rep. Nat. Res. 2019, 9, 2729. [Google Scholar] [CrossRef]
- Dyrssen, D.; Nyman, P.O. Slow-neutron-induced radioactivity of sea-water. Acta Radiol. 1955, 43, 421–427. [Google Scholar] [CrossRef] [PubMed]
- Love, D.L.; Sam, D. Radiochemical determination of sodium-24 and sulfur-35 in seawater. Anal. Chem. 1962, 34, 336–340. [Google Scholar] [CrossRef]
- Vogl, K.; Fouasnon, S.; Gesewsky, P.; Winkelmann, I. Untersuchungen über die Emission von Phosphor-32 und Schwefel-35 Mit der Abluft aus Kernkraftwerken in der Bundesrepublik Deutschland von 1983 bis Mitte 1985—ISH Heft 84; Bundesgesundheitsamt—Institut für Strahlenhygiene: Bonn, Germany, 1985. [Google Scholar]
- Meyer, B. Sulfur, Energy and Environment, 1st ed.; Elsevier Scientific Publishing Company: Amsterdam, The Netherlands; New York, NY, USA, 1977; p. 448. [Google Scholar]
- Kolb, W. Aktivitätskonzentrationen von Radionukliden in der Bodennahen Luft Norddeutschlands und Nordnorwegens im Zeitraum von 1963 bis 1990; Physikalisch-technische Bundesanstalt: Braunschweig/Berlin, Germany, 1992. [Google Scholar]
- Terzi. 2020. Available online: https://www.derstandard.at/story/2000119021106/radioaktives-isotop-zeigt-ausmass-des-klimawandels (accessed on 21 October 2020).
- Zerbo. 2020. Available online: https://twitter.com/SinaZerbo/status/1276559857731153921/photo/1 (accessed on 21 October 2020).
- Kaste, J.M. Cosmogenic 22Na as a steady-state tracer of solute transport and water age in first-order catchments. Earth Planet. Sci. Lett. 2016, 456, 78–86. [Google Scholar] [CrossRef]
Figure 1.
Naturally occurring radionuclides that are conventionally applied as aqueous residence time tracers plotted versus approximately covered residence time ranges.
Figure 1.
Naturally occurring radionuclides that are conventionally applied as aqueous residence time tracers plotted versus approximately covered residence time ranges.

Figure 2.
Schematic image displaying the creation of 7Be and 35S within the stratosphere by cosmic ray spallation of oxygen/nitrogen and argon, respectively, the attachment of the radionuclides onto aerosol particles and their conveyance towards the earth’s surface via the HFDZ that is shifting in place with the seasons as indicated by the arrows (figure based on [32]).

Figure 3.
Complete twelve-month time series of 35S activity in rain (35S; black columns) and rain intensity (P, blue line).
Figure 3.
Complete twelve-month time series of 35S activity in rain (35S; black columns) and rain intensity (P, blue line).

Figure 4.
Time series (a) 35S/7Be, (b) 35S/212Pb, and (c) 35S/AOD (at wavelengths 1640 and 1020 nm), respectively. The 35S axis is scaled to a maximum value of 200 mBq/L, with the peak recorded in late June (max. 363 mBq/L) marked in red but not fully shown (cf. Figure 5). The unusually high AOD values recorded around this peak (max. 0.161) are not displayed either (cf. Figure 5).


Figure 5.
Complete time series 35S and AOD (at wave lengths 1640 and 1020 nm).

Figure 6.
Correlation of 7Be and 35S (not considering the anomalous June 2020 peak of 35S).

Figure 7.
RMSE calculation based on normalized time series of 35S and 7Be.

Figure 8.
Map issued by the CTBTO showing in orange the possible source region of elevated atmospheric activities of anthropogenic radionuclides recorded on 22/23 June 2020; “DEP33” is indicating the location of station RN33 [39]. The black star shows the rain sampling location. Shaded in blue is the area that resulted from the modelled 60 h back trajectory ensembles discussed in Section 3.1.

Figure 9.
35S spike observed in Leipzig, Germany versus 7Be spike detected at CTBTO station RN63 (Stockholm, Sweden) in June 2020.
Figure 9.
35S spike observed in Leipzig, Germany versus 7Be spike detected at CTBTO station RN63 (Stockholm, Sweden) in June 2020.


Table 1.
Quantulus GCT 6220 settings for counting 35S in aqueous solution with Hionic-Fluor.
| Parameter | Setting |
|---|---|
| Assay type | DPM (single) |
| Quench indicator | tSIE/AEC |
| 2 Sigma threshold | 0.5% |
| Counting energy window | 3–167 keV |
| Coincidence time | 18 ns |
| Delay before burst | 75 ns |
Publisher’s Note: MDPI stays neutral with regard to jurisdictional claims in published maps and institutional affiliations. |
© 2020 by the authors. Licensee MDPI, Basel, Switzerland. This article is an open access article distributed under the terms and conditions of the Creative Commons Attribution (CC BY) license (http://creativecommons.org/licenses/by/4.0/).
Share and Cite
MDPI and ACS Style
Schubert, M.; Knöller, K.; Tegen, I.; Terzi, L. Variability of Cosmogenic 35S in Rain—Resulting Implications for the Use of Radiosulfur as Natural Groundwater Residence Time Tracer. Water 2020, 12, 2953. https://doi.org/10.3390/w12102953
AMA Style
Schubert M, Knöller K, Tegen I, Terzi L. Variability of Cosmogenic 35S in Rain—Resulting Implications for the Use of Radiosulfur as Natural Groundwater Residence Time Tracer. Water. 2020; 12(10):2953. https://doi.org/10.3390/w12102953
Chicago/Turabian StyleSchubert, Michael, Kay Knöller, Ina Tegen, and Lucrezia Terzi. 2020. "Variability of Cosmogenic 35S in Rain—Resulting Implications for the Use of Radiosulfur as Natural Groundwater Residence Time Tracer" Water 12, no. 10: 2953. https://doi.org/10.3390/w12102953
Note that from the first issue of 2016, this journal uses article numbers instead of page numbers. See further details here.