Impact of Main Pipe Flow Velocity on Leakage and Intrusion Flow: An Experimental Study


1
Department of Civil Engineering, Zhejiang University, Hangzhou 310058, China
2
School of Civil, Environmental, and Mining Engineering, University of Adelaide, Adelaide, SA 5005, Australia
*
Author to whom correspondence should be addressed.
Water 2019, 11(1), 118; https://doi.org/10.3390/w11010118
Submission received: 27 November 2018
/
Revised: 30 December 2018
/
Accepted: 7 January 2019
/
Published: 10 January 2019
(This article belongs to the Section Hydraulics and Hydrodynamics)
Abstract
:The classic orifice equation is commonly used to calculate the leakage and intrusion rate for pressurized pipelines with cracks on the pipe wall. The conventional orifice equation does not consider the effect of the flow velocity in the main pipe, and there is a lack of studies on this matter. For this technical note, the influence of the main pipe flow velocity on the outflow and inflow through a crack on the pipe wall was studied in the laboratory. The experimental results show that the impact of the main pipe flow velocity can be significant. When the pressure difference across the orifice was constant, with the increase of the main pipe flow velocity, the outflow velocity increased, but the contraction area of the jet and the outflow discharge coefficient decreased. By comparing orifices with different shapes, it was found that the discharge from the circumferential crack was most sensitive to the main pipe flow velocity. In addition, the main pipe flow promoted the orifice inflow. When the pressure difference across the orifice was constant, with the increase of the main pipe flow velocity, the inflow discharge coefficient increased, which is the opposite pattern to that of the orifice outflow.
1. Introduction
The leakage in water distribution systems (WDSs) is a global problem, with the leakage rate typically ranging from about 10% in well-managed systems [1], to more than 30% in some developing countries such as India and China [2]. Managing leaks in WDSs is also an important part of water supply safety management, since contamination intrusion through cracks in the pipe wall may occur during low or negative pressure events and this is a significant threat to public health [3]. In recent years, external water intrusion during low or negative pressure transient events in urban water supply systems has attracted more and more attention. The volume of intruded pollutants is one of the significant indicators that can reflect the degree of health risks when a pollution incident occurs [4]. However, as will be shown, estimating the volume of intrusion based on the conventional orifice equation that ignores the effect of the main pipe flow velocity may underestimate the volume of intrusion and the risk to public health. Research into accurately assessing the leakage and intrusion rates through cracked water pipes has attracted increasing attention [5].
The fact that leakage and intrusion through cracks in the pipe wall do not necessarily follow the standard orifice equation (the discharge flow varies with the square root of pressure difference across the orifice) has been widely recognized [5]. Early studies have shown that the flow through a leak opening is related to the pressure raised to an exponent that varies typically from 0.5 to 2.5 depending on: the material of the pipe, the shape of the leak and the system pressure [6]. Recent studies by many researchers on various pipe materials and leak configurations support the observation under both leakage [7,8,9,10,11,12,13,14,15] and intrusion [5,16]. Regarding the amendment to the equation, the effects of orifice shape and size on the orifice discharge coefficient has been investigated [17,18]. In addition, the influence of the media surrounding the pipe on leakage and intrusion modelling has been studied [19,20].
Despite the extensive studies on factors that affect pipe leakage flow as reviewed above, to the knowledge of the authors, there is no detailed study on how the flow velocity in the main pipe influences the leakage or intrusion flow. Researchers studied the effect of the flow velocity in a main channel on the side discharge through an orifice under different liquid levels and pore sizes in a trough-type liquid distributor using computational fluid dynamics (CFD) simulations [21]. However, the results of this work, obtained from investigations of free surface flow, cannot be directly applied to the through-wall orifice flow in pressurized pipes.
The study reported in this technical note focuses on the effect of the main pipe flow velocity on the leakage and intrusion through cracks on the pipe wall. A series of laboratory experiments were conducted, and the experimental systems are described in detail. A crack on the pipe wall was simulated by a through-wall orifice, and the leakage and intrusion were considered as the orifice outflow and inflow, respectively. For the orifice outflow study, the outflow velocity, the contraction area of the jet and the outflow discharge coefficient were measured and analyzed for various main pipe flow and pressure conditions. For the orifice inflow study, the inflow discharge coefficient was studied in detail and compared with the findings of the orifice outflow. The key findings of this experimental study are summarized in the conclusion section.
2. Experimental Apparatus
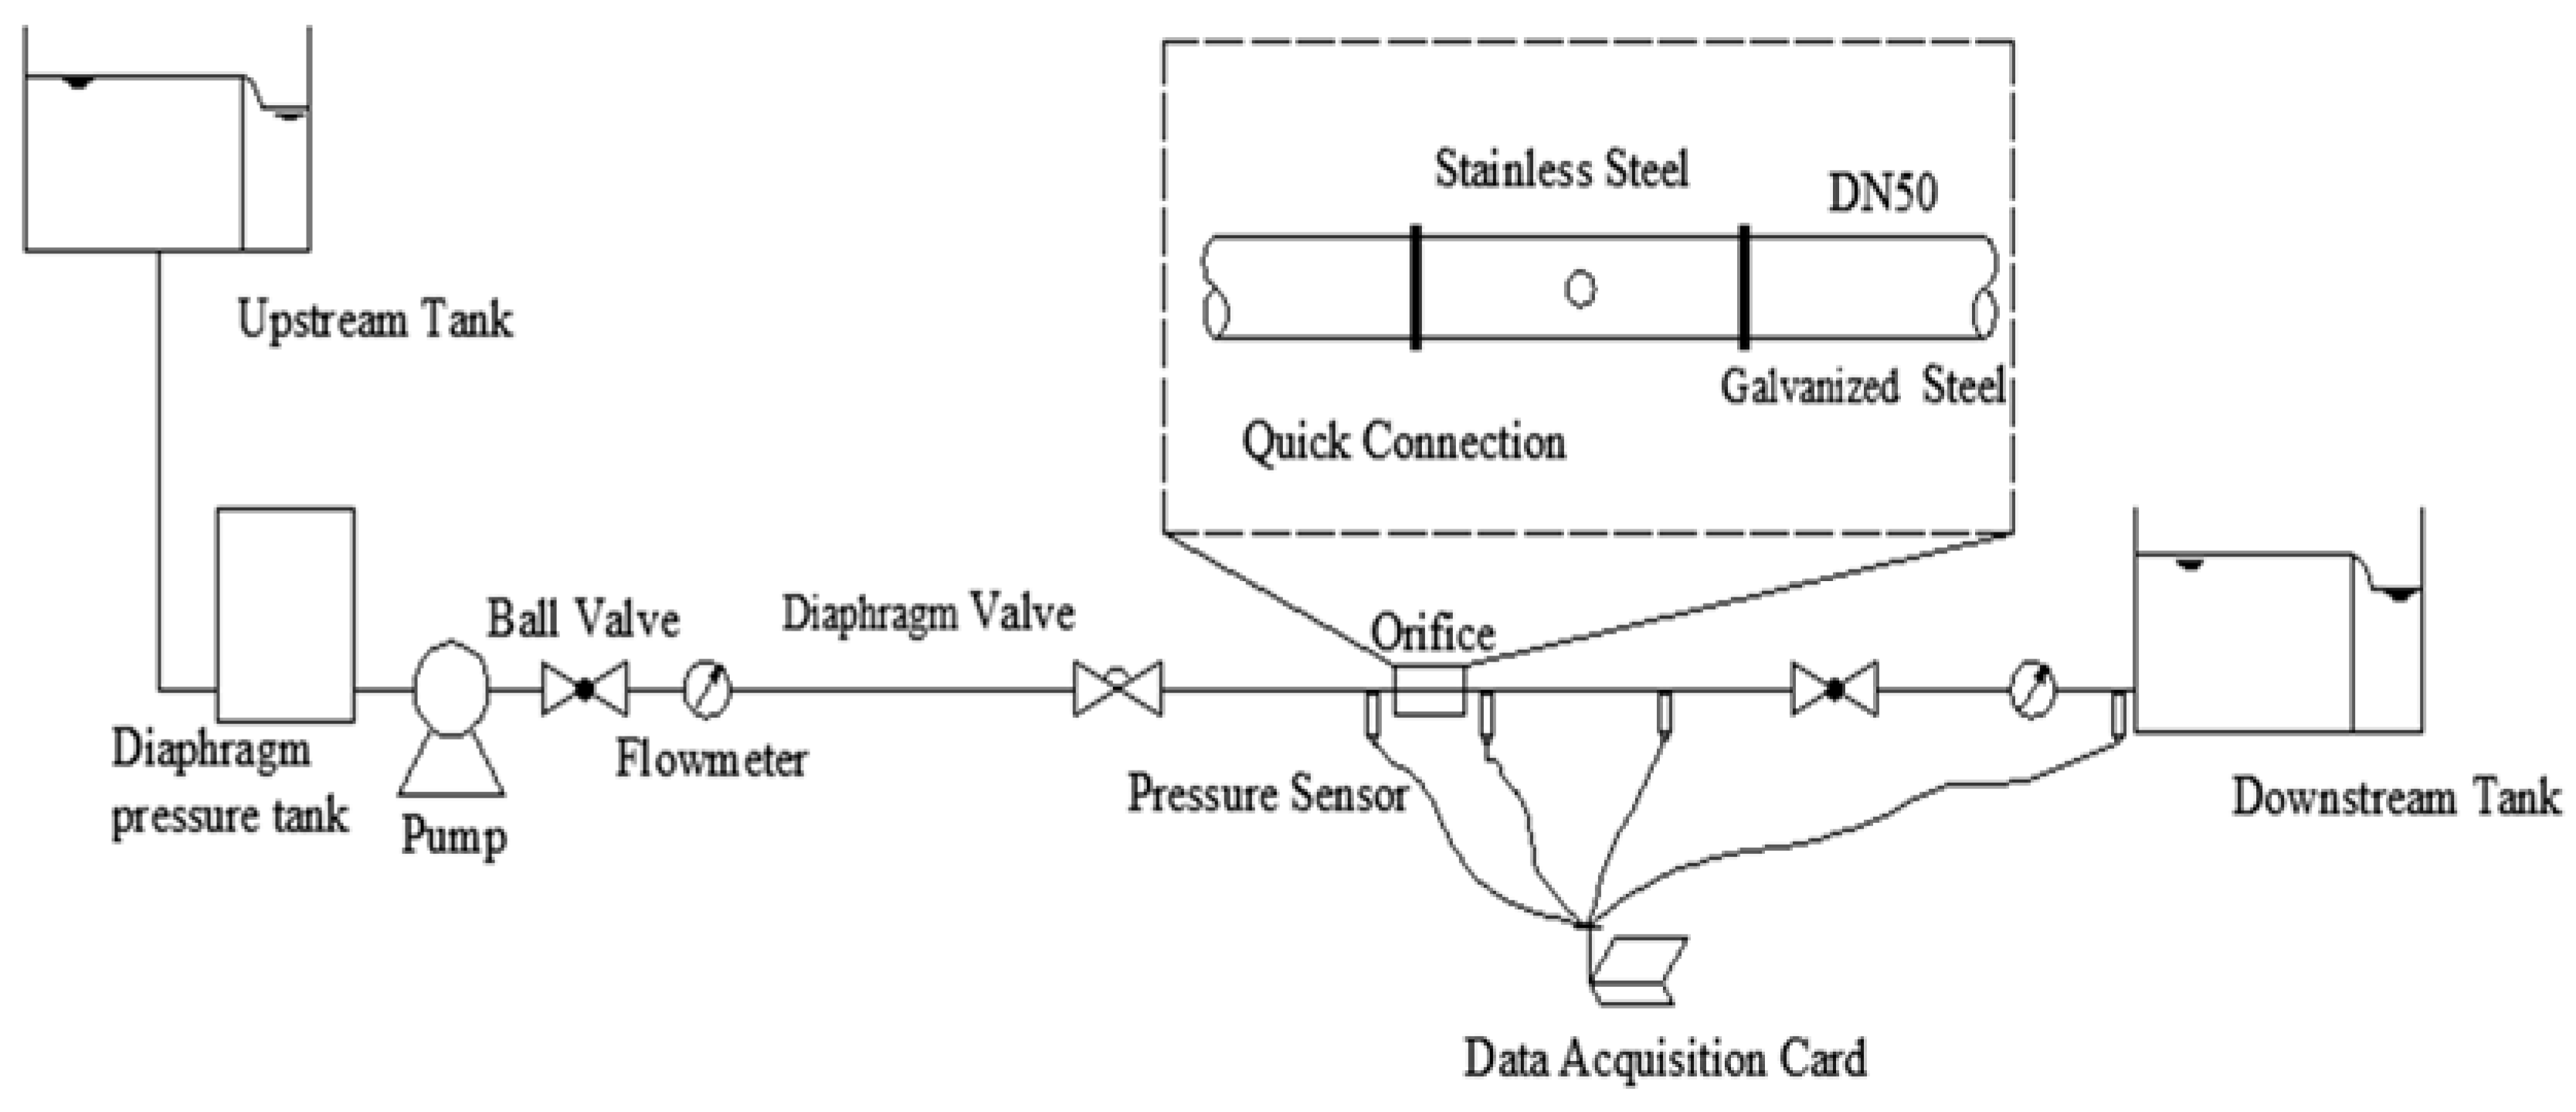
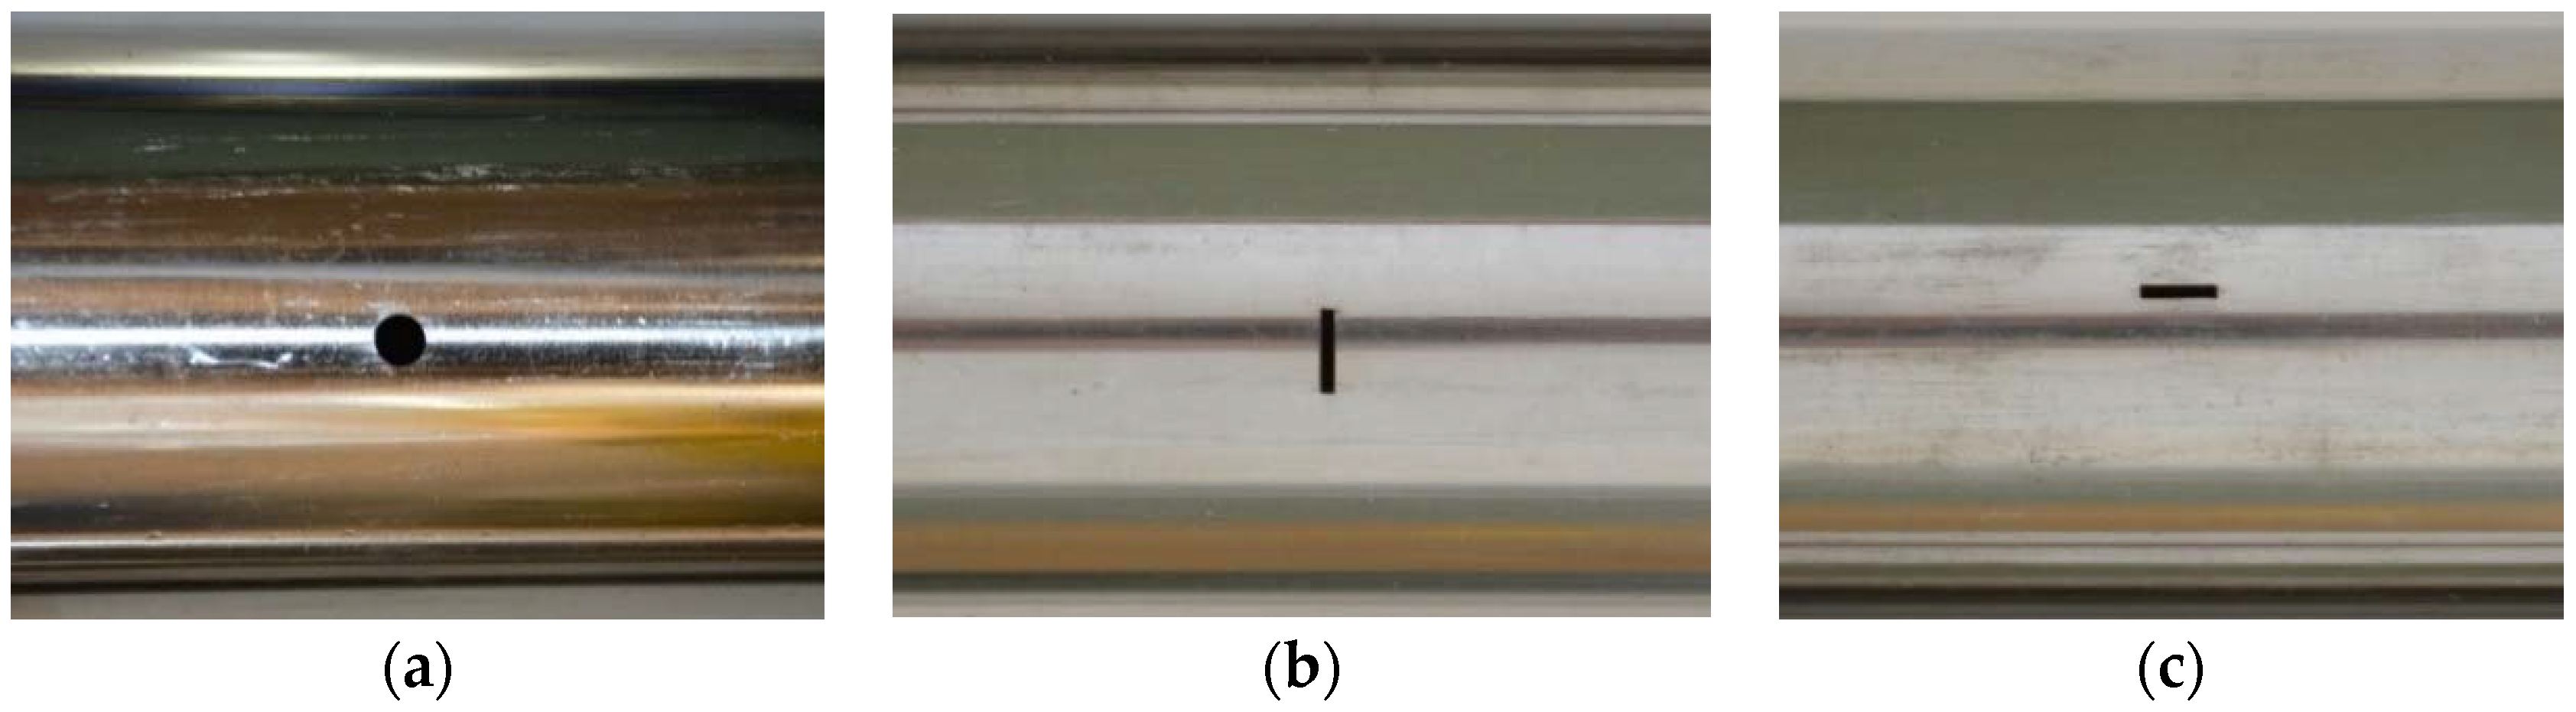
Two experimental systems were used in this research: one for the study of orifice outflow (leakage) and one for the orifice inflow (intrusion). The experimental setup for the orifice outflow study is shown in Figure 1. The test pipe system was a DN50 straight pipeline with a total length of 18.0 m. The majority of the pipe system was made of galvanized steel pipes. A short stainless-steel pipe section (0.5 m in length, 53 mm in internal diameter and 2 mm in wall thickness) with a through-wall orifice was installed in the system to simulate a leak. Three stainless-steel pipe sections were made to simulate three different leak shapes: a circular orifice (3 mm in diameter) to simulate a pinhole leak, a rectangular orifice (7.07 mm in length, 1 mm in width) to simulate a longitudinal crack in a pipe wall, and a rectangular orifice with the same dimensions to simulate a circumferential crack, as shown in Figure 2. The orifices were laser drilled with high precision in the dimensions, and the three orifices had the same opening area (7.07 mm2). The upstream and downstream ends of the pipeline system were connected to overflow tanks for water supply and drainage, respectively. A variable-speed water pump (50AAB HLS-25-50-2, Shanghai Panda, rated power 5.5 kW, rated working pressure 0.5 MPa) and a diaphragm pressure tank (SQL600-0.6, Shanghai Panda, pressure 0.6 MPa, effective volume 120 L) constituted a pipeline pressure stabilization system to regulate the flow velocity and pressure in the pipeline. Two magnetic flowmeters (OPTIFLUX2100C, KROHNE) were installed close to the upstream and downstream ends of the pipeline, respectively. The ratio of the flow rate reading to the cross-sectional area of pipeline was taken as the flow velocity in the pipeline. The orifices discharged water to the atmosphere. To measure the profile of the orifice discharge, a camera (HDR-CX405, SONY, frame rate 50P) was installed at a position above the orifice to record the flow jet images. The images were processed with AutoCAD, then the minimum cross-sectional area at the vena contracta (the point where the diameter of the stream is the least) and the tilt angle (degree of inclination) of the outflow jet were calculated.
The pressure acquisition system consisted of four GE PTX-5032 pressure transmitters with a range of 10 bar and a precision of ±0.04%. These pressure sensors were connected to a data acquisition card. Two pressure sensors were installed at locations 0.5 m upstream and downstream of the orifice, respectively. The average of their readings was taken as the pressure at the orifice. There was a small head loss at the orifice, but it was proven by comparison experiments that the value was negligible and did not affect the experimental results reported hereafter. The volumetric method was used to measure the orifice discharge rate. The orifice flow velocity was obtained by dividing the discharge rate by the minimum cross-sectional area.
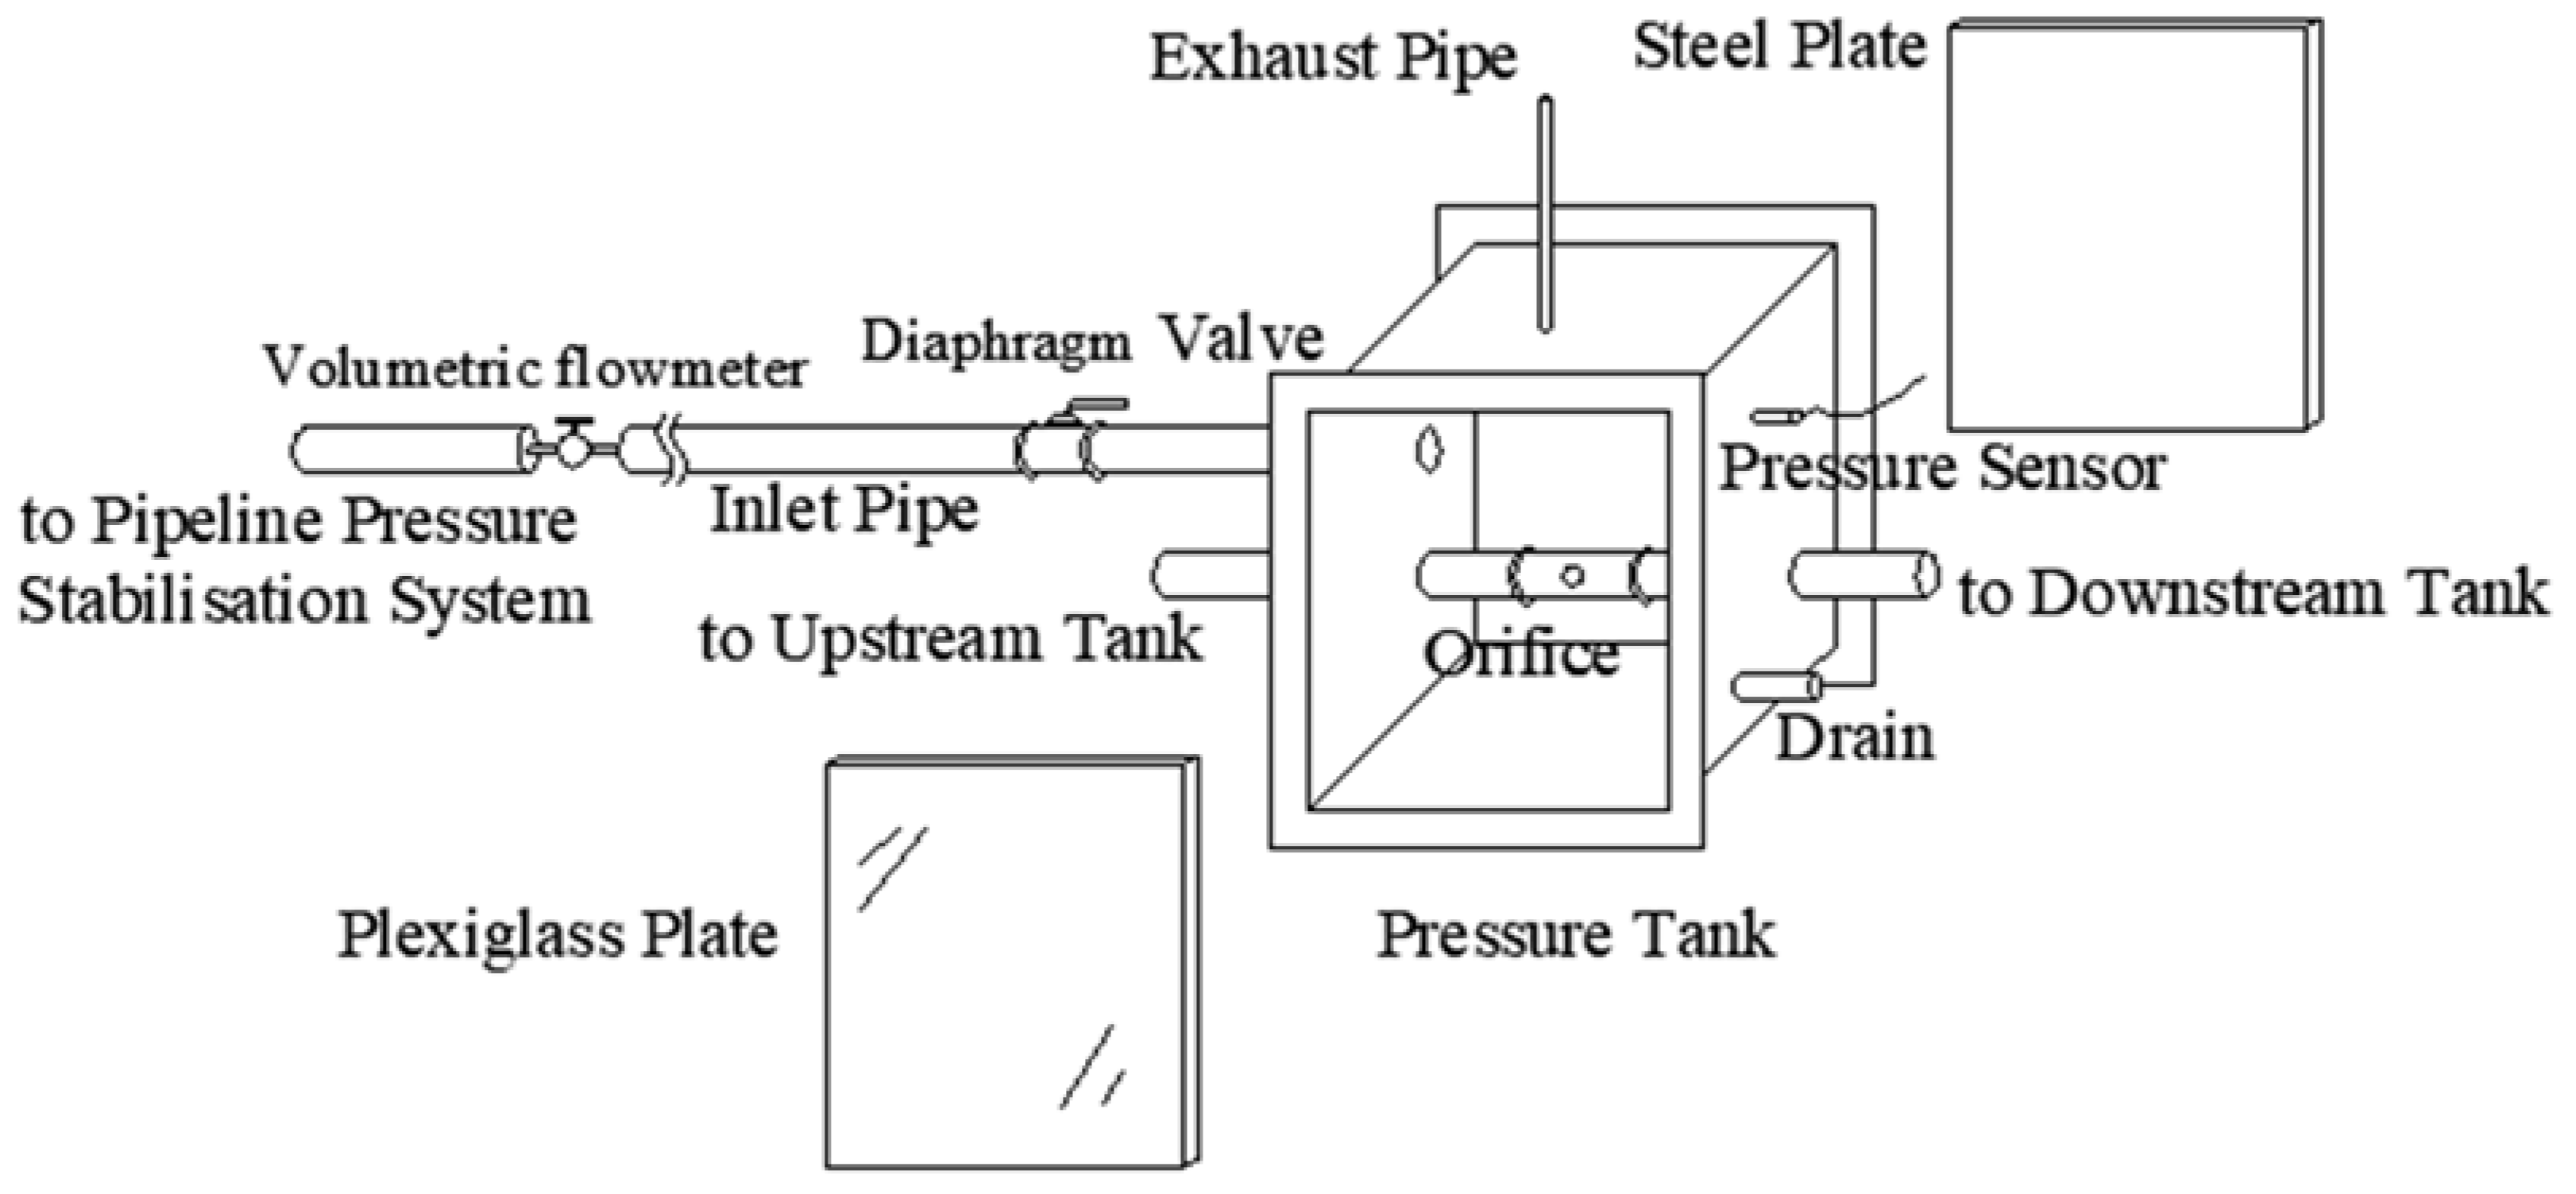
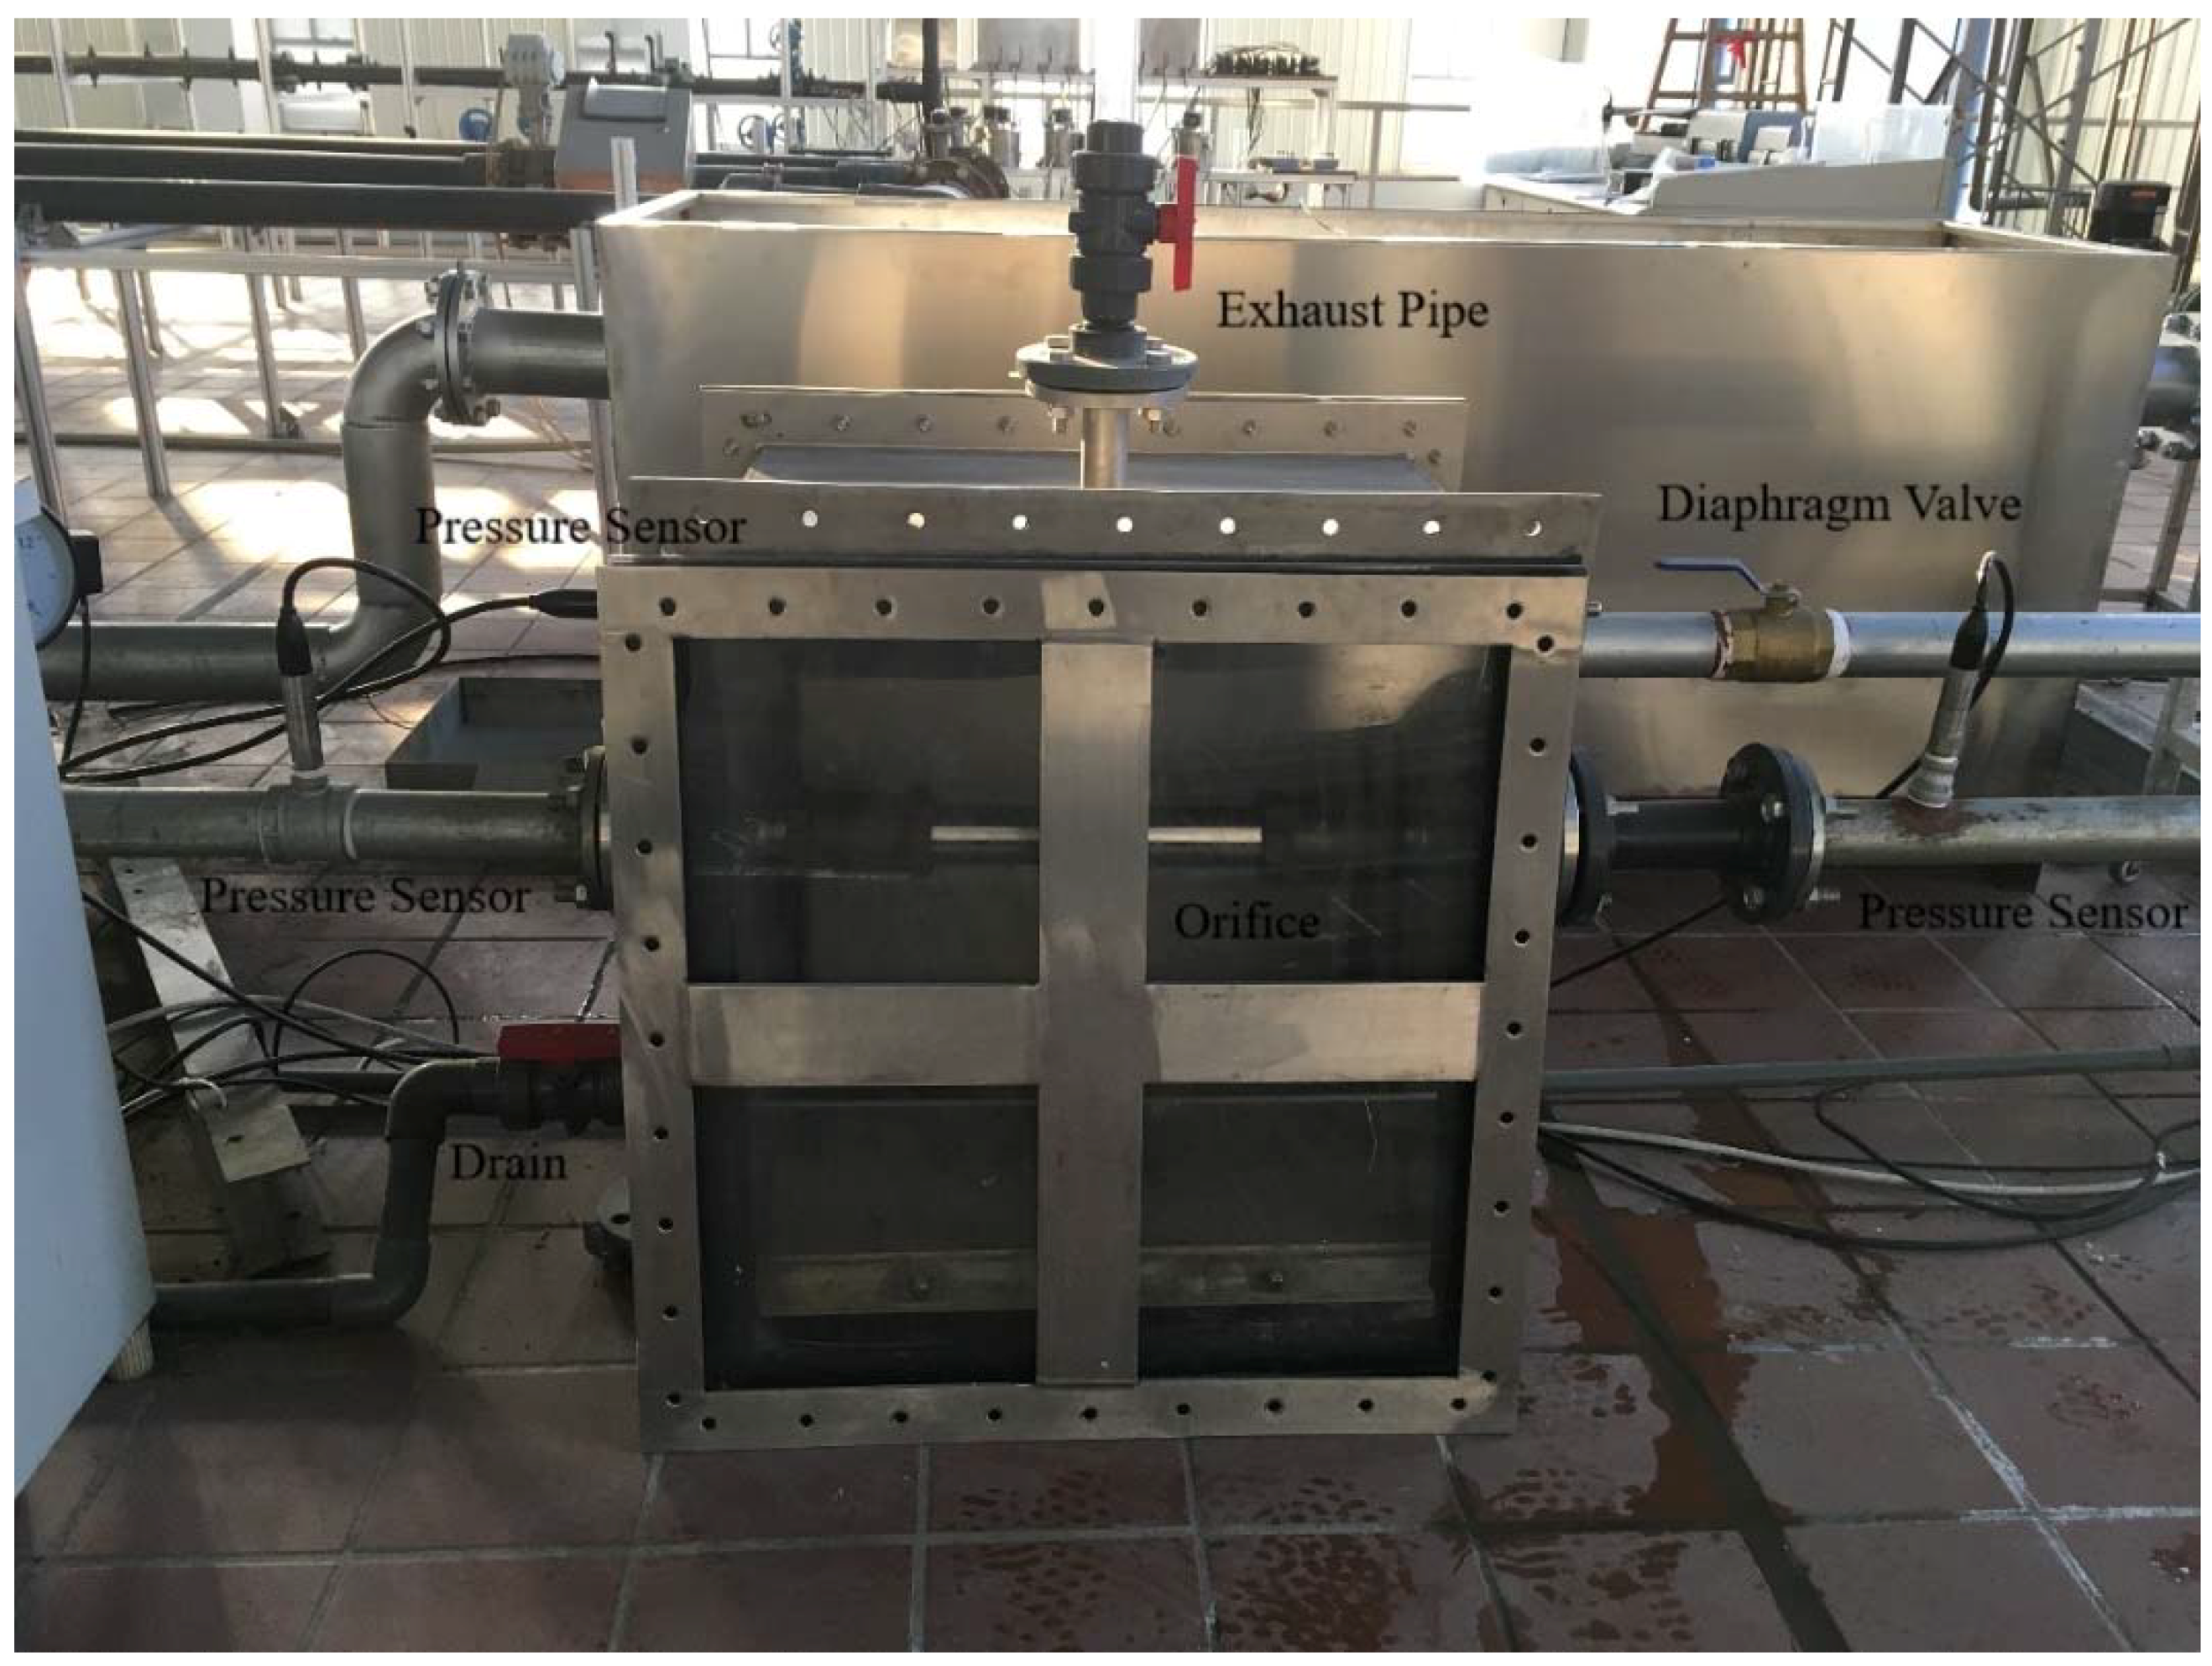
The experimental setup for the orifice inflow study is illustrated in Figure 3. The main difference from the setup for the outflow study (Figure 1) was the use of a customized pressure tank to enclose the pipe section with an orifice and to provide a stable external pressure for the orifice, as shown in Figure 4. There was a diaphragm valve on the inlet pipe (the pipe that connects the pressure tank and the variable-speed pump). The regulation of the valve opening and the pump speed helped to achieve various required external pressures. The measurement of the inflow discharge was based on a high precision volumetric flowmeter (MG008S511221R2, TRIMEC) installed on the inlet pipe of the customized pressure tank.
The experiment in each specific setup was repeated five times under the same conditions, and the experimental data were averaged using the five repeated measurements wherever applicable. The relative difference between the five experimental values and the average value was controlled within 1% to ensure the accuracy of the results.
3. Results of the Orifice Outflow Study
3.1. Inclination of the Circular Orifice Outflow
The outflow inclination refers to the angle between the orifice outflow direction and the direction of flow in the main pipe. Experimental observations of the outflow from the circular orifice demonstrate that both the main pipe flow velocity and the orifice pressure (i.e., the pressure difference cross the orifice) affected the inclination. From the results of one set of experiments where the orifice pressure was controlled at about 2 m, the inclination was found to change with the main pipe flow velocity, as shown in Figure 5. In the figure, H represents the orifice pressure, V represents the upstream main pipe flow velocity and its direction from right to left, and θ represents the outflow tilt angle. Figure 5 shows that when H is constant, the direction of the orifice outflow jet was obviously more inclined to the downstream direction as V increased. Note that upstream water was not able to be completely stopped and V was lower than 0.02 m/s when the downstream valve was closed.
Figure 6 shows the relationship between θ and V under various orifice pressure conditions. It can be seen from Figure 6 that for any specific orifice pressure, the orifice outflow increasingly inclined to the downstream direction of the pipe with the increase of the main pipe flow velocity. This observation was understandable and expected, since the orifice outflow carried the inertial of the original flow. For the same main pipe velocity (V), the smaller the orifice pressure (H), the smaller the inclination angle. This means that the outflow inclination was more sensitive to the main pipe velocity (V), under lower pipe pressure conditions.
3.2. Cross-Sectional Area and Velocity of the Circular Orifice Outflow
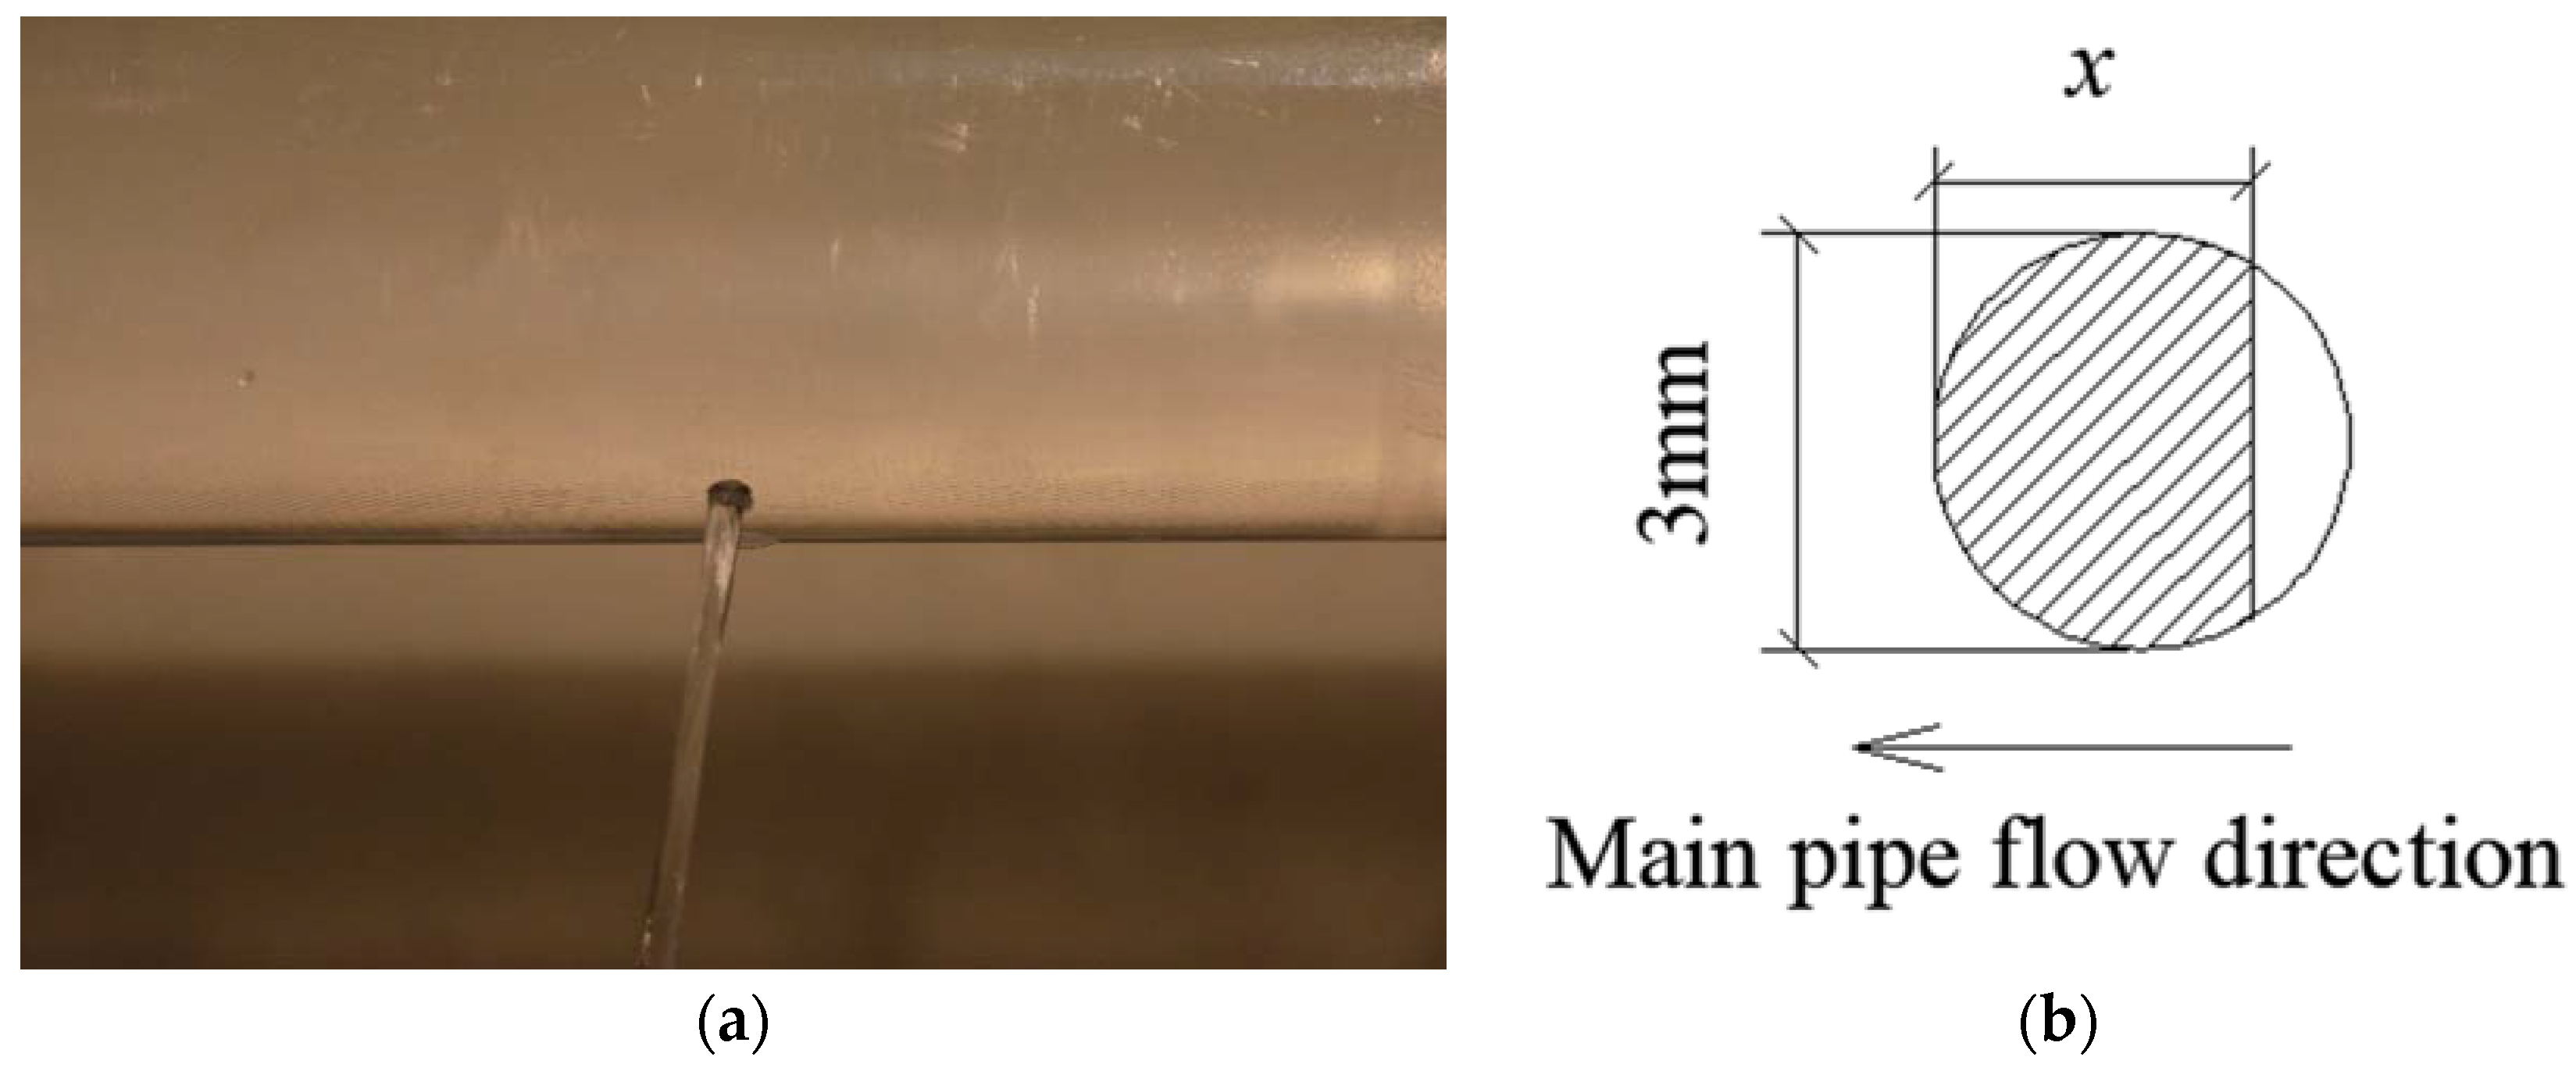
It is known that a circular orifice causes a contraction of the jet downstream from the orifice opening [22]. Figure 7 shows the shape of the jet when the orifice pressure was 2 m. Because of the main pipe flow velocity, the shape of the cross-section of the jet in this study was different from that of the conventional flow through an orifice located at the wall of a pressure tank. The right part of the jet (the main pipe flow is from right to left) is not circular but approximately flat as indicated in Figure 7b. Its vena contracta is approximately located at 1/2 of the orifice diameter from the orifice. The shape of the minimum cross-sectional area is the shaded sector, as shown in Figure 7b. The cross-sectional area at the vena contracta (Ac), can be estimated by calculating the area of the shaded sector measuring the length of x. The contraction coefficient (ε), is defined by the following equation:
where A is the cross-sectional area of the orifice, and A = 7.07 mm2 in this study.
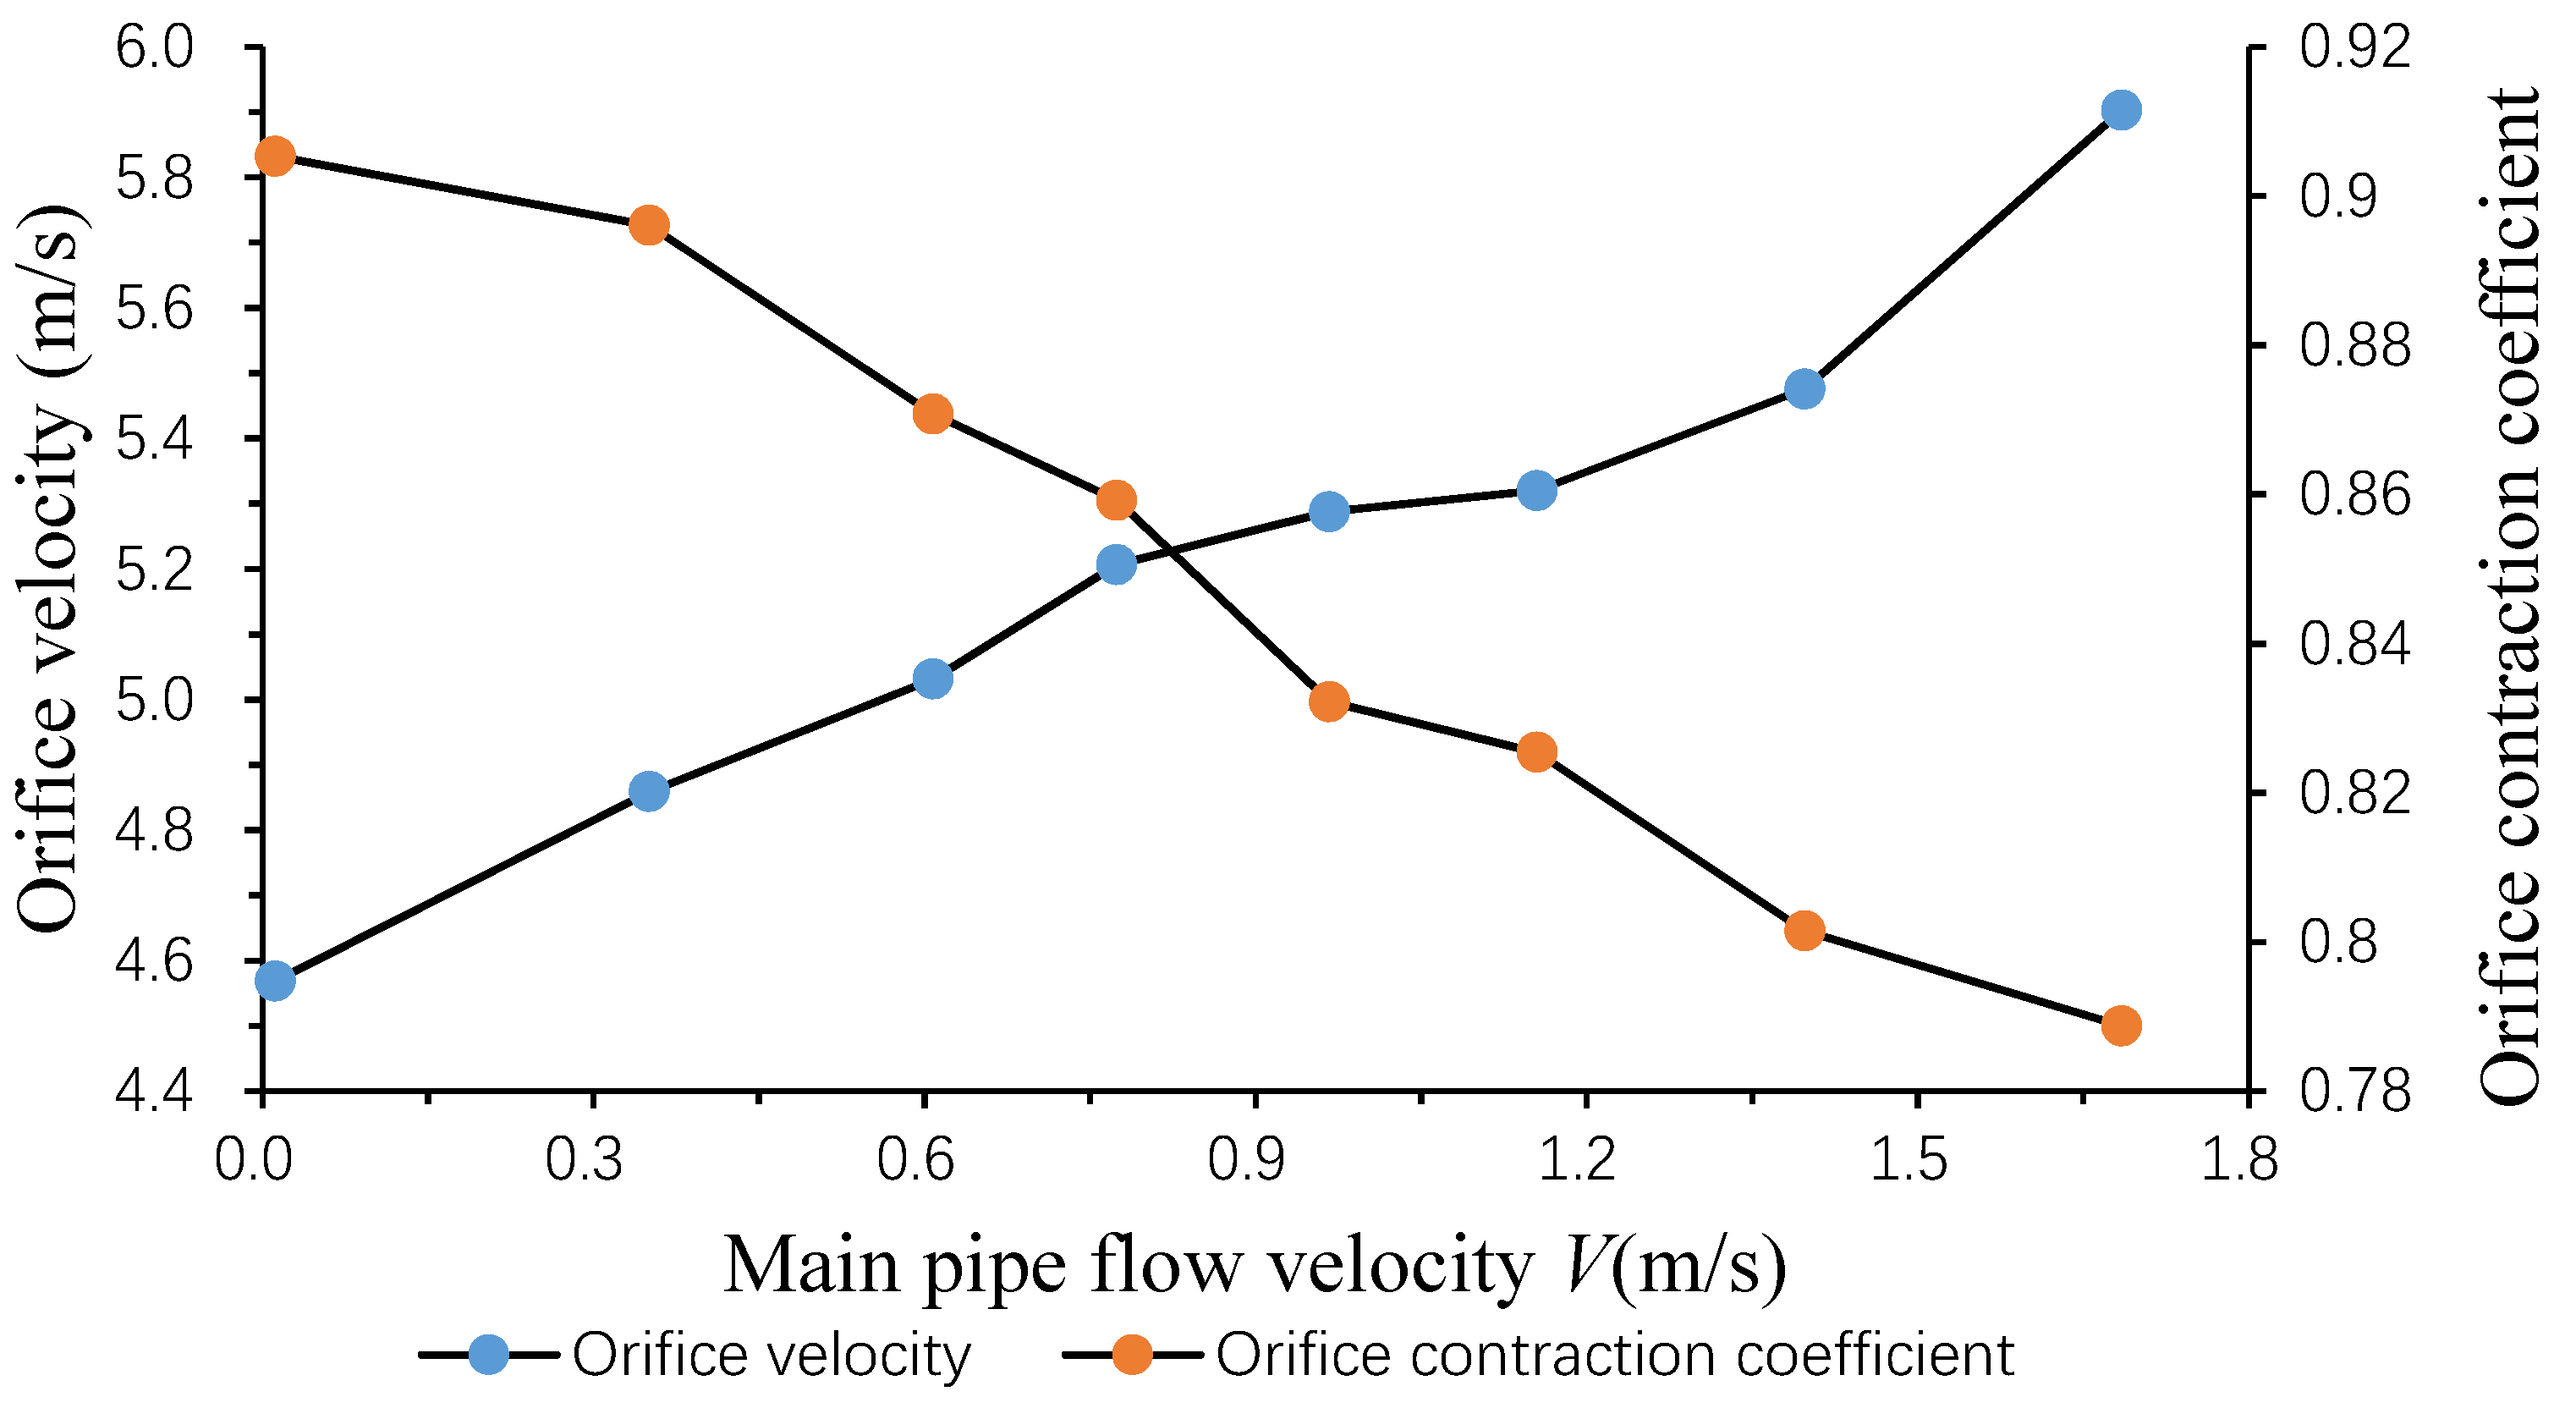
In this set of experiments, the orifice pressure was controlled at about 2.0 m. Figure 8 shows the relationship between the contraction coefficient and the main pipe flow velocity. Dividing the orifice discharge rate Q (as determined by the volumetric method) by Ac provides the orifice outflow velocity. The relationship between the outflow velocity and the main pipe flow velocity was also reported in Figure 8. From Figure 8, when the orifice pressure was about 2 m, with the increase of the main pipe flow velocity (from 0 to 1.8 m/s), the contraction coefficient decreased and the outflow velocity increased.
3.3. Discharge Coefficient of the Circular Orifice
The standard orifice equation derived from Bernoulli’s equation is acknowledged to estimate the flow through an orifice:
where g is the gravitational acceleration. The discharge coefficient (μ), can be calculated by Equation (2) using the outflow discharge rate (Q), measured under various orifice pressures and main pipe flow velocity conditions. The equation commonly describes the flow through an orifice located at the wall of a pressure tank which is large enough relative to the orifice to ignore the water velocity perpendicular to the outflow direction. Note that the opening area of the orifice and the square root relationship with the pressure are considered in Equation (2), as following the convention.
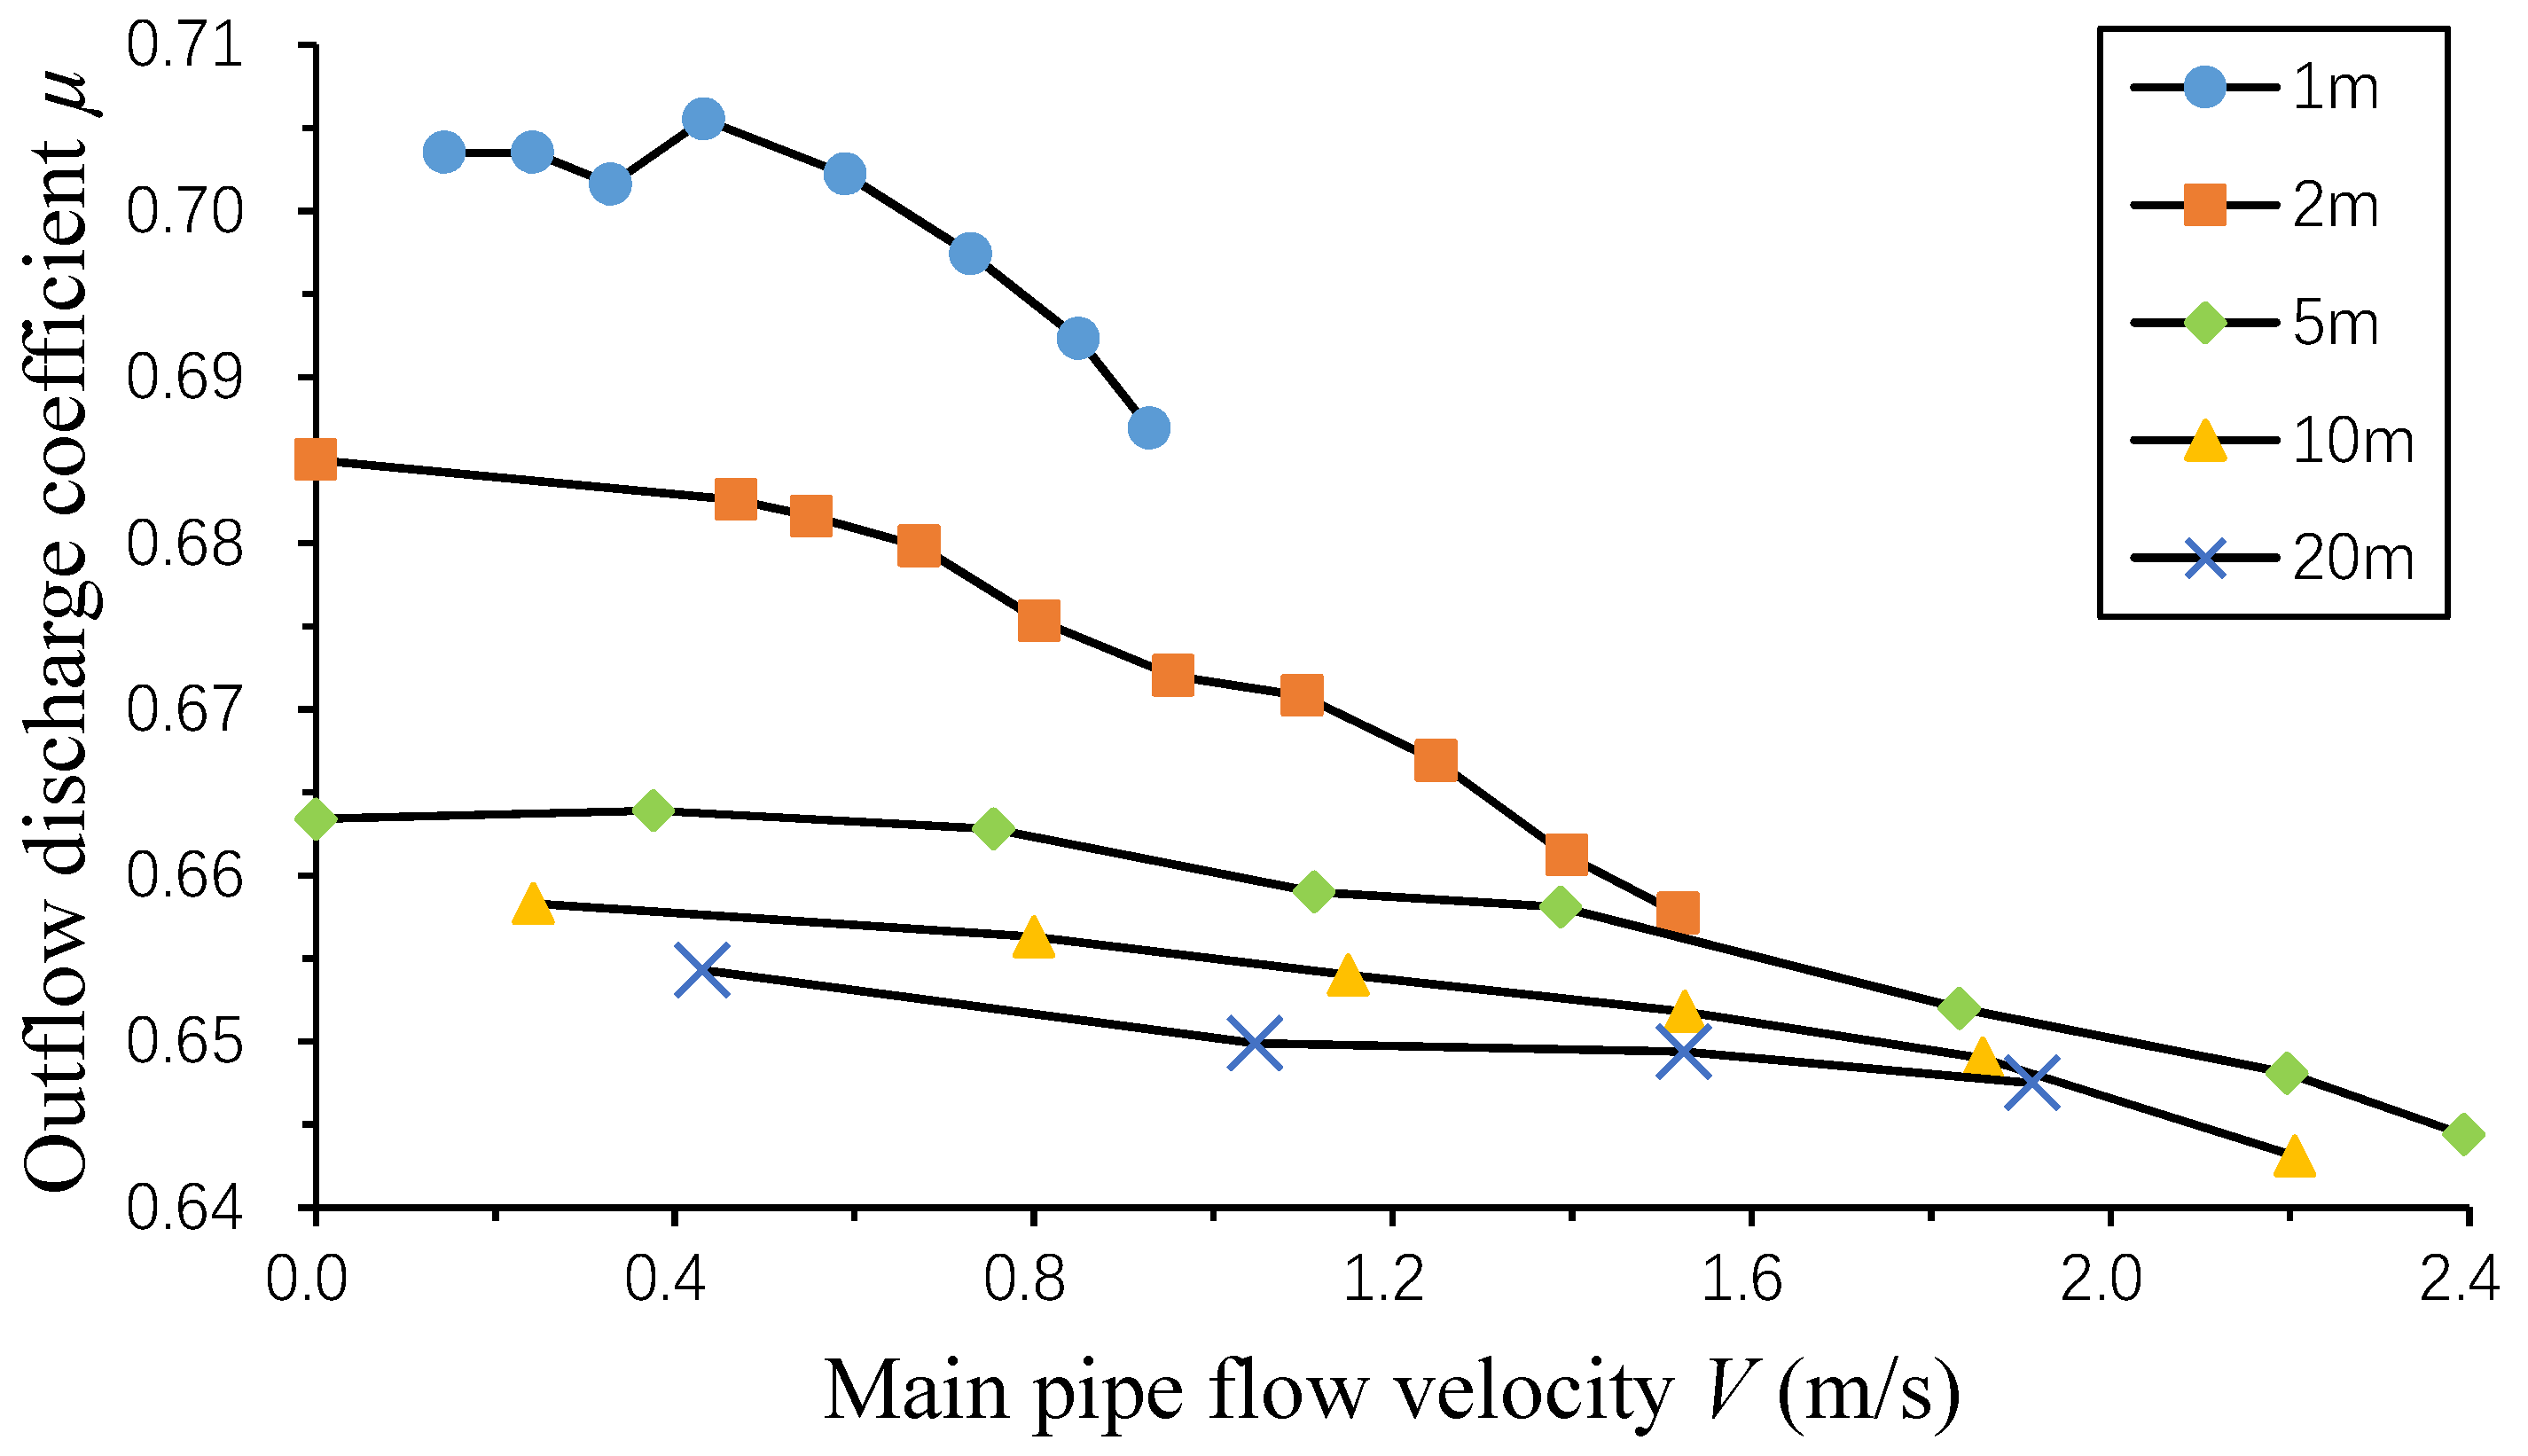
Figure 9 shows that, for the same (or similar) main pipe flow velocity (V), the discharge coefficient (μ), decreased with the increase in orifice pressure (H). This is consistent with the curve-fit formulas developed by International Organization for Standardization (ISO), which reveal the relationship between μ and Reynolds number [23]. It suggests that the velocity coefficient (φ), which is the ratio of the flow velocity at the contraction cross-sectional area to the orifice velocity, decreases with the growth of H; while the contraction coefficient (ε), is known to increase with H. This can be explained when the promotion of H to the local resistance coefficient (ξ), which is the ratio of local resistance generated by the fluid flowing through the equipment to the corresponding dynamic pressure, at the orifice is taken into account. The existence of larger H makes the outflow direction change more rapidly, which probably leads to an increase of ξ. Admittedly, the specific theoretical relationship remains to be explored. In addition, when the orifice pressure H is constant, the discharge coefficient (μ), decreases with the increase of the main pipe flow velocity (V). The influence of V on μ is more significant for lower orifice pressure. When H was 2 m, as V increased from 0.2 m/s to 2.2 m/s, μ reduced from 0.685 to 0.638; that is, a reduction of 6.9%. When H was 20 m, as V increased from 0.2 m/s to 2.2 m/s, μ changed from 0.655 to 0.645, the reduction was only 1.5%.
Obviously, the outflow discharge is affected by both the area (Ac), and the outflow velocity. As mentioned in the previous section, the greater the V, the smaller the μ and the smaller the Ac, but the greater the outflow velocity, which means that the contraction of the jet has a greater effect on the outflow discharge than the outflow velocity. When the orifice area is constant, Ac is positively correlated with the contraction coefficient, and the outflow velocity is positively correlated with the velocity coefficient. Therefore, the main factor affecting the orifice outflow is the contraction coefficient.
3.4. Effect of the Shape of the Orifice
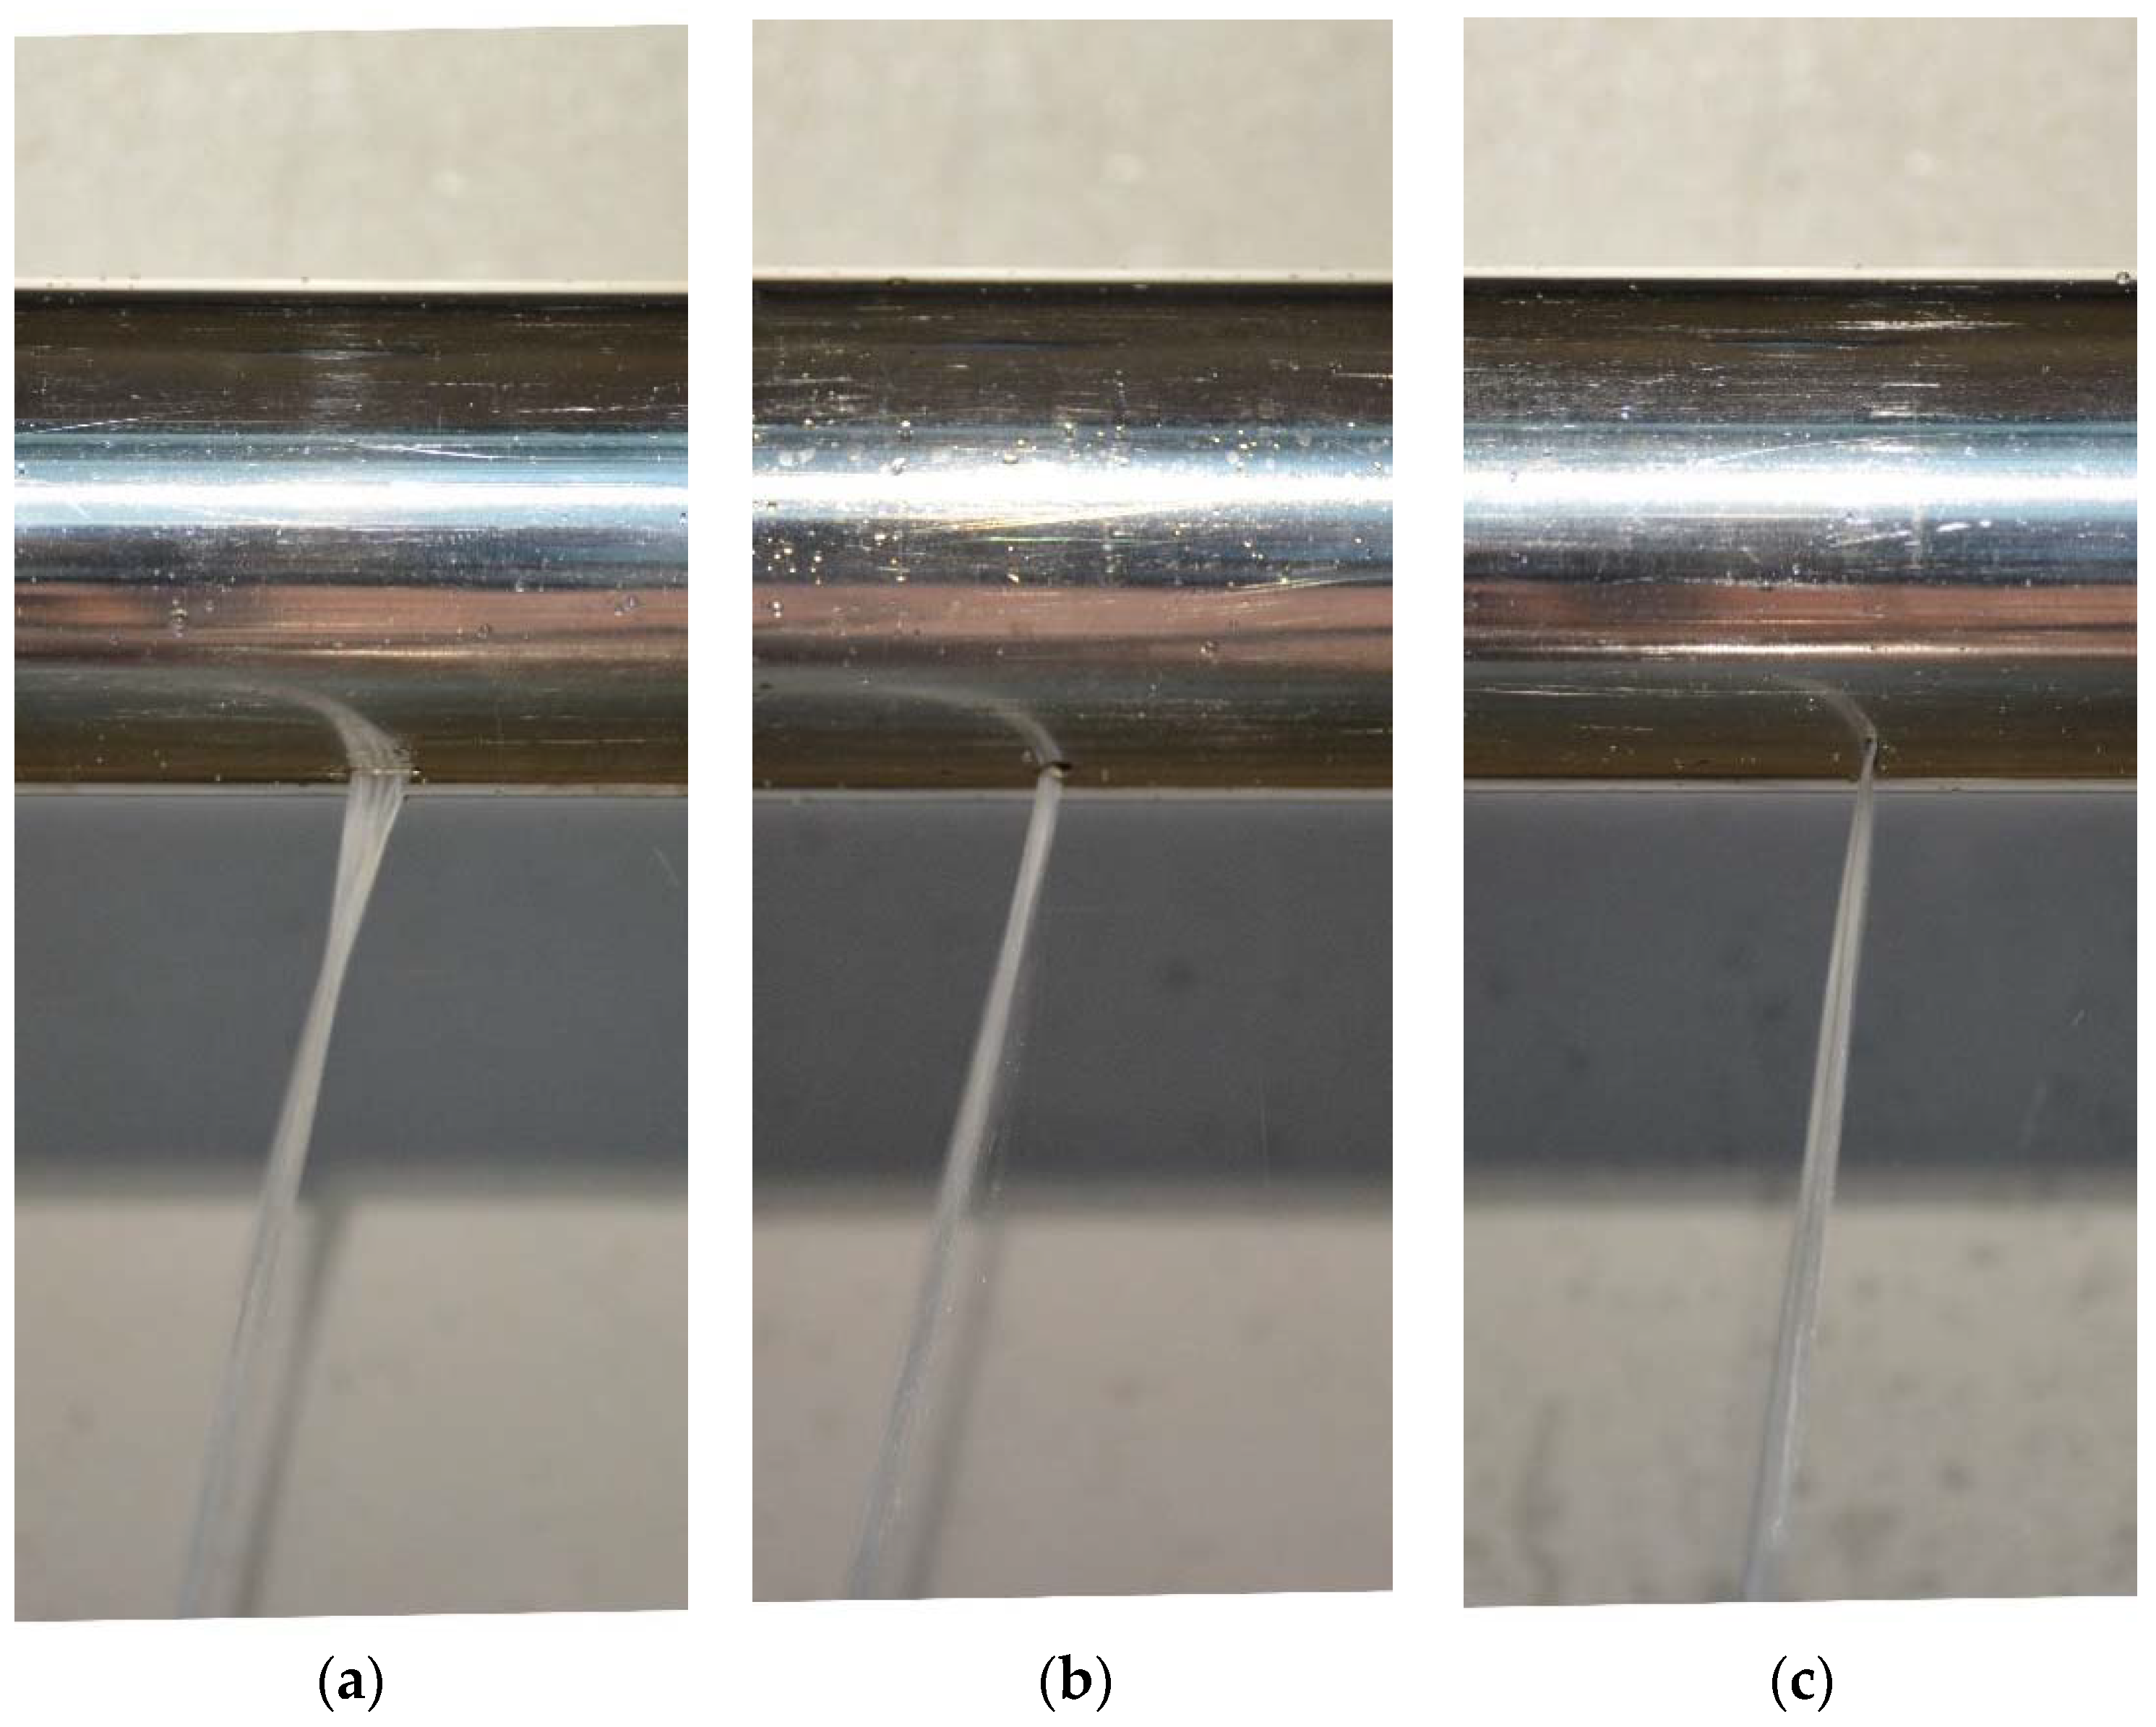
Additional experiments were conducted using the two rectangular orifices, with one simulating a longitudinal crack on the pipe wall and another simulating a circumferential crack, as shown in Figure 2. The two rectangular orifices had a length of 7.07 mm and a width of 1 mm, and the opening area was the same as the circular orifice discussed earlier (with a diameter of 3 mm). Figure 10 shows the photos of the outflow jets coming out of the three orifices with different shapes. In the presence of main pipe flow velocity, the difference between the shape of the cross-section of the jet and the circumferential orifice was the largest, and the shrinkage of the jet was most obvious. The difference between the shape of the cross-section and the longitudinal orifice was the least, and the shrinkage was the least obvious.
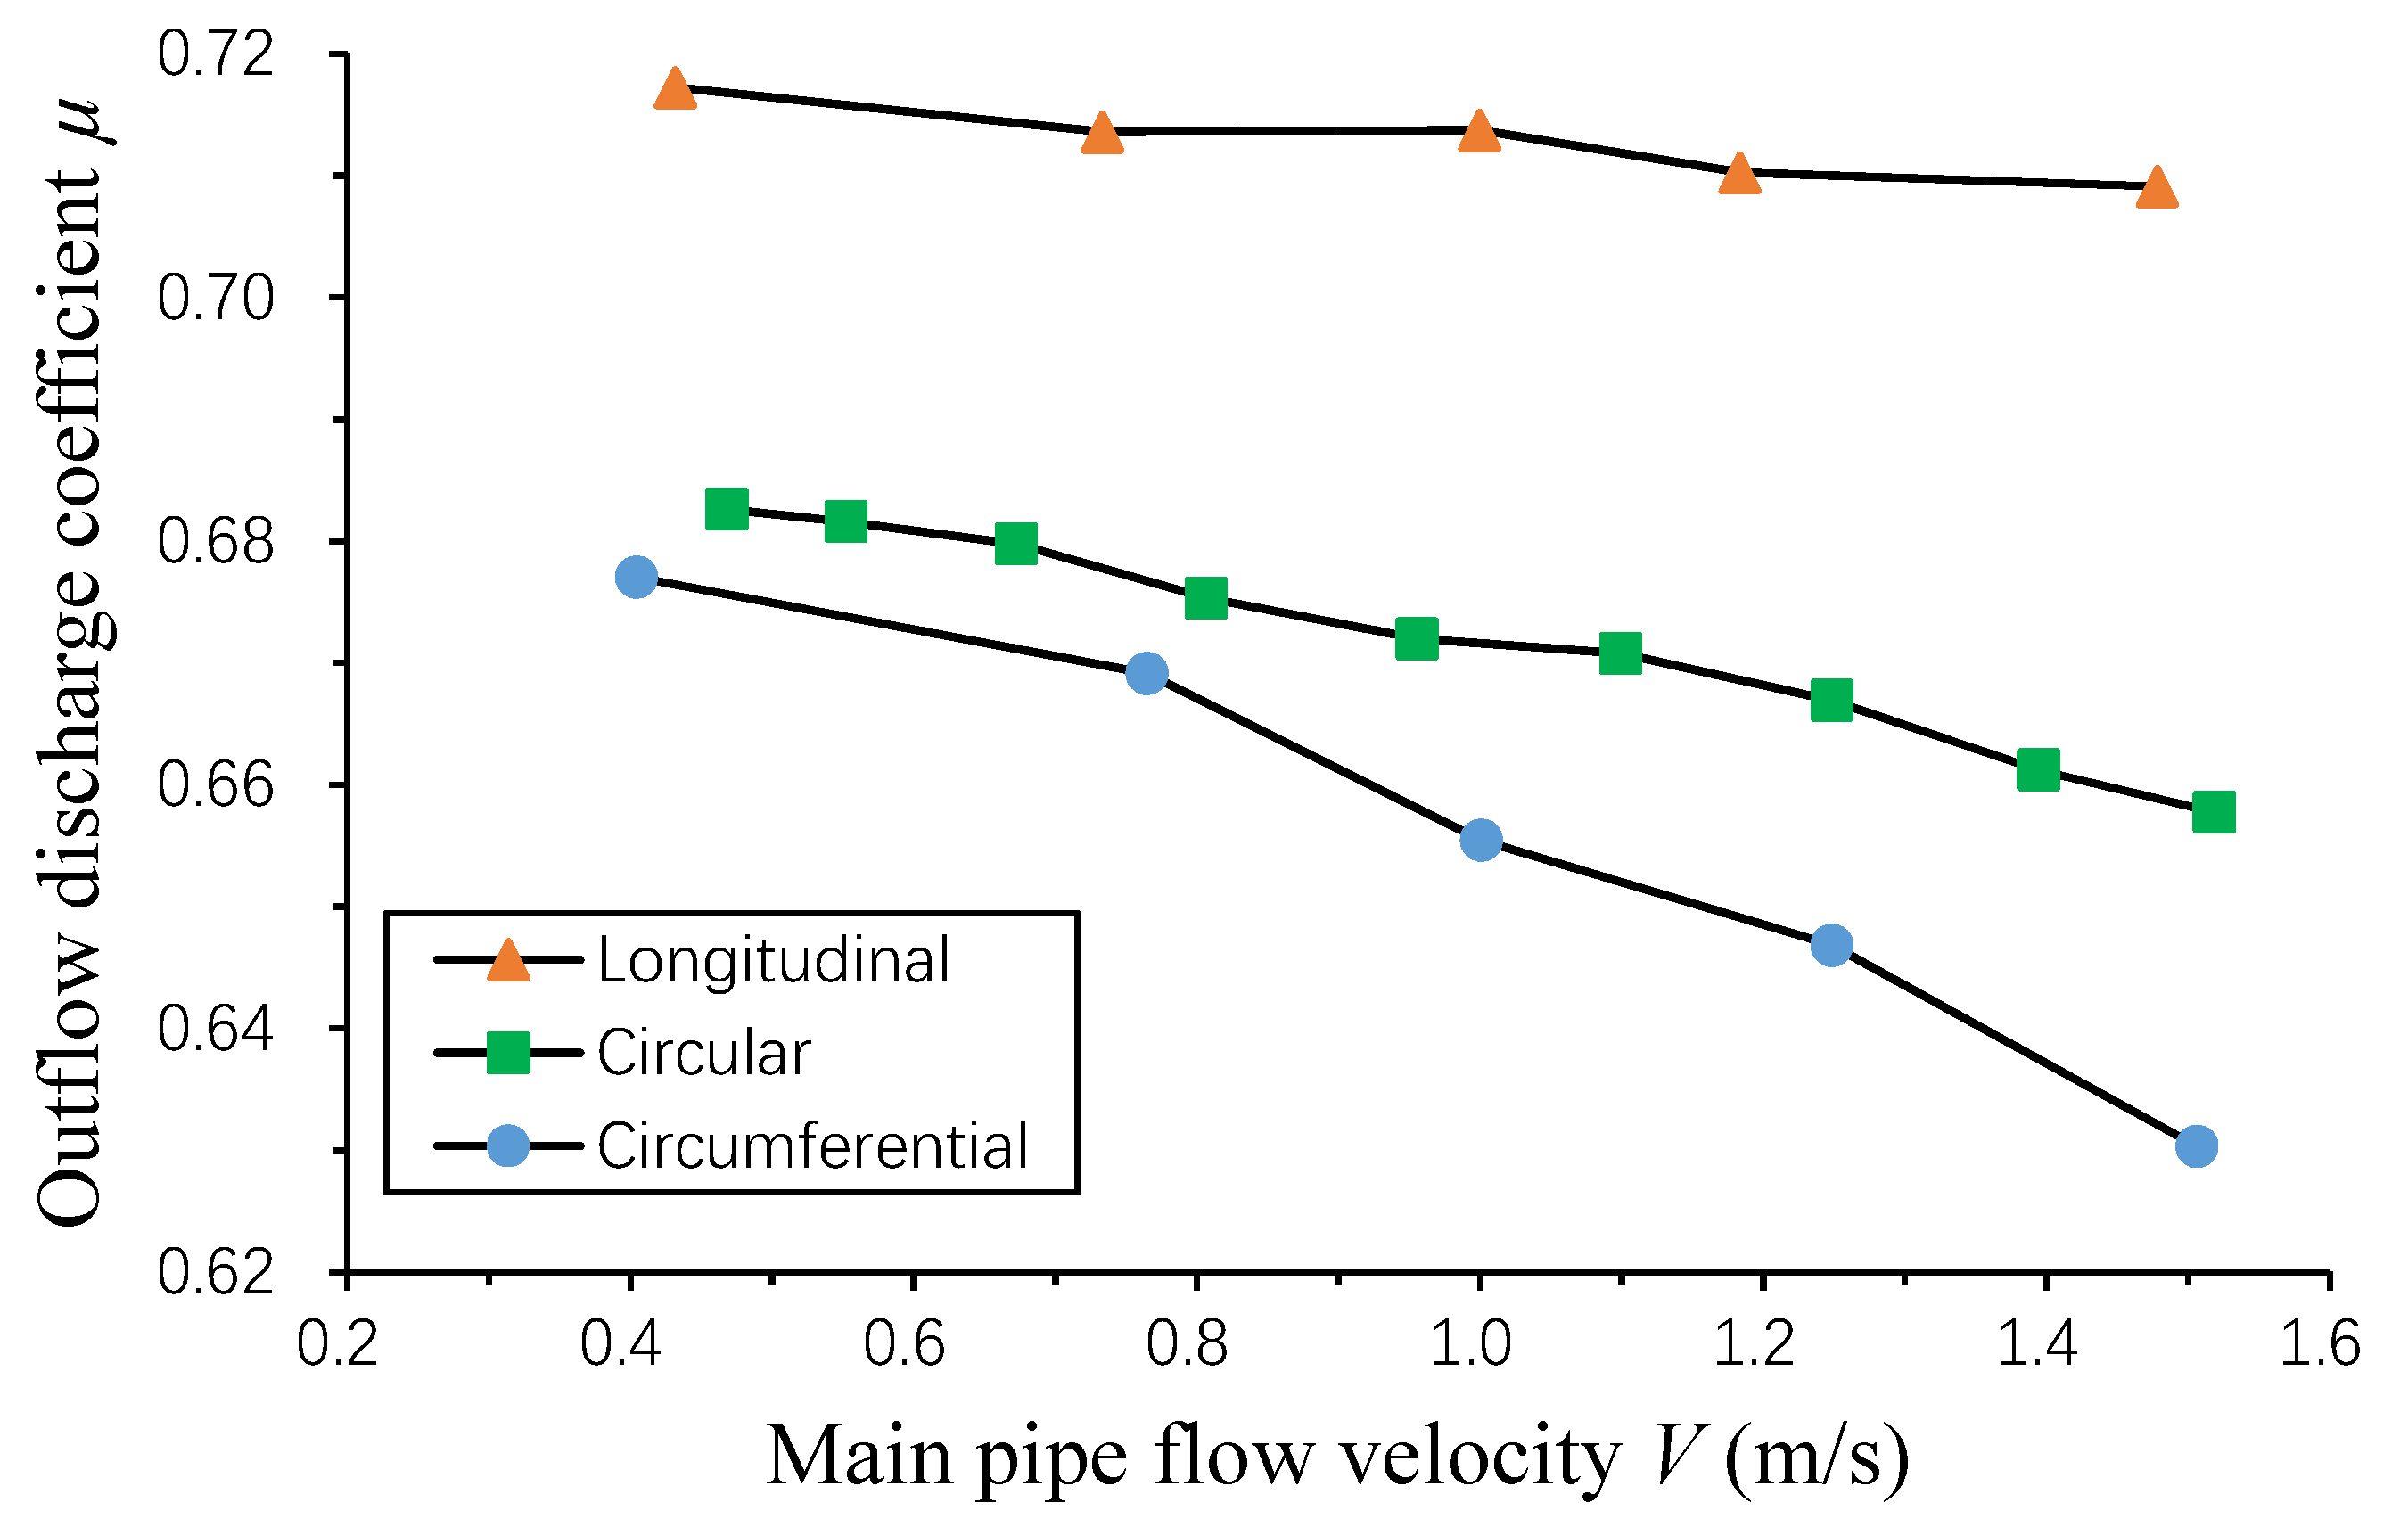
The discharge coefficients for the three types of orifice were determinied for varying main pipe flow velocities (0.4 to 1.5 m/s) under a constant orifice pressue of 2 m, and the results are presented in Figure 11. It can be seen that the slope of the curve corresponding to the circumferential orifice was the largest, and the slope corresponding to longitudinal orifice was the smallest. This indicates that the discharge of the circumferential orifice was most affected by the main pipe flow velocity, while the discharge of the longitudinal orifice was the least affected. Figure 11 also shows that the discharge coefficient of the longitudinal orifice was larger than that of the other two types of orifices with the same opening area. It is confirmed that without the main pipe flow velocity (V), the shape of the rectangular orifices with the same area had no obvious influence on the discharge coefficient [24]. This may be because with the presence of V, the contraction cross section mainly shrank at the upper interface of the orifice, as shown in Figure 7b. In the three orifices, the circumferential orifice had the longest upper interface, resulting in the largest contraction of the jet and the smallest discharge coefficient. The longitudinal orifice was just the opposite to that of the circumferential orifice. Therefore, the longitudinal cracks with the higher flow discharge coefficient should be more affected during the actual leakage control.
4. Results of the Orifice Inflow Study
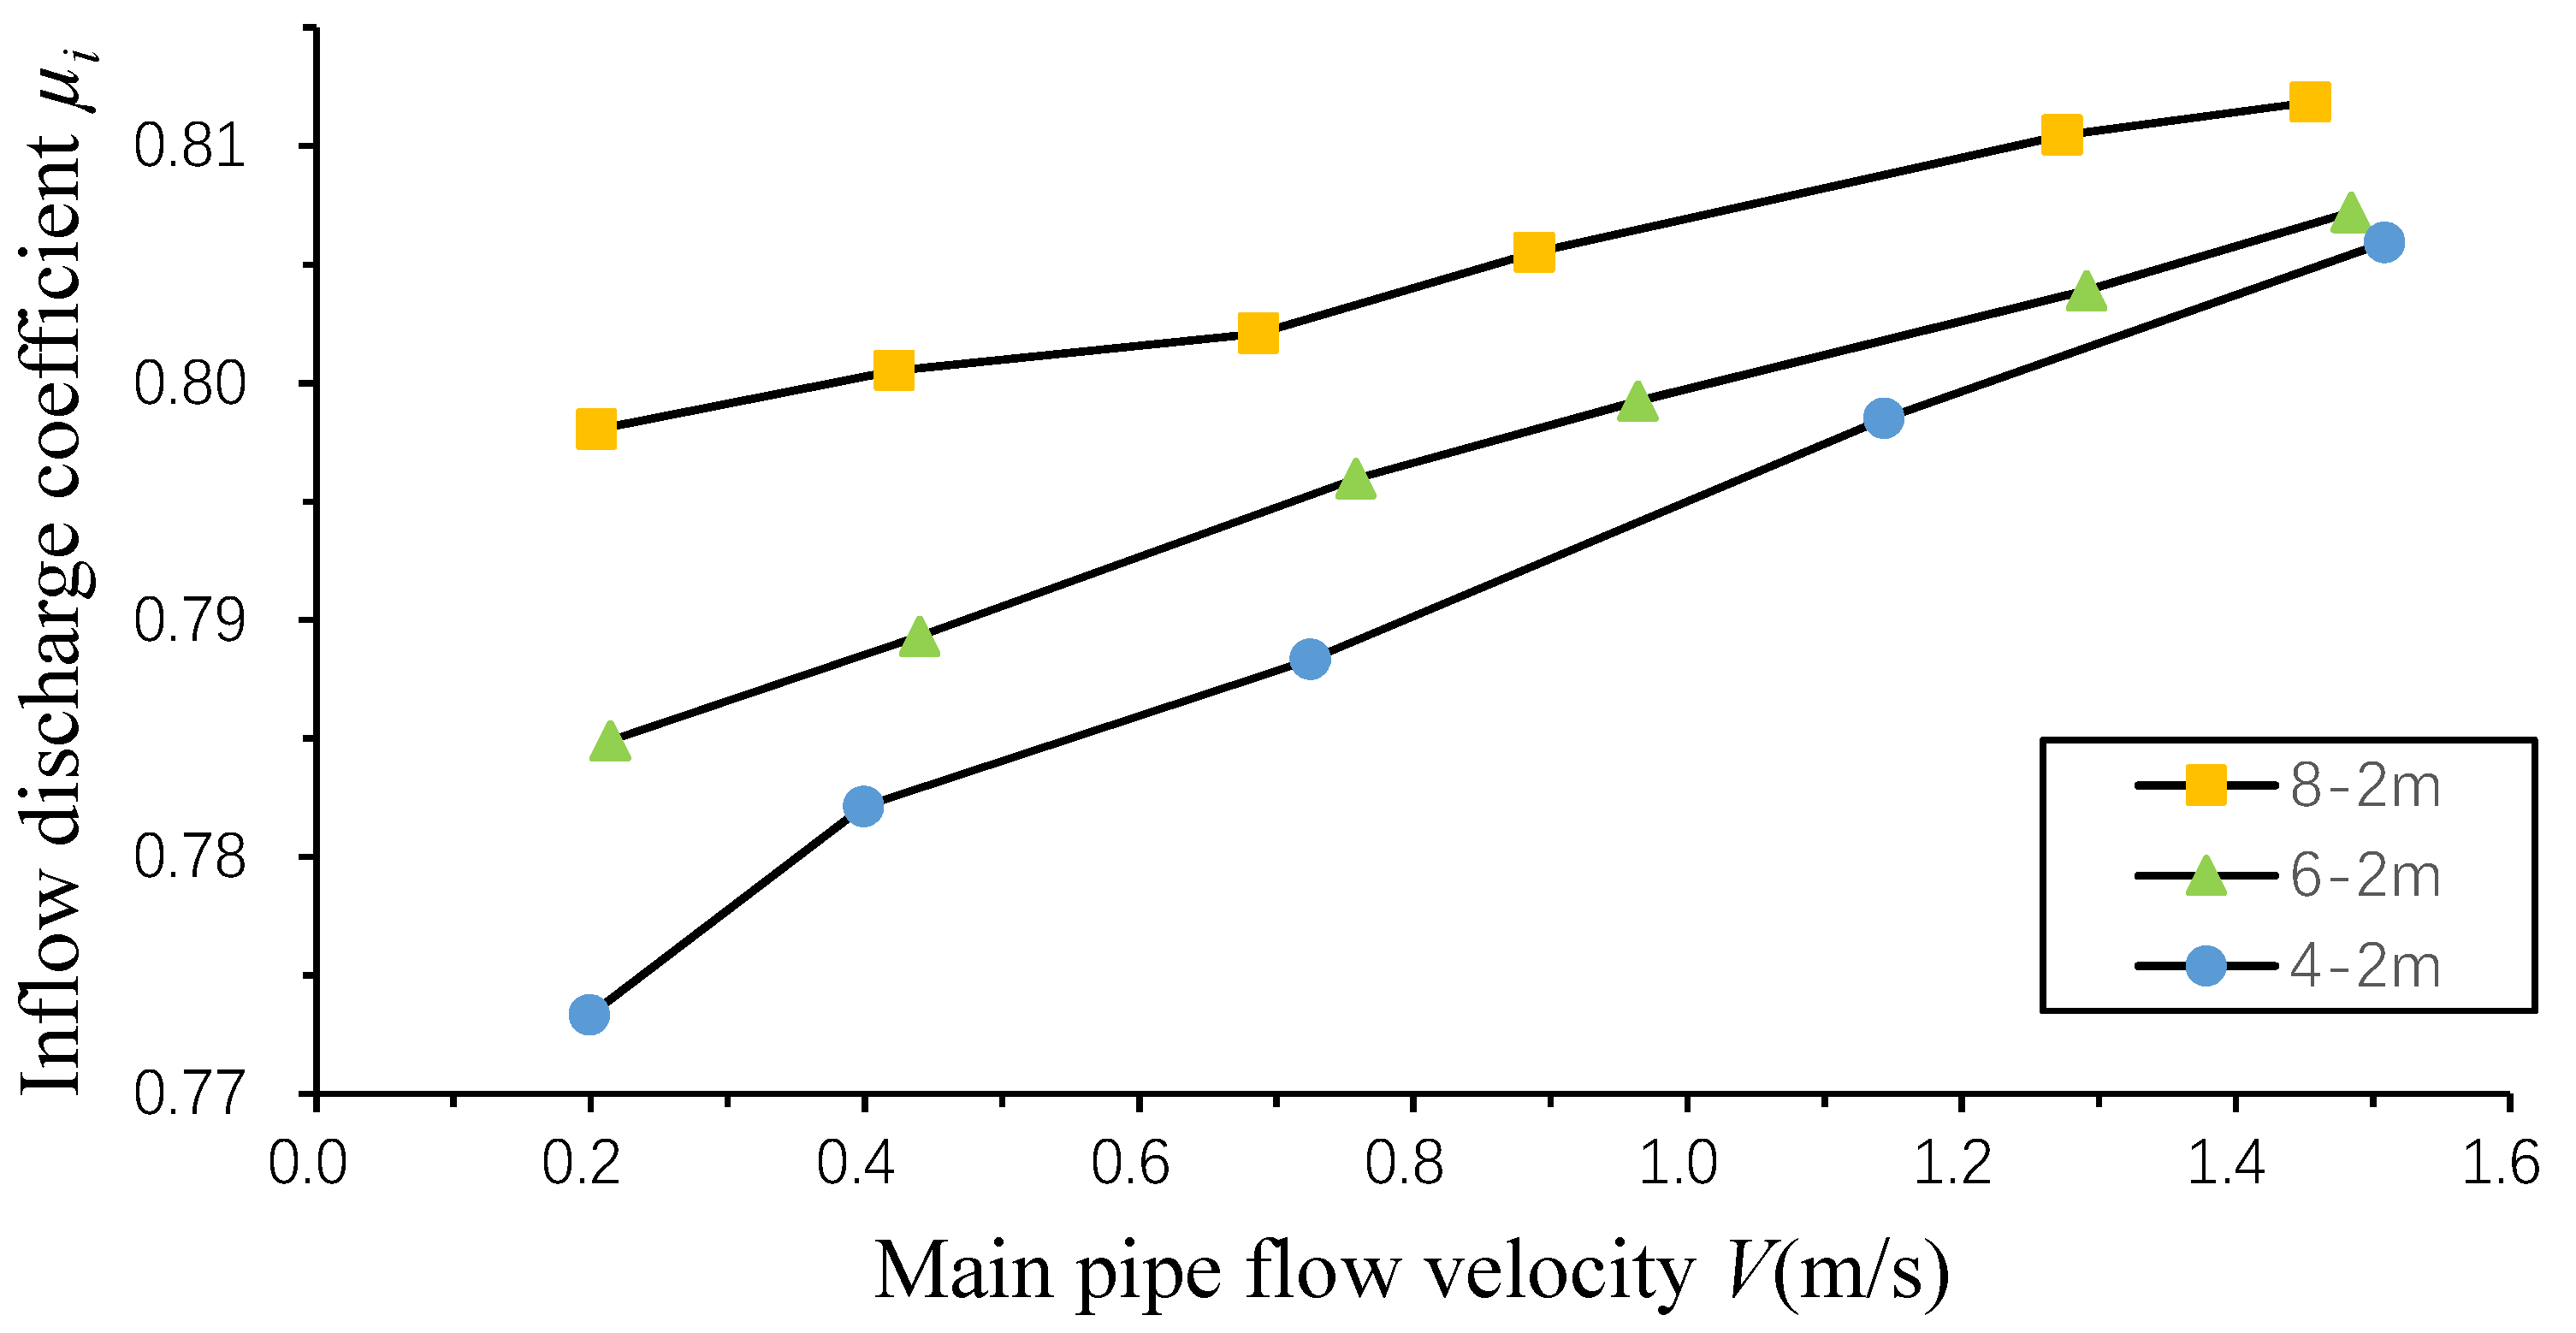
The orifice inflow (intrusion) in WDSs is submerged flow, which means that the head loss experienced by the submerged jet includes not only the minor loss through the orifice but also the sudden expansion from the vena contracta in the downstream water body. In the experiments for the orifice inflow study, the circular orifice was used, and the pipe internal pressure was controlled at about 2 m by adjusting the water levels of the two overflow tanks connected to the pipe. The main pipe flow velocity (V) was adjusted by controlling the diaphragm valve opening. The external pressure was set to 4 m, 6 m and 8 m by adjusting the pump frequency and the diaphragm valve opening at the same time. The inflow discharge coefficients (μi), were calculated for different scenarios and the results are shown in Figure 12.
It can be seen from Figure 12 that, when the orifice pressure head difference was 2 m (i.e., 4 m external pressure), the inflow discharge coefficient changed from 0.773 to 0.806 (an increase of 4.3%) while the main pipe flow velocity increased from 0.2 to 1.6 m/s. In addition, the smaller the pressure head difference, the greater the slope of the corresponding curve; which means that the influence of the main pipe flow velocity on the orifice inflow was more significant for the lower orifice head difference.
Compared with the outflow discharge coefficient curve for the circular orifice in Figure 11 (under the same orifice and pressure conditions) the inflow discharge coefficients were larger than the outflow discharge coefficients for all the main pipe flow velocities considered. More importantly, with the increase of the main pipe flow velocity, the inflow discharge coefficient increased, while the outflow discharge coefficient decreased. Compared with the outflow discharge coefficients in Figure 9 (under the same orifice and main pipe flow conditions) the inflow discharge coefficient increased with the increase in orifice pressure head difference, while the outflow discharge coefficient decreased. These observations contradict to the conventional thinking that the discharge coefficients for through-wall orifice inflow and outflow are the same, as discussed in some of the literature [16].
It is clear that the difference in the inflow and outflow discharge coefficients as observed is mainly related due to the inertia (the kinetic energy) of the main pipe flow. However, more research is needed to understand the relationship.
5. Conclusions
A series of laboratory experiments were conducted to study the effect of the main pipe flow velocity on the water leakage (orifice outflow) and intrusion (orifice inflow). The findings of this experimental study demonstrate that the main pipe flow velocity can have a significant impact on the estimation of the leakage or intrusion rate of leaking water pipes. This is particularly important for intrusion analysis, where the pressure difference across the through-wall crack is low and the influence of the main pipe flow velocity is strong.
The key findings are summarized as follows:
- The main pipe flow velocity influenced the orifice outflow. When the pressure difference across the orifice was constant, with the increase of the main pipe flow velocity, the outflow velocity increased, but the contraction area of the jet and the outflow discharge coefficient (as calculated using the conventional orifice equation) decreased.
- For the orifice outflow, three types of orifices were considered: a circular orifice to simulate a pinhole leak, a rectangular orifice to simulate a longitudinal crack in a pipe wall, and a rectangular orifice to simulate a circumferential crack. When the orifice pressures and the orifice opening areas were the same, the discharge of the circumferential orifice was the most sensitive to the main pipe flow velocity, and the discharge of the longitudinal orifice was the least sensitive.
- The main pipe flow velocity promoted the orifice inflow. When the pressure difference across the orifice was constant, with the increase of the main pipe flow velocity, the inflow discharge coefficient increased, which the opposite pattern to that of the orifice outflow. For the same pressure difference and the main pipe velocity, the inflow discharge coefficient was larger than the outflow counterpart.
- For both the orifice inflow and outflow, the impact of the main pipe flow velocity was more significant for the lower pressure head difference across the orifice.
Future studies should investigate the underlying reasons for the discharge coefficient discrepancy between the orifice inflow and outflow. The curvature of the pipe wall the orifice located at may be a significant factor. The mathematical expression of the outflow velocity and the main pipe velocity is also worth exploring. This study will help to more accurately assess the discharge of leakage and intrusion in the water distribution system.
Author Contributions
Formal analysis, J.G.; Investigation, Y.S., T.Y., J.L. and T.Y.; Methodology, T.Y.; Project administration, Y.S.; Supervision, T.Z.; Validation, T.Y.; Visualization, T.Y.; Writing—original draft, Y.S.; Writing—review and editing, J.G.
Funding
This research was funded by Zhejiang Science and Technology Program (No. 2015C33007) and National Natural Science Foundation of China (No. 51478417 & No. 51761145022).
Conflicts of Interest
The authors declare no conflict of interest.
References
- Beuken, R.H.S.; Lavooij, C.S.W.; Bosch, A.; Schaap, P.G. Low leakage in the Netherlands confirmed. In Proceedings of the 8th Annual Water Distribution Systems Analysis Symposium (WDSA 2006), Cincinnati, OH, USA, 27–30 August 2006. [Google Scholar]
- Mutikanga, H.E.; Sharma, S.; Vairavamoorthy, K. Water loss management in developing countries: Challenges and prospects. J. Am. Water Works Assn. 2009, 101, 57–68. [Google Scholar] [CrossRef]
- Besner, M.C.; Prevost, M.; Regli, S. Assessing the public health risk of microbial intrusion events in distribution systems: Conceptual model, available data, and challenges. Water Res. 2011, 45, 961–979. [Google Scholar] [CrossRef] [PubMed]
- Yu, T.C.; Jin, H.F.; Zhang, T.Q.; Shao, Y.; Wu, X. Experimental observation on factors affecting intrusion volumes during low or negative pressure events. J. Water Supply Res. Technol.-Aqua 2016, 65, 396–406. [Google Scholar] [CrossRef]
- Mora-Rodriguez, J.; Delgado-Galvan, X.; Ramos, H.M.; Lopez-Jimenez, P.A. An overview of leaks and intrusion for different pipe materials and failures. Urban Water J. 2014, 11, 1–10. [Google Scholar] [CrossRef]
- Lambert, A.O. International report: Water losses management and techniques. Water Sci. Technol. Water Supply 2002, 2, 1–20. [Google Scholar] [CrossRef]
- Van Zyl, J.E.; Clayton, C.R.I. The effect of pressure on leakage in water distribution systems. Proc. Inst. Civ. Eng.-Water Manag. 2007, 160, 109–114. [Google Scholar] [CrossRef]
- Cassa, A.M.; van Zyl, J.E.; Laubscher, R.F. A numerical investigation into the effect of pressure on holes and cracks in water supply pipes. Urban Water J. 2010, 7, 109–120. [Google Scholar] [CrossRef]
- Ferrante, M.; Massari, C.; Brunone, B.; Meniconi, S. Experimental Evidence of Hysteresis in the Head-Discharge Relationship for a Leak in a Polyethylene Pipe. J. Hydraul. Eng-ASCE 2011, 137, 775–780. [Google Scholar] [CrossRef]
- Massari, C.; Ferrante, M.; Brunone, B.; Meniconi, S. Is the leak head-discharge relationship in polyethylene pipes a bijective function? J. Hydraul. Res. 2012, 50, 409–417. [Google Scholar] [CrossRef]
- De Marchis, M.; Fontanazza, C.M.; Freni, G.; Notaro, V.; Puleo, V. Experimental Evidence of Leaks in Elastic Pipes. Water Resour. Manag. 2016, 30, 2005–2019. [Google Scholar] [CrossRef]
- Ssozi, E.N.; Reddy, B.D.; van Zyl, J.E. Numerical Investigation of the Influence of Viscoelastic Deformation on the Pressure-Leakage Behavior of Plastic Pipes. J. Hydraul. Eng. 2016, 142, 04015057. [Google Scholar] [CrossRef]
- Fox, S.; Collins, R.; Boxall, J. Experimental Study Exploring the Interaction of Structural and Leakage Dynamics. J. Hydraul. Eng. 2017, 143, 04016080. [Google Scholar] [CrossRef]
- Lin, C.C. A Hybrid Heuristic Optimization Approach for Leak Detection in Pipe Networks Using Ordinal Optimization Approach and the Symbiotic Organism Search. Water 2017, 9, 812. [Google Scholar] [CrossRef]
- van Zyl, J.E.; Lambert, A.O.; Collins, R. Realistic Modeling of Leakage and Intrusion Flows through Leak Openings in Pipes. J. Hydraul. Eng. 2017, 143. [Google Scholar] [CrossRef]
- Mora-Rodriguez, J.; Delgado-Galvan, X.; Ortiz-Medel, J.; Ramos, H.M.; Fuertes-Miquel, V.S.; Lopez-Jimenez, P.A. Pathogen intrusion flows in water distribution systems: According to orifice equations. J. Water Supply Res. Technol.-AQUA 2015, 64, 857–869. [Google Scholar] [CrossRef]
- Jan, C.-D.; Nguyen, Q.-T. Discharge Coefficient for a Water Flow through a Bottom Orifice of a Conical Hopper. J. Irrig. Drain Eng 2010, 136, 567–572. [Google Scholar] [CrossRef]
- McLemore, A.J.; Tyner, J.S.; Yoder, D.C.; Buchanan, J.R. Discharge Coefficients for Orifices Cut into Round Pipes. J. Irrig. Drain Eng. 2013, 139, 947–954. [Google Scholar] [CrossRef]
- Noack, C.; Ulanicki, B. Modelling of Soil Diffusibility on Leakage Characteristics of Buried Pipes. In Proceedings of the 8th Water Distribution Systems Analysis Symposium, Cincinnati, OH, USA, 27–30 August 2006; pp. 1–9. [Google Scholar]
- Collins, R.; Boxall, J. Influence of Ground Conditions on Intrusion Flows through Apertures in Distribution Pipes. J. Hydraul. Eng. 2013, 139, 1052–1061. [Google Scholar] [CrossRef] [Green Version]
- Yu, H.F.; Li, X.G.; Sui, H.; Xu, C.C.; Li, H. Simulation of Orifice Flow Influenced by Lateral Flow in a Trough-Type Liquid Distributor. Chem. Eng. Technol. 2013, 36, 1975–1984. [Google Scholar] [CrossRef]
- Patterson, J.; Page, N.W.; Ritchie, J.B. Contraction coefficients for compressible flow through axisymmetric orifices. Int. J. Mech. Sci. 1970, 12, 405–415. [Google Scholar] [CrossRef]
- International Organization for Standardization. Measurement of Fluid Flow by Means of Orifice Plates, Nozzles, and Venturi Tubes Inserted in Circular Cross Section Conduits Running Full; International Organization for Standardization: Geneva, Switzerland, 1976. [Google Scholar]
- Wang, X.; Li, A.; Sobey, A.J.; Tan, M. Investigation into the effects of two immiscible fluids on coefficient of discharge during Compartment Flooding. Ocean Eng. 2016, 111, 254–266. [Google Scholar] [CrossRef] [Green Version]
Figure 1.
Schematic diagram of the experimental setup for the orifice outflow study.

Figure 2.
Photos of the three orifices: (a) the circular orifice, (b) the circumferential orifice, and (c) the longitudinal orifice.
Figure 2.
Photos of the three orifices: (a) the circular orifice, (b) the circumferential orifice, and (c) the longitudinal orifice.

Figure 3.
Schematic diagram of the experimental setup for the orifice inflow study.

Figure 4.
Customised pressure tank in the orifice inflow experimental setup.

Figure 5.
Photos showing that the inclination of the circular orifice outflow (θ) varied with the main pipe flow velocity (V).
Figure 5.
Photos showing that the inclination of the circular orifice outflow (θ) varied with the main pipe flow velocity (V).

Figure 6.
Relationship between the outflow inclination (θ) and the main pipe flow velocity (V) under various orifice pressure conditions (1 to 5 m).
Figure 6.
Relationship between the outflow inclination (θ) and the main pipe flow velocity (V) under various orifice pressure conditions (1 to 5 m).

Figure 7.
Orifice outflow jet (a) and the contracted cross-sectional area (b).

Figure 8.
Variations of the orifice contraction coefficient and the orifice velocity according to the main pipe flow velocity (circular orifice, 2 m orifice pressure).
Figure 8.
Variations of the orifice contraction coefficient and the orifice velocity according to the main pipe flow velocity (circular orifice, 2 m orifice pressure).

Figure 9.
Variations of the outflow discharge coefficient of a circular orifice according to the main pipe flow velocity under different pressure conditions (1 to 20 m).
Figure 9.
Variations of the outflow discharge coefficient of a circular orifice according to the main pipe flow velocity under different pressure conditions (1 to 20 m).

Figure 10.
The outflow jets from differently-shaped orifices: (a) longitudinal; (b) circular; (c) circumferential.
Figure 10.
The outflow jets from differently-shaped orifices: (a) longitudinal; (b) circular; (c) circumferential.

Figure 11.
Outflow discharge coefficients for orifices in different shapes and orientations, with the main pipe flow velocity varying from 0.4 to 1.5 m/s and a constant orifice pressure of about 2 m.
Figure 11.
Outflow discharge coefficients for orifices in different shapes and orientations, with the main pipe flow velocity varying from 0.4 to 1.5 m/s and a constant orifice pressure of about 2 m.

Figure 12.
Inflow discharge coefficients for the circular orifice (with pipe internal pressure at 2 m and external pressure at 4, 6 and 8 m).
Figure 12.
Inflow discharge coefficients for the circular orifice (with pipe internal pressure at 2 m and external pressure at 4, 6 and 8 m).

© 2019 by the authors. Licensee MDPI, Basel, Switzerland. This article is an open access article distributed under the terms and conditions of the Creative Commons Attribution (CC BY) license (http://creativecommons.org/licenses/by/4.0/).
Share and Cite
MDPI and ACS Style
Shao, Y.; Yao, T.; Gong, J.; Liu, J.; Zhang, T.; Yu, T. Impact of Main Pipe Flow Velocity on Leakage and Intrusion Flow: An Experimental Study. Water 2019, 11, 118. https://doi.org/10.3390/w11010118
AMA Style
Shao Y, Yao T, Gong J, Liu J, Zhang T, Yu T. Impact of Main Pipe Flow Velocity on Leakage and Intrusion Flow: An Experimental Study. Water. 2019; 11(1):118. https://doi.org/10.3390/w11010118
Chicago/Turabian StyleShao, Yu, Tian Yao, Jinzhe Gong, Jinjie Liu, Tuqiao Zhang, and Tingchao Yu. 2019. "Impact of Main Pipe Flow Velocity on Leakage and Intrusion Flow: An Experimental Study" Water 11, no. 1: 118. https://doi.org/10.3390/w11010118
Note that from the first issue of 2016, this journal uses article numbers instead of page numbers. See further details here.