Systematic Predictive Analysis of Personalized Life Expectancy Using Smart Devices


School of Information Technology, Deakin University, Burwood, VIC 3125, Australia
*
Author to whom correspondence should be addressed.
Technologies 2018, 6(3), 74; https://doi.org/10.3390/technologies6030074
Submission received: 19 July 2018
/
Revised: 3 August 2018
/
Accepted: 9 August 2018
/
Published: 10 August 2018
Abstract
:With the emergence of technologies such as electronic health and mobile health (eHealth/mHealth), cloud computing, big data, and the Internet of Things (IoT), health related data are increasing and many applications such as smartphone apps and wearable devices that provide wellness and fitness tracking are entering the market. Some apps provide health related data such as sleep monitoring, heart rate measuring, and calorie expenditure collected and processed by the devices and servers in the cloud. These requirements can be extended to provide a personalized life expectancy (PLE) for the purpose of wellbeing and encouraging lifestyle improvement. No existing works provide this PLE information that is developed and customized for the individual. This article is based on the concurrent models and methodologies to calculate and predict life expectancy (LE) and proposes an idea of using multi-phased approaches to the solution as the project requires an immense and broad range of work to accomplish. As a result, the current prediction of LE, which was found to be up to a maximum of five years could potentially be extended to a lifetime prediction by utilizing generic health data. In this article, the novel idea of the solution proposing a PLE on an individual basis, which can be extended to lifetime is presented in addition to the existing works.
1. Introduction
The problem of processing datasets such as electronic medical records (EMR), and their integration with genomics, environmental factors, socioeconomic factors and patient behavior variations have posed a problem for researchers in the health industry. Due to the evolution of data science technologies such as big data virtualization and analytics, data wrangling and with the cloud, health workers now have an improved way of processing and developing meaningful information from huge datasets that have been accumulated over many years. For example, a case study [1] shows that big data and machine learning techniques can benefit public health researchers with analyzing thousands of variables to obtain data regarding life expectancy and anxiety disorders. They used the demographics of selected regional areas and multiple behavioral health disorders across regions to find correlations between individual behavior indicators and behavioral health outcomes. Smart environment and wireless network technologies [2,3,4,5] have also been used to improve the monitoring of chronic diseases with the evolutions in the Internet of Things (IoT) and cloud computing by building smart cities and homes, which allowed the rapidly growing elderly population to access healthcare resources in a cost-effective way.
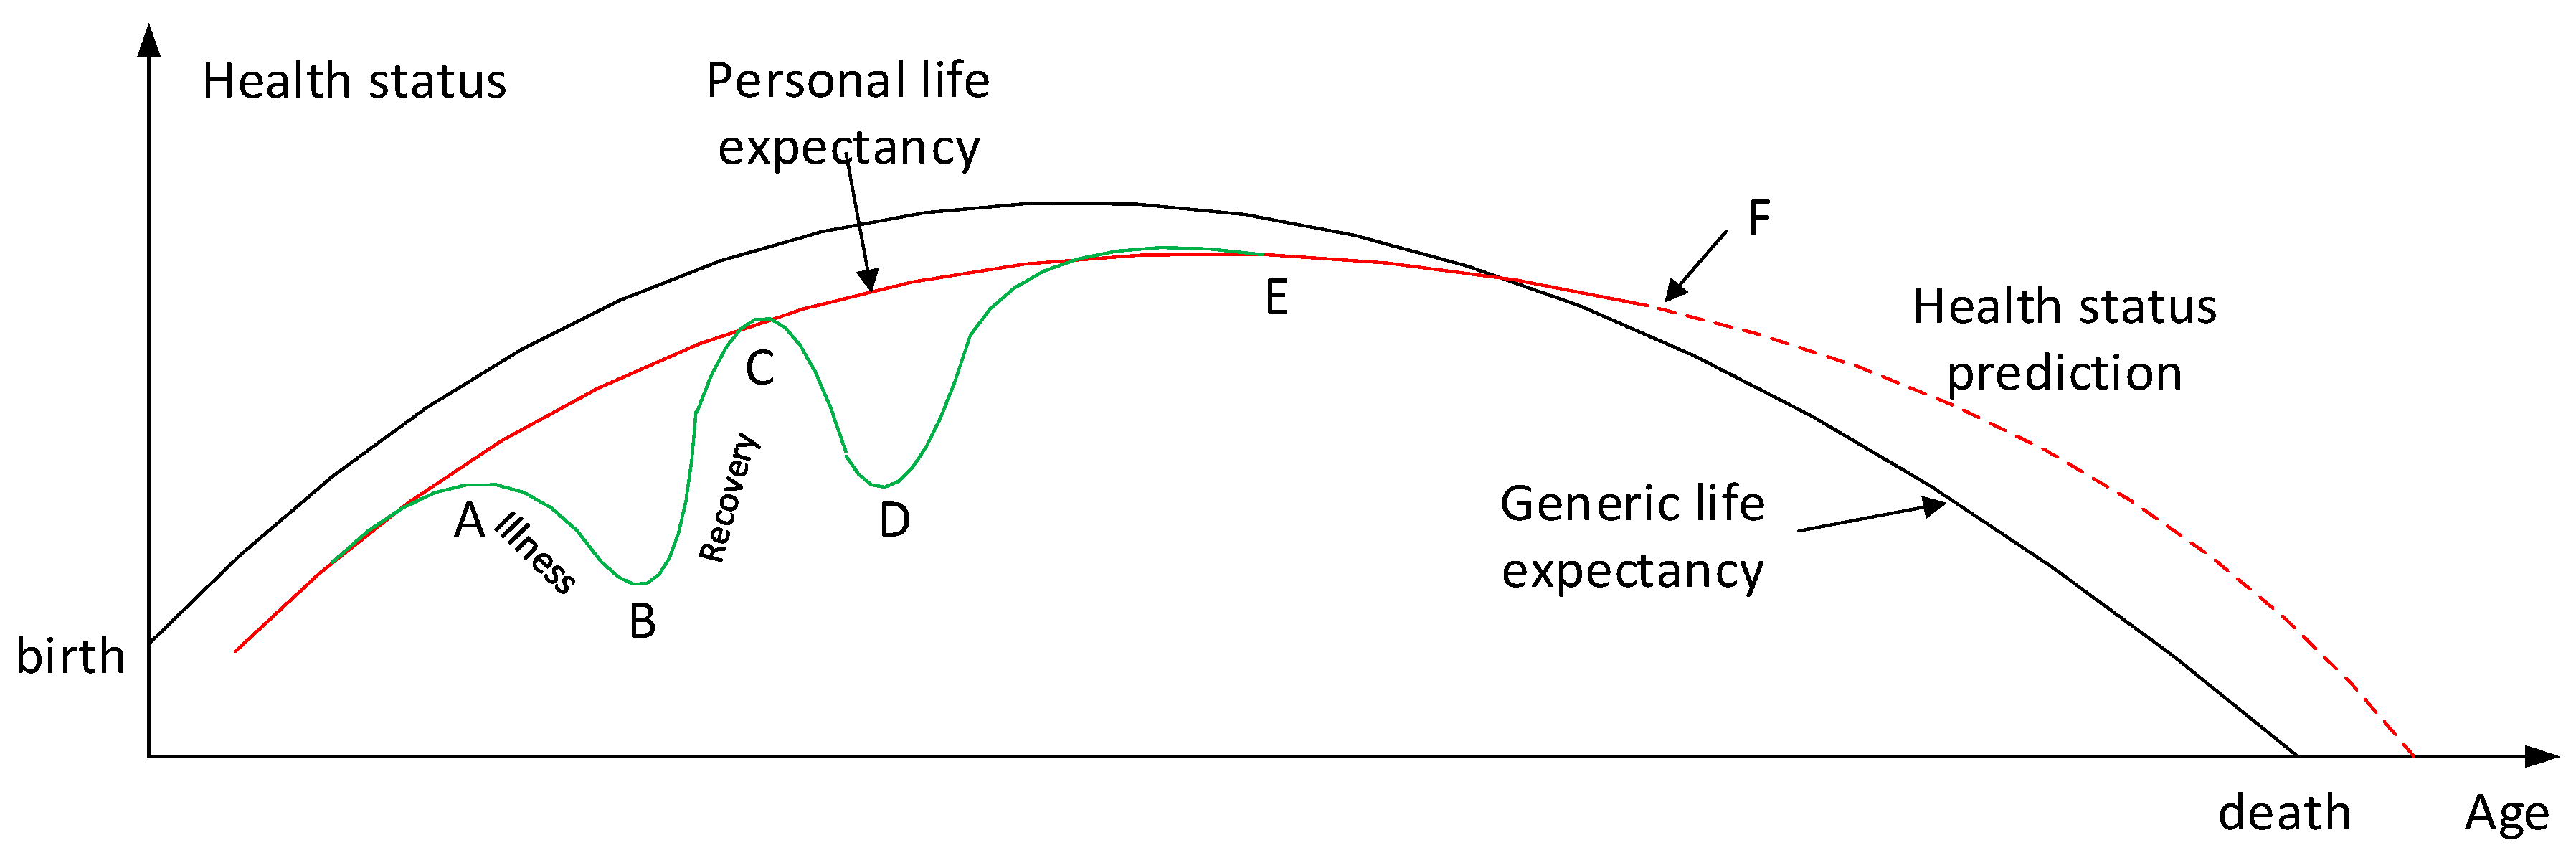
Banaee et al. [6] proposes the idea of a potential application model that can be elaborated on as an application of using personal health status. As described in Figure 1, it may be possible to create a prediction of personal life expectancy, which can be further used to calculate health indexes on a generic level for which the individualized expectancies may be compared against.
This model can also depict the life expectancy predicted by an inference system, which transmits health data over wireless sensor networks [8]. Generic life expectancies may be calculated from multiple sources obtained and analyzed by big data. These values can be used to create a personalized graph that most resembles the individual in question, with consideration for personal characteristics such as their age, gender, ethnicity, living environment and current comorbidities or lifestyle habits. There may be an enormous number of variables to consider, of which increasing the number may obviously increase the accuracy of a LE prediction. This personalized graph can then be compared with other individuals who may be living similar lifestyles and share similar traits to provide an idea of the generic life expectancy. This concept is described in Figure 1 with the red and black lines superimposed on each other. During point A, the graph shows that the user was ill and there was a decrease in the overall health status until point C when the user recovered, followed by another case of illness at point C until they recovered finally at point E. Point F describes the present moment in time, at which point any values following this point would be an inferred prediction of the individual’s health status for the future. This prediction would be an inference made of physiological data analyzed by the cloud computation. Whilst the red line shows a trend line of the history of the user’s health status and a rough estimate of his or her future health, the graph may also show fine trends as depicted by the green line. This would be used to inform short term information about whether the user’s health is improving or declining on a more detailed level.
The Health index function g[PQ] is based on the differential of health status between age X1 and X2. For example, when F(x) < 0, the health index function would suggest a decline in health whereas > 0 suggests that the health status is improving (recovery) during the period of A (X1) and B (X2). Periods of illness may be reflected in the health index by a sum illness cycle, which would describe the number and the total durations of illness days. Inference should take into account the information held within its own database along with that received from external agents, such as from monitoring centers (MC) or caregiver terminals (CT) in mHealth networks.
As presented in [8], the health status of each user would vary from the average values and thresholds of other users, and fine calibration or optimization may be required and could be undertaken by a trained professional, for example a physician. A combination of variables may alter the inference result, as some sensed data may be interdependent and affect one another; e.g., insulin levels and blood pressure. Thus, in inferring whether a change in the user’s health status should trigger a health alarm warning of a potential health event, sensed data should be interpreted together with related variables that are known to affect each other. As time progresses, a user’s profile data is continuously optimized due to the number of inferences made over a longer period of time, and inform a database as to the PLE prediction of each person. As this data is increasingly updated, inferences can be completed more accurately and efficiently.
Smartphones act as a manager within a mHealth network architecture and as an agent in an IoT network, thus exist as an important link for communication between MC, CT and IoT networks after receiving information from sensor nodes. This article describes a new approach towards individualized life expectancy predictions. It discusses health status calculations from inferring data collected by sensor nodes along with calculations done using big data in the cloud. Inference is suggested to be done within the sensor nodes, in order to have control over data sent to the cloud. Smartphone applications can be used to track health status histories and to access future predictions created from inferred data.
As raw and processed data consist of sensitive information, strong security measures are required to protect user privacy such as personal details (e.g., date of birth, identification). Security aspects are therefore critical in dealing with health-related information such as privacy in wireless body area networks (WBAN), and has been included for review in this article despite extensive and comprehensive research having being completed by many researchers in network and information security in the health area [9,10,11]. During app implementation, development of algorithms and logics on the predictions for individual and generic data need to be considered as this is crucial to analyzing and producing meaningful and useful information. These aspects have not been completed yet as network infrastructure and merging of technologies continue to be immature for these purposes. This article reviewed existing works and identified that no work has been attempted to predict a personal life expectancy and contributes to the area with an idea of how life expectancy can be predicted on a personal level by providing detailed variables of required data and practical network topology that can be used for producing the predictions.
2. Analysis of Existing Works
As a result of the evolution of biotechnologies and related technologies such as the development of sophisticated medical equipment, humans are able to enjoy longer life expectancies than previously before. For example, a clinical research center claims that in 10 to 12 years from now, for every year that humans live, science is extending the life for more than a year using health intelligence platform integrating genomics, advanced clinical imaging and robust machine learning in a spa-like setting [12]. Predicting a human’s life expectancy has been a long-term question to humankind [13], and there have been many attempts to make the prediction accurate and popular since the prevalence of smartphones and apps. However, the effectiveness of those apps is limited due to the constraints of developing a classification of meta-data, such as the complexity and variety of environmental, geographic, genetic, and living factors of humans. For example, a report showed that people living in a village called Yuzurihara in Japan, also known as “the village of long life”, were ten times more likely to live beyond the age of 85 than anywhere in North America. These people also had similar traits such as smooth skin, flexible joints and thick hair [14]. This implies that geographic and living environments affect the longevity of human life, and the use of statistics can make it possible to forecast a life expectancy of a person who lives in a similar environment village with a similar lifestyle.
Whilst the calculation of life expectancy is a complicated process and requires many variables and circumstances to take into account, there have been several attempts to create an equation despite it being impractical to simplify these variables into one equation. For example, Bhosale and Sundaram [15] suggested a simple equation to compute a line of curve using only three health data including heart rate, blood pressure level and respiration rate.
Jafelice et al. [16] attempted to compute the life expectancy of the HIV/AIDS (Human immunodeficiency virus infection and acquired immune deficiency syndrome) population using a fuzzy set-based model. Based on the assumption that viral load and CD4+ (cluster designation positive cells) level are the most important variables to characterize HIV infection, they concluded that AIDS has a direct influence in the mortality rate of a population.
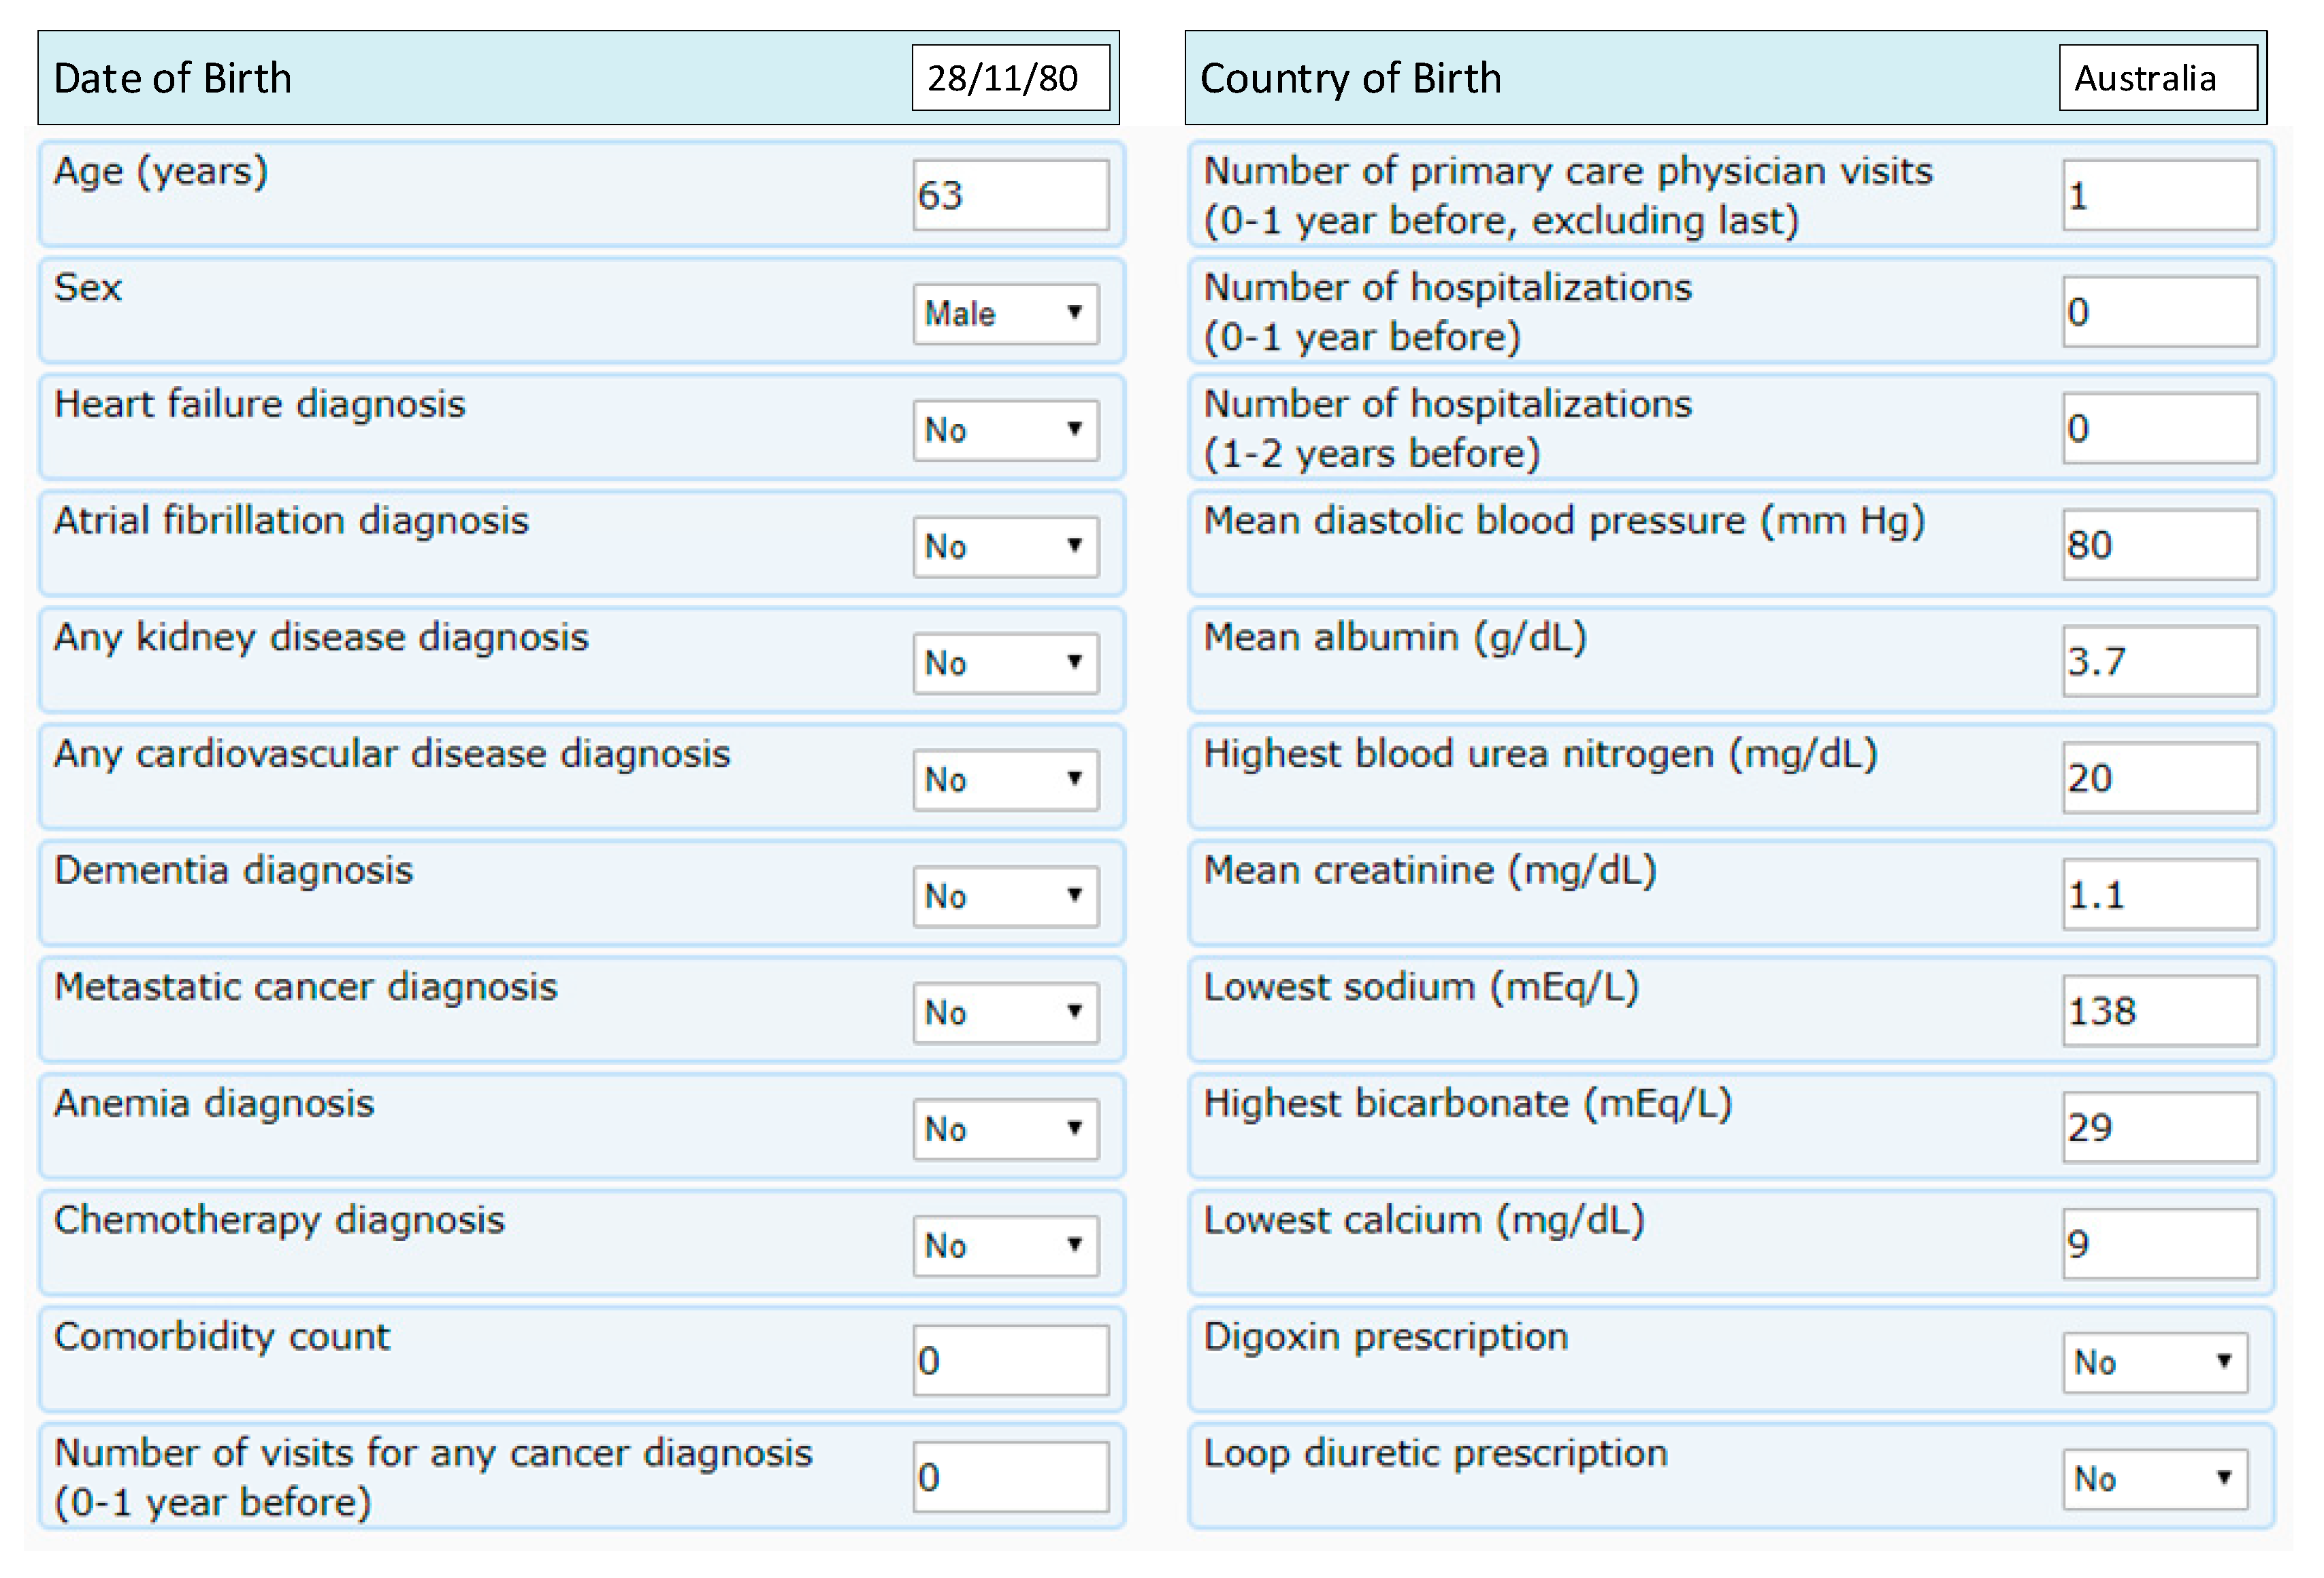
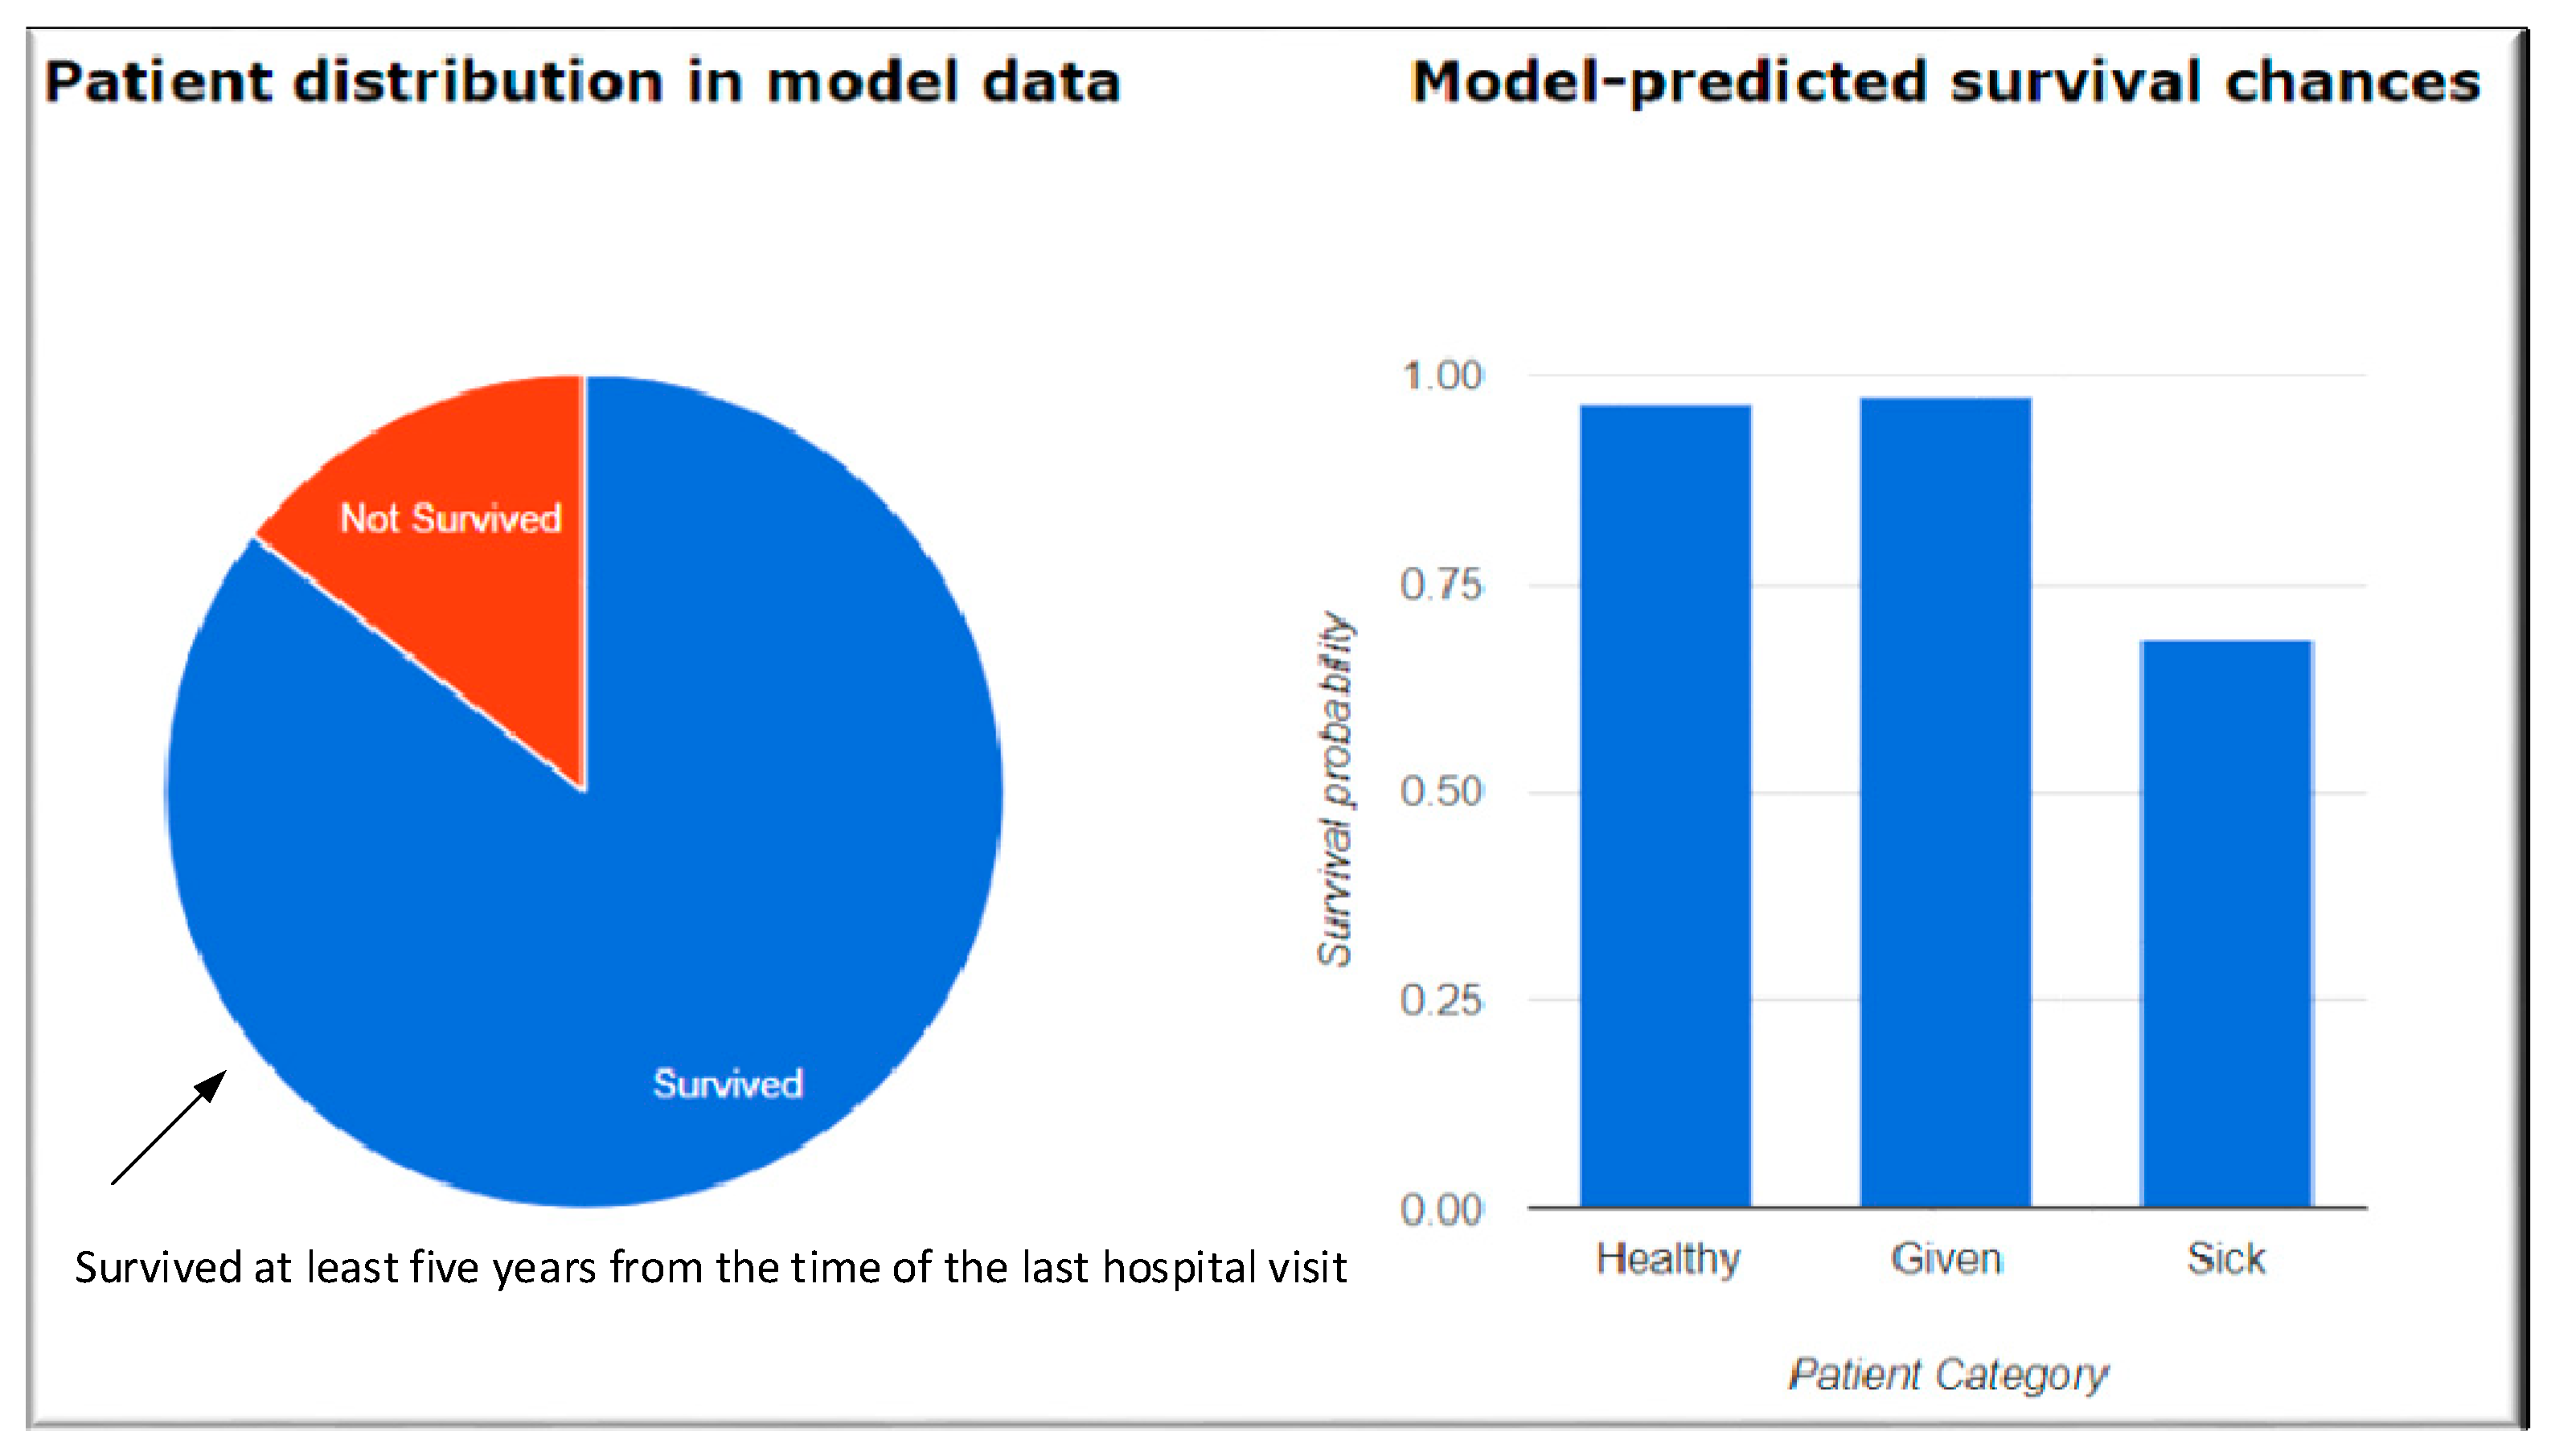
Agrawal et al. attempted to calculate the survival probability to estimate a 5-year survival of a patient from a recent hospital visit. Their approach of using an online web tool taking 24 patient attributes as inputs to generate a PrLE of five year survival calculation is the most relevant and accurate so far [17]. To select the best modeling technique, they analyzed the top five modelling schemes, which had accuracies from between 89.82% and 90.29%.
Figure 2 and Figure 3 shows a screen menu to calculate a five year life expectancy calculation and its result.
Gil-Herrera et al. presented a theory to predict the life expectancy of terminally ill patients for life expectancy prognostication. They used retrospective data of over 9000 patients to assist terminally ill patients in making end-of-life care decisions [19]. However, these life expectancy have only been shown for a specific group of patients such as terminally ill patients only.
There is an association of economic and environmental factors to life expectancy as discovered by Kerdprasop et al. [20]. They tried to show the connection between natural resources and the economic growth to the life expectancy of people in the countries along the Mekong river, and the outcome reveals a strong relationship between environment and GDP growth to the life expectancy of the population.
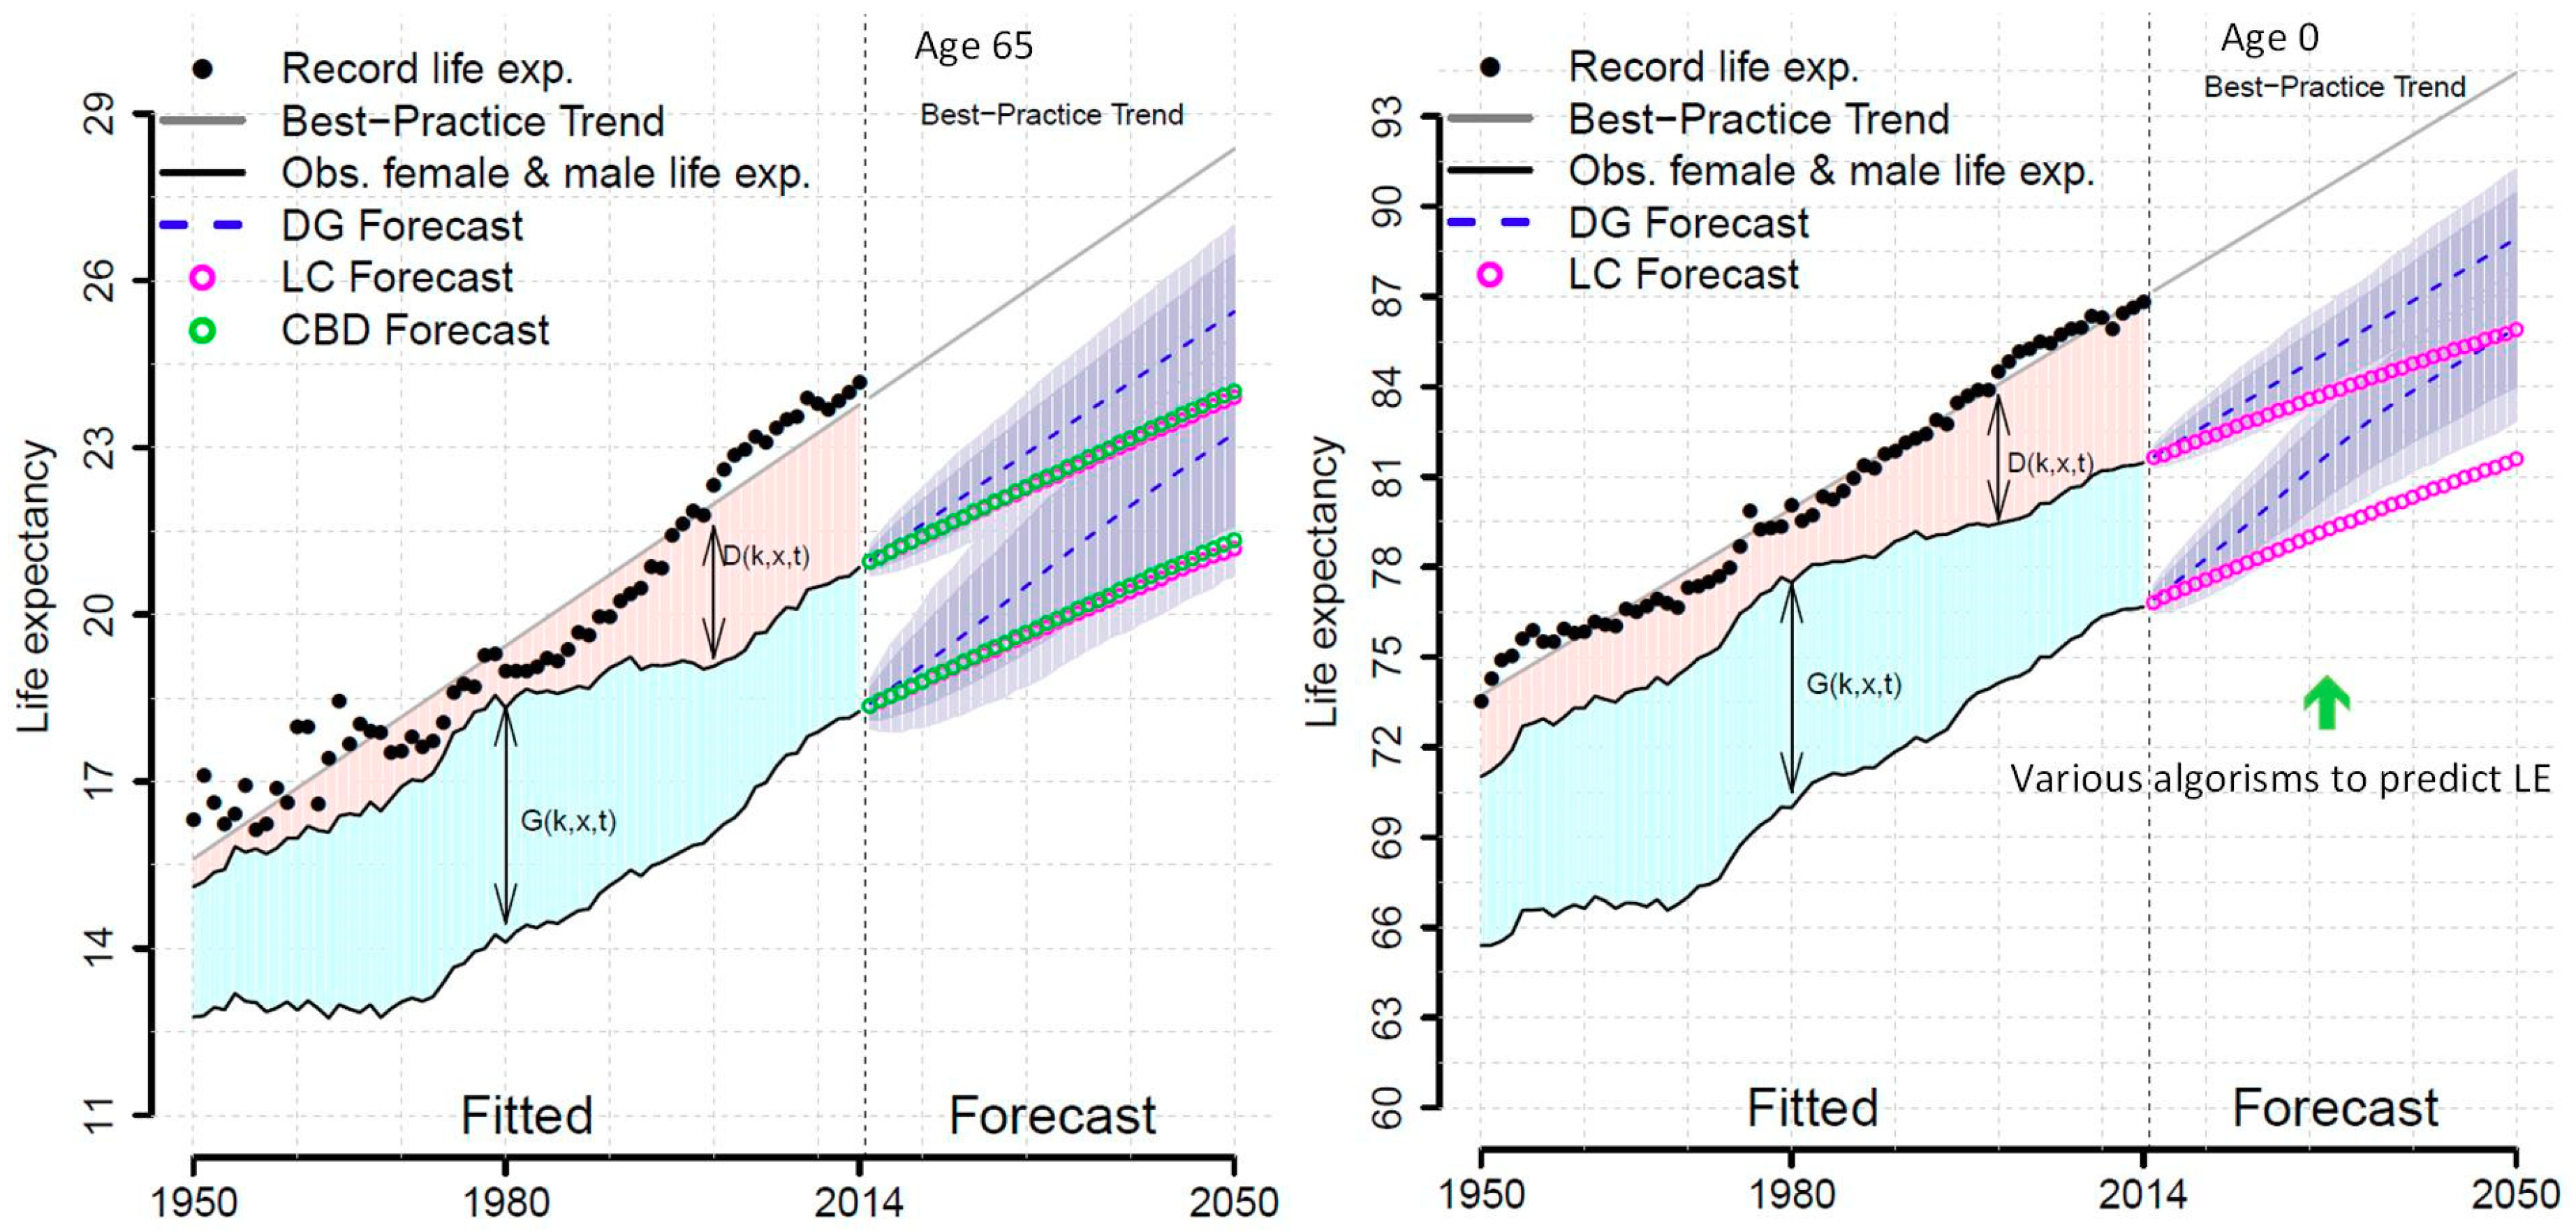
Pascariu et al. [21] proposed a methodology to forecast life expectancy of males and females using the double-gap (DG) approach: (1) the gap between female life expectancy and the best practice trend in the world, which determines future female life expectancy; and (2) the gap between male and female life expectancy to obtain the country specific male life expectancy. They compared the results with the Lee–Carter (LC) model [22] and the Cairns–Blake–Dowd (CBD) model [23], both of which generate a matrix of forecast death rates and the forecasted life expectancies that are computed using standard life table calculations. Their research approach includes a vast range of data sources, which contain mortality data for 47 homogeneous populations in different countries and regions. The time period was between 1950 and 2014 with the ages ranging from 0–95 in 38 countries and regions. They constructed a model for forecasting the life expectancy of males and females for a given age, using correlations amongst countries and gender.
Whilst this may show an improved forecast of male and female life expectancy by taking countries into account, it is still far from providing an individualized life expectancy as they more focused on PrLE of correlations among countries and between sexes as opposed to individuals. Figure 4 depicts the comparison of DG against other methodologies showing differences of the results with better prediction.
There have been many works done in the prediction of LE within the context of specific diseases such as predicting LE in men diagnosed with prostate cancer [24], schizophrenia [25], lung cancer [26,27], breast cancer [28], diabetes [29], limb ischemia [30], IgA nephropathy [31], oral squamous cell carcinoma [32], acute myeloid leukemia [33], and psychiatric disease [34]. These models have also been researched with consideration of geographical and regional areas [35,36,37], income [38], relationship with economic growth [39], and globalization [40]. There are multiple models of LE including Sullivan [41], Lee and Carter [22], Cairns et al. [23] and Jafelice [16]. Table 1 shows LE prediction works based on each category such as diseases, geographical areas and regions, relationships with other factors such as income and economical variables as well as different modelling approaches. Table 2 shows summary of variables used for the modelling technique with contributions made by up to date methodologies.
As a result, for the purpose of this article it is concurred that Agrawal et al. [17] provides the most accurate and useful methodology to calculate individual LE despite it only showing five years of LE. This has so far been the only tool that has been proposed to calculate a PLE for an individual utilizing personalized attributes entered in to questionnaires provided by a web application, whilst others are based on predictions of LE for a group based on larger demographic classifications. However, the variables required to enter to their questionnaire on the website are complex and users are unlikely to enter most of the data due to the difficulty of technical data to obtain. Data that are of a technical nature would be reasonably expected to be entered in by a health practitioner as shown in Figure 2.
Challenges appear in integrating wireless technologies such as wireless local area networks (WLAN) and wireless personal/body area networks (WPAN)/WBANs with existing health networks to meet the quality of service (QoS) requirements for different kinds of medical devices and applications in an integrated and ubiquitous network [42]. Whilst most mHealth users are exposed to wireless networks such as WiFi, which connects to public networks such as cellular, there are compliance issues of using medical sensor devices that may affect WiFi access points as well as cellular networks in terms of electromagnetic field exposure regulations. A government agency such as the European Council issued a directive as to the minimum health and safety requirements regarding the exposure of workers to the risks arising from physical agents (electromagnetic fields) [43,44]. As there have been advances in wireless technologies for healthcare applications and networks, many works in areas such as characterizing electric field (E-field) exposure within the wireless (WiFi) environments [45,46] and the evaluation of electromagnetic dosimetry of wireless systems in complex indoor scenarios with human body interaction [47] or in sensor networks [48] have already been done. Thus, it is not within the scope of this review article to review the impacts to humans by sensor devices and mHealth networks environment whilst it is important to consider those challenges along with managing privacy issues.
Another challenge is the access of health data of general users, whose data may not be stored in medical facilities or databases as many users may not have visited the hospital in the past as well as the lack of uniformity in how data is stored. Additionally, each country and state may have their own regulations in the handling of patient data and security management. It sounds simply to centralize health data by integrating heterogeneous health networks and to combine them in one location. However, the aforementioned laws and regulations may present to be a big hurdle as it relates heavily to the issue of privacy and consent. For example, a user in a developed country may not agree to provide his or her data to be used in another country’s facilities or networks. Once data have been integrated to a centralized cloud server, a separate issue remains to develop algorithms of how to classify and process big data to create meaningful information. Whilst the latter is a technical issue, the former will be critical as it requires government policies and regulations with multiple parties.
When dealing with health-related information and applications converged with IoT which may interact with health devices, adaptive security management techniques are essential to provide a sufficiently secure and robust system. Savola et al. [49] developed a context-aware Markov game theoretic model for security metrics risk impact assessment to evaluate and validate the run-time adaptivity of IoT security solutions by analyzing objective decomposition strategies for IoT eHealth applications. When healthcare information systems have been implemented and used along with IoT, which are deemed to be extremely sensitive as they contain patients’ private information, the healthcare system should guarantee adequate protection of the confidentiality and integrity of patient information. At the same time, the patient information and their health data also needs to be available for authorized health service providers, so that they can provide the proper treatment of the patient [50]. These information and data should be available immediately for urgent cases and the method and ways of accessing them should not be complicated. In other words, ease of access to the data and providing security should be accomplished at the same time, which can be a dilemma. To achieve the goal, it requires changing the business models and the way the IT infrastructure is being delivered as well as the underlying architecture of how they deliver the applications. Zhang and Liu attempted to develop an electronic health record (EHR) security reference model using a use-case scenario describing the security countermeasures and state of the art security techniques as a basic security guard [51]. As mHealth is increasing in prevalence with smartphone applications, there have been works done in the underlying networks and application security services integrated into health networks by looking for mobile specific requirements [52,53]. Due to the demand, IEEE 11,073 workgroup formed a sub-workgroup for cybersecurity to support secure health data exchange between personal health devices (PHD) and their clients. Their objective of the cybersecurity standards is to specify the process and capability of preventing unauthorized access, modification, misuse, denial of use, or the unauthorized use of information that is stored on, accessed from, or transferred to and from a PHD [54]. Therefore, it is required to define and distinguish the constraints of communication and collaboration when developing policies of processes and systems [11] since healthcare systems cannot provide security as a one for all solution in the context of heterogeneous networks and different environments and regulations in each country and states. It also requires the consideration of complexities such as heterogeneous networks, organizational silos and applications requirements, compliance for regulations, security and network capabilities, and costs when building a security solution. For example, light-weight security may be developed for security functions on a smartphone application of group life expectancy against a personal application that may need to protect private information as the size of software directly affects the performance of small devices, which have power constraints.
3. Review Conclusions
Whilst there have been a few attempts to calculate the LE for classified groups and diseases, little has been done to foresee and predict generic or personalized life expectancy, and could be attributed to several contributing factors.
- The overwhelming number of variables that could be considered in predicting LE;
- Lack of accumulated data in one storage location for data processing and analysis to generate meaningful data;
- Difficulty of centralizing heterogeneous networks from different countries and regions;
- Unpredictable and fast changing lifestyle of humans with the increase of sophisticated technologies;
- Limited methods of health data collection such as data only from patients in a healthcare environment (hospitals, insurance companies), which may exclude the general population.
Due to the fast-emerging technologies of big data, machine learning, artificial intelligence, and virtual and smart environment, it may be possible to handle some of the constraints above. Moreover, the prevalence of smartphones in the working generations even in developing countries makes it a possibility to collect health data anytime and to predict how long a person can live based on their health and medical history. Security aspects are essential as it deals with sensitive personal information and should be considered in PLE solution with various security levels for the nature of information. This paper proposes an idea of how prediction of life expectancy to an individual user can be achieved as well as exercising how mHealth can be utilized to help collect and process health data from users.
4. Work in Progress
This section describes an individualized information of life expectancy through health data collected, processed and created based on big data. Information is provided by two ways: (1) smartphone app for brief summary; and (2) a report with a full and comprehensive report processed by big data in the monitoring center of the health service providers. There has been a great level of work in health data processing including knowledge management, managing medical images and data, integration of hospital care data, clinical research and bioinformatics data and information system security and data protection [55]. We are not focusing on existing works in data processing, which have already been identified and reported. Similarly, existing health networks can be used to provide PLE service along with mHelath applications. Therefore, established networks and systems that have been broadly researched have not been discussed [56]. Rather, we look at the data collection by mobile users who can use their smartphone and application to access the PLE services.
4.1. Raw Data Collection
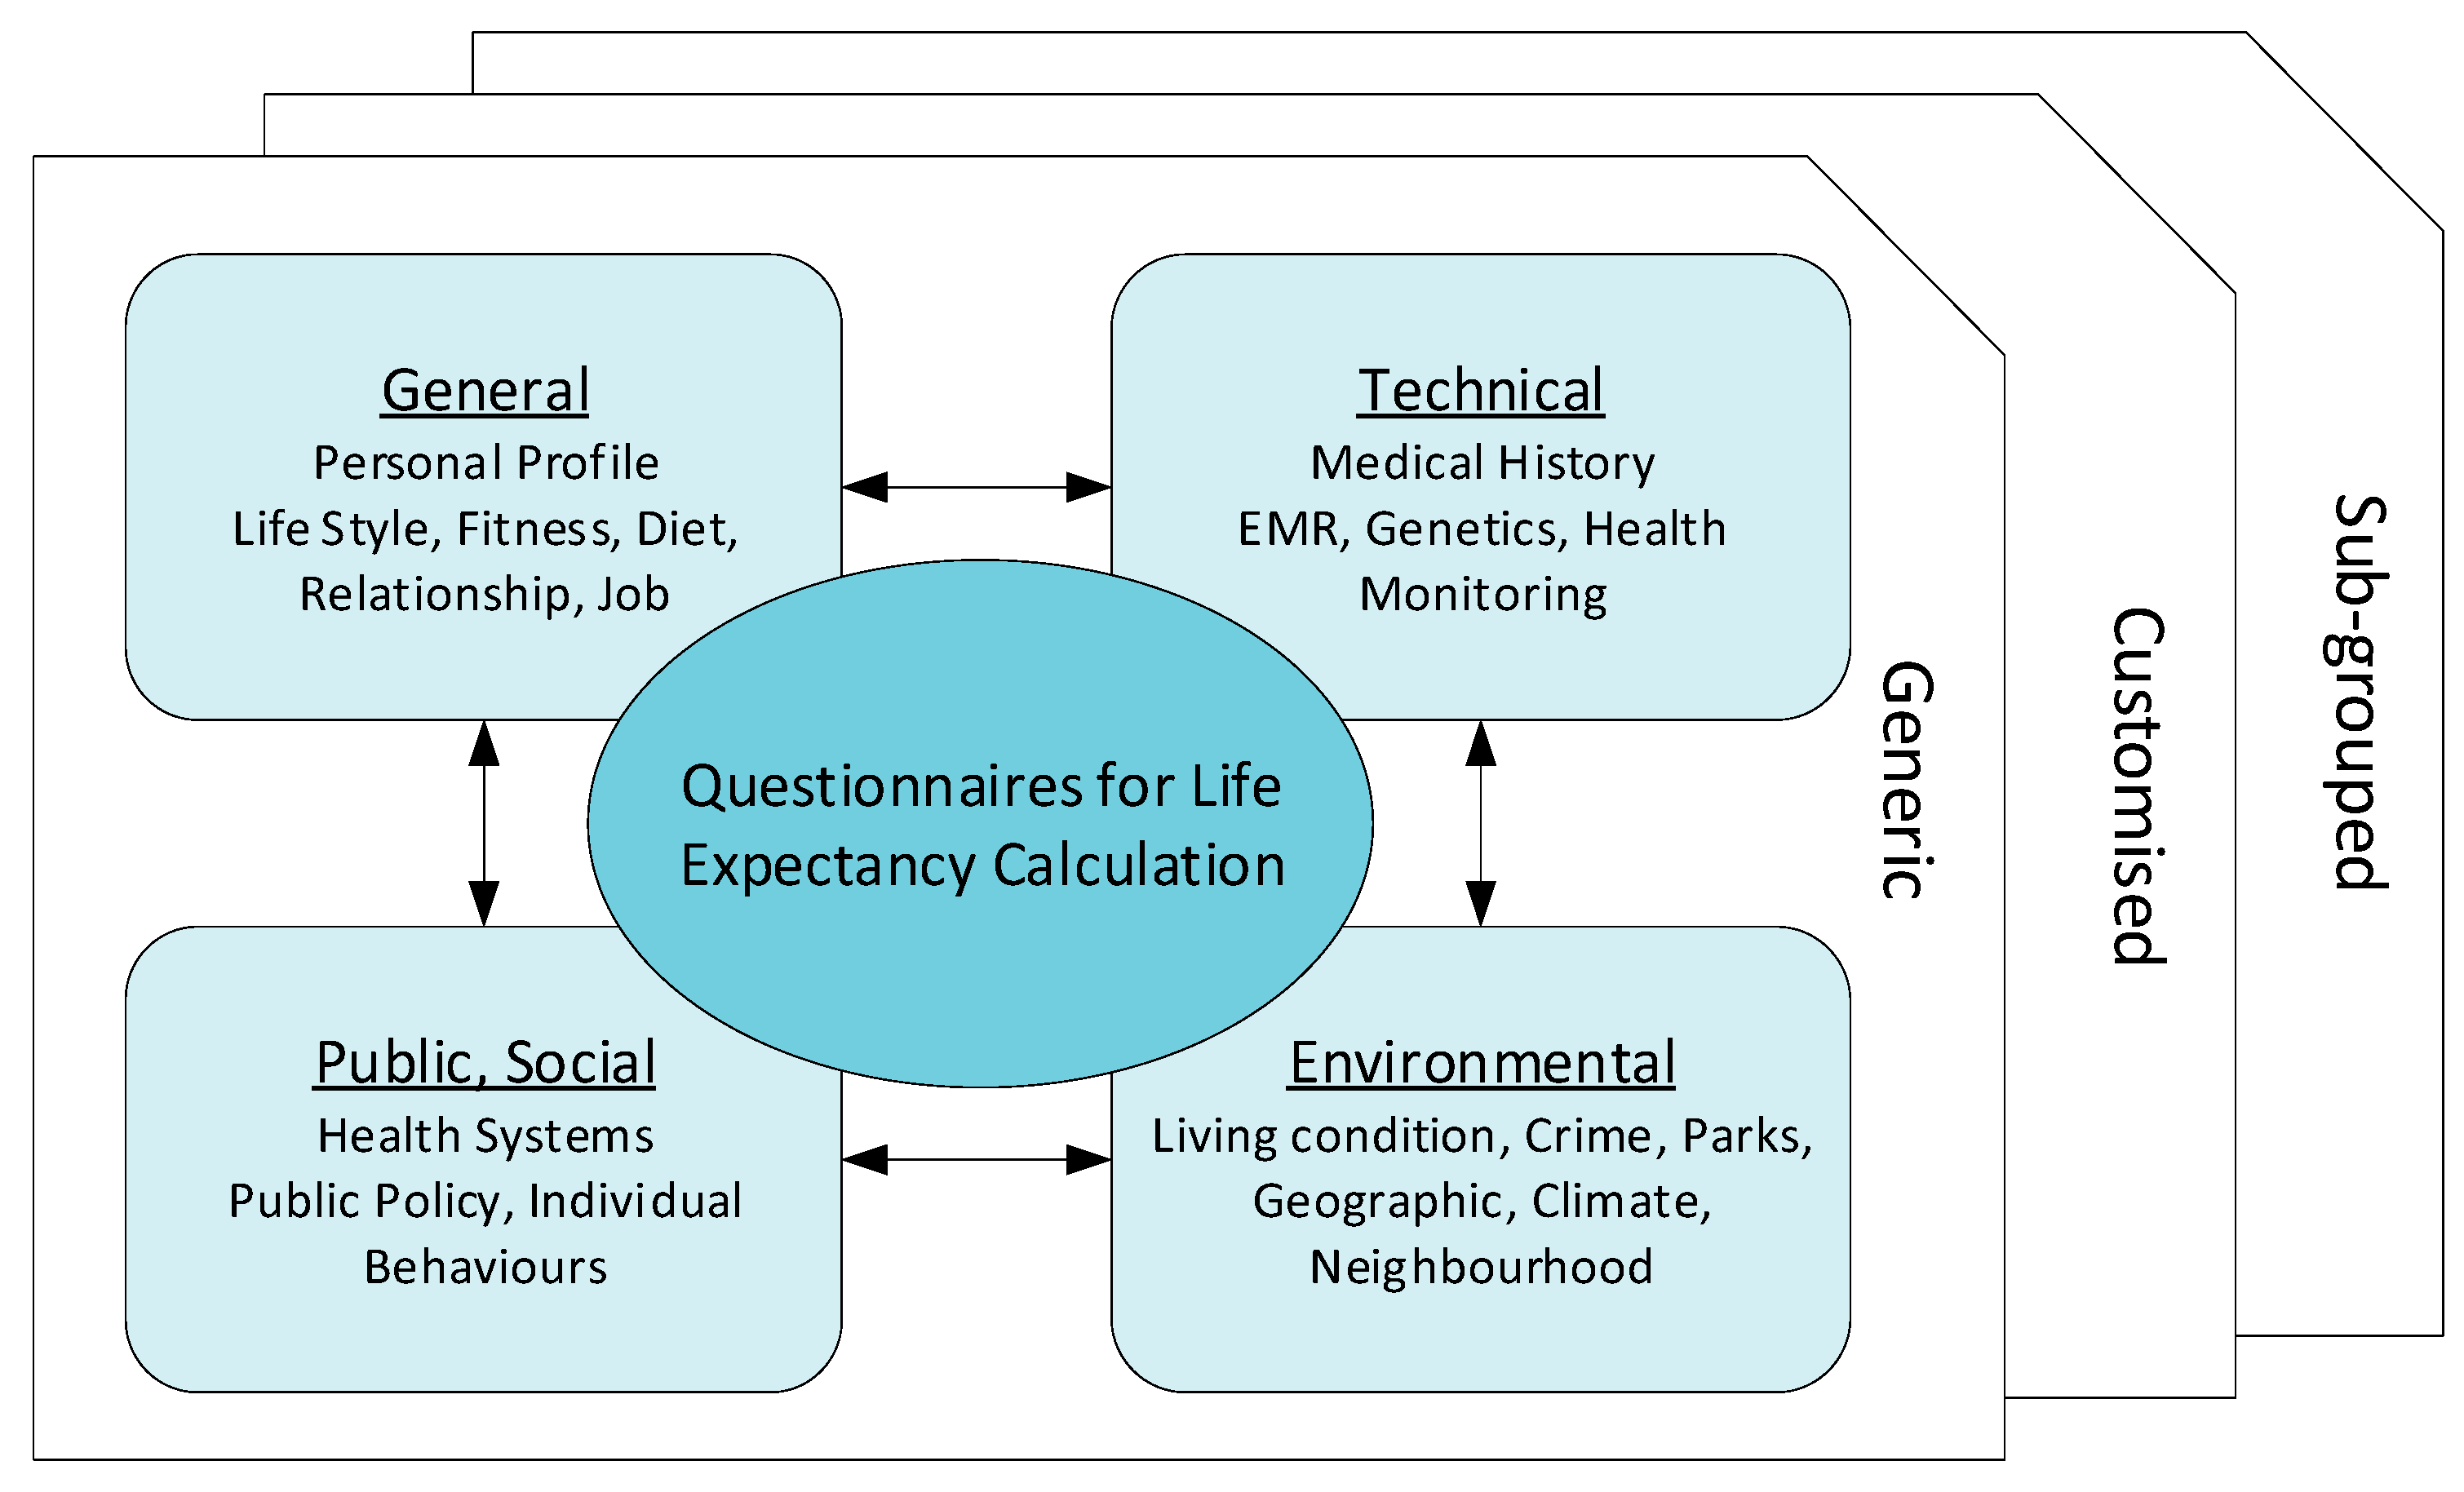
Data to collect for building generic and personalized LE information include many parameters to integrate such as behavioral parameters, health status monitoring, physiological signals (e.g., blood pressure, etc.), diet, physical activities, and genetics. Not to mention, narrowing down the sampled groups into low-level sub-groups can help increase the accuracy of predicting LE as attempted by Fries [57] for eliminating premature death to calculate the average life span as premature death rate significantly affects the whole LE rate.
Smartphone users download the app and complete the initial data entry, which include generic and personal criteria. These data are added to cloud servers, which classify and group based on the user’s category. Questionnaires and answers to be collected are comprehensive and can vary from basic profile to technical contents that may not be answered by the user but their physicians as below examples. Alternatively, these answers can be obtained by the health service providers who are connected to a health network, which provides the user’s medical data by having a digital signature from the user; e.g., terms and conditions agreed to on the app screen as some users may not wish to disclose their medical data due to privacy concerns.
Distribution and collection of data can be major and fundamental requirement of the solution, as these data are used to set out the outcome; i.e., PLE results. During the process of solution design, including requirements definition, high-level design of network and application features and products, there should be clear roles and responsibilities of each party and stakeholder, including users, service providers, and regulators.
4.1.1. General Questionnaire
When a user responds to the questionnaire for the first time, they are requested to enter basic user profile and general information, which can be responded to without consulting their physicians, as shown in Table 3.
4.1.2. Technical Questionnaire
Some data are more technical in nature and cannot be entered by the user in response to the smart device app when the user first registers. Complex data such as blood and medical investigations (e.g., Electrocardiogram (ECG), Ultrasound, Computed Tomography (CT), Magnetic Resonance Imaging (MRI)) and the diagnosis and test results of certain medical conditions (e.g., heart failure, kidney disease, cancer) would only be able to be provided by the user’s health service provider and would necessitate their consultation [17]. However, users may still be able to answer limited technical questions depending in their level of knowledge. Table 4 includes technical and non-technical information that can be obtained from a centralized server with the consent of the user in addition to the initial survey by the smartphone app.
Additional questions specific for each individual may be included by the health service provider, such as questions relating to a current diagnosis. All these data come from data sources processed and classified by big data.
A high-level approach may also be used for health determination attribute classifications [58]:
- Individual lifestyle behaviors e.g., spending patterns, exercise, diet;
- Physical and social environments e.g., living density, pollution levels;
- Socioeconomic factors e.g., education level, financial status;
- Health outcomes e.g., illnesses;
- Health systems e.g., health insurance status.
4.1.3. Data Source Selection
The method of selecting samples and training data in the cloud is important as it determines the quality of data accuracy. This may require integrating information from multiple data sets. Table 5 shows a primary dataset (sub-regional area information for important health outcomes) complemented by integration with a second dataset (census-level information).
4.1.4. Other Factors
Other factors (such as in Table 6) should also be considered when the predictive model is designed. It is still unknown which attributes are relevant to maximize the accuracy of the PrLE. With a constantly growing database of health information, it is crucial to assess and prioritize relevant and important health attributes (e.g., with machine learning, artificial intelligence) to improve the quality of the PrLE. Figure 5 depicts the overall and summarized questionnaires.
4.2. Information Flow of Data Creation
When data are transferred to the cloud server, they are compared against the generic data of the user group to create an individual’s data. These data are fed back to the generic data for training purposes and inference at sensors.
There are two pieces of information to be provided: (1) generic life expectancy graph of the group where the user belongs to; and (2) individualized result of the user. A monitoring center server in the cloud collects physiological data from individual smart devices such as smartphones, which collect and process sensed data in WBAN. These data are classified and analyzed for data accuracy prior to inferring, optimizing and transmitting to smartphones to be used by the app. Information flow of data transmission is shown in Figure 6. Steps 1 & 2 refer to initial data collection and entry followed by Steps 3 & 4 for data inference and optimization. Step 5 is for presenting PLE outcome, and Step 6 refers to data updates for fine-tuning with ongoing data feedback to the cloud server.
Possible scenarios of health data collection and transfer to cloud servers are described below:
- A user installs a PLE app on their smartphone and adds personal information and health data as requested by the app. The user also gives a consent to the service provider so that they can access and retrieve their health data from the user’s health record located in a central server.
- The app communicates with the central server which initiates user registration and basic provisioning processes. It also pairs up (if needed) with the user’s body sensors to be ready for data transfer.
- The user’s body sensors collect and transfer the sensed data to the smartphone and follow instructions of when and how to collect and transmit data.
- When data have been collected, the smartphone app transmits them to the central server that will prepare and generate the initial results, and send them back to the app for optimization. The app may collect further data from the sensors as programmed prior to displaying the outcome of PLE for the user.
- The central server continuously updates and improves data quality to input to the generic group data as classified and grouped for the user. Each element fine tunes the data by inference algorithms before transmission, and discern how to handle the priority; e.g., QoS.
4.3. App Design
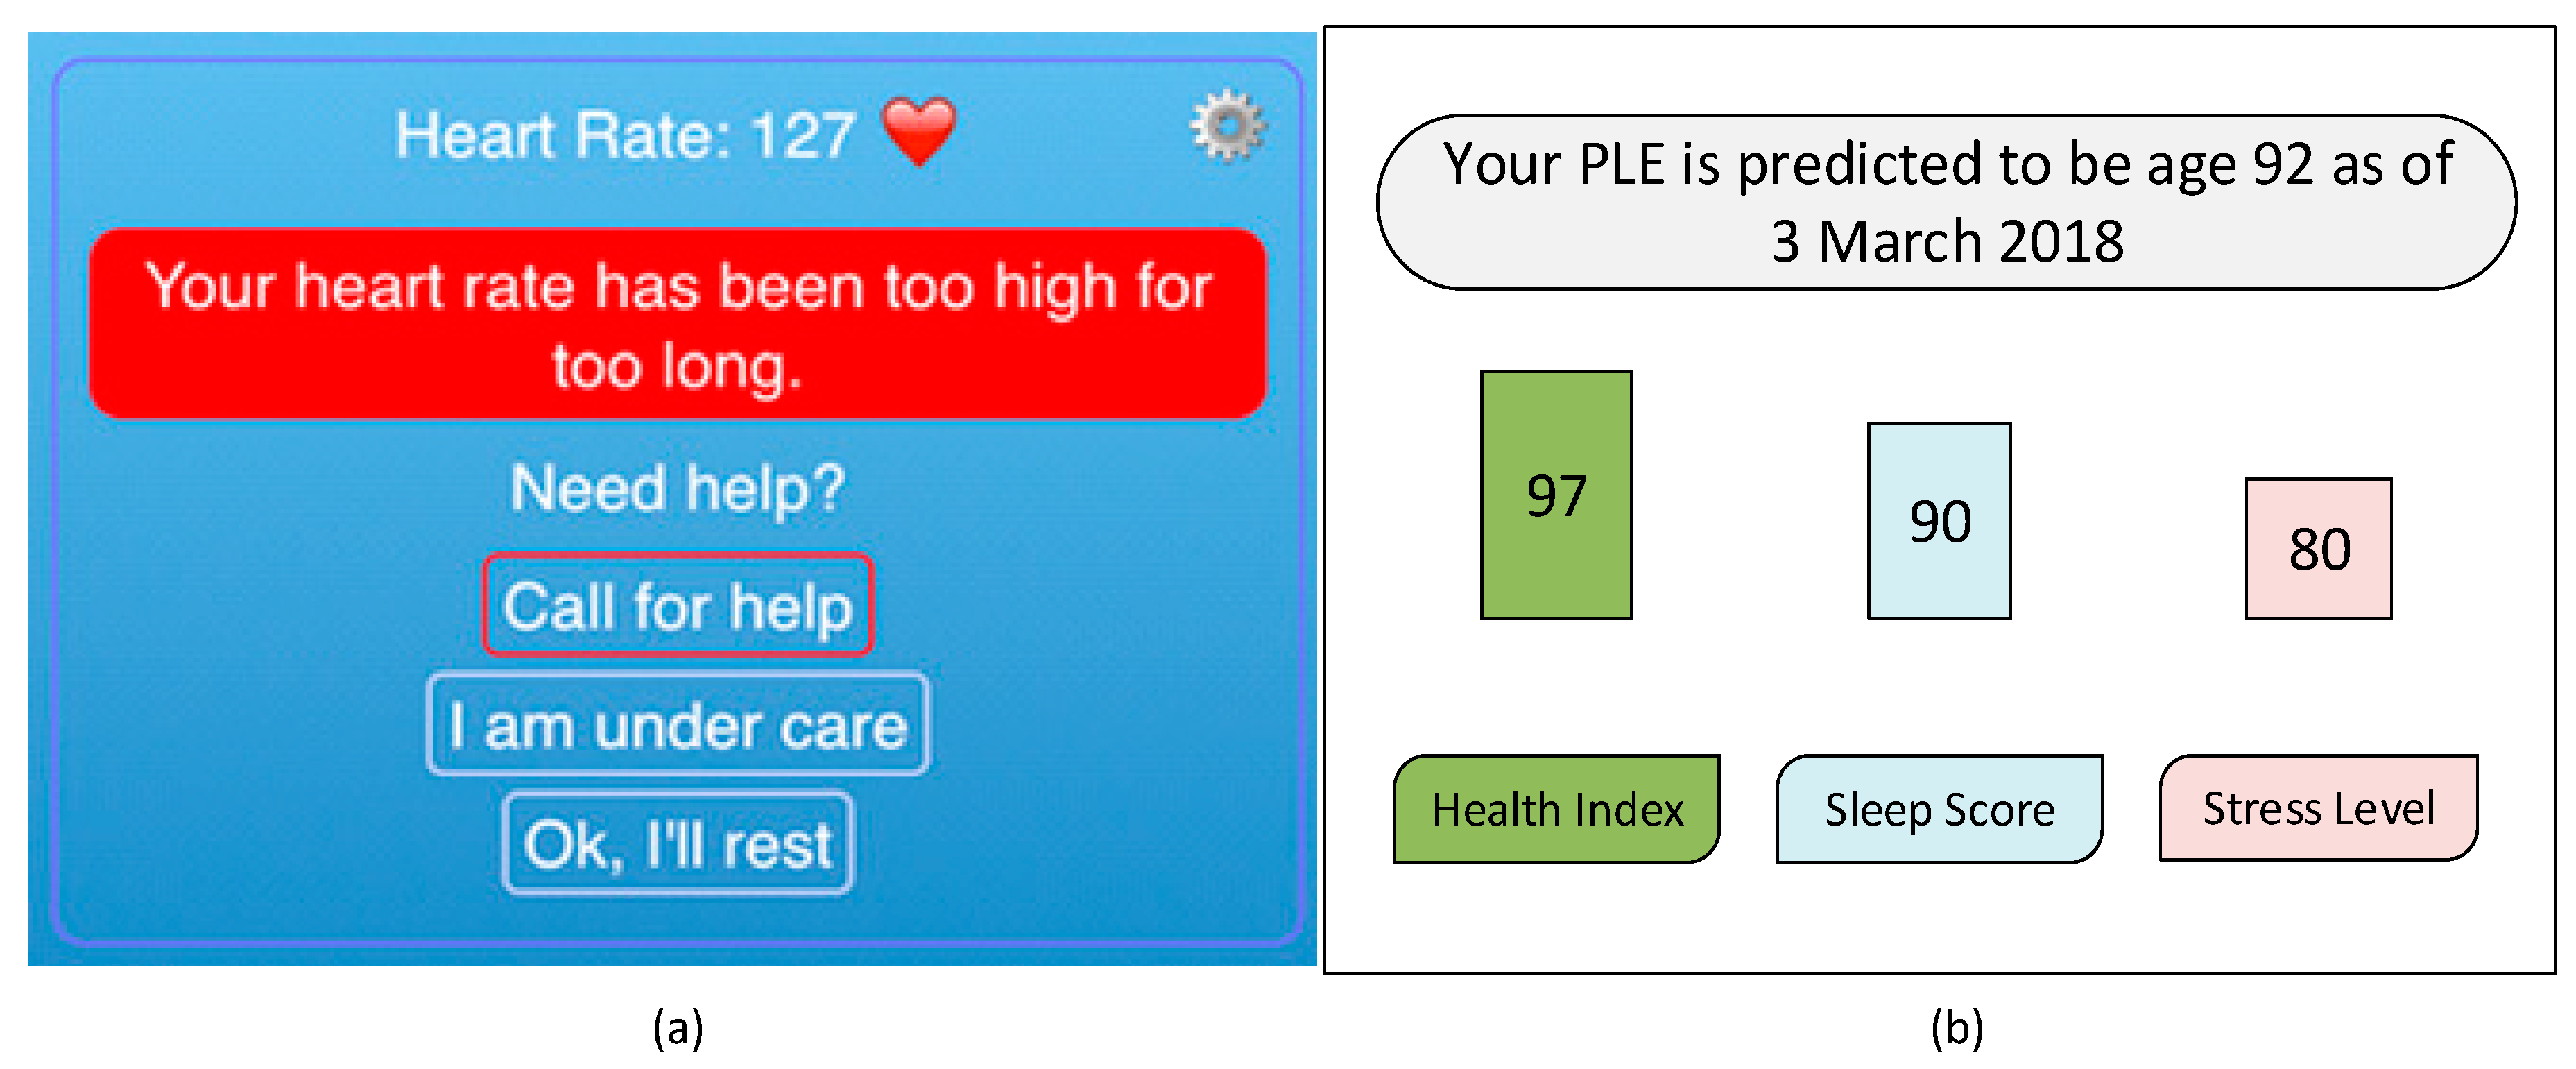
Health data are transferred from sensors to a smart device via low-powered wireless protocols such as Bluetooth low energy (BT-LE), WiFi (802.11), and Zigbee. The app displays the received data and transfers them to a server in the cloud for data processing. The screen menu can be combined as a part of existing mHealth mobile applications (as shown in Figure 7). There are two phases of personal data collection: general and technical health information. As the current health and fitness related apps integrate multiple functions, PLE features can be implemented within the existing apps as current mHealth services, which already require handling of physiological data.
5. Applications
Along with existing heath applications such as fitness tracking, chronic disease monitoring and real-time patient monitoring, the PLE application can be useful for users to improve their lifestyle and exercise by planning goals on a short and long-term basis. For example, the current PLE outcome of 85 years will be adjusted when the user changes their attributes such as smoking cessation, reducing alcohol consumption, commencing regular exercise, or modifying dietary plans.
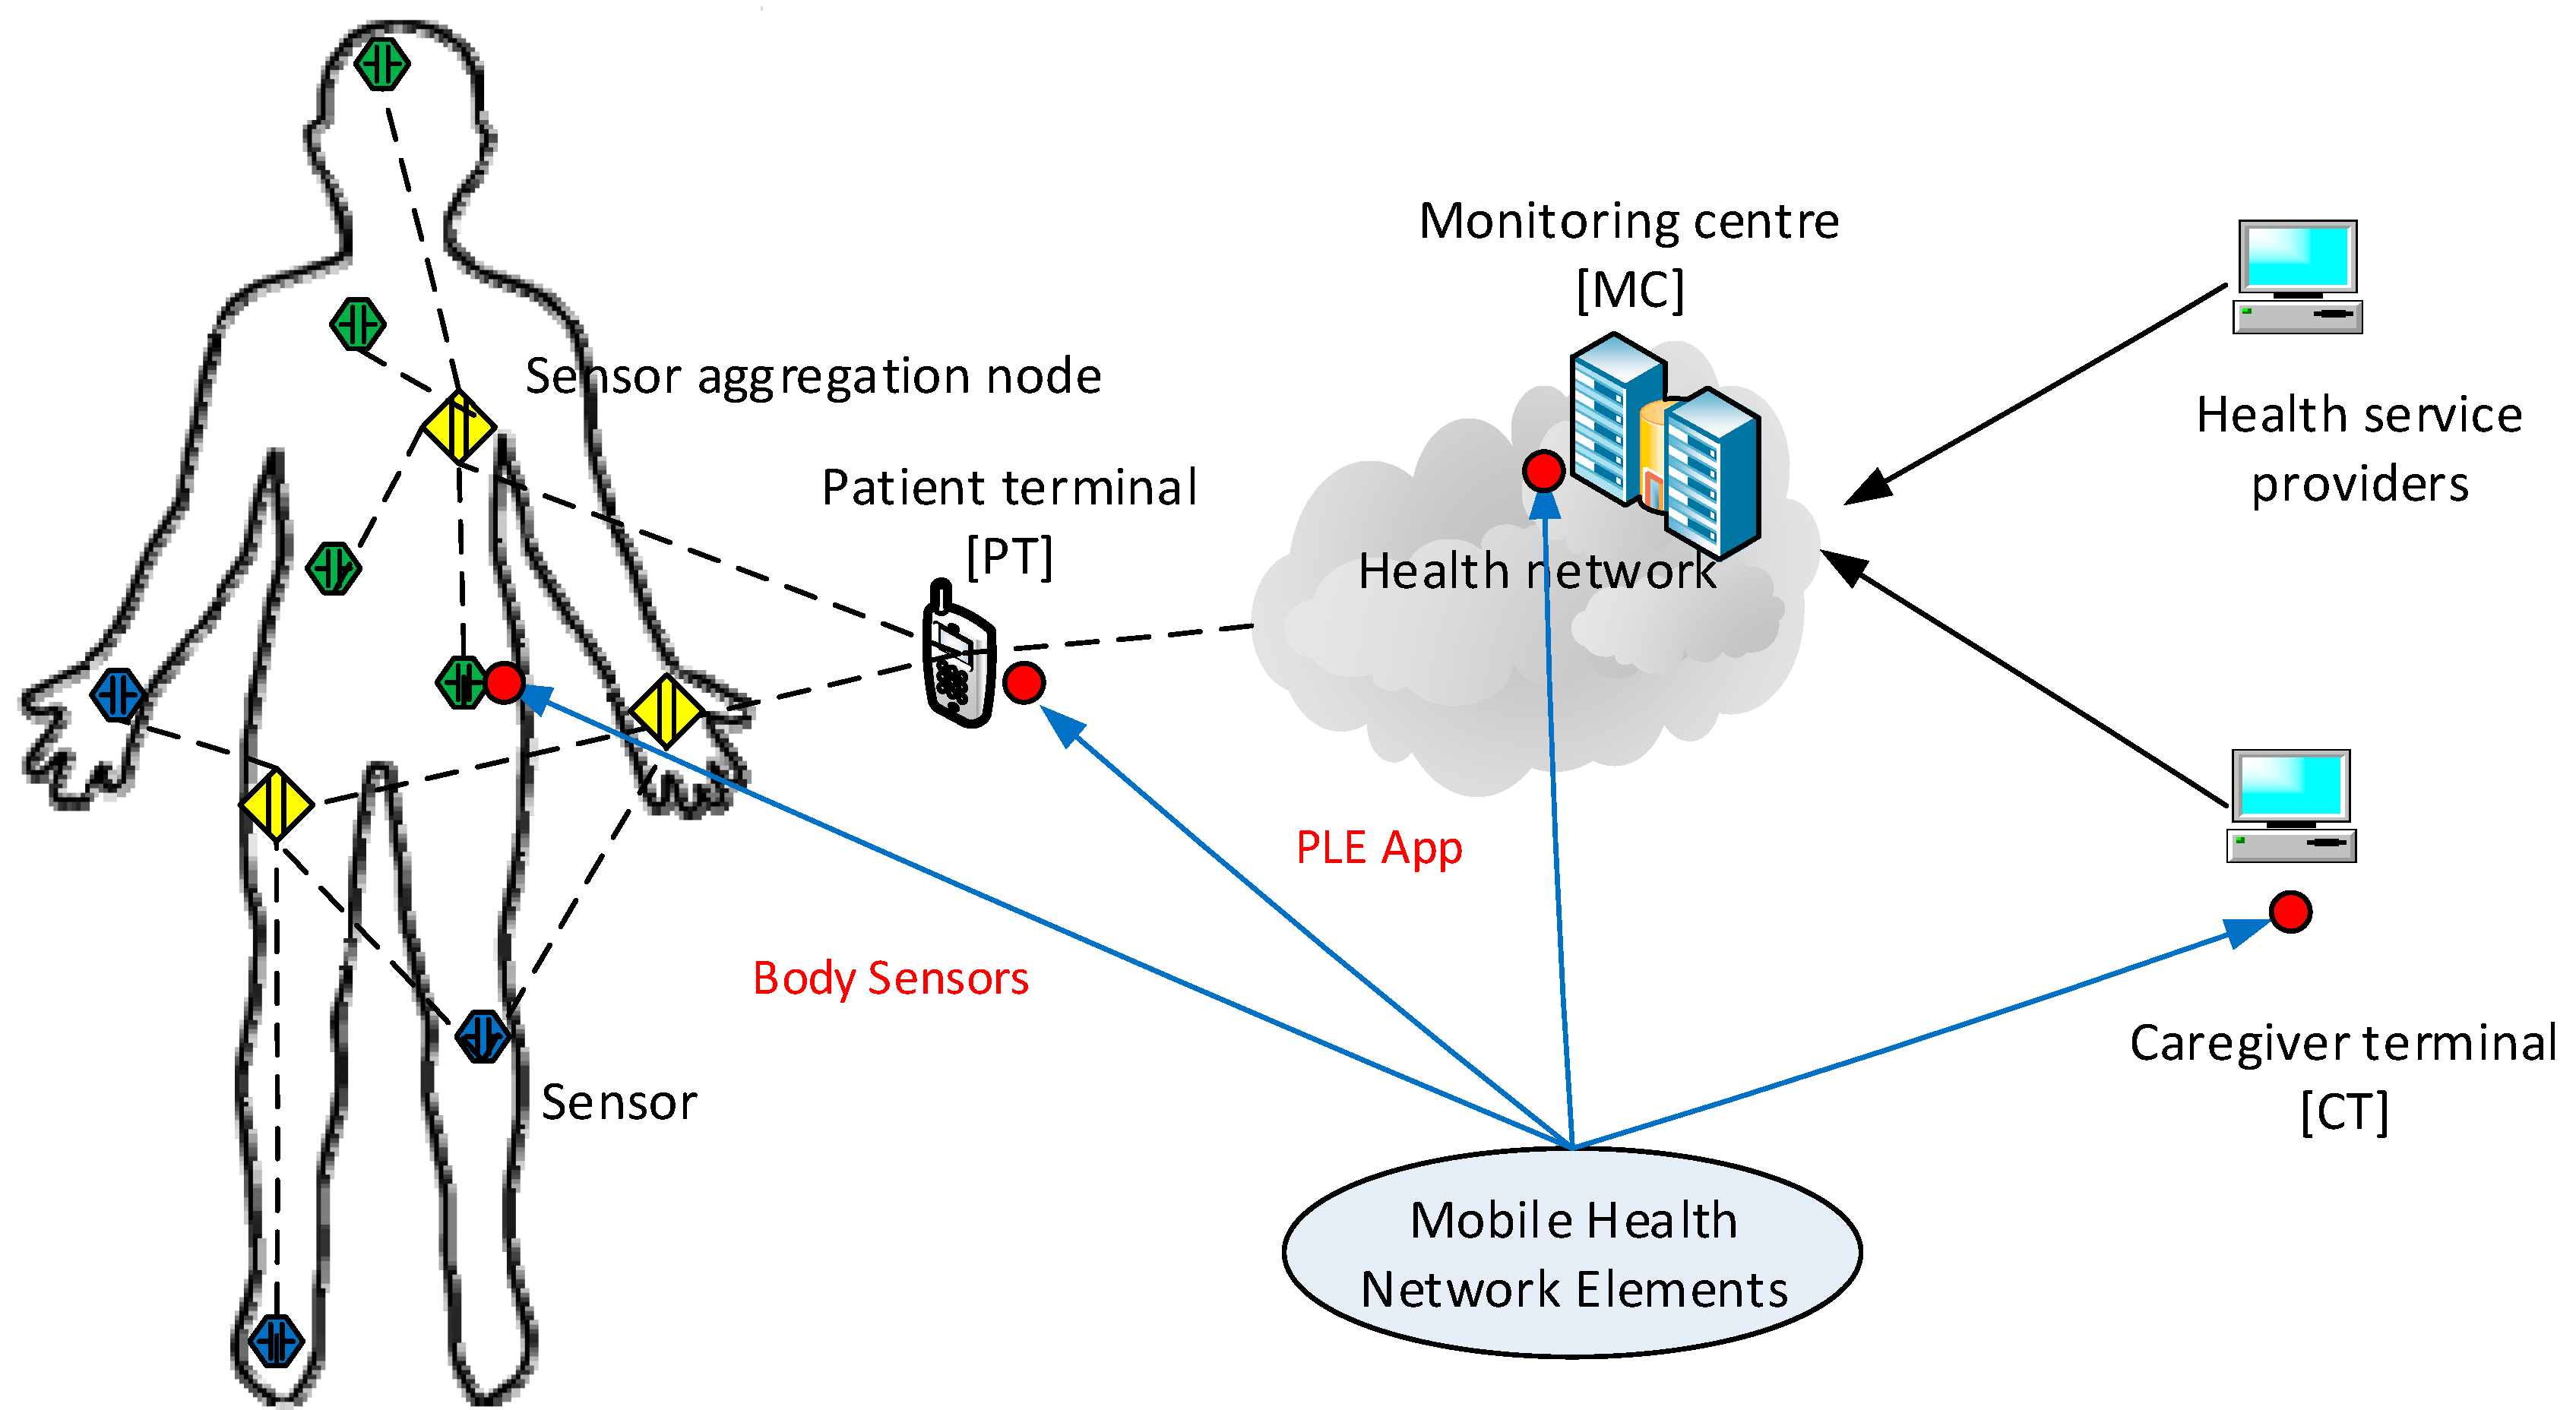
The development of wearable devices is evolving rapidly to capture data and for use in applications [59]. By wearing fitness tracking or monitoring devices, those attributes can be automatically updated and sent to the cloud servers, which process and update the health index defined by the user’s physician to assess the user’s health life, which eventually leads to updating the user’s PLE. IEEE P11073 Personal Health Devices (PHD) or sensors attached on or implanted in the user’s body also provide physiological data to the mHealth monitoring center, which is connected to the centralized cloud servers for data optimization with increased data accuracy as shown in Figure 8.
One of the potential stakeholders of this solution may be health insurance companies, who can provide personalized insurance products by monitoring their customers’ health index. They may provide customers with incentives to improve their health condition and lifestyle, for example by revising their premiums in response to improvements in their customers’ health index obtained and processed by the cloud computing program.
A strict policy and regulations should be imposed for third parties such as health insurance companies regarding access to user data such as requiring patient consent and agreement, as well as parameters on how that data can be used. It is essential to develop and agree upon transparent security and privacy policies prior to engaging third parties for the usage of health data of users across states and governments.
6. Conclusions and Future Works
Few works have been done to provide an individually customized life expectancy prediction. We have reviewed existing works and techniques in the prediction of human LE, and reached a conclusion that it is feasible to predict a PLE for individuals using evolving technologies and devices such as big data, AI, machine learning techniques, and PHDs, wearables and mobile health monitoring devices. We also identified that the collection of data will be a huge challenge due to the privacy and government policy considerations, which will require collaboration of various bodies in the health industry. The interworking of a heterogeneous health network is also a challenge for data collection. Despite these challenges, we showed a possibility of a PLE prediction by proposing an approach of data collection and application by smartphone, with which users can enter their information to access the cloud server to obtain their own PLE. No attempt has been made to create this novel idea of using smartphone integrating cloud servers for real-time data entry. We investigated obstacles and barriers that can be resolved by future works described below. Previous works have described a five year LE prediction, however it is not oriented as a personalized prediction but rather utilizes a median model-predicted probability of 5-year survival of patients who are either sick or healthy. It is proposed that this can be extended to a lifetime prediction by using big data to generate a generic data, which can be used to create a PLE based on training data as a future solution. Building a generic database will take a considerable amount of time for data collection and analysis, taken from birth to death for various demographic groups to be useful and accurate in representing each attribute classifications. Whilst current applications attempt to show PLE for smartphone users, they are complicated and difficult to collect technical data requested by the questionnaire, as users are unlikely to be able to provide these data themselves. This can be resolved by connecting the app to the central cloud server with the mHealth networks which provide other health related applications. A centralized cloud server plays a key role in collecting, processing, and creating meaningful value using big data, which forms the input of the solution as well as creates generic data against each user’s PLE requirements. Service providers shall envisage challenges and hurdles to obtain consent of personal health ‘of heterogeneous health networks across developed countries. This will lead to (3) classification of data based on processing big data and each group’s traits, which can be used as personalized threshold ranges; (4) When this has been completed in a cloud, it can be connected to a smart device app that can provide questionnaires developed by health specialists and collect answers to customize the user’s PLE; (5) Optimization of the generic groups’ data is done by developing an algorithm using machine learning for continuously building and optimizing the user’s generic data.
As the proposed solution requires processing and transmitting health information of users, information security is a key aspect to consider such as privacy as well as ethical requirements recommenced by regulation bodies, such as the Australian national health and medical research (NHMRC). The scope of security and ethical requirements need to be clearly defined and specified for future work as challenges are expected to build a centralized database with incorporation of health networks. For example, North America, Asia, and Europe may have their own unique requirements to satisfy in dealing with health data with different health research guidelines.
To verify the accuracy of PLE prediction and validation of data quality, big data techniques and analysis algorithms need to be developed and tested in a real-life situation with several sample groups. As artificial intelligence technology is evolving and being applied rapidly, feasibility may be increasing to collect health data from the public as well as existing health agencies such as centralized health servers.
Author Contributions
J.J.K. conceived, reviewed related works and designed the solution and application, and wrote the paper. S.A. supervised the overall quality of the article and provided comprehensive guidance of the contents.
Funding
This research received no external funding.
Conflicts of Interest
The authors declare no conflict of interest.
Abbreviations
Life Expectancy (LE)—longevity of human life based on diseases or other variables such as geographical region; race or regional traits; Personalized Life Expectation (PLE)—LE focused on personal or individual longevity rather than groups or classified based on traits such as diseases; races and regional areas; Predicted Life Expectancy (PrLE)—LE that has been predicted for the future from past health related data processed by cloud server. Mobile Health (mHealth)—a branch of electronic health (eHealth) being provided by wireless body area networks; in which sensors collect and transmit physiological or biological data to a monitoring center in the cloud for health service providers to access
References
- Katsis, Y.; Balac, N.; Chapman, D.; Kapoor, M.; Block, J.; Griswold, W.G.; Huang, J.; Koulouris, N.; Menarini, M.; Nandigam, V. Big Data Techniques for Public Health: A Case Study. In Proceedings of the 2017 IEEE/ACM International Conference on Connected Health: Applications, Systems and Engineering Technologies (CHASE), Philadelphia, PA, USA, 17–19 July 2017; pp. 222–231. [Google Scholar]
- Digiovanni, S.L.; Guaragnella, C.; Rizzi, M.; Falagario, M. Healthcare system: A digital green filter for smart health early cervical cancer diagnosis. In Proceedings of the 2016 IEEE 2nd International Forum on Research and Technologies for Society and Industry Leveraging a Better Tomorrow (RTSI), Bologna, Italy, 7–9 September 2016; pp. 1–6. [Google Scholar]
- Saha, H.N.; Raun, N.F.; Saha, M. Monitoring patient’s health with smart ambulance system using Internet of Things (IOTs). In Proceedings of the 2017 8th Annual Industrial Automation and Electromechanical Engineering Conference (IEMECON), Bangkok, Thailand, 16–18 August 2017; pp. 91–95. [Google Scholar]
- Bakar, N.H.B.A.; Abdullah, K.; Islam, M.R. Wireless Smart Health Monitoring System via Mobile Phone. In Proceedings of the 2016 International Conference on Computer and Communication Engineering (ICCCE), Kuala Lumpur, Malaysia, 26–27 July 2016; pp. 213–218. [Google Scholar]
- Ali, Z.; Muhammad, G.; Alhamid, M.F. An automatic health monitoring system for patients suffering from voice complications in smart cities. IEEE Access 2017, 5, 3900–3908. [Google Scholar] [CrossRef]
- Banaee, H.; Ahmed, M.U.; Loutfi, A. Data mining for wearable sensors in health monitoring systems: A review of recent trends and challenges. Sensors 2013, 13, 17472–17500. [Google Scholar] [CrossRef] [PubMed]
- Kang, J.J.; Larkin, H. Inference of personal sensors in the internet of things. Int. J. Inf. Commun. Technol. Appl. 2016, 2, 1–23. [Google Scholar] [CrossRef]
- Kang, J.J.W. An Inference System Framework for Personal Sensor Devices in Mobile Health and Internet of Things Networks; Deakin University: Victoria, Australia, 2017. [Google Scholar]
- de Miguel-Bilbao, S.; Aguirre, E.; Lopez Iturri, P.; Azpilicueta, L.; Roldán, J.; Falcone, F.; Ramos, V. Evaluation of Electromagnetic Interference and Exposure Assessment from s-Health Solutions Based on Wi-Fi Devices. BioMed Res. Int. 2015, 2015, 9. [Google Scholar] [CrossRef] [PubMed]
- Kang, J.; Adibi, S. A Review of Security Protocols in mHealth Wireless Body Area Networks (WBAN). In Proceedings of the Future Network Systems and Security, Paris, France, 11–13 June 2015; pp. 61–83. [Google Scholar]
- Blobel, B. Comparing approaches for advanced e-health security infrastructures. Int. J. Med. Inform. 2007, 76, 454–459. [Google Scholar] [CrossRef] [PubMed]
- Diamandis, P. What Silicon Valley Is Doing to Make Humans Live Longer. Available online: https://www.businessinsider.in/what-silicon-valley-is-doing-to-make-humans-live-longer/articleshow/63140991.cms (accessed on 7 March 2018).
- Łaszkiewicz, A.; Szymczak, S.; Cebrat, S. Prediction of the human life expectancy. Theory Biosci. 2003, 122, 313–320. [Google Scholar] [CrossRef]
- Sardi, B. Yuzurihara, the village of long life, reveals its secrets. Knowl. Health 2006, 10, 1–4. [Google Scholar]
- Bhosale, A.; Sundaram, K. Life prediction equation for human beings. In Proceedings of the 2010 International Conference on Bioinformatics and Biomedical Technology (ICBBT), Chengdu, China, 16–18 April 2010; pp. 266–268. [Google Scholar]
- Jafelice, R.; Barros, L. Fuzzy set-based model to compute the life expectancy of HIV infected populations. In Proceedings of the IEEE Annual Meeting of the Fuzzy Information, Banff, AL, Canada, 27–30 June 2004; pp. 314–318. [Google Scholar]
- Agrawal, A.; Mathias, J.; Baker, D.; Choudhary, A. Five year life expectancy calculator for older adults. In Proceedings of the 2016 IEEE 16th International Conference on Data Mining Workshops (ICDMW), Barcelona, Spain, 12–15 December 2016; pp. 1280–1283. [Google Scholar]
- Agrawal, J.S.M.A.; Baker, D.W.; Choudhary, A. Five Year Life Expectancy Calculator for Older Adults. 2016. Available online: http://info.eecs.northwestern.edu/FiveYearLifeExpectancyCalculator (accessed on 10 August 2018).
- Gil-Herrera, E.; Yalcin, A.; Tsalatsanis, A.; Barnes, L.E.; Djulbegovic, B. Rough set theory based prognostication of life expectancy for terminally ill patients. In Proceedings of the 2011 Annual International Conference of the IEEE Engineering in Medicine and Biology Society, EMBC, Boston, MA, USA, 30 August–3 September 2011; pp. 6438–6441. [Google Scholar]
- Kerdprasop, N.K.A.K. Association of economic and environmental factors to life expectancy of people in the Mekong basin. In Proceedings of the 2017 12th IEEE Conference on Industrial Electronics and Applications (ICIEA), Siem Reap, Cambodia, 18–20 June 2017. [Google Scholar]
- Pascariu, M.D.; Canudas-Romo, V.; Vaupel, J.W. The double-gap life expectancy forecasting model. Insur. Math. Econ. 2018, 78, 339–350. [Google Scholar] [CrossRef]
- Lee, R.D.; Carter, L.R. Modeling and forecasting US mortality. J. Am. Stat. Assoc. 1992, 87, 659–671. [Google Scholar]
- Cairns, A.J.; Blake, D.; Dowd, K. A two-factor model for stochastic mortality with parameter uncertainty: Theory and calibration. J. Risk Insur. 2006, 73, 687–718. [Google Scholar] [CrossRef]
- Sammon, J.D.; Abdollah, F.; D’Amico, A.; Gettman, M.; Haese, A.; Suardi, N.; Vickers, A.; Trinh, Q.-D. Predicting Life Expectancy in Men Diagnosed with Prostate Cancer. Eur. Urol. 2015, 68, 756–765. [Google Scholar] [CrossRef] [PubMed] [Green Version]
- Lêng, C.H.; Chou, M.H.; Lin, S.-H.; Yang, Y.K.; Wang, J.-D. Estimation of life expectancy, loss-of-life expectancy, and lifetime healthcare expenditures for schizophrenia in Taiwan. Schizophr. Res. 2016, 171, 97–102. [Google Scholar] [CrossRef] [PubMed]
- Zięba, M.; Tomczak, J.M.; Lubicz, M.; Świątek, J. Boosted SVM for extracting rules from imbalanced data in application to prediction of the post-operative life expectancy in the lung cancer patients. Appl. Soft Comput. 2014, 14, 99–108. [Google Scholar] [CrossRef]
- Pruksakorn, D.; Phanphaisarn, A.; Settakorn, J.; Arpornchayanon, U.; Tantraworasin, A.; Chaiyawat, P.; klangjorhor, J.; Teeyakasem, P. Prognostic score for life expectancy evaluation of lung cancer patients after bone metastasis. J. Bone Oncol. 2018, 10, 1–5. [Google Scholar] [CrossRef] [PubMed]
- Thomas, R.; Pieri, A.; Cain, H. A systematic review of generic and breast cancer specific life expectancy models in the elderly. Eur. J. Surg. Oncol. 2017, 43, 1816–1827. [Google Scholar] [CrossRef] [PubMed]
- Ou, H.-T.; Yang, C.-Y.; Wang, J.-D.; Hwang, J.-S.; Wu, J.-S. Life Expectancy and Lifetime Health Care Expenditures for Type 1 Diabetes: A Nationwide Longitudinal Cohort of Incident Cases Followed for 14 Years. Value Health 2016, 19, 976–984. [Google Scholar] [CrossRef] [PubMed]
- Soga, Y.; Iida, O.; Takahaera, M.; Hirano, K.; Suzuki, K.; Kawasaki, D.; Miyashita, Y.; Tsuchiya, T. Two-Year Life Expectancy in Patients with Critical Limb Ischemia. JACC Cardiovasc. Interv. 2014, 7, 1444–1449. [Google Scholar] [CrossRef] [PubMed]
- Hastings, M.C.; Bursac, Z.; Julian, B.A.; Villa Baca, E.; Featherston, J.; Woodford, S.Y.; Bailey, L.; Wyatt, R.J. Life Expectancy for Patients From the Southeastern United States with IgA Nephropathy. Kidney Int. Rep. 2018, 3, 99–104. [Google Scholar] [CrossRef] [PubMed]
- Yamada, S.-I.; Kurita, H.; Tomioka, T.; Ohta, R.; Yoshimura, N.; Nishimaki, F.; Koyama, Y.; Kondo, E.; Kamata, T. Healthy life expectancy of oral squamous cell carcinoma patients aged 75 years and older. Oral Oncol. 2017, 64, 22–26. [Google Scholar] [CrossRef] [PubMed]
- Wang, H.-I.; Aas, E.; Howell, D.; Roman, E.; Patmore, R.; Jack, A.; Smith, A. Long-Term Medical Costs and Life Expectancy of Acute Myeloid Leukemia: A Probabilistic Decision Model. Value Health 2014, 17, 205–214. [Google Scholar] [CrossRef] [PubMed]
- Hannerz, H.; Borgå, P.; Borritz, M. Life expectancies for individuals with psychiatric diagnoses. Public Health 2001, 115, 328–337. [Google Scholar] [CrossRef]
- Guzman-Castillo, M.; Ahmadi-Abhari, S.; Bandosz, P.; Capewell, S.; Steptoe, A.; Singh-Manoux, A.; Kivimaki, M.; Shipley, M.J.; Brunner, E.J.; O’Flaherty, M. Forecasted trends in disability and life expectancy in England and Wales up to 2025: A modelling study. Lancet Public Health 2017, 2, e307–e313. [Google Scholar] [CrossRef]
- Love-Koh, J.; Asaria, M.; Cookson, R.; Griffin, S. The Social Distribution of Health: Estimating Quality-Adjusted Life Expectancy in England. Value Health 2015, 18, 655–662. [Google Scholar] [CrossRef] [PubMed]
- Kim, H.S. Active Life Expectancy of Elderly Koreans, 1994–2011. Asian Popul. Stud. 2015, 11, 312–327. [Google Scholar] [CrossRef]
- Hauck, K.; Martin, S.; Smith, P.C. Priorities for action on the social determinants of health: Empirical evidence on the strongest associations with life expectancy in 54 low-income countries, 1990–2012. Soc. Sci. Med. 2016, 167, 88–98. [Google Scholar] [CrossRef] [PubMed] [Green Version]
- Kunze, L. Life expectancy and economic growth. J. Macroecon. 2014, 39, 54–65. [Google Scholar] [CrossRef]
- Bergh, A.; Nilsson, T. Good for Living? On the Relationship between Globalization and Life Expectancy. World Dev. 2010, 38, 1191–1203. [Google Scholar] [CrossRef]
- Sullivan, D.F. A single index of mortality and morbidity. HSMHA Health Rep. 1971, 86, 347. [Google Scholar] [CrossRef] [PubMed]
- Soomro, A.; Cavalcanti, D. Opportunities and challenges in using WPAN and WLAN technologies in medical environments [Accepted from Open Call]. IEEE Commun. Mag. 2007, 45, 114–122. [Google Scholar] [CrossRef]
- Barbiroli, M.; Carciofi, C.; Guiducci, D. Assessment of Population and Occupational Exposure to Wi-Fi Systems: Measurements and Simulations. IEEE Trans. Electromagn. Compat. 2011, 53, 219–228. [Google Scholar] [CrossRef]
- On the Minimum Health and Safety Requirements Regarding the Exposure of Workers to the Risks Arising from Physical Agents (Electromagnetic Fields) (20th Individual Directive within the Meaning of Article 16(1) of Directive 89/391/EEC) and Repealing Directive 2004/40/EC. Available online: https://osha.europa.eu/en/legislation/directives/directive-2013-35-eu-electromagnetic-fields (accessed on 10 August 2018).
- de Miguel-Bilbao, S.; Martín, M.A.; Del Pozo, A.; Febles, V.; Hernández, J.A.; de Aldecoa, J.C.F.; Ramos, V. Analysis of exposure to electromagnetic fields in a healthcare environment: Simulation and experimental study. Health Phys. 2013, 105, S209–S222. [Google Scholar] [CrossRef] [PubMed]
- Miguel-Bilbao, S.D.; Roldán, J.; García, J.; Ramos, V.; Fernández, J.; Suárez, Ó.J. Assessment of exposure from Wi-Fi devices. In Proceedings of the 2014 IEEE International Symposium on Medical Measurements and Applications (MeMeA), Lisbon, Portugal, 11–12 June 2014; pp. 1–4. [Google Scholar]
- Aguirre Gallego, E.; Arpón Díaz-Aldagalán, J.; Azpilicueta Fernández de las Heras, L.; Ramos González, V.; Falcone Lanas, F.J. Evaluation of electromagnetic dosimetry of wireless systems in complex indoor scenarios with human body interaction. Prog. Electromagn. Res. B 2012, 43, 189–209. [Google Scholar] [CrossRef]
- Iturri, P.L.; Nazábal, J.A.; Azpilicueta, L.; Rodriguez, P.; Beruete, M.; Fernández-Valdivielso, C.; Falcone, F. Impact of high power interference sources in planning and deployment of wireless sensor networks and devices in the 2.4 GHz frequency band in heterogeneous environments. Sensors 2012, 12, 15689–15708. [Google Scholar] [CrossRef] [PubMed]
- Savola, R.M.; Abie, H. Metrics-driven security objective decomposition for an e-health application with adaptive security management. In Proceedings of the Proceedings of the International Workshop on Adaptive Security, Zurich, Switzerland, 8–12 September 2013; p. 6. [Google Scholar]
- Smith, E.; Eloff, J.H. Security in health-care information systems—Current trends. Int. J. Med. Inform. 1999, 54, 39–54. [Google Scholar] [CrossRef]
- Zhang, R.; Liu, L. Security Models and Requirements for Healthcare Application Clouds. In Proceedings of the 2010 IEEE 3rd International Conference on Cloud Computing, Miami, FL, USA, 5–10 July 2010; pp. 268–275. [Google Scholar]
- Martí, R.; Delgado, J.; Perramon, X. Network and application security in mobile e-health applications. In Proceedings of the International Conference on Information Networking, Busan, Korea, 18–20 February 2004; pp. 995–1004. [Google Scholar]
- Martí, R.; Delgado, J.; Perramon, X. Security specification and implementation for mobile e-health services. In Proceedings of the 2004 IEEE International Conference on e-Technology, e-Commerce and e-Service, Taipei, Taiwan, 28–31 March 2004; pp. 241–248. [Google Scholar]
- IEEE. Health Informatics–Personal Health Device Communication—Part 20601: Application Profile-Optimized Exchange Protocol; IEEE Std 11073-20601-2014 (Revision of ISO/IEEE 11073-20601:2010); IEEE: Piscataway, NJ, USA, 2014; pp. 1–253. [Google Scholar]
- Fieschi, M. Health Data Processing—Systemic Approaches, 1st ed.; ISTE: Washington, DC, USA, 2018. [Google Scholar]
- Al-Ali, Y.A.; Wafeeq, J.A. Systems and Methods for Monitoring a Patient Health Network. Available online: https://patents.justia.com/patent/20180225960 (accessed on 10 August 2018).
- Fries, J.F. Aging, natural death, and the compression of morbidity. Bull. World Health Organ. 2002, 80, 245–250. [Google Scholar] [CrossRef] [PubMed]
- Woolf, S.H.; Aron, L.Y. The US health disadvantage relative to other high-income countries: Findings from a National Research Council/Institute of Medicine report. JAMA 2013, 309, 771–772. [Google Scholar] [CrossRef] [PubMed]
- Wearable. 50 Wearable Tech Predictions for 2018. Available online: https://www.wareable.com/wearable-tech/best-wearable-tech-2018-506 (accessed on 3 August 2018).
Figure 1.
Health Status and personalized Life Expectancy (Adapted from [7]).
Figure 1.
Health Status and personalized Life Expectancy (Adapted from [7]).

Figure 2.
Questionnaires for five-year survival probability. The results will estimate a given patient’s probability of surviving at least five years from the last hospital admission (Reproduced with permission from Ankit Agrawal [18]).
Figure 2.
Questionnaires for five-year survival probability. The results will estimate a given patient’s probability of surviving at least five years from the last hospital admission (Reproduced with permission from Ankit Agrawal [18]).

Figure 3.
Results of the Questionnaires. Healthy patient—Median model-predicted probability of 5-year survival of patients who actually survived 5 years. Given patient—This corresponds to the chances of survival of a patient for at least 5 years, calculated based on the provided values of the patient attributes. Sick patient—Median model-predicted probability of 5-year survival of patients who did not survive the 5 years (Reproduced with permission from Ankit Agrawal [18]).

Figure 4.
Actual and forecast life expectancy (USA) at birth and at age 65 generated by the DG (double gap), LC (Lee and Carter model) and CBD (Cairns et al.) models for females and males, 1950–2050. Prediction intervals at 80% and 95% levels are shown only for the DG model (Reproduced with permission from Marius Pascariu [21]).

Figure 5.
Questionnaires for Life Expectancy calculation. Questions are customized and further developed for specific groups and individuals. For example, a diabetic patient may have detailed questions relating to their diabetic history, types, and dietary intakes.
Figure 5.
Questionnaires for Life Expectancy calculation. Questions are customized and further developed for specific groups and individuals. For example, a diabetic patient may have detailed questions relating to their diabetic history, types, and dietary intakes.

Figure 6.
Information flow of health data creation. Initial data are entered by users using their smartphone apps, and optimized data from the cloud server are sent back to the app for fine-tuned prediction.
Figure 6.
Information flow of health data creation. Initial data are entered by users using their smartphone apps, and optimized data from the cloud server are sent back to the app for fine-tuned prediction.

Figure 7.
mHealth mobile app screens (example). (a) Existing health mobile app can integrate PLE feature as additional services (b) as both functions require the same physiological data to transfer to a monitoring center for PLE calculation.
Figure 7.
mHealth mobile app screens (example). (a) Existing health mobile app can integrate PLE feature as additional services (b) as both functions require the same physiological data to transfer to a monitoring center for PLE calculation.

Figure 8.
Mobile health (mHealth) network, which consists of WBAN, Health service providers, Caregiver network and central cloud servers.
Figure 8.
Mobile health (mHealth) network, which consists of WBAN, Health service providers, Caregiver network and central cloud servers.


Table 1.
Summary of Reviewed Life Expectancy (LE) Predictions.
| Diseases Based | Geographic Areas | Relationships | Modelling Techniques |
|---|---|---|---|
| Cancer [24], schizophrenia [25], lung cancer [26,27], breast cancer [28], diabetes[29], limb ischemia [30], IgA nephropathy [31], oral squamous cell carcinoma [32], acute myeloid leukemia [33] and psychiatric disease [34] | America, Europe, and Asia [35,36,37] | Income related [38], relationship with economic growth [39] or globalization [40] | Sullivan [41], Lee and Carter [22], Cairns et al. [23], Jafelice [16], Agawal et al. [17] and Pascaliu et al. [21] |
Table 2.
Summary of Modelling Techniques.
| Modelling Techniques | Authors | Variables | Contribution |
|---|---|---|---|
| [41] | Sullivan | Skin color, sex, at birth and age of 65 | Used a life table model to calculate LE based with/without disability for mortality and morbidity. |
| [22] | Lee and Carter | Age groups, period-specific intensity index, direct time series methods | Used singular value decomposition model to account for almost all the variance over time in age-specific death rates as a group. |
| [23] | Cairns et al. | Mortality-rate dynamics at all ages to simulate the distribution of a survivor index over various time horizons | Proposed calculating the market risk-adjusted price of a longevity bond using two-factor model stochastic for the development of longevity through time. |
| [16] | Jafelice and Barros | Viral load and CD4+ level | Developed Fuzzy set-based model to compute the life expectancy of HIV infected populations to determine the average number of individuals and the life expectancy for specific population groups with no anti-retroviral therapy |
| [21] | Pascariu et al. | Male or Female at the age of 0 and 65 | LE forecasts based on the double-gap life expectancy forecasting model and compared with the Lee and Carter approach and the Cairns et al. strategy. The Double-Gap model approached the use of combination of models for the most promising forecasting tools. |
| [17] | Agrawal et al. | Electronic health records (EHR), Age, sex, health data including vitals | Used predictive models for five-year life expectancy of patients, built on electronic health records (EHR) of nearly 7500 patients aged 50 and above with more than 75 modeling configurations. They developed an online tool which takes a non-redundant subset of 24 patient attributes as the input and generates a patient-specific prediction of 5-year survival. |
Table 3.
General questionnaires, which can be completed by users. These data can be provided without consulting a user’s health service provider.
Table 3.
General questionnaires, which can be completed by users. These data can be provided without consulting a user’s health service provider.
| Classification | Attributes |
|---|---|
| Personal information | Gender, age race, country of birth, location |
| Body physique | Weight, height, Body Mass Index (BMI) |
| Life events | Education, marital status, retired status, residential type (urban/rural), living conditions (e.g., alone, with partner), pets, driving habits, relationship with family & friends |
| Work | Occupation, income, physical/office work, night shifts, full/part-time employment, working hours |
| Fitness | Exercise, general health, frequency, and amounts |
| Health conditions & diseases | Diabetes, high blood pressure, cholesterol levels, cardiovascular conditions, cancer, allergies |
| Diet | Vegan, vegetarian, meat intake, seafood, gluten, and other diet restrictions |
| Family history | Age of death of grandparents and parents, known family history of genetic conditions |
| Lifestyle | Alcohol consumption, smoking, hobbies, sleeping habits |
Table 4.
Technical questionnaires, which can be completed by users by consulting their health service provider. This information would be required to fully access the centralized health service network server.
Table 4.
Technical questionnaires, which can be completed by users by consulting their health service provider. This information would be required to fully access the centralized health service network server.
| Comorbidity count | Mean creatinine (mg/dL) |
| Number of visits for primary care, hospitalization in the past | Lowest sodium (mEq/L) |
| Mean diastolic blood pressure (mm Hg) | Lowest calcium (mg/dL) |
| Mean albumin (g/dL) | Digoxin prescription |
| Highest blood urea nitrogen (mg/dL) | Loop diuretic prescription |
Table 5.
Dataset integration. The first dataset has restrictions of geographic granularity due to privacy reasons. The second dataset can be used to complement to improve the quality of data sources (Adapted from [1]).
Table 5.
Dataset integration. The first dataset has restrictions of geographic granularity due to privacy reasons. The second dataset can be used to complement to improve the quality of data sources (Adapted from [1]).
| Sub-Regional Area (SRA)-Level Dataset (First Dataset) | Census-Tract Level Dataset (Second Dataset) |
|---|---|
| Health and human service agency (HHSA) Behavioral Health Data (Hospitalizations & Emergency Department visits for behavioral health conditions) | Census-tract level dataset |
| HHSA Demographics (Demographics) | American Community Survey 2012 (5-Year Estimates) (Census demographics) |
| Environmental Systems Research Institute (ESRI) Market Potential Data (Consumer buying patterns and behaviors) | CalEnviroScreen 2.0 (Pollution data) |
| San Diego Association of Governments (SANDAG) Healthy Communities Atlas (Data on physical and built environment) | Loop diuretic prescription |
Table 6.
Environmental factors that affect PrLE (Adapted from [1]).
Table 6.
Environmental factors that affect PrLE (Adapted from [1]).
| Average violent crime rate | Composite score: pedestrian traffic safety |
| Total park acreage | Percentage of block groups that interest with parks |
| Fast food density per square mile | Percentage of sidewalk coverage |
| Block groups with minority areas | Count of grocery stores locations |
© 2018 by the authors. Licensee MDPI, Basel, Switzerland. This article is an open access article distributed under the terms and conditions of the Creative Commons Attribution (CC BY) license (http://creativecommons.org/licenses/by/4.0/).
Share and Cite
MDPI and ACS Style
Kang, J.J.; Adibi, S. Systematic Predictive Analysis of Personalized Life Expectancy Using Smart Devices. Technologies 2018, 6, 74. https://doi.org/10.3390/technologies6030074
AMA Style
Kang JJ, Adibi S. Systematic Predictive Analysis of Personalized Life Expectancy Using Smart Devices. Technologies. 2018; 6(3):74. https://doi.org/10.3390/technologies6030074
Chicago/Turabian StyleKang, James Jin, and Sasan Adibi. 2018. "Systematic Predictive Analysis of Personalized Life Expectancy Using Smart Devices" Technologies 6, no. 3: 74. https://doi.org/10.3390/technologies6030074
Note that from the first issue of 2016, this journal uses article numbers instead of page numbers. See further details here.