Investigating the Role of Virtual Reality in Planning for Sustainable Smart Cities


1
College of Engineering and Science, Victoria University, Melbourne 3011, Australia
2
School of Engineering, Faculty of Science Engineering and Built Environment, Deakin University, VIC 3216, Australia
3
School of Software and Electrical Engineering, Swinburne University of Technology, VIC 3122, Australia
*
Author to whom correspondence should be addressed.
Sustainability 2017, 9(11), 2006; https://doi.org/10.3390/su9112006
Submission received: 13 September 2017
/
Revised: 18 October 2017
/
Accepted: 30 October 2017
/
Published: 1 November 2017
(This article belongs to the Special Issue Sustainable Smart Cities and Smart Villages Research)
Abstract
:With rapid population growth, urban designers face tremendous challenges to accommodate the increasing size of the population in urban areas while simultaneously considering future environmental, social, and economic impacts. A “smart city” is an urban development vision that integrates multiple information and communication technologies to manage the assets of a city, including its information systems, transportation systems, power plants, water supply networks, waste management systems, and other community services provided by a local department. The goal of creating a smart city is to improve the quality of life of citizens by using technology and by addressing the environmental, social, cultural, and physical needs of a society. Data modeling and data visualization are integral parts of planning a smart city, and planning professionals currently seek new methods for real-time simulations. The impact analysis of “what-if scenarios” frequently takes a significant amount of time and resources, and virtual reality (VR) is a potential tool for addressing these challenges. VR is a computer technology that replicates an environment, whether real or imagined, and simulates the physical presence and environment of a user to allow for user interaction. This paper presents a review of the capacity of VR to address current challenges in creating, modeling, and visualizing smart cities through material modeling and light simulation in a VR environment. This study can assist urban planners, stakeholders, and communities to further understand the roles of planning policies in creating a smart city, particularly in the early design stages. The significant roles of technologies, such as VR, in targeting real-time simulations and visualization requirements for smart cities are emphasized.
1. Introduction
The extent of metropolitan areas has significantly increased over the past decades [1]. According to United Nations the world population will increase to 9.3 billion by 2050, and among which, 6.3 billion people will dwell in urban areas.
As a result of rapid urban growth and the establishment of megacities, new sets of challenges have developed in urban areas. These challenges include, but are not limited to, environmental issues, air pollution, the heat island effect, the lack of natural resources, and deteriorating infrastructure. The implementation of effective policies and strategies for a smarter urban growth has received further interest under such scenario. The increasing population requires governments to determine ways to create future spaces for citizens. They base their economic development policies on building advanced infrastructure to keep up with international competition.
At present, information and communication technology (ICT) changes the manner in which cities perform and affects the policies formulated for future growth. Smart cities base their strategy on the use of ICT in several fields, such as economy, environment, mobility, and governance, to transform city infrastructure and services with the least adverse impact on the environment.
The smart city concept has recently received significant attention from policy-makers. However, a clear and consistent understanding of this new phenomenon has yet to be fully gained. Smart cities, as effective strategies for addressing urbanization challenges, have attracted considerable interest from governments and policy developers worldwide.
Although no single description exists for smart cities, they are briefly defined as “those cities that utilize information and communication technologies with the aim to increase the quality of life of their dwellers, while providing sustainable development.” The management of resources will be sustainable as a result of implementing these technologies in urban services and infrastructure. Other scholars have perceived smart cities in a different manner.
For example, Albino believes that six main criteria lead to the creation of a smart city: smart economy, smart environment, smart mobility, smart people, smart living, and smart governance. Some scholars have envisioned a smart city as a combination of sensor networks [2]. Others have portrayed a smart city as an improvement in the quality of social operation [3].
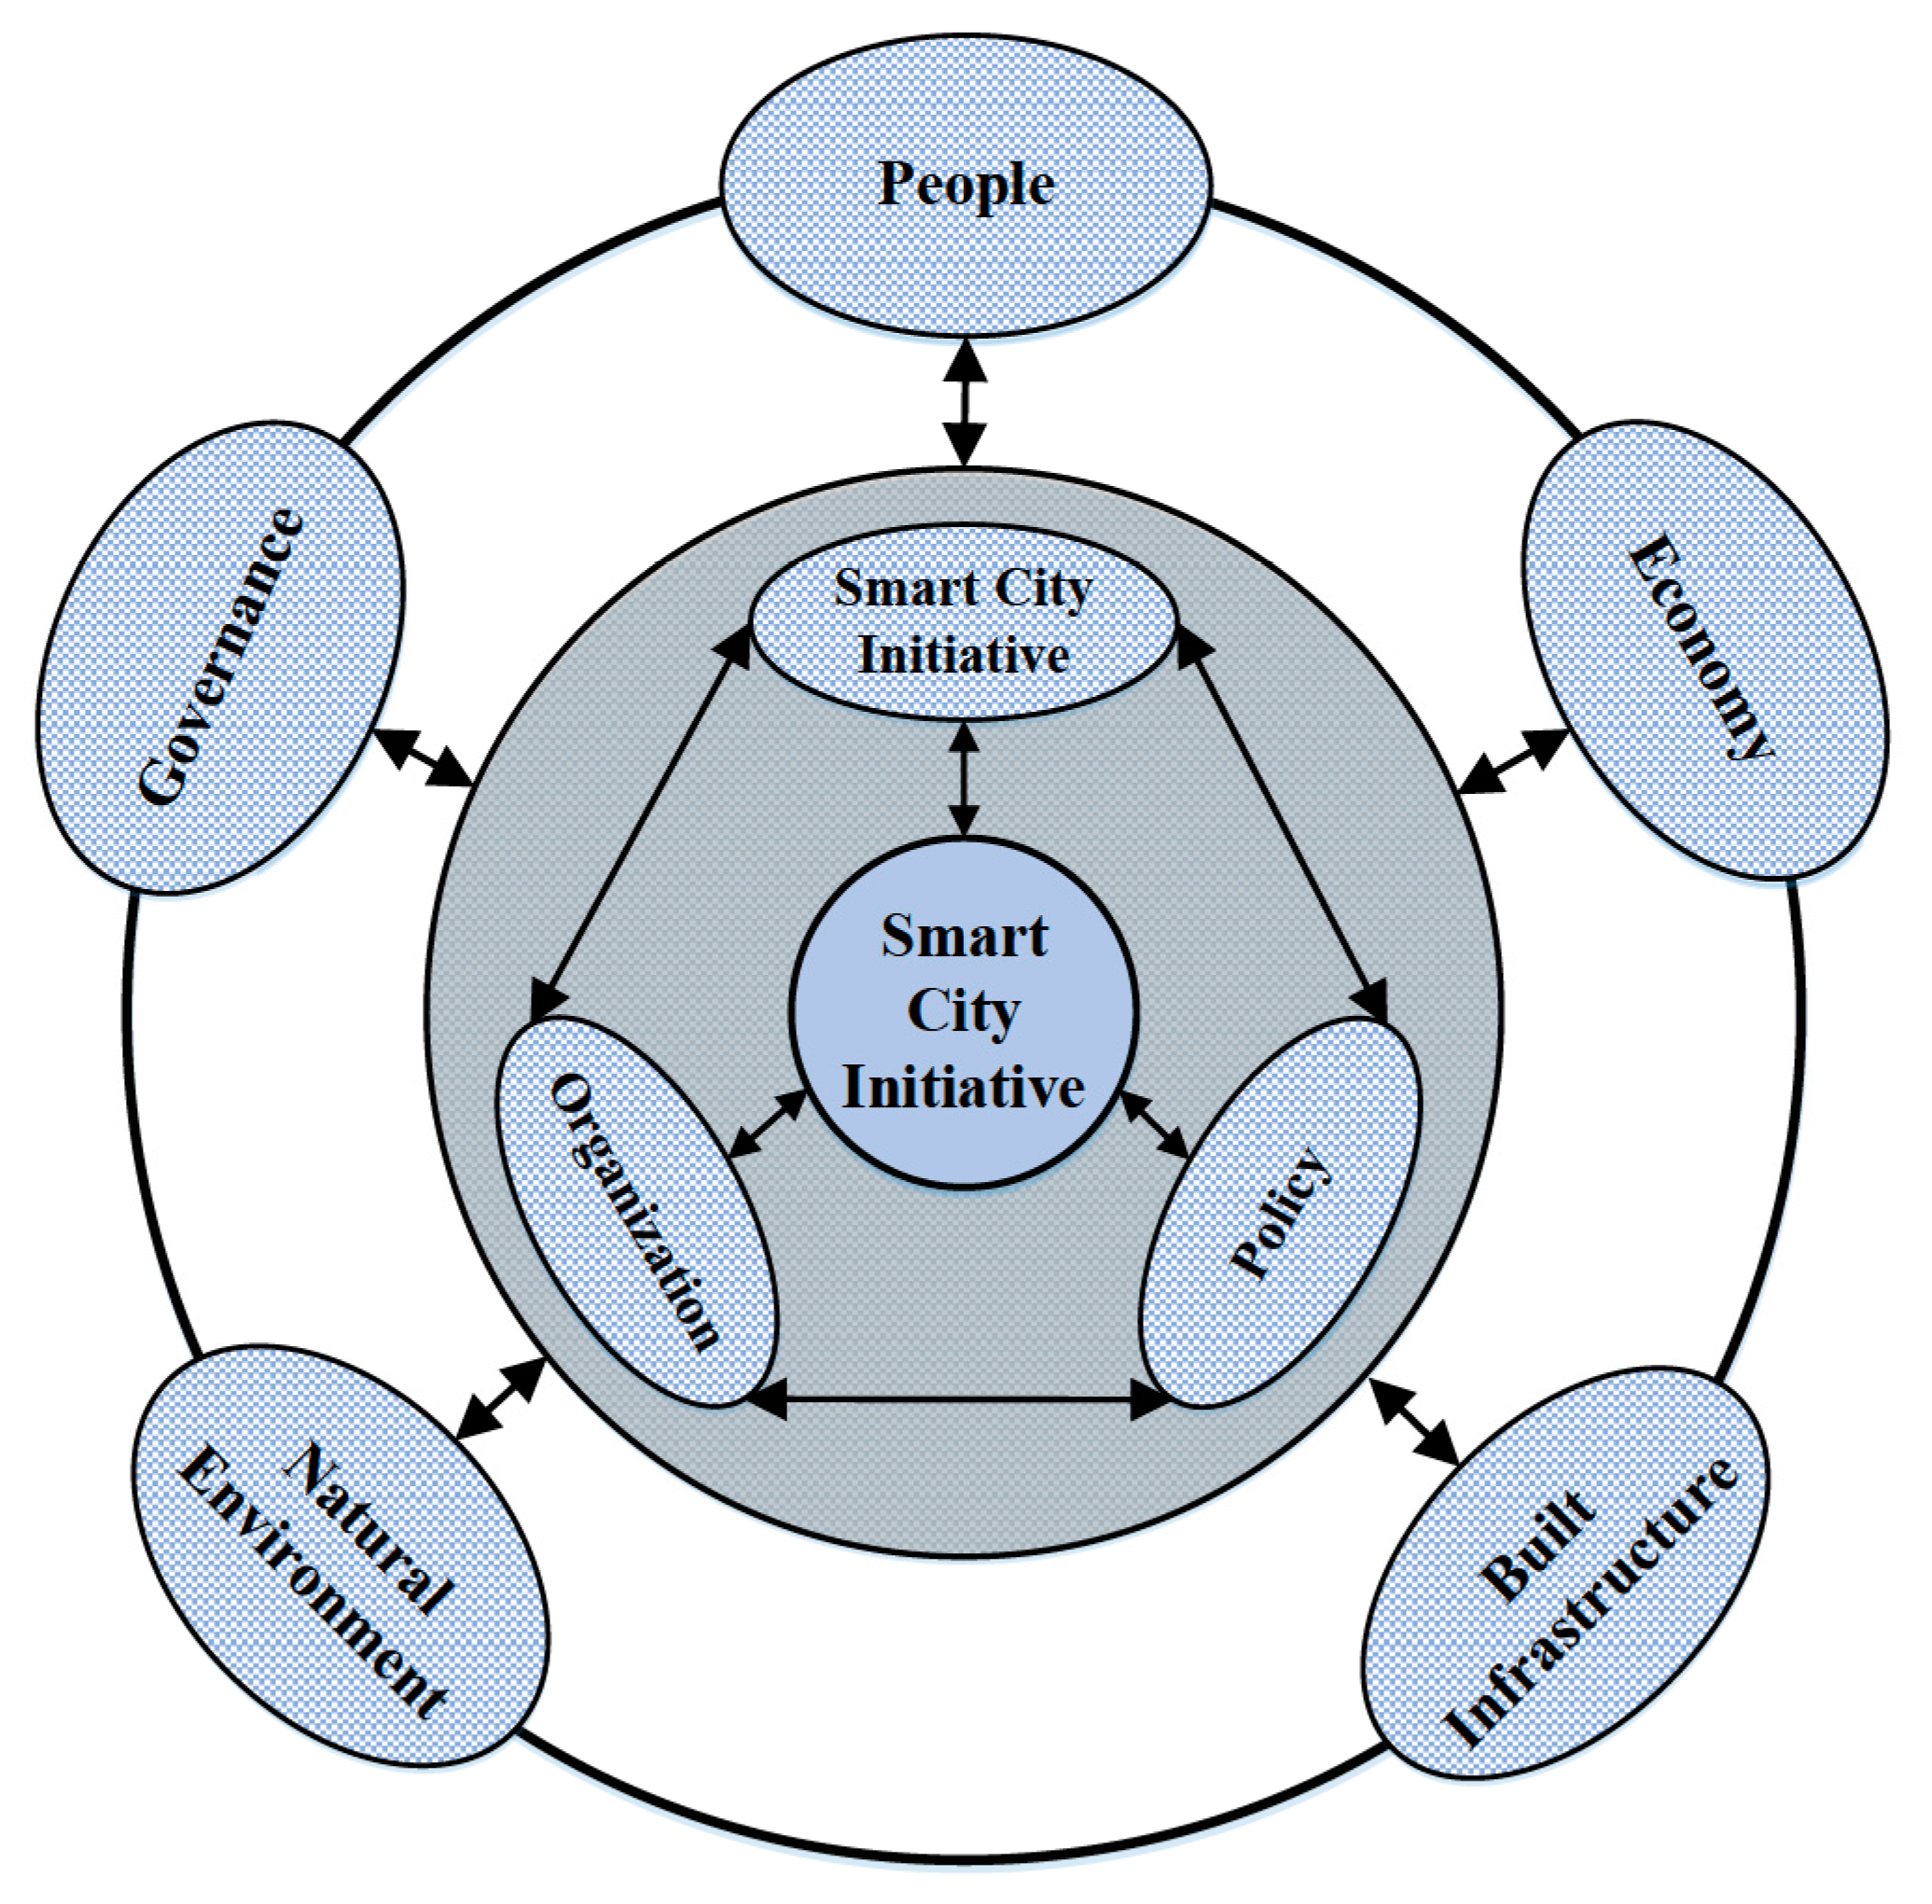
In the context of sustainable urban growth, a smart city is a concept that is developed based on three major pillars: establishing economic growth, addressing environmental issues, and incorporating social equity. In the context of geomatics, a smart city is the integration of a digital city, the Internet of Things, and cloud computing technology.
A digital city creates a 3D spatial framework for a city. The Internet of Things conducts real-time sensing, measurement, and data transmission of moving objects. The function of cloud computing is similar to that of a human brain. It is responsible for complicated calculations, data analyses, and pattern recognition; it also provides remote monitoring, control, and feedback. The link among different components of a smart city is shown in an integrative framework in Figure 1.
Smart city design is largely influenced by the development and advances in digital technology and visualization of smart city is identified as the most important part of the design process. Nowadays, a wider range of digital tools and visualization techniques assist the planning and designing of smart cities which consists of data storage and retrieval. Visualization techniques aim to analyze and inform the design process and provide sophisticated communication strategies between the final users (i.e., communities, public) and decision-makers (i.e., governments, policy makers). This paper presents an overview of the challenges in creating smart cities and discusses the use of virtual reality (VR) in data visualization. This paper presents an overview of the challenges in creating smart cities and discusses the use of virtual reality (VR) in data visualization.
2. Literature Review
2.1. Smart, Sustainable Cities, and VR
A smart city is defined according to a model which was initially employed as a classification system-and established on six main pillars; intelligent mobility system, smart environment, smart lifestyle, smart urban citizens, smart economy, and smart governance—against which smart cities can be assessed [4]. The concept of smart city can be also defined as an urban development technique to highlight the growing role of ICT infrastructure in improving the triple bottom lines in urban sustainability. Sustainability, on the other hand deals with the complex interactions between environmental, social, economic, and physical subsystems of an urban environment [5].
Smart city design often consists of formal sequence of different formal stages and has a cyclic process in which expertise and professionals get together and come up with innovative solutions. These stages should be communicated to numerous decision-makers. The design process should be communicated during and before the design process, particularly if the design teams consist of professionals with diverse backgrounds. The most important factor in designing smart cities is clear communication between the clients, designers, political decision-makers, and communities. The urban design solutions and master plans are basically visual in nature. Therefore, the most effective method to communicate these solutions is visual as well. This method involves functional, economic, social, and aesthetical aspects of design.
The emergence of virtual reality and ICT assist urban planners to effectively overcome these complexities through visualizing the big data [6]. In fact, visualization through virtual reality has made it possible to approach a range of issues around the sustainable development from a new perspective.
Furthermore, virtual reality as an interactive platform enable smart and sustainable cities to identify their potentials by getting smarter and by improving their contribution to sustainability and increasing rate of urbanization. The lost connection between smart and sustainable cities and virtual reality is the main factor in the emergence of smart city which also highlights the important role of urban management system [7]. Therefore, recent research projects have started to look at the methods to improve smart and sustainable city approaches and smarten the sustainability in the urban environments [8,9]. Web-based visualization technologies, such as VR, present a dynamic virtual environment. Urban simulation is carried out to provide further dynamic virtual process with which a user can interact. These tools enable the designers to produce a sophisticated, yet real, world.
VR is one step higher than 3D visualization. VR is explained as a, computer-generated environment that provides a user with the sense of being surrounded by a real world. The emergence of VR in in the late 1980s opened numerous opportunities for architects, professional animation, 3D makers and also held a promise for public participation planning.
The first step is creating a 3D environment in VR, in which the user would be able to easily navigate inside this virtual world. VR is capable of creating very detailed virtual environments that are highly complex. For instance in a VR project conducted by the Divisions group in Japan, users were able to explore and navigate inside the room of each house, using a headset and a three-dimensional mouse. The user’s hand appears on the screen and the user can use this hand to open the doors or drawers, push or pool the doors, turn on or turn off the lights, run the water in the bathroom, and change the interior design. Although architects claim that this program does not provide a satisfactory level of detail, its effectiveness in participatory planning has been evident, since it enables the user to see and assess the development scenarios before it is constructed.
The application of VR in promoting participatory planning is in its experimental and infant stage. However, this application provides a best communication tool for individuals with diverse background to talk in a same language. For instance, a modeled and visualized neighborhood in VR enables public and communities to walk through the virtual environments and experience the proposed design scenarios.
Currently there are a limited number of VR related applications available specifically for use in designing or simulating smart cities. This is likely to change with the rapid increase in the need to provide clients and government parties with BIM (building information modelling), GIS (geographic information system), and LIDAR (light detection and ranging) data that can be used to create 3D virtual environments. Navisworks, an Autodesk application, is commonly used in the construction industry to navigate and annotate 3D models and provide limited VR support such as stereo real-time rendering and VR stereo 360-degree image rendering. It is possible to extend this capability with plugins which can support different VR hardware, such as a VR CAVE. However, due to the rapid developments in the field, the technology has to be updated accordingly.
Revizto [10] is an application developed to support a range of BIM and CAD applications to present interactive 3D virtual presentations, typically walkthroughs, and has recently added support for Oculus RFT and HTC Vive VR hardware. While Revizto provides a great solution for viewing the virtual models, the level of interactions in the buildings or cities using VR hardware is limited. For instance, one of the challenges is to select individual objects or layers using tracked hand controllers.
Nowadays, the ideal approach to take full advantage of current VR hardware and the latest VR features is developing smart city applications within a game engine such as Unity [11] or Unreal. This will provide a great opportunity to employ advanced VR interaction features, such as hand and gesture based tracking. While this approach requires extra time and expertise in optimizing the models or programming interactions, but it gives developers the freedom of implementing a range of supported VR interaction techniques available in the selected game engine. Although VR is still in its infant stages, using a VR supported game engine is a good approach to experiment with VR interactions required for smart city applications. As the deployment of VR technology progress, it is expected that interactions will be considered important for smart city design and will likely lead to specific smart city design applications that support the required VR interactions natively.
2.2. Development of VR
Visualization refers to a process of transforming data into visual representations, which are intended to develop effective and efficient cognitive processes to gain insight into those data [12].
Virtual technology is not a new concept, and it has evolved from other technologies. The actual roots of VR date back to 1962 with the ill-fated “sensorama” of Morton Heiligs and the development of teleoperation displays by using head-mounted, closed-circuit television systems.
The use of VR in modeling, communication, and visualization has received increasing interest. One of the main reasons why VR has attracted considerable attention is that it offers benefits to a wide range of users (e.g., scientific visualization, operations in hazardous or remote areas), particularly in visualizing, planning, and designing ideas in a built environment before they are established.
VR is the capability to simulate the physical presence of a user within a VE by stimulating senses, usually sight, sound, and touch, and by providing an intuitive interaction. VR is a reemerging technology that exhibited promise in the late 1990s, but lacked the hardware capability and processing requirements to become a fully mature technology at that time.
Computing power has progressed in recent years to a point that VR is currently a commonly accessible technology, and several VR hardware and software solutions have been rapidly released. The VE presented to a user can either be fictional or can simulate a real-world environment depending on its design. User immersion is achieved using a range of different VR hardware solutions, such as stereoscopic displays, tracking systems, sound systems, and haptic devices.
VR comprises two main types based on the degree of immersion and interface in a synthetic environment: immersive and non-immersive VR systems. Immersive VR is an application in terms of quasi-physical experience. In such an experience, a fuller contact occurs between the user and the virtual environment. These types of VR can be obtained by using data gloves and multimedia head-mounted display (HMD) devices. Non-immersive VR uses a screen interface and enables users to feel the modeled environment through devices, such as eyeglasses. These types of VR, which are also called desktop VR or screen-based VR, include “division” and “superscape” software.
In another classification, VR systems are divided into HMDs and cave automatic virtual environments (CAVEs). HMDs, such as Oculus Rift, HTC Vive, Gear VR, and Google Cardboard, provide a low-cost VR solution by using a stereoscopic display mounted on the head of a user. They provide users with rotational head tracking that allows them to look in any given direction within the VE from a fixed point. The more sophisticated tracking systems allow users to walk around a given area and may also support hand tracking to provide natural interaction with virtual objects.
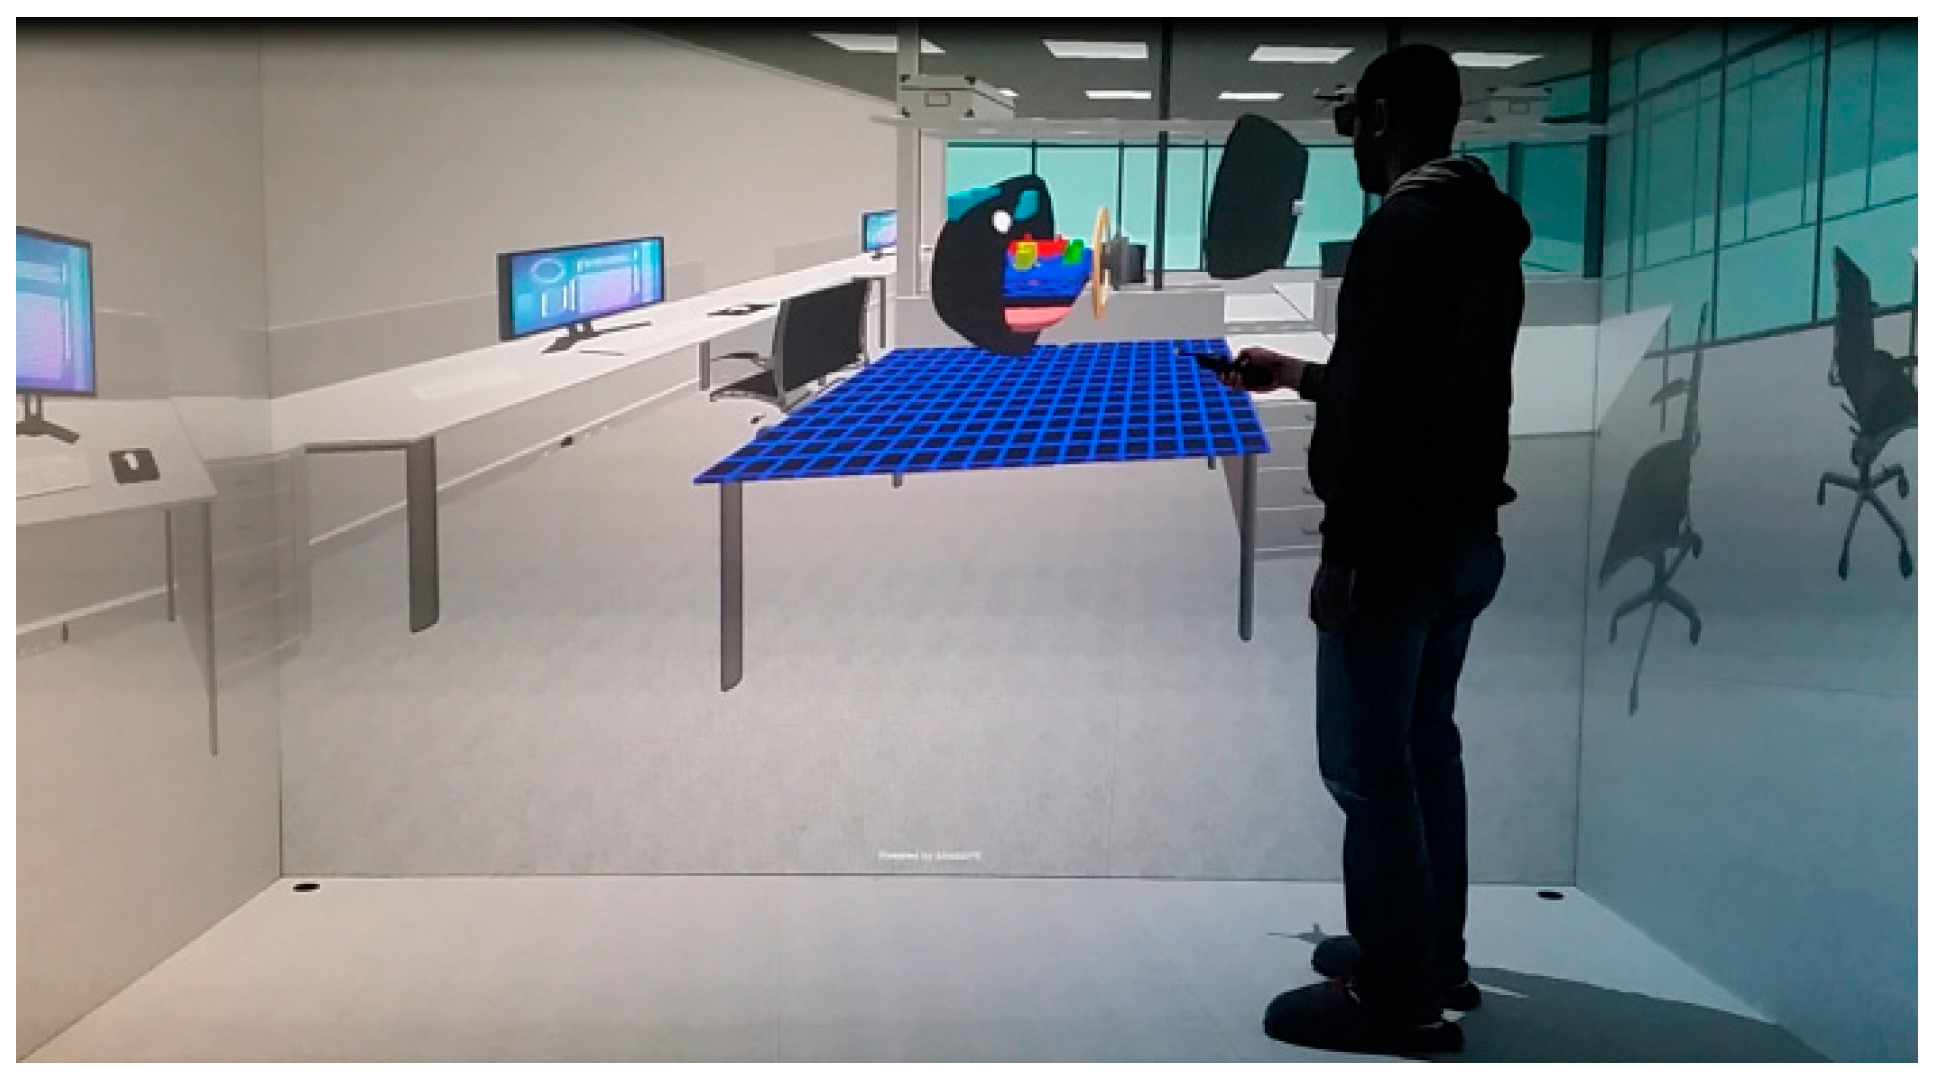
A challenge in HMDs is the loss of the proprioceptive of users because their physical body cannot be observed while wearing an HMD. By contrast, CAVEs are commonly constructed with three to six walls in a cube shape using stereoscopic projectors. A user typically wears stereoscopic glasses and interactive markers to provide a fully immersive experience within a given workspace that they can physically navigate. Unlike in HMDs, user vision is not obstructed from their physical surroundings. Figure 2 shows a four-sided CAVE.
Online multi-user VR is an emerging field within VR allowing multiple users to connect using either local networks or the Internet. This alters the VR experience from an isolated experience to a platform ion which multiple users can interact within the same virtual environment. An emerging standard for VR format on the web is WebVR [13], which provides a format for describing 3D interactive virtual environments on the web. This VR format currently supports a wide range of VR hardware including Oculus Rift, HTC Vive, and Google Cardboard that can be used to view a VR website.
2.3. VR and Planning Smart Cities
Urban planning is a complex process that encompasses different aspects in social, economic, physical, and spatial sciences. These aspects are dependent, and they interact with one another within an urban system. Therefore, the decision-making process relies equally on all these aspects.
Neighborhoods, cities, and precincts are complex structures, and the way urban designers and planners perceive the challenges and identify the opportunities is strongly visual.
A significant challenge in modeling cities, particularly smart cities, is data visualization, which is mainly due to the various data generated from numerous processes, such as traffic, human movement, environmental pollutions, energy resources, and water supplies. This information will provide the data to determine how a city will look and what is happening in the city.
Communication is another challenge between planning authorities and designers, which frequently leads to uncertainties in decisions and the lack of consistency among stakeholders. Therefore, discussions, formal meetings, and the presentation of informative and accessible data that can also exhibit the complex interactions of multiple variables in urban environments are integral parts of any decision-making process.
Providing an effective visualization tool to evaluate and forecast the environmental and social consequences of creating a city is the key to achieving a sustainable and resilient urban design. Considerable research has focused on different visualization techniques including heat maps [14], glyph annotated maps [15] and tradition 2D graphs [16], but studies on the effectiveness of VR in modeling the future of smart cities and on demonstrating the impacts of “what-if” scenarios to policy-makers and communities is lacking.
Visualization in urban planning and urban design provides three main benefits [16]: (1) it assists in understanding the consequences of design schemes from multiple perspectives; (2) it helps understand the different layers of information about urban planning and urban design; and (3) it offers an effective platform for communicating with others.
The traditional approach in visualization is to demonstrate information and data within a 2D framework. The 2D layers are complex, and only planning professionals can fully manipulate information. Consequently, the potential use of 3D VR systems has been explored in depth to overcome the limitations of 2D systems.
Planners can evaluate the impacts of new developments in relation to transportation patterns, environmental consequences, and access to landmarks, infrastructure, and other amenities, by using VR. Planners can also map and assess the social, cultural, and behavioral responses to the built environment. VR creates environments that can be entered into and interacted with directly, thereby considerably facilitating the visualization, communication, and evaluation of new design schemes.
The successful application of VR to urban design is assessed in two ways: (1) the capability of the 3D VR system to convince clients (i.e., the public, authorities, lobby groups) to address urban design guidelines and planning policies; and (2) the capability to provide an accurate and exact visualization that is realistic and is a validated benchmark for further design alternatives. Both ways contribute to the concept of “participatory planning,” which presents the process in which all the stakeholders and urban dwellers actively involved in the planning and policy processes and play a significant role in defining the directions, visions, and initiatives of urban growth and development.
In fact, engaging different sectors in the decision-making process is a key step in designing a smart and resilient city, and this practice will lead to a good balance among different levels of power, interests, and resources. Moreover, such an approach will create a platform for further interaction and communication on an equitable basis, thereby allowing participants to be part of the final planning outcomes and empowering individuals to address issues and set priorities.
Participatory planning enables communities to engage in the different aspects and scales of the planning process and changes a top-down hierarchy into a joint and elaborate experience which, in turn, will lead to a creative and informed outcome [17].
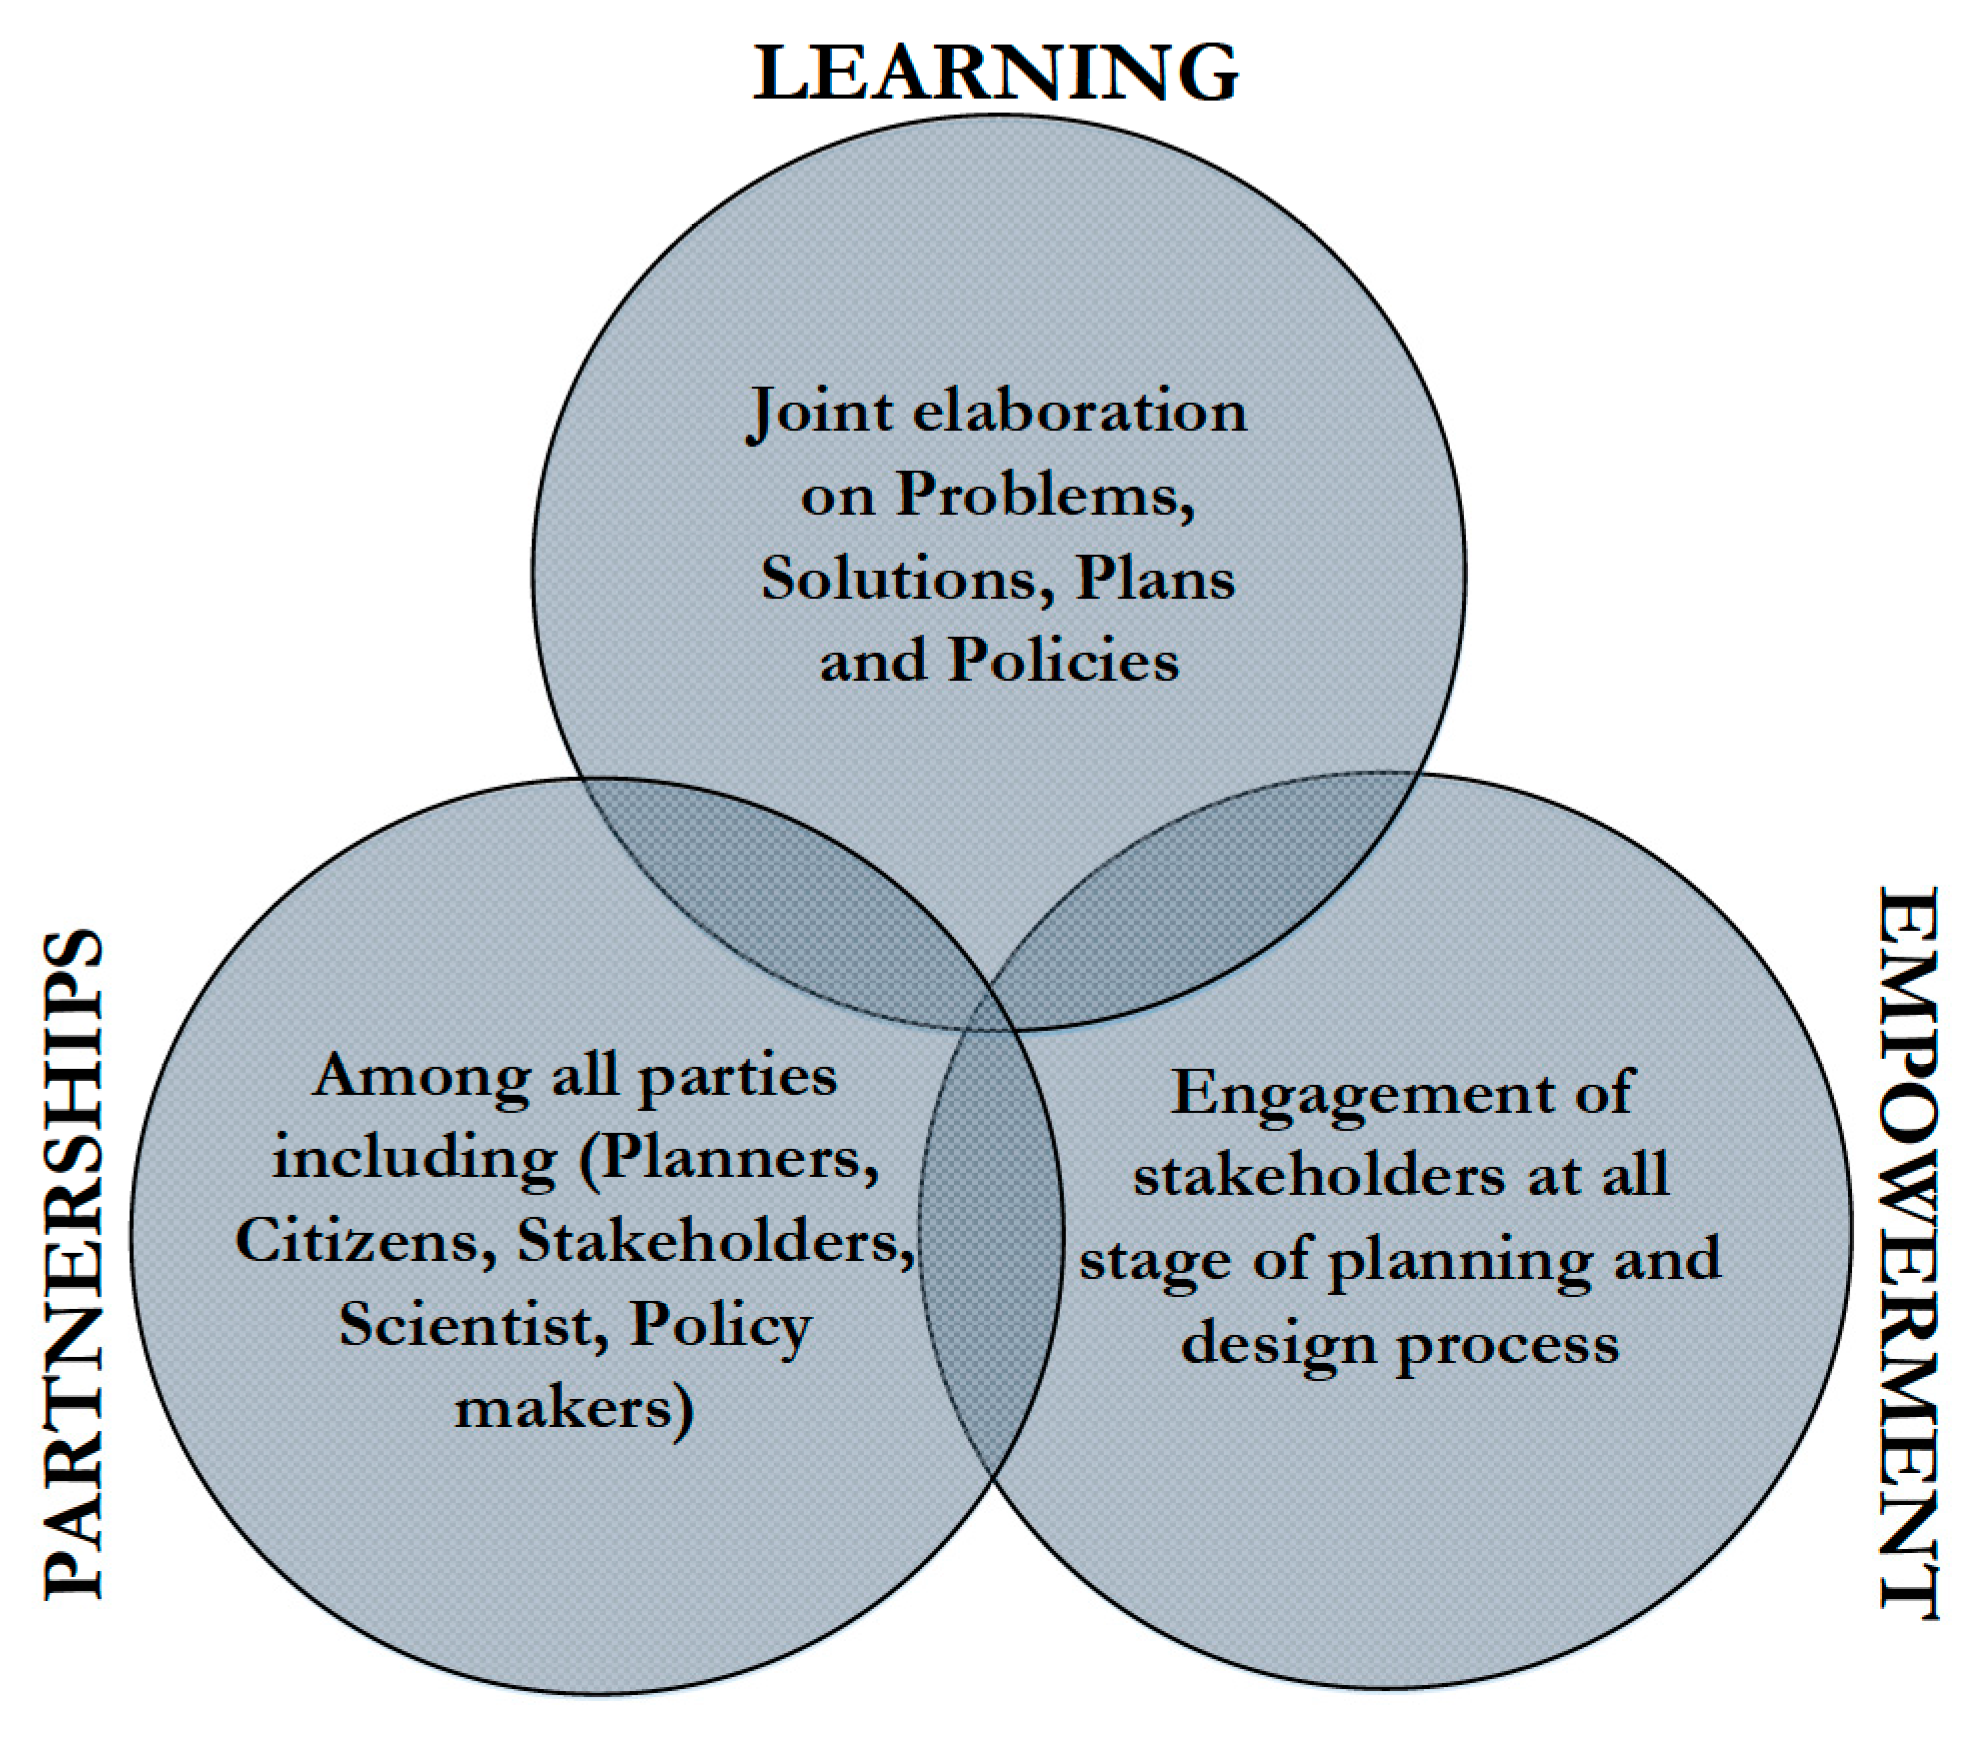
VR, as an emerging discipline in the area of information technology (IT) and ICT, can significantly contribute to creating a platform for such an interaction, supporting mutual learning and transparency in planning policies, and establishing strong partnerships among different parties and disciplines. In fact, VR helps establish participatory planning among different parties, which varies from a conventional problem-solving approach. Figure 3 illustrates the key elements of participatory planning.
As Figure 3 demonstrates, participatory planning brings up a novel political approach to planning, within which decision-making and policy-making occur on shared issues via the active interaction between various parties including urban planners, citizens, stakeholders, scientists, and policy-makers. Therefore, instead of only focusing on problem solving, participatory planning mainly consists of an interaction platform which supports the mutual learning, the establishment of partnerships and the empowerment of stakeholders. It also constitutes a process of collective analysis, learning, and policy action, where the decision-making is highlighted more than the sketch of the final planning outcome [18].
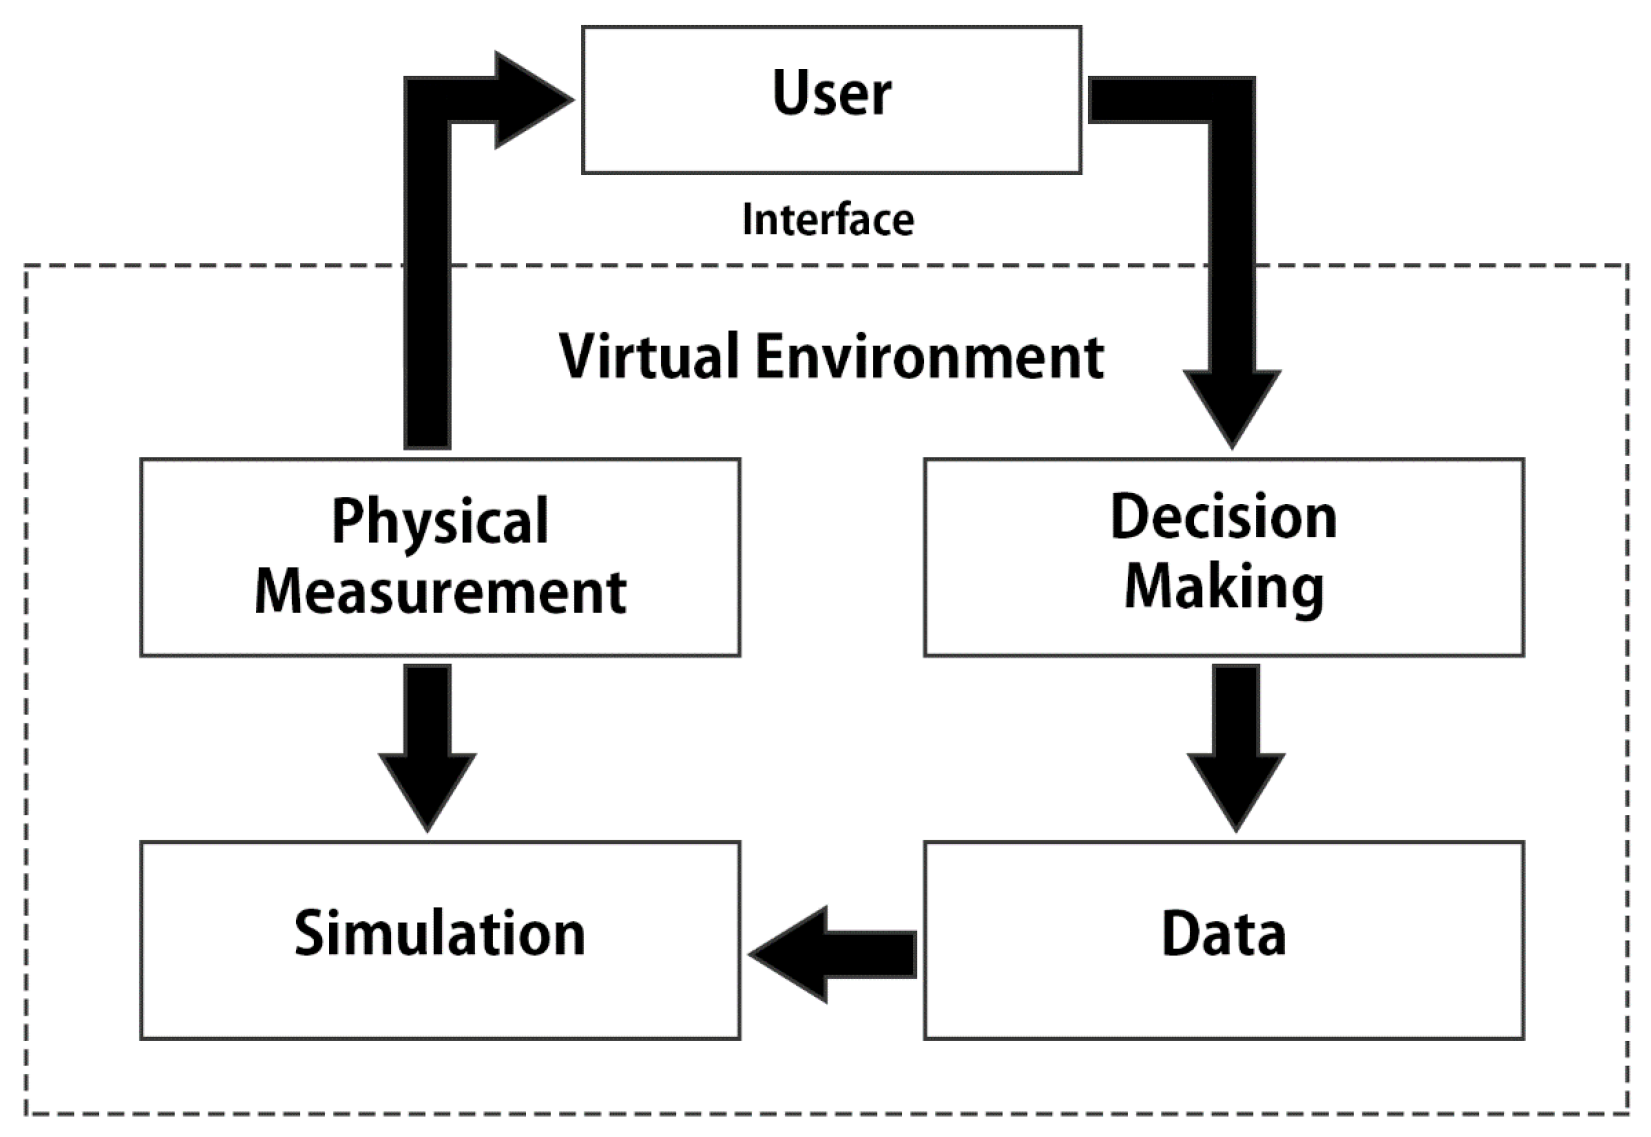
Data visualization via VR provides adequate information on different opinions, insights, visions, fears, desires, and empirical knowledge for communities, planners, and stakeholders, which subsequently defines the type of planning decisions that best fit the specific need of a certain community (Figure 4). Data visualization via VR involves sharing responsibilities for the decision-making process, in which local planners, community, and stakeholders will benefit.
2.4. VR and Real-Time Simulation
Recent advancements in VR have changed the way in which research is conducted and have provided alternative solutions to traditional educational methods. The design and simulation of smart cities using VR technology can also benefit from the increased level of immersion in and natural interaction with virtual environments that current VR technology affords. Game engines, such as Unity and Unreal, provide a high level of realism using physically-based rendering (PBR) materials [19] and create realistic visual effects that closely represent real physical interaction with light. They are combined with built-in physics engines, such as NVidia’s PhysX [20], which enable investors and developers to create interactive VEs that provide a good representation of the real world.
The deployment of “serious games” has rapidly grown in the last few decades. “Serious games” refer to a term coined for VEs used in research, education, and industry for real-world applications other than edutainment that are currently being deployed using the latest VR hardware.
Conventional methods for modeling and data visualization create confusion in understanding design concepts, particularly for nonprofessional cohorts who lack the required skillsets to interpret 2D data, such as tables, graphs, and diagrams. Simulations for smart cities also frequently lack real-time data visualization which, in turn, contributes to difficulties in effective communication among different stakeholders.
Smart cities represent an ideal candidate to deploy a VR solution for design and simulation phases. Planning and designing smart cities include analyzing and synthesizing different layers of information and data, particularly when considered over specific time intervals.
The use of modern game engines and interactive VR hardware enables researchers to apply the information obtained from traditional simulation techniques and to provide real-time, naturally interactive, and fully immersive VEs that lead to good visualization of vast amounts of smart city data. A given city can be modeled or scanned using modern techniques that provide a 3D visual reference that closely replicates an actual city. Specific layers of data important to smart city design, such as services, traffic, pollution, and thermal comfort, can be requested through handheld controllers or gesture-based commands while navigating important areas of interest. Designers and planners can alter design and planning parameters (e.g., the location and size of green and gray infrastructure), provide real-time simulations, and illustrate the environmental, social, and economic impacts of each design/planning scenario.
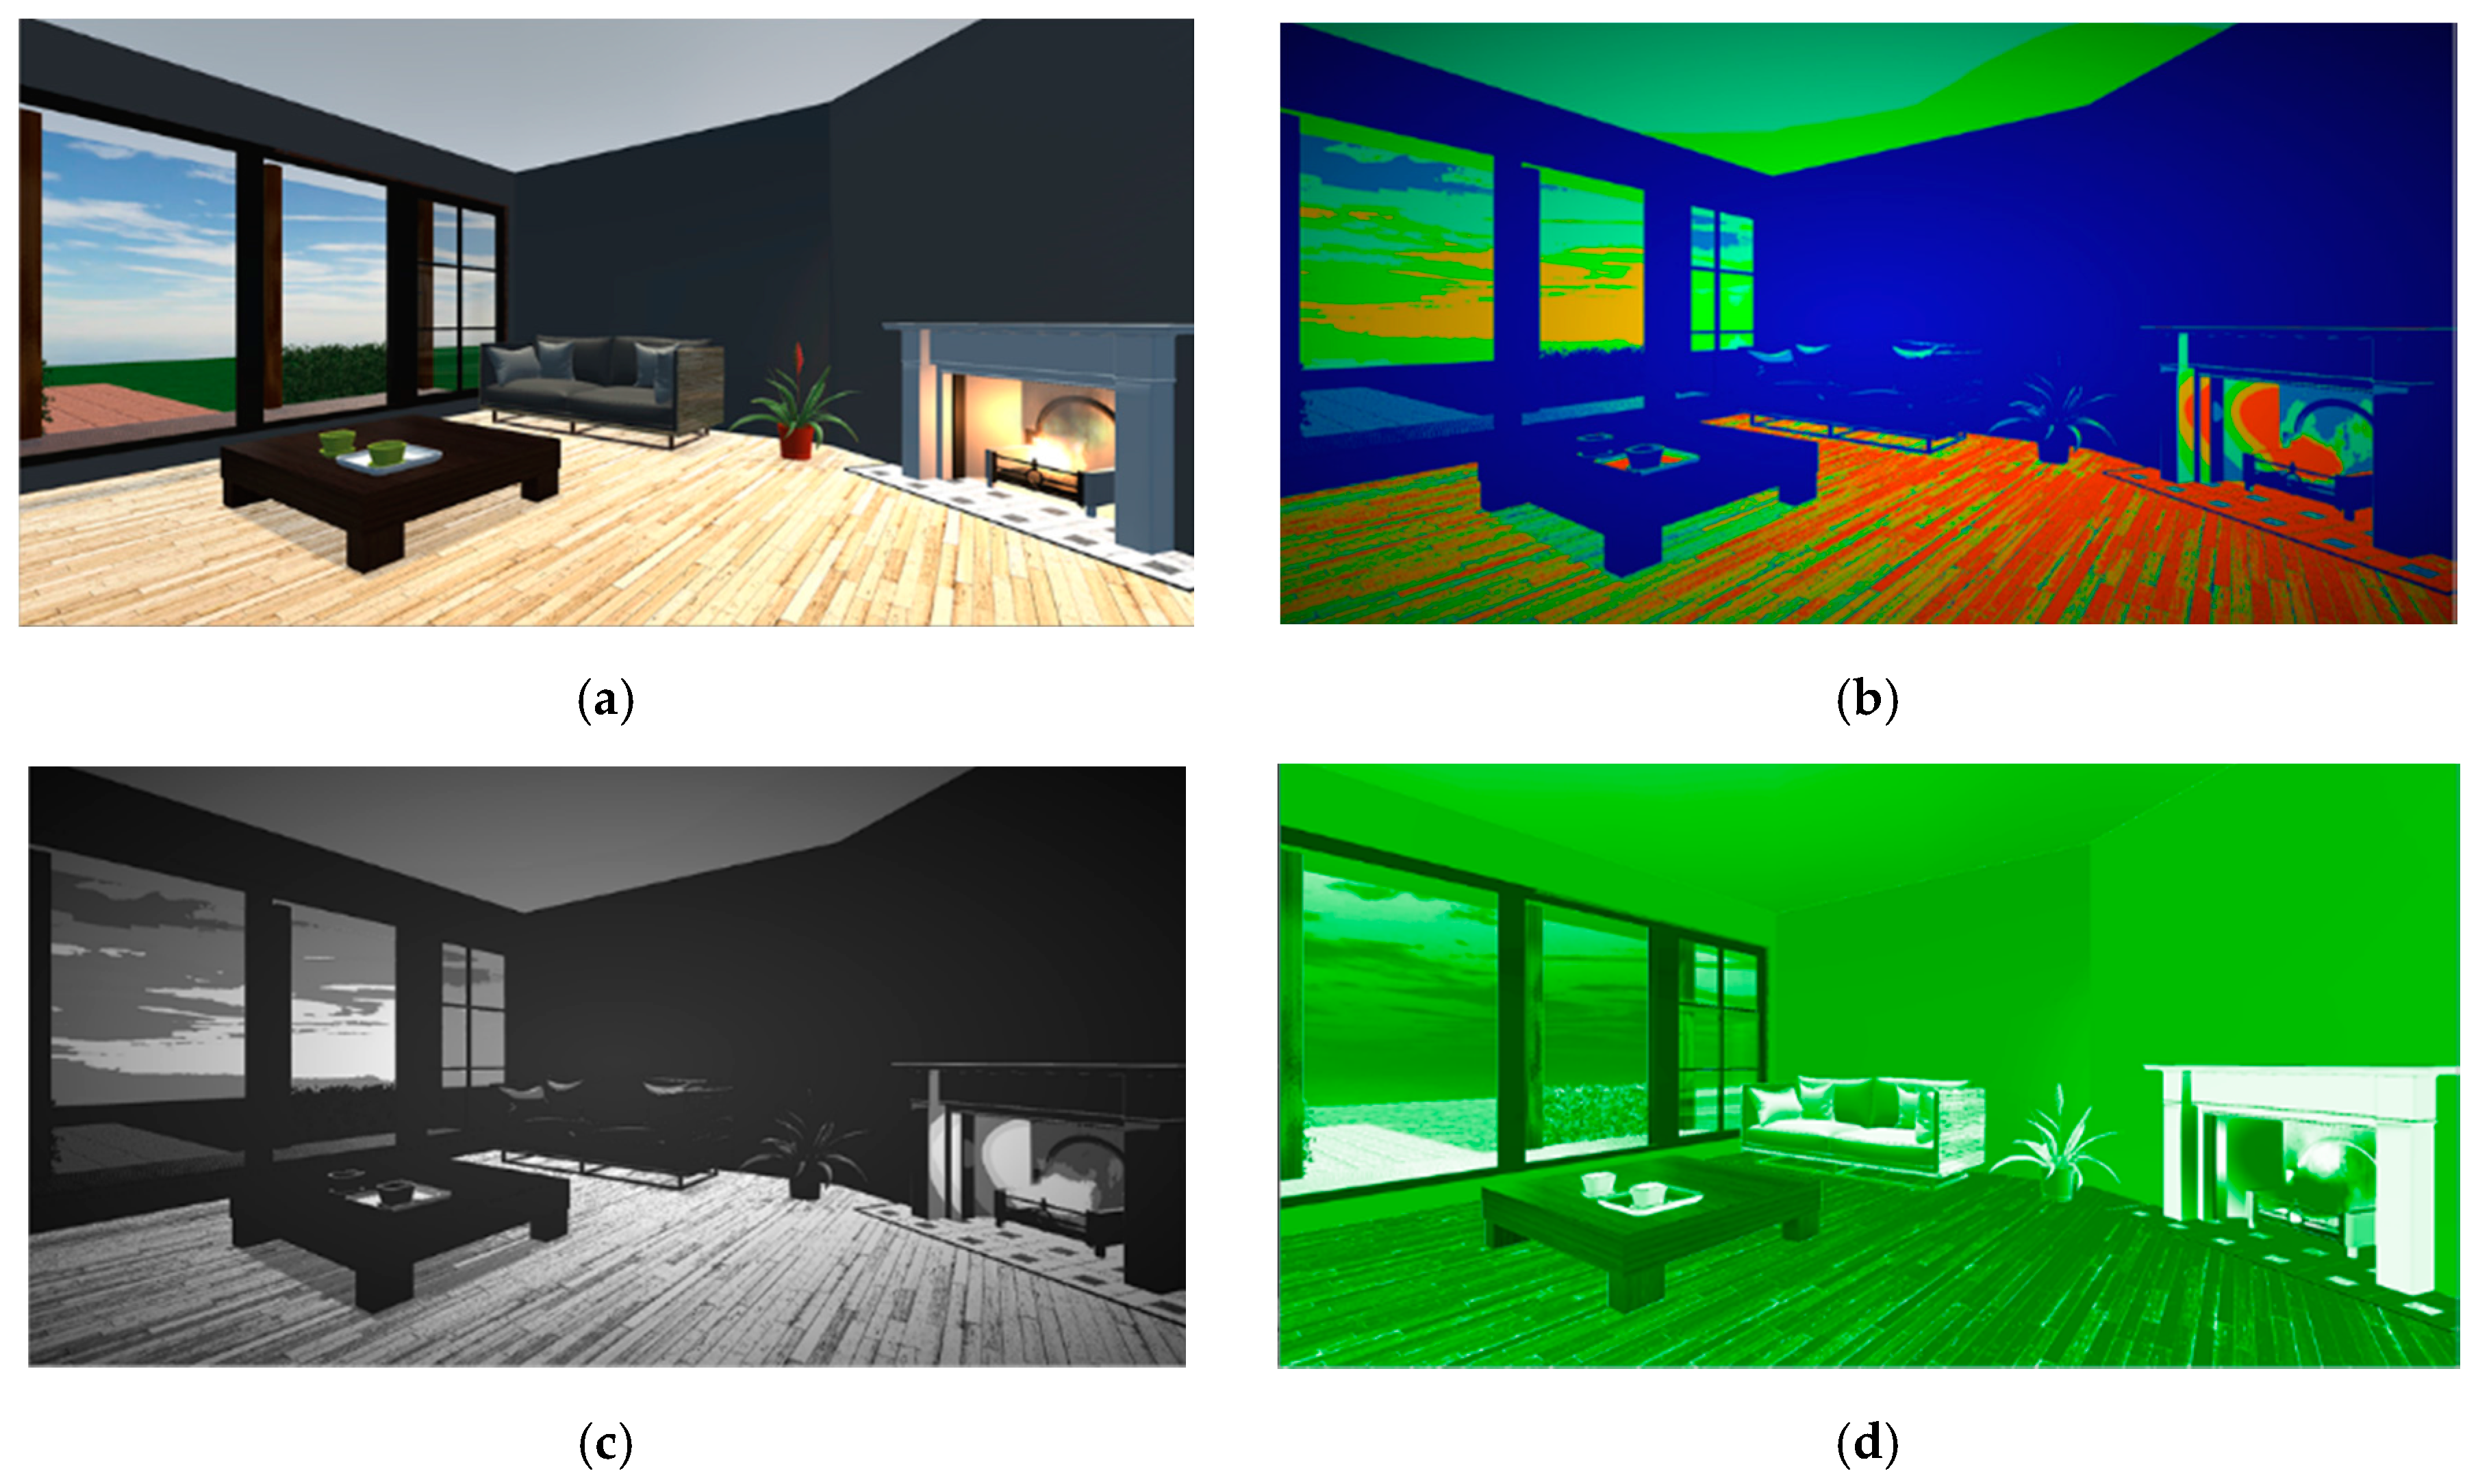
In graphic design, the term “rendering” refers to the calculation of computer visuals based on a modeled scene using certain physical characteristics, such as light, shadow, and reflection. A shader provides information on how a modeled scene will be rendered and is frequently used to provide special effects, such as chroma keying, bump-mapping posterization, and distortion. For visualizing different layers of data in smart cities, the use of infrared, thermal, and night vision shaders can provide real-time camera views (Figure 5) by adopting a simple user interaction. Consequently, users can visually switch among important physical information, such as heat and light in real-time while virtually navigating a city to gain a good understanding of the changes they make during the design or simulation process.
Planning for future urban development is a visionary “debate and decide” process, not a “predict and provide”, computer-driven process. Therefore, to create a smart sustainable city all the decisions should be sustainability-based, integrating social, economic, environmental, and cultural considerations. Such decision-making processes are inclusive and require a thorough analysis of big data. Virtual reality as an emerging field provides a platform to visualize the impact of future urban development scenarios prior any implementation stage, and thereby leads to a significant reduction in the cost, drastic improvement in the environment of the cities (pedestrian thermal comfort/air temperature, transportation) and, finally, further socio-cultural and psychological awareness among urban dwellers. Therefore, this paper focuses on the role of VR in creating smart, sustainable cities through investigating different aspects of sustainability in urban environments and by exploring the (1) potential of VR in visualizing pedestrian thermal comfort in cities (environmental aspect); (2) potential of VR in visualizing smart transportation for a city (environmental aspect); (3) potential of VR in data management and planning of the cities (economical and physical aspects); and, finally, (4) the potential of VR in visualizing the cognitive behavior of urban dwellers (socio-cultural aspects).
3. Using VR in Designing/Planning Smarter Cities
3.1. Potential of VR in Visualizing Pedestrian Thermal Comfort in Cities
An example of VR urban models was created for an environmental planning study for a future development in Melbourne. The study examined the thermal consequence of implementing “Plan Melbourne” at the pedestrian level at a neighborhood scale [21].
In May 2014, “Plan Melbourne” was launched by the Victorian government to outline the vision for the growth of Melbourne until the year 2050. The draft of the municipal strategic statement of the City of Melbourne identified “City North” as a great urban renewal area that could accommodate a significant part of the growth. Structural plans provided guidance to the community, planners, businesses, government, and developers about the appropriate directions and opportunities for future changes in City North. This area would be developed according to the structural plans to provide a diverse mix of uses associated with denser urban environments.
Proposing a street hierarchy, increasing building heights, expanding urban forests by increasing tree canopy coverage, implementing green roofs, and overall transition from a low-rise to a medium-rise urban area were some of the strategies presented in the structural plans. The effects of future structural plans presented in “Plan Melbourne” on the microclimate and pedestrian thermal comfort in City North were modeled in three different stages using a 3D microclimatic modeling tool, namely, ENVI-met (Version 3.1).
The outcomes of this study contribute to the understanding of how altering urban morphology and landscape can modify the interaction among individual elements in a built environment, microclimatic processes, and human-energy balance across urban developments within the Melbourne metropolitan region. This study also helps urban planners develop policies that will include urban climatic considerations in future planning schemes. These climatic considerations can improve the climate of Melbourne and avoid adverse consequences on public health arising from future development and renewal projects.
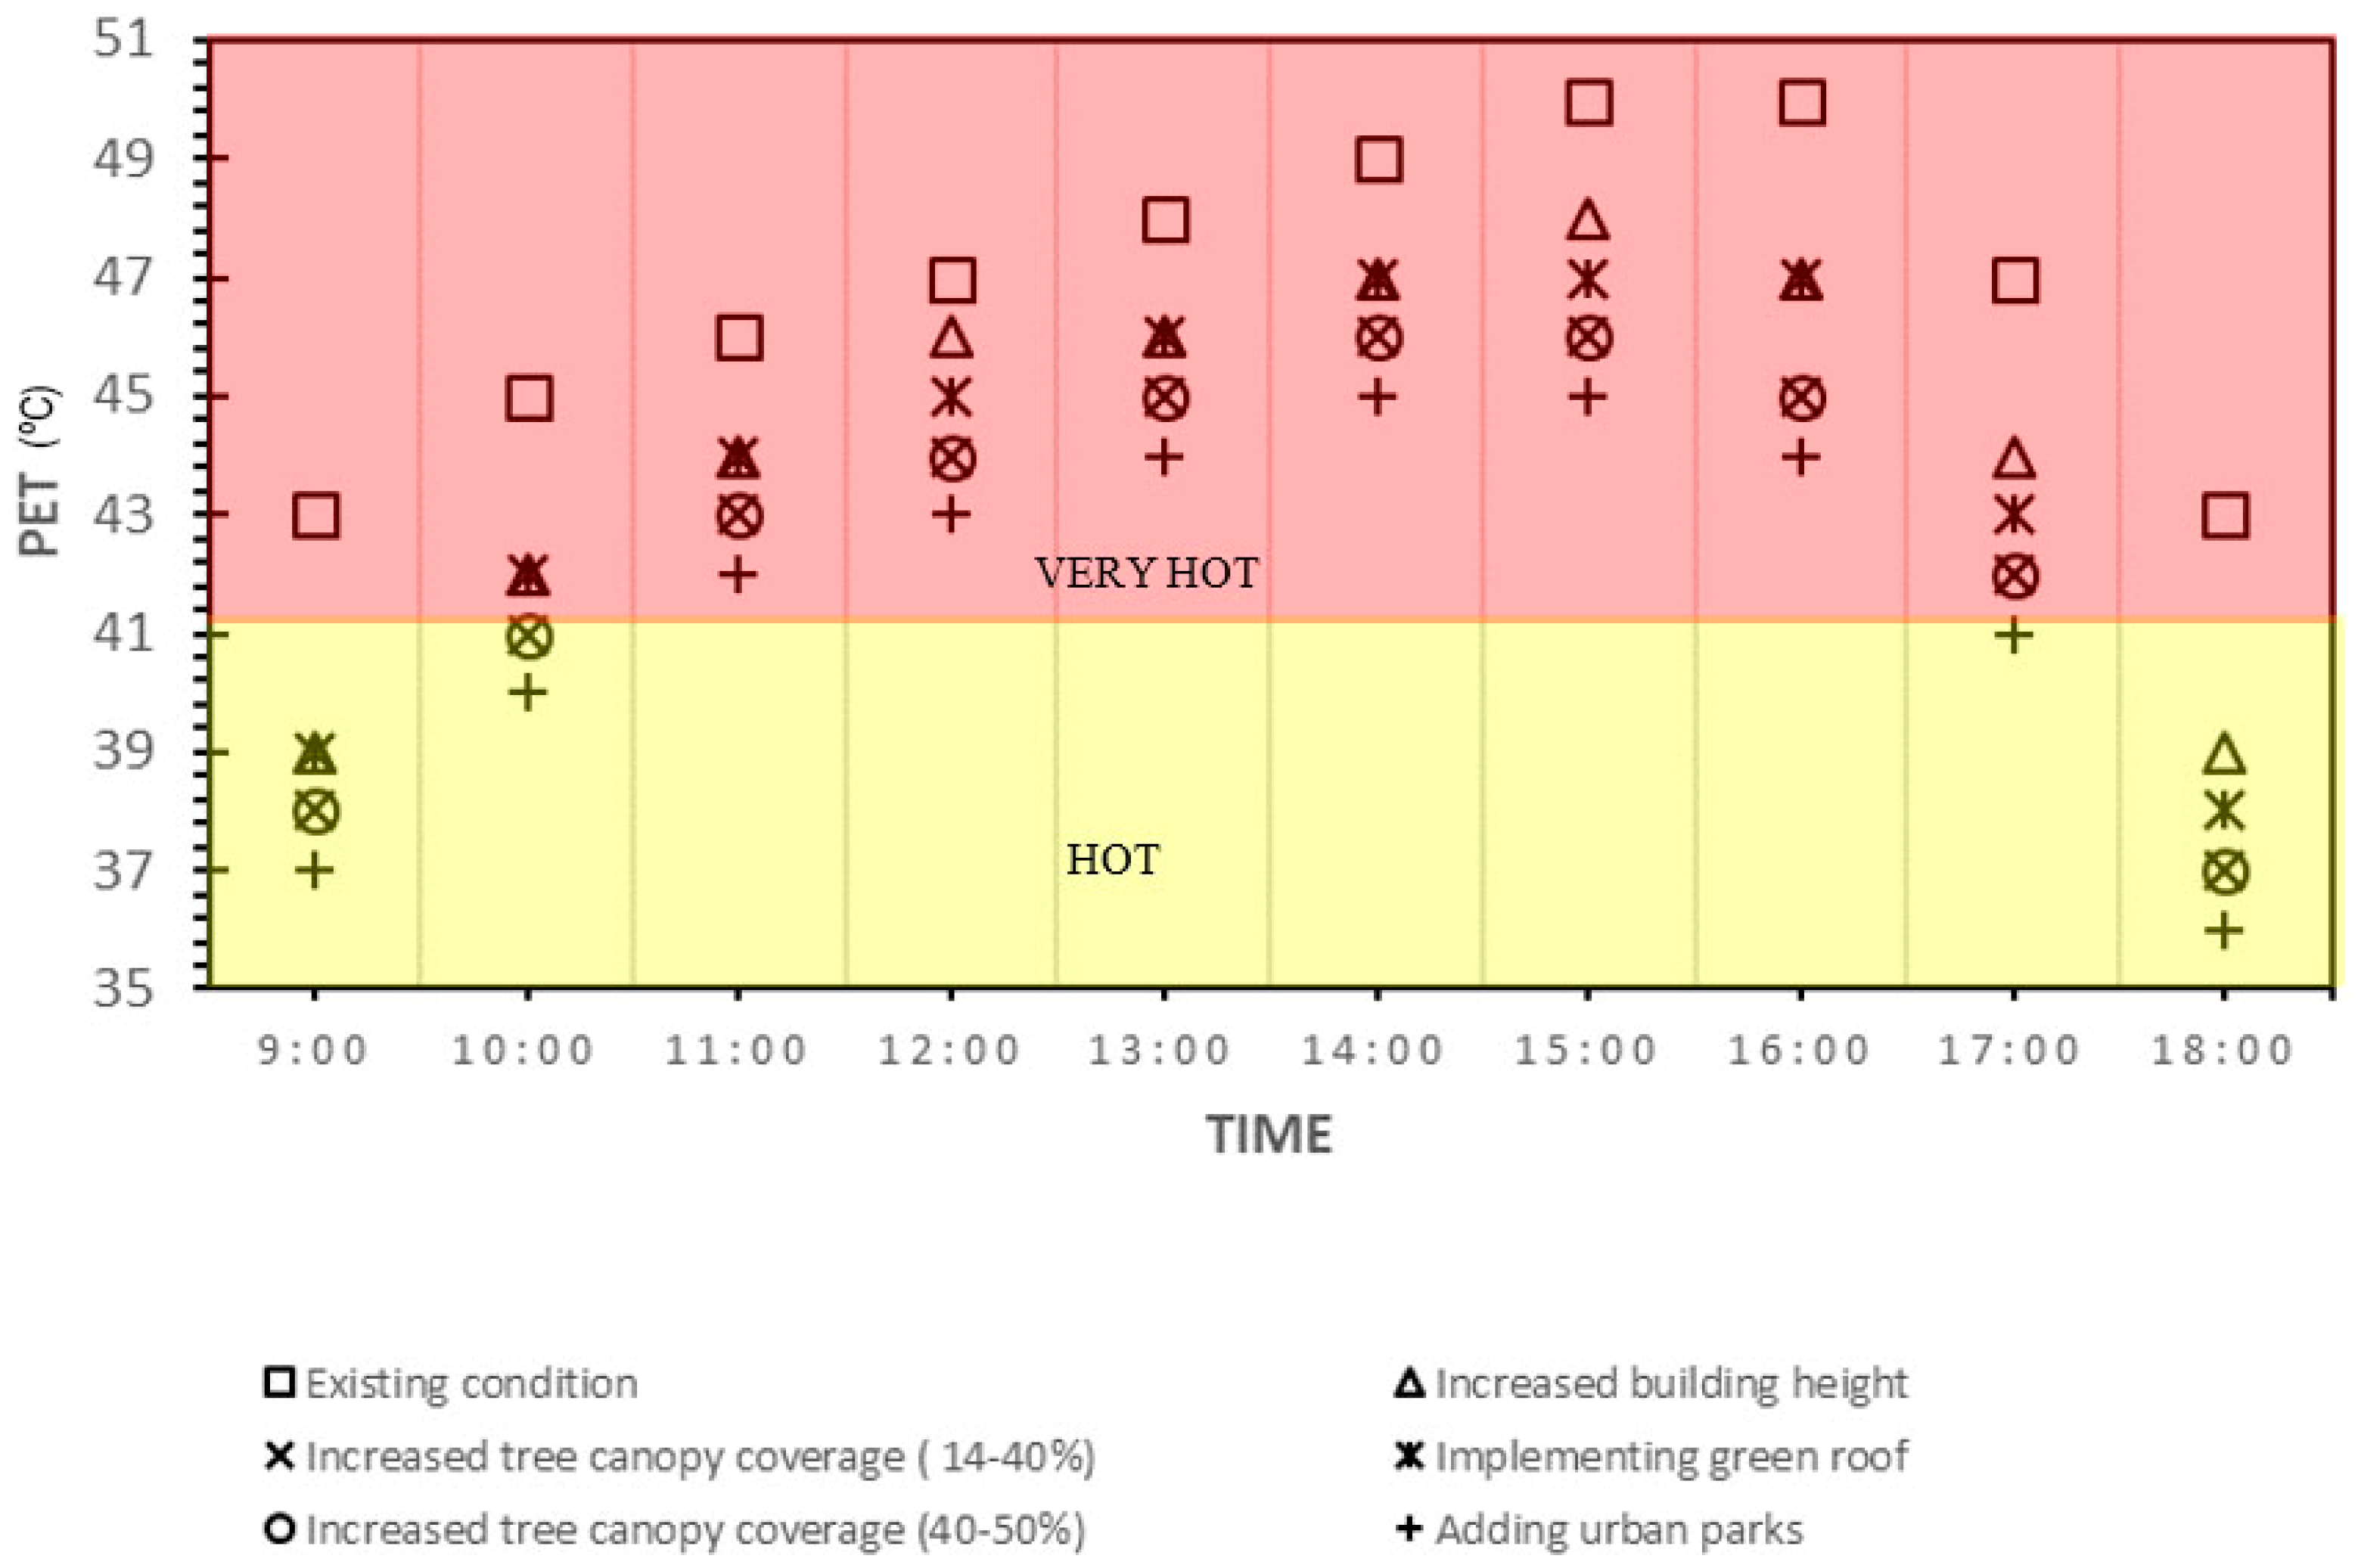
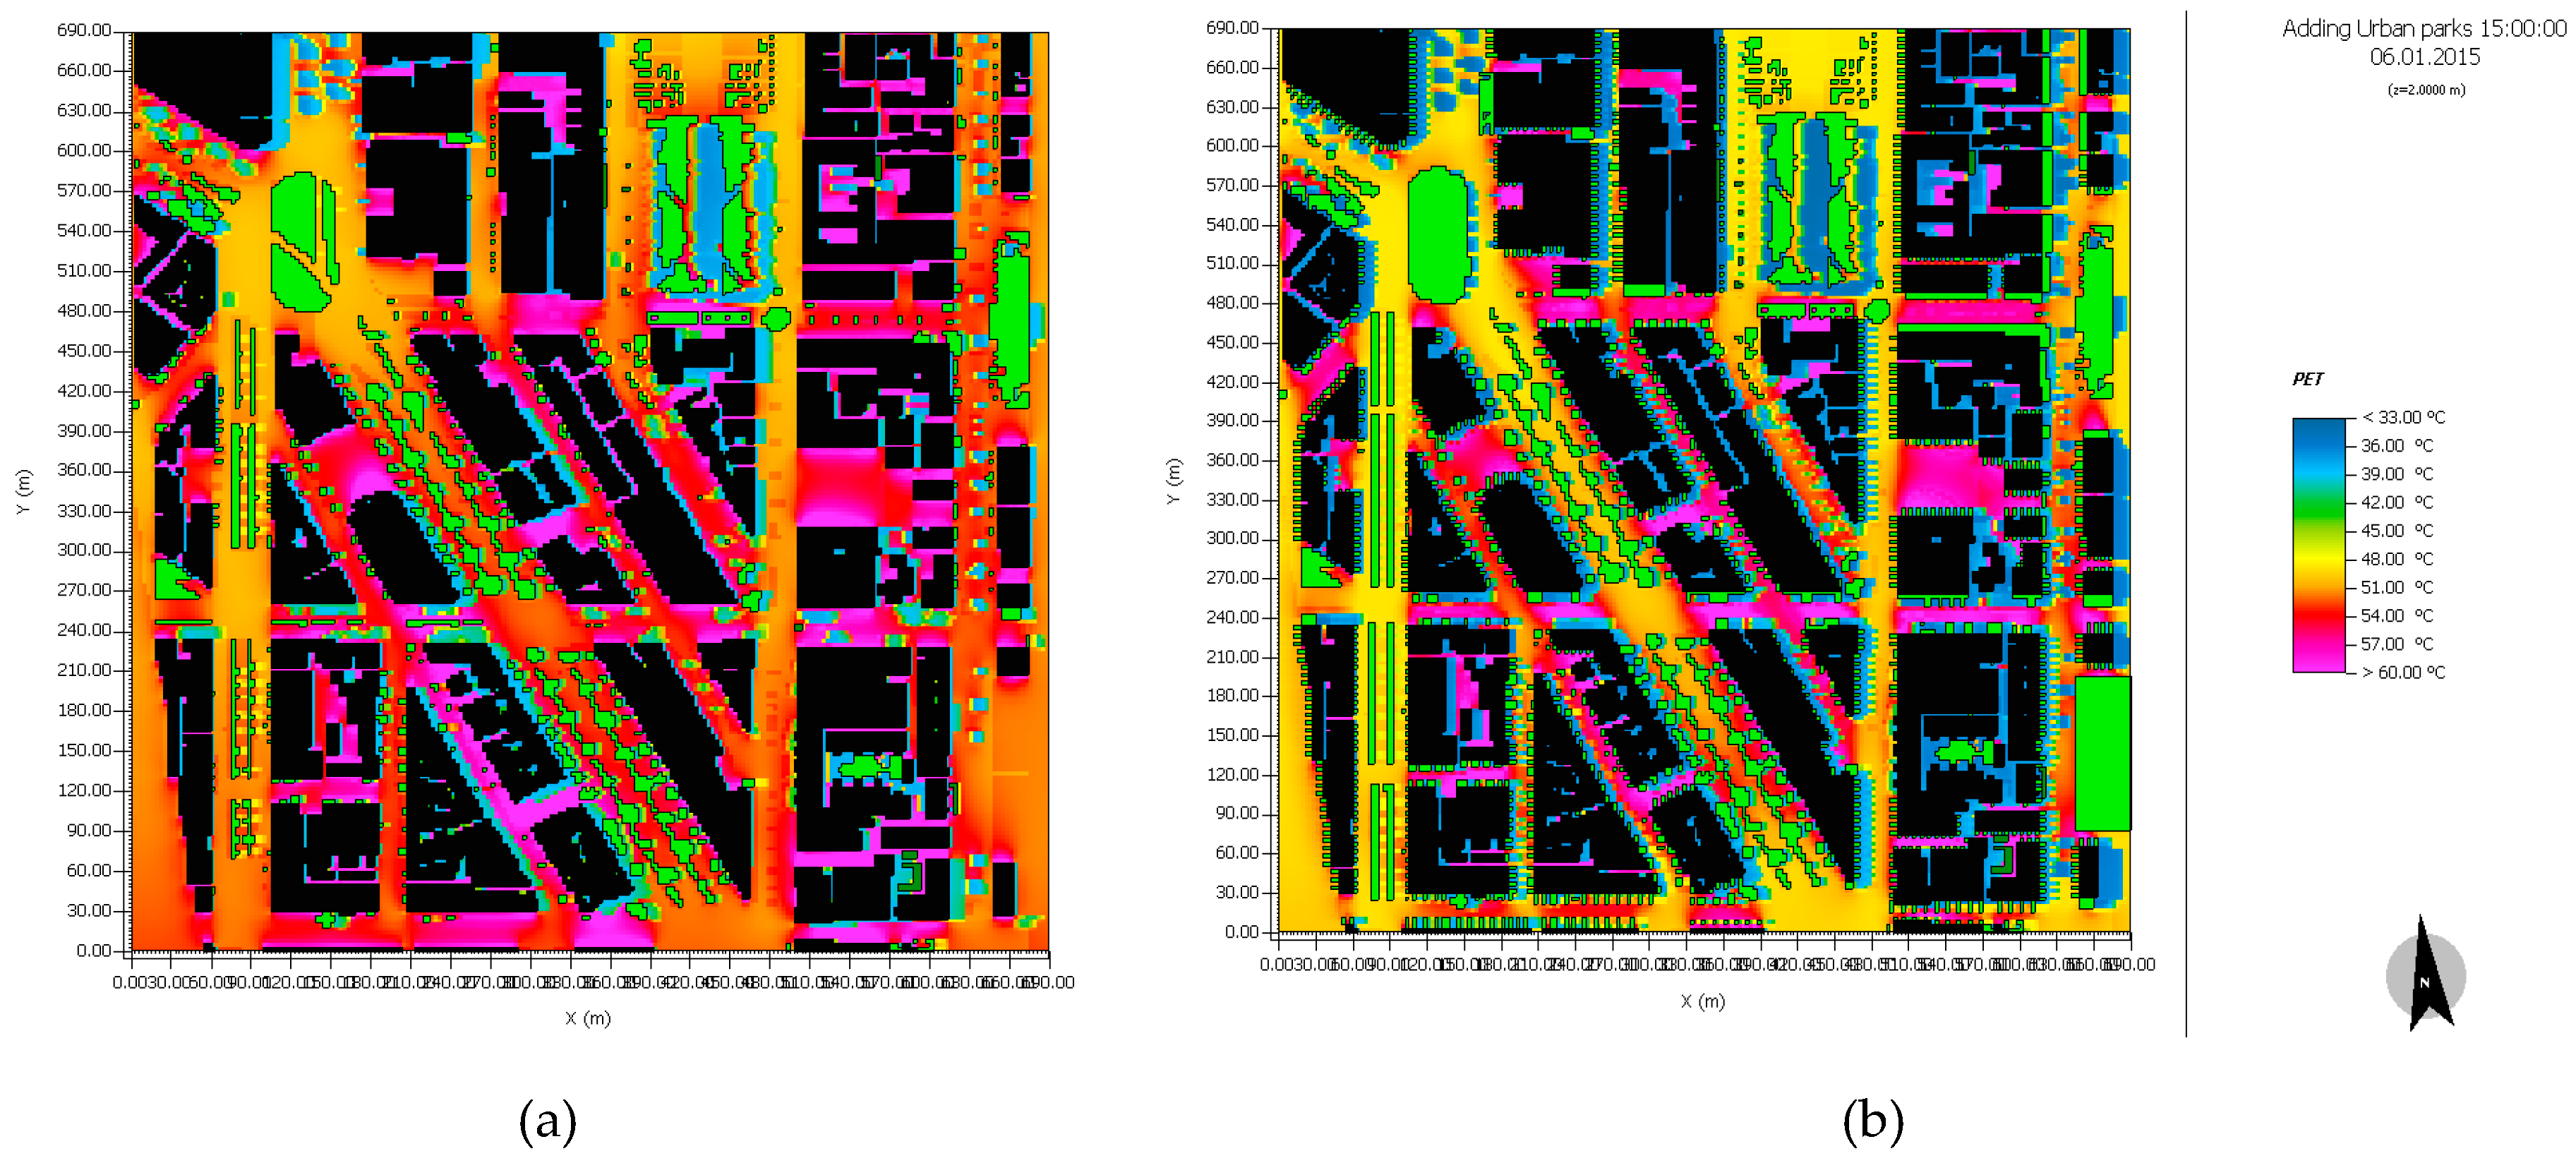
As shown in Figure 6 and Figure 7, implementing “Plan Melbourne” strategies will slightly improve thermal comfort at the pedestrian level. The spatial distribution of PET is shown for the existing (2015) and future (2050) scenarios in Figure 7.
The final outcomes of the study can lead to urban planning recommendations for municipalities and urban planners. This work demonstrates that establishing a continuous dialogue between urban planners and researchers can address changes and adapt to interventions in urban planning recommendations. Developing adaptation and mitigation actions to improve the quality and livability of urban spaces and human thermal comfort within them will only be possible by increasing interaction and cooperation between municipal actors and researchers. The outcomes obtained in this work demonstrate a need for communication among municipal decision-makers, academic researchers, and communities, particularly during early urban design phases.
Visualizing the outcome of this study by using VR will not only result in an increased level of awareness among stakeholders, urban planners, and community developers on the impacts of their decision-making, but will also develop high trust among different parties. For example, in this specific case study, data visualization via VR and the addition of thermal sensors to the final outcome would help communities further understand the impact of “Plan Melbourne” on the environment of their cities, and the findings would not always remain as raw materials on papers. Communities will feel highly engaged in the policy-making process, and lost trust on city councils and state governments will return among communities. Furthermore, planners and stakeholders will have a clear vision on the environmental, social, and economic benefits of every “what-if” scenario, which in turn, will lead to the creation of not only a smart city (integration with IT and ICT), but also a sustainable and resilient city wherein a triple bottom line is completely respected.
3.2. Potential of VR in Visualizing Smart Transportation for a City
Traffic and effective transportation are important topics in smart sustainable cities. There are different methods to collect the traffic and transport data, such as smartcards used mainly in smart public transportation, car navigators, smart camera systems for traffic control, and smart pedestrian sensors. These technologies require data to effectively manage the transportation in urban environments. Data derived from GPSs, GIS-generated data, POI data, and space syntax data are the most important data sources for smart transportation systems.
Urban scholars employ different ranges of data sources and data analysis methods to understand and analyse the urban data and to better manage the traffic condition and thereby providing navigation, traffic control and recommendations for the traffic condition.
Some studies aim to investigate the perception rate and conduct analysis on the traffic condition in the urban environments. These studies often collect the data from the traffic conditions in different parts of the city, analyse the traffic behaviour statistics and create algorithms and planning frameworks.
Some studies used real-time traffic data that is generated via monitored urban data [22].
Other studies, which contributed to a significant improvement in the traffic control, focused on the identification of unique road sections [23], assessment of the commuting time between defined destinations [24], exploring the pattern of traffic condition in a city, and thereby assess and forecast the traffic patterns [25].
Other studies on the smart traffic systems for smart cities have focused on specific traffic services, such as GPS-oriented systems. A high-quality navigation system is often generated through a digital map in addition to a real-time traffic data and analyses [26]. Human movement is tracked using GPS, which optimizes the selected route by the driver [27].
Some studies analysed the behaviour and patterns of taxis and passenger’s movements and the connection which exists among them. For instance, in a study conducted by Li [28], the effectiveness of different passenger searching techniques for five thousands taxis was explored. In a similar study, the methods to increase taxi driver incomes were evaluated by ameliorating the passenger search techniques [29].
One of the most important strategies in optimizing the public transportation system is the assessment of urban traffic data. In a study in London, the passenger congestion patterns was analysed and a technical solution was proposed to tackle the underground traffic issue [30]. In a similar study to effectively decrease the traffic load, a planning model for the ride-sharing system was proposed [31], using a historic passenger origin-destnation information.
One of the examples of implementing VR in smart cities is through real-time transportation systems and smart transportation corridors. This implementation consists of creating a linkage among all the neighborhoods, applying crime prevention strategies to design safer streets, constant supervision on the provision of high-quality, affordable, and accessible transportation systems, and finally decreasing the CO2 emissions via effective retrofication methods.
To address these objectives, virtual reality can help provide real-time data on traffic, pedestrian and parking conditions and diverse available transportation systems to reduce the traffic issues and the incidence of major accidents. VR can also help in visualizing future smart corridors which increase the efficiency of transportation systems. This visualization uses the traffic data and electronic street signs to warn the possibility of incidents and provides diverse detours options. In this regard, VR creates an enterprise data management ecosystem, which is a system that incorporates data to demonstrate a real-time image of traveling in a city (e.g., people movement and travelling pattern).
3.3. Potential of VR in Data Management
The data-centric smart city concept consists of the combination of data sources and computation techniques to identify and assess the diverse urban features and to better inform the future urban developments. One of the examples is the land use data. The urban areas often consist of different land uses, such as commercial, residential, industrial, and administrative uses. The challenge in planning smart cities with diverse or mixed land uses is that different land uses exist in even a small piece of land and defining the function of each land use is a challenging task.
Additionally, the function and land use of urban areas depend on the semantic features. However, it is a very challenging task to simultaneously measure these characteristics and retrieve the urban design characteristics from the dynamic urban data.
In some studies only residential and non-residential areas are explored [32]. In others [33], only residential, industrial, and administrative areas are distinguished. Finally, in studies conducted by [34], four areas—commercial, industrial, service, and residential—are identified and facilitate the data collection for smart city planning. However, none of the above-mentioned studies fulfil the demand of megacities. Therefore, it is important to use finer scales in land use identification technologies and employ more innovative methods to address this challenge. The urban area is explored by division into residential, working, and other function areas in a study conducted by [35] and the diverse travelling systems and patterns were analysed via a linear combination between the coefficients, each presenting different characteristics of land use.
VR assists in several aspects of spatial information management and urban development, e.g., managing urbanization, three and four dimensional physical models, land use planning, spatial data infrastructure and, finally, web- and mobile-generated geographic information systems (GIS). VR can also effectively link the government to the society and enable planning professionals to take appropriate decisions during the approval process. For example, in managing urbanization, the database of a city model can be displayed in VR. The deletion of one element (e.g., tree, building, or pole) in an urban area will remove the icon from the visualization.
Another application of VR in relation to 3D/4D models involves visualizing these models before and after planning schemes. Large GIS data from multiple sources can be demonstrated in real-time through VR. Spatial data infrastructure, along with the environmental and visual impact assessments of building/tree shadows, precipitation, fog, air flow, and light, demonstrate the connection between the education centers and transport systems. The links among different transport corridors, future development scenarios, and the existing infrastructure can also be illustrated via VR.
3.4. Potential of VR in Visualizing the Cognitive Behavior of Urban Dwellers
The design and analysis of cognitive behavior of people in urban/public spaces often require a great contribution from a number of disciplines; such as architects, psychologists, IT specialists, and data analysts.
Citizen cognitive behavior is a study of people behavior via employing statistical analysis. This science aims to mix the data and information on pedestrian movement with urban design strategies and psychology to analyze and identify the human behavior and solve the urban issues. Nowadays, studies of human behavior using big data are becoming more on-demand, particularly with respect to the concept of smart, sustainable city design.
One of the data sources used to investigate the temporal-spatial pattern of human activities in public spaces is mobile phone data. Based on the data obtained from SMS records, it was found that human behavior follows a power law distribution with a power exponent between 1.2 and 1.7 [36]. In a similar study 1.5 million SMS records from 140 thousand users were analyzed to demonstrate that these records follow a two-mode distribution, starting with a power law distribution and ending with an exponential distribution [37].
The spatial features of human cognitive behavior and its movement were analyzed via mobile phone records obtained from 100,000 people and the findings showed that that the journey distance for each user is calculated using the power law with a caudal index [38]. In a similar study, the activity pattern and movement of human were assessed via analyzing the mobile records. The findings of this study showed that there is 93% chance to predict the spatial activity pattern and this percentage is independent from the selection of the case studies and each individual.
GPS data is another important urban data source that can be used to analyze the human behavior. In a study conducted in Sweden, the GPS data in four cities was analyzed to explore taxi passengers’ travel statistics and the findings showed that the travelling distance for each passenger is a variable of a two-mode power law distribution [39]. To predict the possibility of the locations where people check in through social networks urban GPS data was used in [40].
VR is one of the best tools for analyzing and simulating people’s interaction with their surrounding environments by connecting the urban design features of cities to the user behavior. VR acts as a complementary link among space syntax, navigation, and pedestrian cognitive behavior in urban areas.
The connection between pedestrian movement and syntactic representation has a cognitive meaning [41]. Several studies have supported this hypothesis on real-world navigation via eye-tracking data. The cognitive behavior in an urban environment is also believed to be contributed to the mental representations and symbolic icons in the urban environment [42,43]. In a study conducted by Turner, the syntactic representation of numerous urban streets was simulated, and it was found that the users prefer continuous paths for walking [44].
VR creates a link between theoretical and practical frameworks by employing the cognitive psychology in architectural design, as well as urban design. VR can be also used as the basis for the cognitive movement in cities. In a study conducted by Ozbil, the extent to which street network configuration is associated with path selection by pedestrians was evaluated. The findings of this study showed that spatial configuration has a strong impact on pedestrian route choices. The study also proposed the optimal street design, pedestrian walkway, landscape design and preferred spots for the urban infrastructures [45]. In another study, several types of visibility patterns during random walks were investigated. The study showed a strong link between local and global visibility properties during a random walk, which is a main component for designing smart, sustainable public spaces and street networks [46].
One of the major challenges in the studies related to the cognitive behavior and urban design is the translation of research findings into design interventions. This gap can be filled by conducting a direct analysis of user experience. In the past, this problem was solved only through observation and the use of mobile technologies, such as eye tracking and recording of biometric data. At present, the rapid advances in virtual world modeling allow the testing of urban design scenarios in a controlled setup.
4. Conclusions
The notion of smart cities has gained considerable traction in recent years as a vision for stimulating and supporting innovation and economic growth and for providing sustainable and efficient urban management and development. Significant aspects of the smart city concept are data visualization and forecasting. VR enables researchers to perform a real-time analysis of different “what-if” scenarios and helps governments, stakeholders, and communities to be aware of the environmental and social impacts of their decisions.
VR exerts tremendous impacts on the future of urban design, particularly smart city design. The use of Internet-based VR enhances public participation in planning and design. It also provides a platform for designers to contribute to a project regardless of their location.
This paper discusses the possible benefits of VR for efficiently visualizing smart city design and simulations. Important point includes the capability to be fully immersed into a VE that closely represents real-world environments using PBR materials. This feature allows natural interaction methods to rapidly access required data layers while navigating VEs, view previously obtained simulation data in real-time for specific periods, and access different camera views using custom shaders, such as thermal and infrared information.
Key benefits of using VR in designing smarter cities include the following:
- Capability to assess design ideas in real time and within a 3D space during the design and planning phase;
- Effective communication among different stakeholders, academics, planning professionals, and communities;
- Saving of a significant amount of time by excluding guesswork in design;
- Integration of all aspects in the design and, thus, achieving a resilient sustainable city design with the least amount of time/funds; and
- Promotion of participatory planning.
A key challenge in implementing VR in urban planning is cost. The use of VR has been limited to only private companies, high-end workstations, and educational institutions. The visualization and simulation of urban built environments require the extensive use of integrated software to include GIS, digital drawings (computer-aided designs), multimedia data, and World Wide Web-based VR techniques. Future works are necessary to determine how urban designers who work in small companies will benefit from VR systems in their urban design or planning practices.
Author Contributions
Elmira Jamei, Michael Mortimer, and Mehdi Seyedmahmoudian have contributed in developing the idea, and analysing the literature and the most recent technical methods in the application of VR in the context of smart city. Ben Horan and Alex Stojcevski have contributed to the theoretical approaches and analysing the relevant developed projects across industry and academia. All authors contributed jointly to prepare the final manuscript.
Conflicts of Interest
The authors declare no conflict of interest.
References
- Gartland, L.M. Heat Islands: Understanding and Mitigating Heat in Urban Areas; Routledge: Oxford, UK, 2012. [Google Scholar]
- Stewart, I.; Oke, T. Classifying urban climate field sites by “local climate zones”: The case of Nagano, Japan. In Proceedings of the Seventh International Conference on Urban Climate, Yokohama, Japan, 29 June–3 July 2009; Volume 29. [Google Scholar]
- Johansson, E.; Emmanuel, R. The influence of urban design on outdoor thermal comfort in the hot, humid city of Colombo, Sri Lanka. Int. J. Biometeorol. 2006, 51, 119–133. [Google Scholar] [CrossRef] [PubMed]
- Bibri, S.E.; Krogstie, J. Smart sustainable cities of the future: An extensive interdisciplinary literature review. Sustain. Cities Soc. 2017, 31, 183–212. [Google Scholar] [CrossRef]
- Yin, C.; Xiong, Z.; Chen, H.; Wang, J.; Cooper, D.; David, B. A literature survey on smart cities. Sci. China Inf. Sci. 2015, 58, 1–18. [Google Scholar] [CrossRef]
- Shahrokni, H.; Årman, L.; Lazarevic, D.; Nilsson, A.; Brandt, N. Implementing smart urban metabolism in the Stockholm Royal Seaport: Smart city SRS. J. Ind. Ecol. 2015, 19, 917–929. [Google Scholar] [CrossRef]
- Kramers, A.; Höjer, M.; Lövehagen, N.; Wangel, J. Smart sustainable cities–Exploring ICT solutions for reduced energy use in cities. Environ. Model. Softw. 2014, 56, 52–62. [Google Scholar] [CrossRef]
- Batty, M.; Axhausen, K.W.; Giannotti, F.; Pozdnoukhov, A.; Bazzani, A.; Wachowicz, M.; Portugali, Y. Smart cities of the future. Eur. Phys. J. Spec. Top. 2012, 214, 481–518. [Google Scholar] [CrossRef]
- Bibri, S.E.; Krogstie, J. On the social shaping dimensions of smart sustainable cities: A study in science, technology, and society. Sustain. Cities Soc. 2017, 29, 219–246. [Google Scholar] [CrossRef]
- Ewart, I.; Harty, C. Creating a Virtual Museum. Work. Pap. Commun. Cult. Netw. 2016, 7, 11–14. [Google Scholar]
- Sun, Q.; Wan, W.; Yu, X. The simulation of building escape system based on Unity3D. In Proceedings of the IEEE International Conference on Audio, Language and Image Processing (ICALIP), Shanghai, China, 11–12 July 2016; pp. 156–160. [Google Scholar]
- Mantho, R. The Urban Section: An Analytical Tool for Cities and Streets; Routledge: Oxford, UK, 2014. [Google Scholar]
- Lv, Z.; Yin, T.; Han, Y.; Chen, Y.; Chen, G. WebVR—Web virtual reality engine based on P2P network. J. Netw. 2011, 6, 990–998. [Google Scholar] [CrossRef]
- Vakali, A.; Anthopoulos, L.; Krco, S. Smart Cities Data Streams Integration: Experimenting with Internet of Things and social data flows. In Proceedings of the 4th International Conference on Web Intelligence, Mining and Semantics (WIMS14), Thessaloniki, Greece, 2–4 June 2014; p. 60. [Google Scholar]
- Villanueva, F.J.; Aguirre, C.; Villa, D.; Santofimia, M.J.; López, J.C. Smart City data stream visualization using Glyphs. In Proceedings of the IEEE Eighth International Conference on Innovative Mobile and Internet Services in Ubiquitous Computing (IMIS), Birmingham, UK, 2–4 July 2014; pp. 399–403. [Google Scholar]
- Hudson-Smith, A.; Dodge, M.; Doyle, S. Visual Communication in Urban Planning and Urban Design; Centre for Advanced Spatial Analysis (CASA): London, UK, 1998. [Google Scholar]
- Braem, B.; Latre, S.; Leroux, P.; Demeester, P.; Coenen, T.; Ballon, P. Designing a smart city playground: Real-time air quality measurements and visualization in the City of Things testbed. In Proceedings of the IEEE International Smart Cities Conference (ISC2), Trento, Italy, 12–15 September 2016; pp. 1–2. [Google Scholar]
- Algeciras, J.A.R.; Consuegra, L.G.; Matzarakis, A. Spatial-temporal study on the effects of urban street configurations on human thermal comfort in the world heritage city of Camagüey-Cuba. Build. Environ. 2016, 101, 85–101. [Google Scholar] [CrossRef]
- Karis, B. Real Shading in Unreal Engine 4, Part of ACM SIGGRAPH 2013 Courses. 2013. Available online: https://cdn2.unrealengine.com/Resources/files/2013SiggraphPresentationsNotes-26915738.pdf (accessed on 4 September 2013).
- Xu, Z.; Lu, X.; Guan, H.; Han, B.; Ren, A. Seismic damage simulation in urban areas based on a high-fidelity structural model and a physics engine. Nat. Hazards 2014, 71, 1679–1693. [Google Scholar] [CrossRef]
- Jamei, E.; Rajagopalan, P. Urban development and pedestrian thermal comfort in Melbourne. Sol. Energy 2017, 144, 681–698. [Google Scholar] [CrossRef]
- Gühnemann, A.; Schäfer, R.-P.; Thiessenhusen, K.-U.; Wagner, P. Monitoring Traffic and Emissions by Floating Car Data; Working Paper; ARRB Group Limited: Melbourne, Australia, 2004. [Google Scholar]
- Kanoulas, E.; Du, Y.; Xia, T.; Zhang, D. Finding fastest paths on a road network with speed patterns. In Proceedings of the IEEE 22nd International Conference on Data Engineering, Atlanta, GA, USA, 3–7 April 2006; p. 10. [Google Scholar]
- Pfoser, D.; Brakatsoulas, S.; Brosch, P.; Umlauft, M.; Tryfona, N.; Tsironis, G. Dynamic travel time provision for road networks. In Proceedings of the 16th ACM SIGSPATIAL International Conference on Advances in Geographic Information Systems, Irvine, CA, USA, 5–7 November 2008; p. 68. [Google Scholar]
- Castro, P.; Zhang, D.; Li, S. Urban traffic modelling and prediction using large scale taxi GPS traces. In Proceedings of the 10th International Conference Pervasive Computing, Newcastle, UK, 18–22 June 2012; pp. 57–72. [Google Scholar]
- Gonzalez, H.; Han, J.; Li, X.; Myslinska, M.; Sondag, J.P. Adaptive fastest path computation on a road network: A traffic mining approach. In Proceedings of the 33rd International Conference on Very Large Data Bases, Vienna, Austria, 23–27 September 2007; pp. 794–805. [Google Scholar]
- Ziebart, B.D.; Maas, A.L.; Dey, A.K.; Bagnell, J.A. Navigate like a cabbie: Probabilistic reasoning from observed context-aware behavior. In Proceedings of the ACM 10th International Conference on Ubiquitous Computing, Seoul, Korea, 21–24 September 2008; pp. 322–331. [Google Scholar]
- Li, B.; Zhang, D.; Sun, L.; Chen, C.; Li, S.; Qi, G.; Yang, Q. Hunting or waiting? Discovering passenger-finding strategies from a large-scale real-world taxi dataset. In Proceedings of the IEEE International Conference on Pervasive Computing and Communications Workshops (PERCOM Workshops), Seattle, WA, USA, 21–25 March 2011; pp. 63–68. [Google Scholar]
- Sun, L.; Zhang, D.; Chen, C.; Castro, P.S.; Li, S.; Wang, Z. Real time anomalous trajectory detection and analysis. Mob. Netw. Appl. 2013, 18, 341–356. [Google Scholar] [CrossRef]
- Ceapa, I.; Smith, C.; Capra, L. Avoiding the crowds: Understanding tube station congestion patterns from trip data. In Proceedings of the ACM SIGKDD International Workshop on Urban Computing, Beijing, China, 12 August 2012; pp. 134–141. [Google Scholar]
- Yousaf, J.; Li, J.; Chen, L.; Tang, J.; Dai, X. Generalized multipath planning model for ride-sharing systems. Front. Comput. Sci. 2014, 8, 100–118. [Google Scholar] [CrossRef]
- Puissant, A.; Hirsch, J.; Weber, C. The utility of texture analysis to improve per-pixel classification for high to very high spatial resolution imagery. Int. J. Remote Sens. 2005, 26, 733–745. [Google Scholar] [CrossRef]
- Herold, M.; Liu, X.; Clarke, K.C. Spatial metrics and image texture for mapping urban land use. Photogramm. Eng. Remote Sens. 2003, 69, 991–1001. [Google Scholar] [CrossRef]
- Van de Voorde, T.; Jacquet, W.; Canters, F. Mapping form and function in urban areas: An approach based on urban metrics and continuous impervious surface data. Landsc. Urban Plan. 2011, 102, 143–155. [Google Scholar] [CrossRef]
- Peng, C.; Jin, X.; Wong, K.-C.; Shi, M.; Liò, P. Collective human mobility pattern from taxi trips in urban area. PLoS ONE 2012, 7, e34487. [Google Scholar] [CrossRef]
- Wei, H.; Xiao-Pu, H.; Tao, Z.; Bing-Hong, W. Heavy-tailed statistics in short-message communication. Chin. Phys. Lett. 2009, 26, 028902. [Google Scholar] [CrossRef]
- Wu, Y.; Zhou, C.; Xiao, J.; Kurths, J.; Schellnhuber, H.J. Evidence for a bimodal distribution in human communication. Proc. Natl. Acad. Sci. USA 2010, 107, 18803–18808. [Google Scholar] [CrossRef] [PubMed]
- Gonzalez, M.C.; Hidalgo, C.A.; Barabasi, A.-L. Understanding individual human mobility patterns. Nature 2008, 453, 779–782. [Google Scholar] [CrossRef] [PubMed]
- Liang, X.; Zheng, X.; Lv, W.; Zhu, T.; Xu, K. The scaling of human mobility by taxis is exponential. Phys. A Stat. Mech. Appl. 2012, 391, 2135–2144. [Google Scholar] [CrossRef]
- Li, R.-H.; Liu, J.; Yu, J.X.; Chen, H.; Kitagawa, H. Co-occurrence prediction in a large location-based social network. Front. Comput. Sci. 2013, 7, 185–194. [Google Scholar] [CrossRef]
- Dalton, R.C.; Hölscher, C.; Turner, A. Space syntax and spatial cognition. World Arch. 2005, 11, 41–45. [Google Scholar]
- Haq, S. Investigating the syntax line: Configurational properties and cognitive correlates. Environ. Plan. B Plan. Des. 2003, 30, 841–863. [Google Scholar] [CrossRef]
- Kim, Y.O.; Penn, A. Linking the spatial syntax of cognitive maps to the spatial syntax of the environment. Environ. Behav. 2004, 36, 483–504. [Google Scholar] [CrossRef]
- Dalton, A.T.N.; Turner, A. A Simplified Route Choice Model Using the Shortest Angular Path Assumption. In Proceedings of the 8th International Conference on GeoComputation, Ann Arbor, MI, USA, 31 July–3 August 2005. [Google Scholar]
- Ozbil, A.; Argin, G.; Yesiltepe, D. Pedestrian route choice by elementary school students: The role of street network configuration and pedestrian quality attributes in walking to school. Int. J. Des. Creat. Innov. 2016, 4, 67–84. [Google Scholar] [CrossRef]
- Natapov, A.; Czamanski, D.; Fisher-Gewirtzman, D. Visuospatial search in urban environment simulated by random walks. Int. J. Des. Creat. Innov. 2016, 4, 85–104. [Google Scholar] [CrossRef]
Figure 1.
Smart city initiative framework.

Figure 2.
Interactive CAD demo deployed within a four-wall CAVE located at the Center for Advanced Design in Engineering VR Lab, Deakin University.
Figure 2.
Interactive CAD demo deployed within a four-wall CAVE located at the Center for Advanced Design in Engineering VR Lab, Deakin University.

Figure 3.
Key dimensions of participatory planning [1].
Figure 3.
Key dimensions of participatory planning [1].

Figure 4.
Diagram of the proposed VR (virtual reality) participatory planning system.

Figure 5.
Normal (a), thermal (b), infrared (c), and night vision (d) shaders used in a virtual architecture scene in the Unity game engine, enable the users to visually switch among important physical information, such as heat and light in real-time.
Figure 5.
Normal (a), thermal (b), infrared (c), and night vision (d) shaders used in a virtual architecture scene in the Unity game engine, enable the users to visually switch among important physical information, such as heat and light in real-time.

Figure 6.
Thermal comfort (PET) condition in the existing, future, and proposed scenarios.

Figure 7.
Spatial distribution of thermal comfort (PET) across the study area in the existing (a) and proposed (b) scenarios.
Figure 7.
Spatial distribution of thermal comfort (PET) across the study area in the existing (a) and proposed (b) scenarios.

© 2017 by the authors. Licensee MDPI, Basel, Switzerland. This article is an open access article distributed under the terms and conditions of the Creative Commons Attribution (CC BY) license (http://creativecommons.org/licenses/by/4.0/).
Share and Cite
MDPI and ACS Style
Jamei, E.; Mortimer, M.; Seyedmahmoudian, M.; Horan, B.; Stojcevski, A. Investigating the Role of Virtual Reality in Planning for Sustainable Smart Cities. Sustainability 2017, 9, 2006. https://doi.org/10.3390/su9112006
AMA Style
Jamei E, Mortimer M, Seyedmahmoudian M, Horan B, Stojcevski A. Investigating the Role of Virtual Reality in Planning for Sustainable Smart Cities. Sustainability. 2017; 9(11):2006. https://doi.org/10.3390/su9112006
Chicago/Turabian StyleJamei, Elmira, Michael Mortimer, Mehdi Seyedmahmoudian, Ben Horan, and Alex Stojcevski. 2017. "Investigating the Role of Virtual Reality in Planning for Sustainable Smart Cities" Sustainability 9, no. 11: 2006. https://doi.org/10.3390/su9112006
Note that from the first issue of 2016, this journal uses article numbers instead of page numbers. See further details here.