A Hybrid Tool for Visual Pollution Assessment in Urban Environments
by
 , , and
Khydija Wakil
1,* ,
,
Malik Asghar Naeem
1,
Ghulam Abbas Anjum
2,
Abdul Waheed
1,
Muhammad Jamaluddin Thaheem
3,
Muhammad Qadeer ul Hussnain
1 and
Raheel Nawaz
4 1
Department of Urban & Regional Planning, National University of Science & Technology (NUST), Islamabad H-12, Pakistan
2
Department of City & Regional Planning, University of Engineering & Technology (UET), Lahore 54000, Pakistan
3
Department of Construction Engineering, National University of Science & Technology (NUST), Islamabad H-12, Pakistan
4
Department of Operations, Technology, Events and Hospitality Management, Manchester Metropolitan University, Manchester M13 9PL, UK
*
Author to whom correspondence should be addressed.
Sustainability 2019, 11(8), 2211; https://doi.org/10.3390/su11082211
Submission received: 3 January 2019
/
Revised: 23 February 2019
/
Accepted: 24 February 2019
/
Published: 12 April 2019
(This article belongs to the Special Issue Sustainable | Sustaining City Streets)
Abstract
:With increasing focus on more nuanced aspects of quality of life, the phenomenon of urban visual pollution has been progressively gaining attention from researchers and policy makers, especially in the developed world. However, the subjectivity and complexity of assessing visual pollution in urban settings remain a challenge, especially given the lack of robust and reliable methods for quantification of visual pollution. This paper presents a novel systematic approach for the development of a robust Visual Pollution Assessment (VPA) tool. A key feature of our methodology is explicit and systematic incorporation of expert and public opinion for listing and ranking Visual Pollution Objects (VPOs). Moreover, our methodology deploys established empirical complex decision-making techniques to address the challenge of subjectivity in weighting the impact of individual VPOs. The resultant VPA tool uses close-ended options to capture the presence and characteristics of various VPOs on a given node. Based on these inputs, it calculates a point based visual pollution scorecard for the observation point. The performance of the VPA tool has been extensively tested and verified at various locations in Pakistan. To the best of our knowledge, this is the first such tool, both in terms of quantitative robustness and broad coverage of VPOs. Our VPA tool will help regulators in assessing and charting visual pollution in a consistent and objective manner. It will also help policy makers by providing an empirical basis for gathering evidence; hence facilitating evidence-based and evidence-driven policy strategies, which are likely to have significant impact, especially in the developing countries.
1. Introduction to Visual Pollution
Recent decades have witnessed an exponential growth in urbanization demands, especially for improved governance in response to an ever-increasing urban complexity in a global and multi-level context [1]. In the developing countries, economic development, urban growth and dynamic economic transformation are accompanied by many other phenomena [2]. Usually, amenities are provided to the citizens without a well-managed plan of service provision; this results in the visual deterioration of the urban fabric. For example, marketing agencies install various kinds of outdoor advertisements particularly hoardings and billboards, which in the absence of strict enforcement policies, often emerge as eye-sores and visual blights [3]. Similarly, provision of other services without strong management result in solid waste dumps, cluttered hanging communication wires, encroachments, slums, bad road infrastructures, dilapidation of historical buildings, etc. Resultantly, urban life has come across as a disaster of aesthetic deterioration, transportation issues, air pollution, fumes, smog, and land and water pollution. However, in contrast to other types of pollutions, visual pollution has remained the most neglected aspect of urban life, both in policy and enforcement.
From the definitional evolution aspect, the term ‘visual pollution’ has been primarily recognized and researched in the mid of 20th century. Although earlier references to air and water pollution can still be found in the literature [4]. During the 19th century, recognition of types of pollution started from the laws on air and water pollution due to their harmful influences on the human environment. The era of the 1970s yielded a number of laws and treaties on ‘noise pollution’ that denotes the beginning of accepting other types of pollution. During the same period, the visual and light pollution was acknowledged in general, particularly in legal documents, and their management was mandated to local authorities, state agencies, and municipalities [4].
Parallel to that, since the 1960s, visual pollution has been discussed in the developed part of the world resulting in the emergence of different acts, rules and policies for the protection, preservation and enhancement of the urban visual environment [5]. A school of thought defined visual pollution as the type of pollution which offends human vision, spatial orientation, physical, mental health, or has psychological and economic effects on a community [6,7,8]. All those elements which a community finds unattractive, ugly, intrusive, disturbing come under visual pollution [9]. While, Nami et al and Jana describe visual pollution as “unbridled and uncoordinated diversity” of form, color, light, materials and accumulation of heterogeneous visual elements which make the manmade environment and urban landscape ugly and unattractive [3,7]. Chmielewski et al quote the term as compound and the resultant effect of “clutter, disorder and excess of various objects and graphics in urban landscape” [10]. Jūratė et al define visual pollution as “negative visual impact of Visual Pollution Object (VPO) on landscape” [11]. Additionally, the Supreme Court of the USA declared that “pollution is not limited to the air we breathe and the water we drink, it can equally offend the eye and ear” [12,13]. The scholars engaged in the visual impact assessments of natural landscapes have used the term visual pollution objects (VPOs) to refer to the physical components that have the ability to decrease the landscape’s visual quality, may contribute to diminish visual significance, or may obstruct the view of valuable natural complexes [11]. A similar analogy is valid for urban visual pollution. In an urban context, we define the term ‘VPOs’ to refer to all the manmade features along with their physical characteristics (placement, appearance, size, color, view and functional hindrance etc.) that affect the visual quality of urban surroundings from a human’s eye view.
Urban visual pollution is the negative physical condition of a number of objects which have a direct as well as an indirect relation with the quality of the built environment which ultimately has implications for humans living in that place [14,15,16,17,18]. It has been reported that visual pollution objects (together or individually) impact human health [19,20], distract drivers particularly along main highways [3,14,21,22], reduce property values, deface public places, spread annoyance, encourage needless consumption, or affect the identity of places [5,13,23]. It has been argued that better visual quality of a space has a relation to the safe and good behavior of residents and so as with better communities at a larger scale [24,25].
Furthermore, it is important to mention that the term visual pollution must not be confused with the concept of neighborhood disorder. As discussed earlier, visual pollution is the compound effect of disorder, excess of a number of physical elements while neighborhood disorder can be defined as “observed or perceived physical and social features of neighborhoods that may signal the breakdown of order and social control, and that can undermine the quality of life” [26]. The examples of neighborhood disorder may be adult loitering, drug dealing, crime, fighting in the streets and prostitution, and physical characteristics such as abandoned cars, dilapidated buildings, or litter in the streets [26,27]. Visual pollution is very much linked with the visual quality of public and community spaces [25] which includes regularity, order, beauty, symmetry, and simplicity, etc.
In previous studies, the subject of visual pollution has been explored from the dimensions of concept development, the listing of visual pollution objects and mitigation strategies [28]. However, the quantification and measurement have not been explored sufficiently. We have synthesized the previous work on the measurement of visual pollution and have provided a systematic approach to the development of a visual pollution assessment tool.
2. Approaches to Assessing Visual Pollution
Although visual pollution is recognized as a type of pollution, most of the city governments find it hard to regulate it since they do not have any systematic way of quantifying its presence and measuring its level of intensity vis-a-vis its local impacts [10]. Various scholars have used different techniques to measure visual pollution in their respective contexts, and at various scales ranging from a single street to a city. Table 1 presents a list of the relevant studies and highlights their respective scale, VPO coverage and methods.
The Challenges of Measuring Visual Pollution
It is evident from the literature review that the quantification of visual pollution at any point has always been challenging because of its subjective nature [28] and there doesn’t seem to exist any standard set of guidelines for systematic assessment of visual pollution [7]. This further highlights the need for the development of a unified quantitative assessment tool. Although, researchers all around the globe have contributed to the assessment of visual pollution, they have had a certain set of limitations which are discussed below:
Micro vs. Macro-level research: Previous studies on visual pollution can be broadly categorized into two extremes of micro and macro scale. Some of the previous studies have on a small case study area like a commercial street, public buildings in a residential area, or a neighborhood with maybe one or two VPOs (billboards, commercial signs). In contrast, other groups of researches adopted a bigger working scale like a city, with multiple VPOs. Consequently, two (somewhat opposite) strategies with narrow and broad classes of indicators are found in the literature to assess the visual pollution of any area.
Lack of quantification: Since visual pollution is intrinsically sensitive, subjective and a complex type of pollution, no specific tool or instrument is available to measure the scale of visual pollution at any node [29].
Dependency on subjective variables: Most of the available research has used a mix of subjective and objective indicators where the proportion of subjective indicators has been considerably high. Hence, the results can be potentially influenced either by the respondent or the researchers’ interpretation, expertise, interest and prevailing literature concepts. So, they may not be agreed upon or adopted in a different context.
Narrow coverage of VPOs: Visual pollution has a broad area of knowledge of built and aesthetic environments comprising multiple objects. However, most previous work has focused on the measurement of visual pollution by means of single VPOs, which has resulted in single-object assessment approaches.
The absence of structured tools: Unlike other types of pollution, structured instruments and tools are not available for the measurement of visual pollution. Moreover, in some cases a combination of different kinds of methodologies like public surveys [2,7], inter-visibility analysis, triangulation method, focus group discussions, photo comparisons [28,38], visual comparisons and experimentation, etc. [3] has been explored to assess a few (or often a single) VPO, which again indicates the need of a composite VPA tool. In most cases, statistical validity or reliability of the methods has not been assessed and discussed thoroughly.
From the above discussion, it is evident that there is a strong need to develop a comprehensive visual pollution assessment tool that can cover a wider variety of VPOs and can be used at various scales to calculate the visual pollution level at a certain point.
When it comes to subjective ranking and weighting, expert evaluation is preferred as they use their knowledge and experience for comparing objects or phenomena under study [39,40,41]. The relevant literature contains several weighing methods and techniques (e.g. Delphie method, ordering method [42,43,44]) that have experts evaluation at their core but possess respective pros and cons. In contrast, an Analytical Hierarchy Process (AHP) is considered comprehensive as it is a multi-criteria decision-making approach to deal with subjective and multiple conflicting criteria. The most prominent feature of the AHP method is the ability to compare both the quantitative and qualitative variables (verbal, graphics or numerical) on the same preference scale [45]. From the psychological point of view, it is also efficient and consistent to compare two alternatives at a time rather than comparing them all at once. It is based on a ratio scale instead of an interval scale unlike other methods [27,45,46,47]. The other advantages of using AHP include its ability to handle multi-fold subjects, higher consistency among choices and the ability to evaluate the composite and compound scores of alternatives [48].
3. Materials and Methods
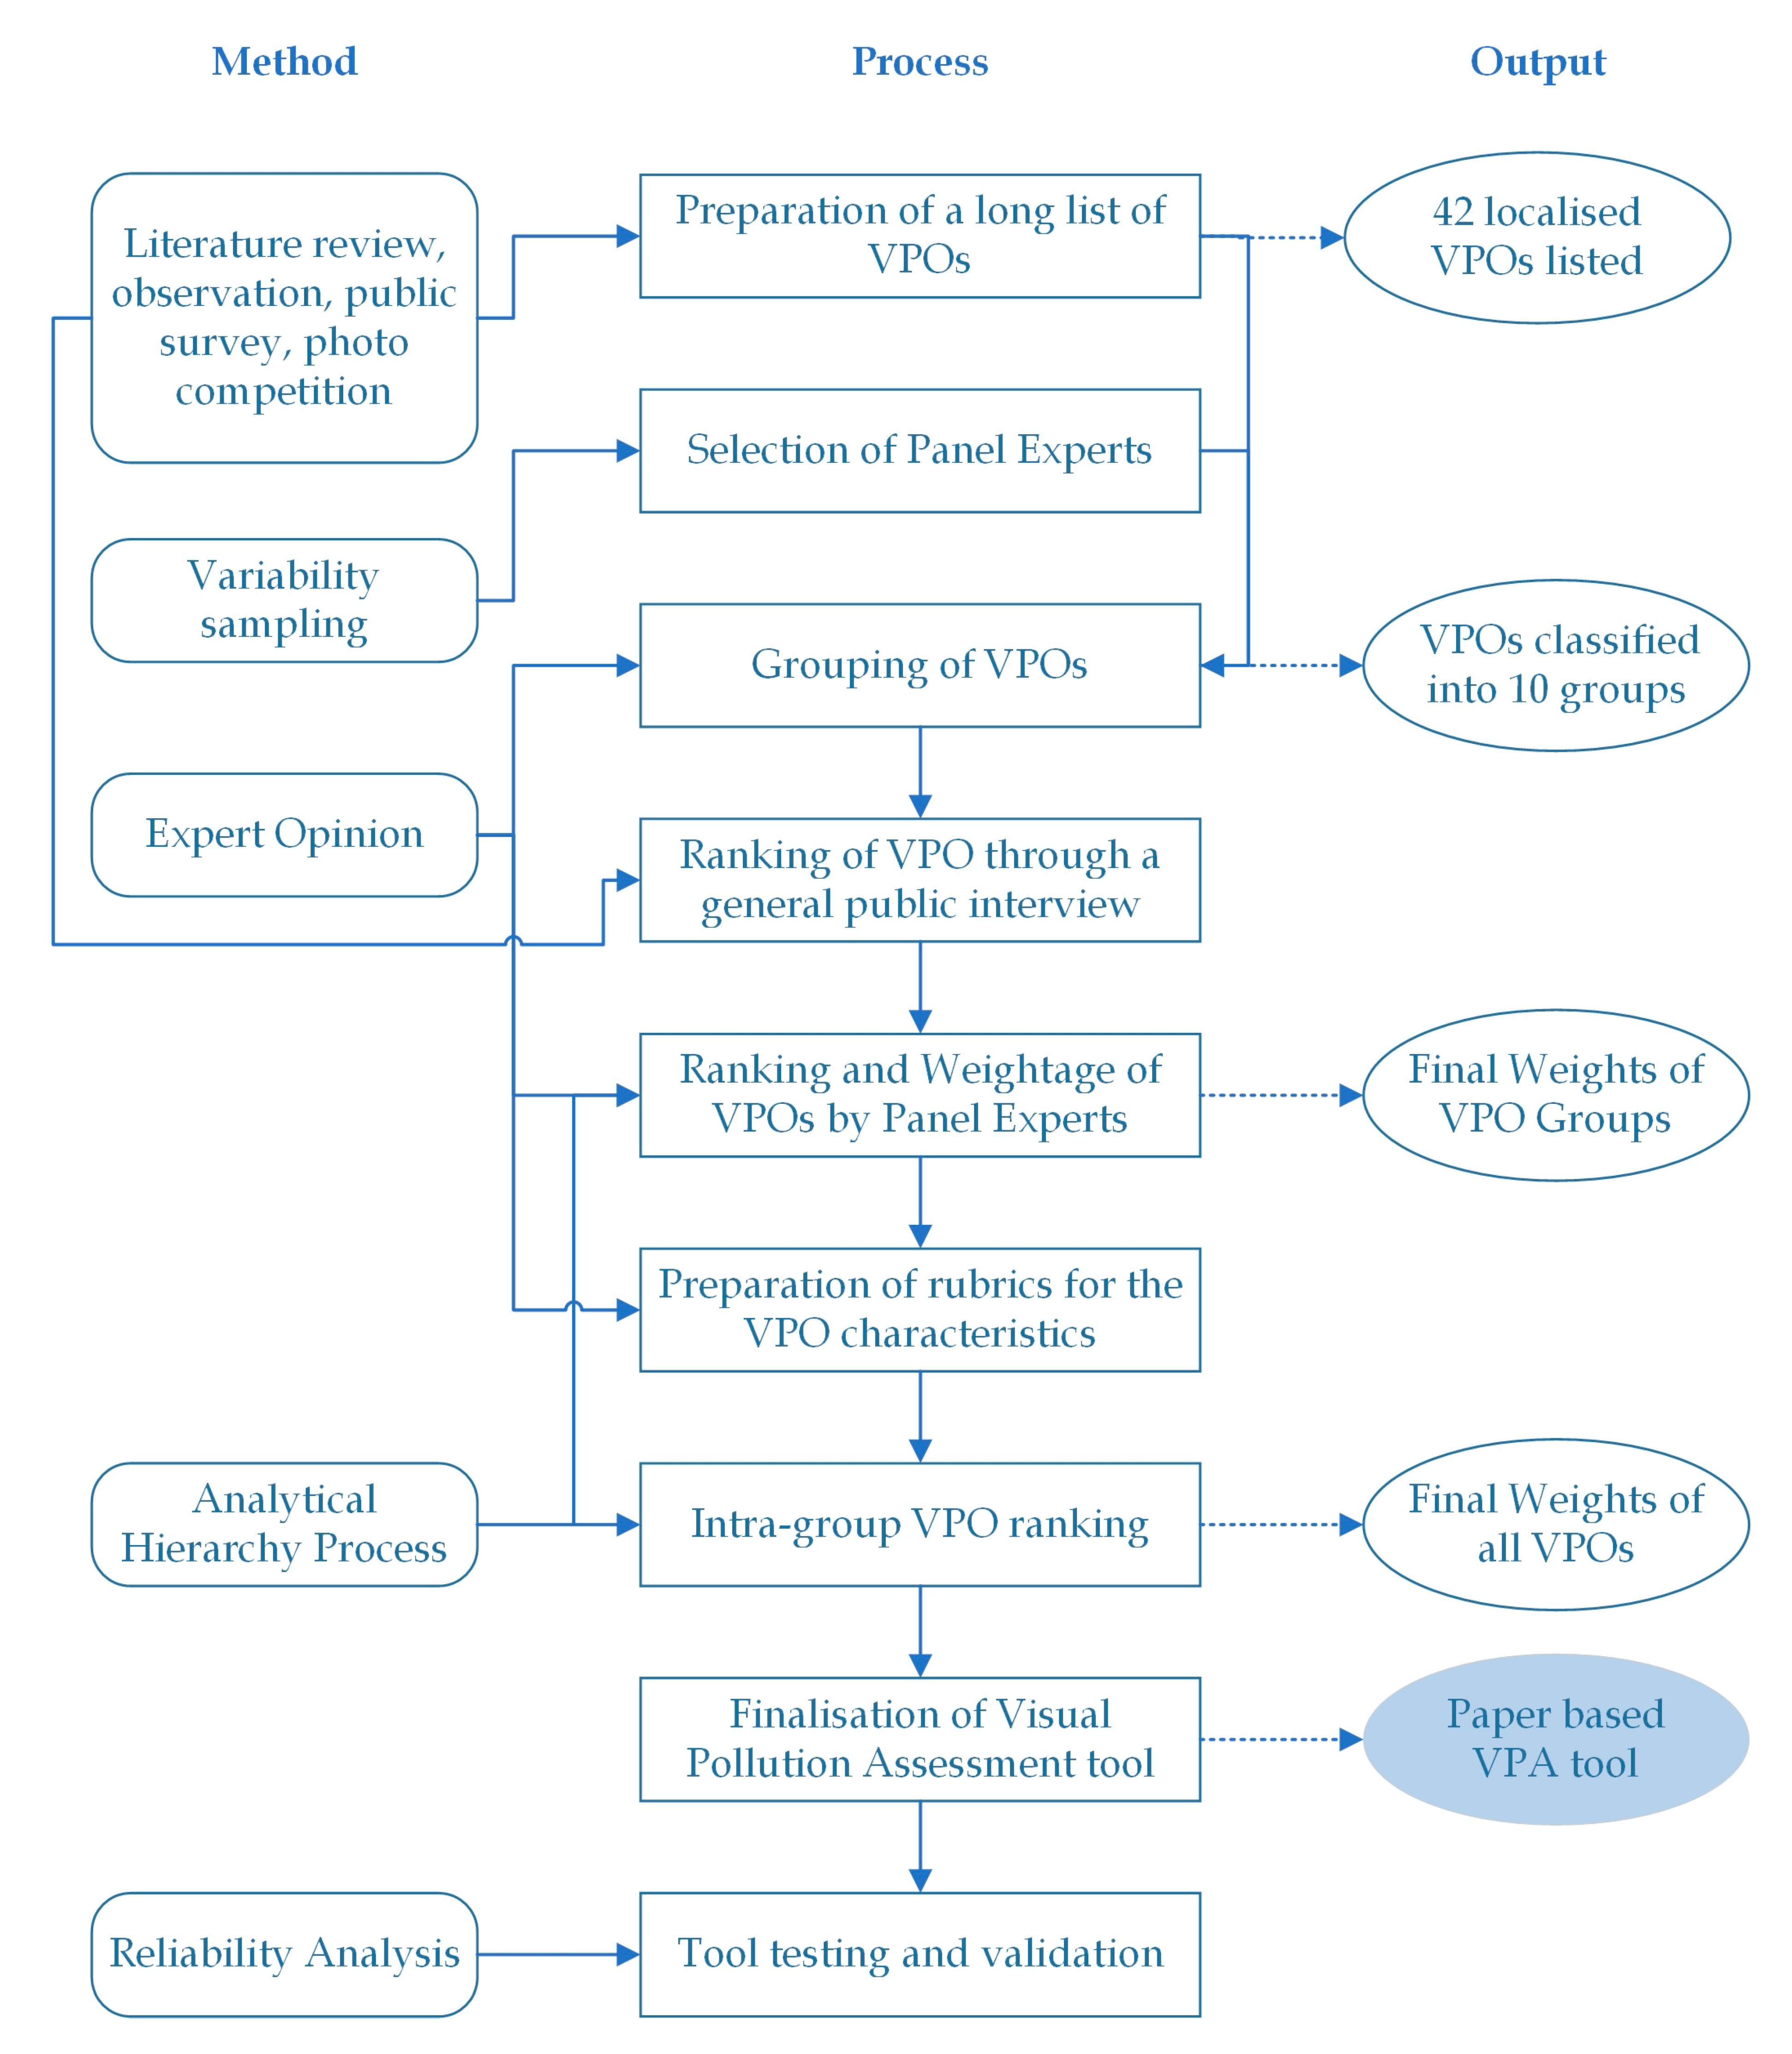
A pragmatic research design was adopted with several sequential and inter-linked steps to design the VPA tool, as summarized in Figure 1. It employs a combination of visuals, public opinion and observations to enlist visual pollution objects. These methods have been used in several studies to investigate public preferences [3,25,29,35,49,50,51,52]. A carefully selected panel of experts was engaged to group, rank and weight VPOs using AHP, which is a widely tested approach to handle subjectivity [30,48,53]. Furthermore, AHP findings have been arranged in the form of a VPA scorecard. To measure the reliability of the tool, it has been applied to locations with diverse land-uses, and inter-rater reliability of the tool has been calculated. Figure 1 explains the employed methods, adopted processes and obtained outputs that led to developing the final visual pollution assessment tool. Details of each stage are given below.
First, a list of VPOs has been prepared based on various sources including a literature review, personal observations, a public survey and a university-based photo competition. In literature, only a few VPOs have been frequently listed primarily including outdoor advertisements and billboards. However, through a public survey (available at https://goo.gl/forms/LjKobwAK9m1wUBZc2), 107 participants were asked as to what do they find visually annoying in their neighborhood or urban fabric around them. Similarly, a photo competition was arranged among the students of urban planning to identify and capture VPOs in their surroundings.
The second step included the determination of size for the panel of experts and their identification. Literature indicates that the size of an expert panel for AHP studies may vary from just a few people to large groups depending upon the nature of the problem and availability of experts. Generally, AHP does not need more interviews as results get stable after a few responses [54]. Furthermore, when the availability of experts is limited, many studies have presented their results with smaller panel sizes; n = 5 [55,56], n = 7 [57], n = 18 [58], and n = 25 [59]. In our case, a group of 20 professionals (with 10 or more years of experience) was selected to help on the grouping, ranking and weighting of various VPOs. By means of variability sampling, it was ensured that due representation was achieved from various stakeholders. Consequently, five members were selected from urban planning related academia, three from city district government, three from development authorities, two from cantonments of armed forces, five from private consultants on urban planning, and two civil society members having a history of expressing concern on urban planning matters. In addition to ensuring the thematic diversity of experts, they were selected from various cities of Pakistan representing a variety of cultural and urban contexts. This diversity was particularly helpful since they have been engaged to record their opinion based on their mental images in urban areas.
In the third step, the experts classified the listed VPOs into 10 groups considering the similarity of objects. For example, billboards, signboards, advertisement banners, poster and streamers have been clubbed into the group ‘outdoor advertisements’. Similarly, out-of-proportion building structures, irregular building facades and an uneven skyline have been grouped into ‘architecturally poor structures’. The key reason behind this classification was to reduce the number of VPO groups which can be compared to assigning ranks and weights based on their contribution to visual pollution on a site. It was not possible to handle the larger number of VPOs in AHP without this categorization. AHP was employed for the ranking and weighting of VPOs groups to remove subjectivity associated with the measurement of VPOs. AHP allows the decision maker to consider objective and subjective factors in assessing the relative importance of each VPO through a pairwise comparison.
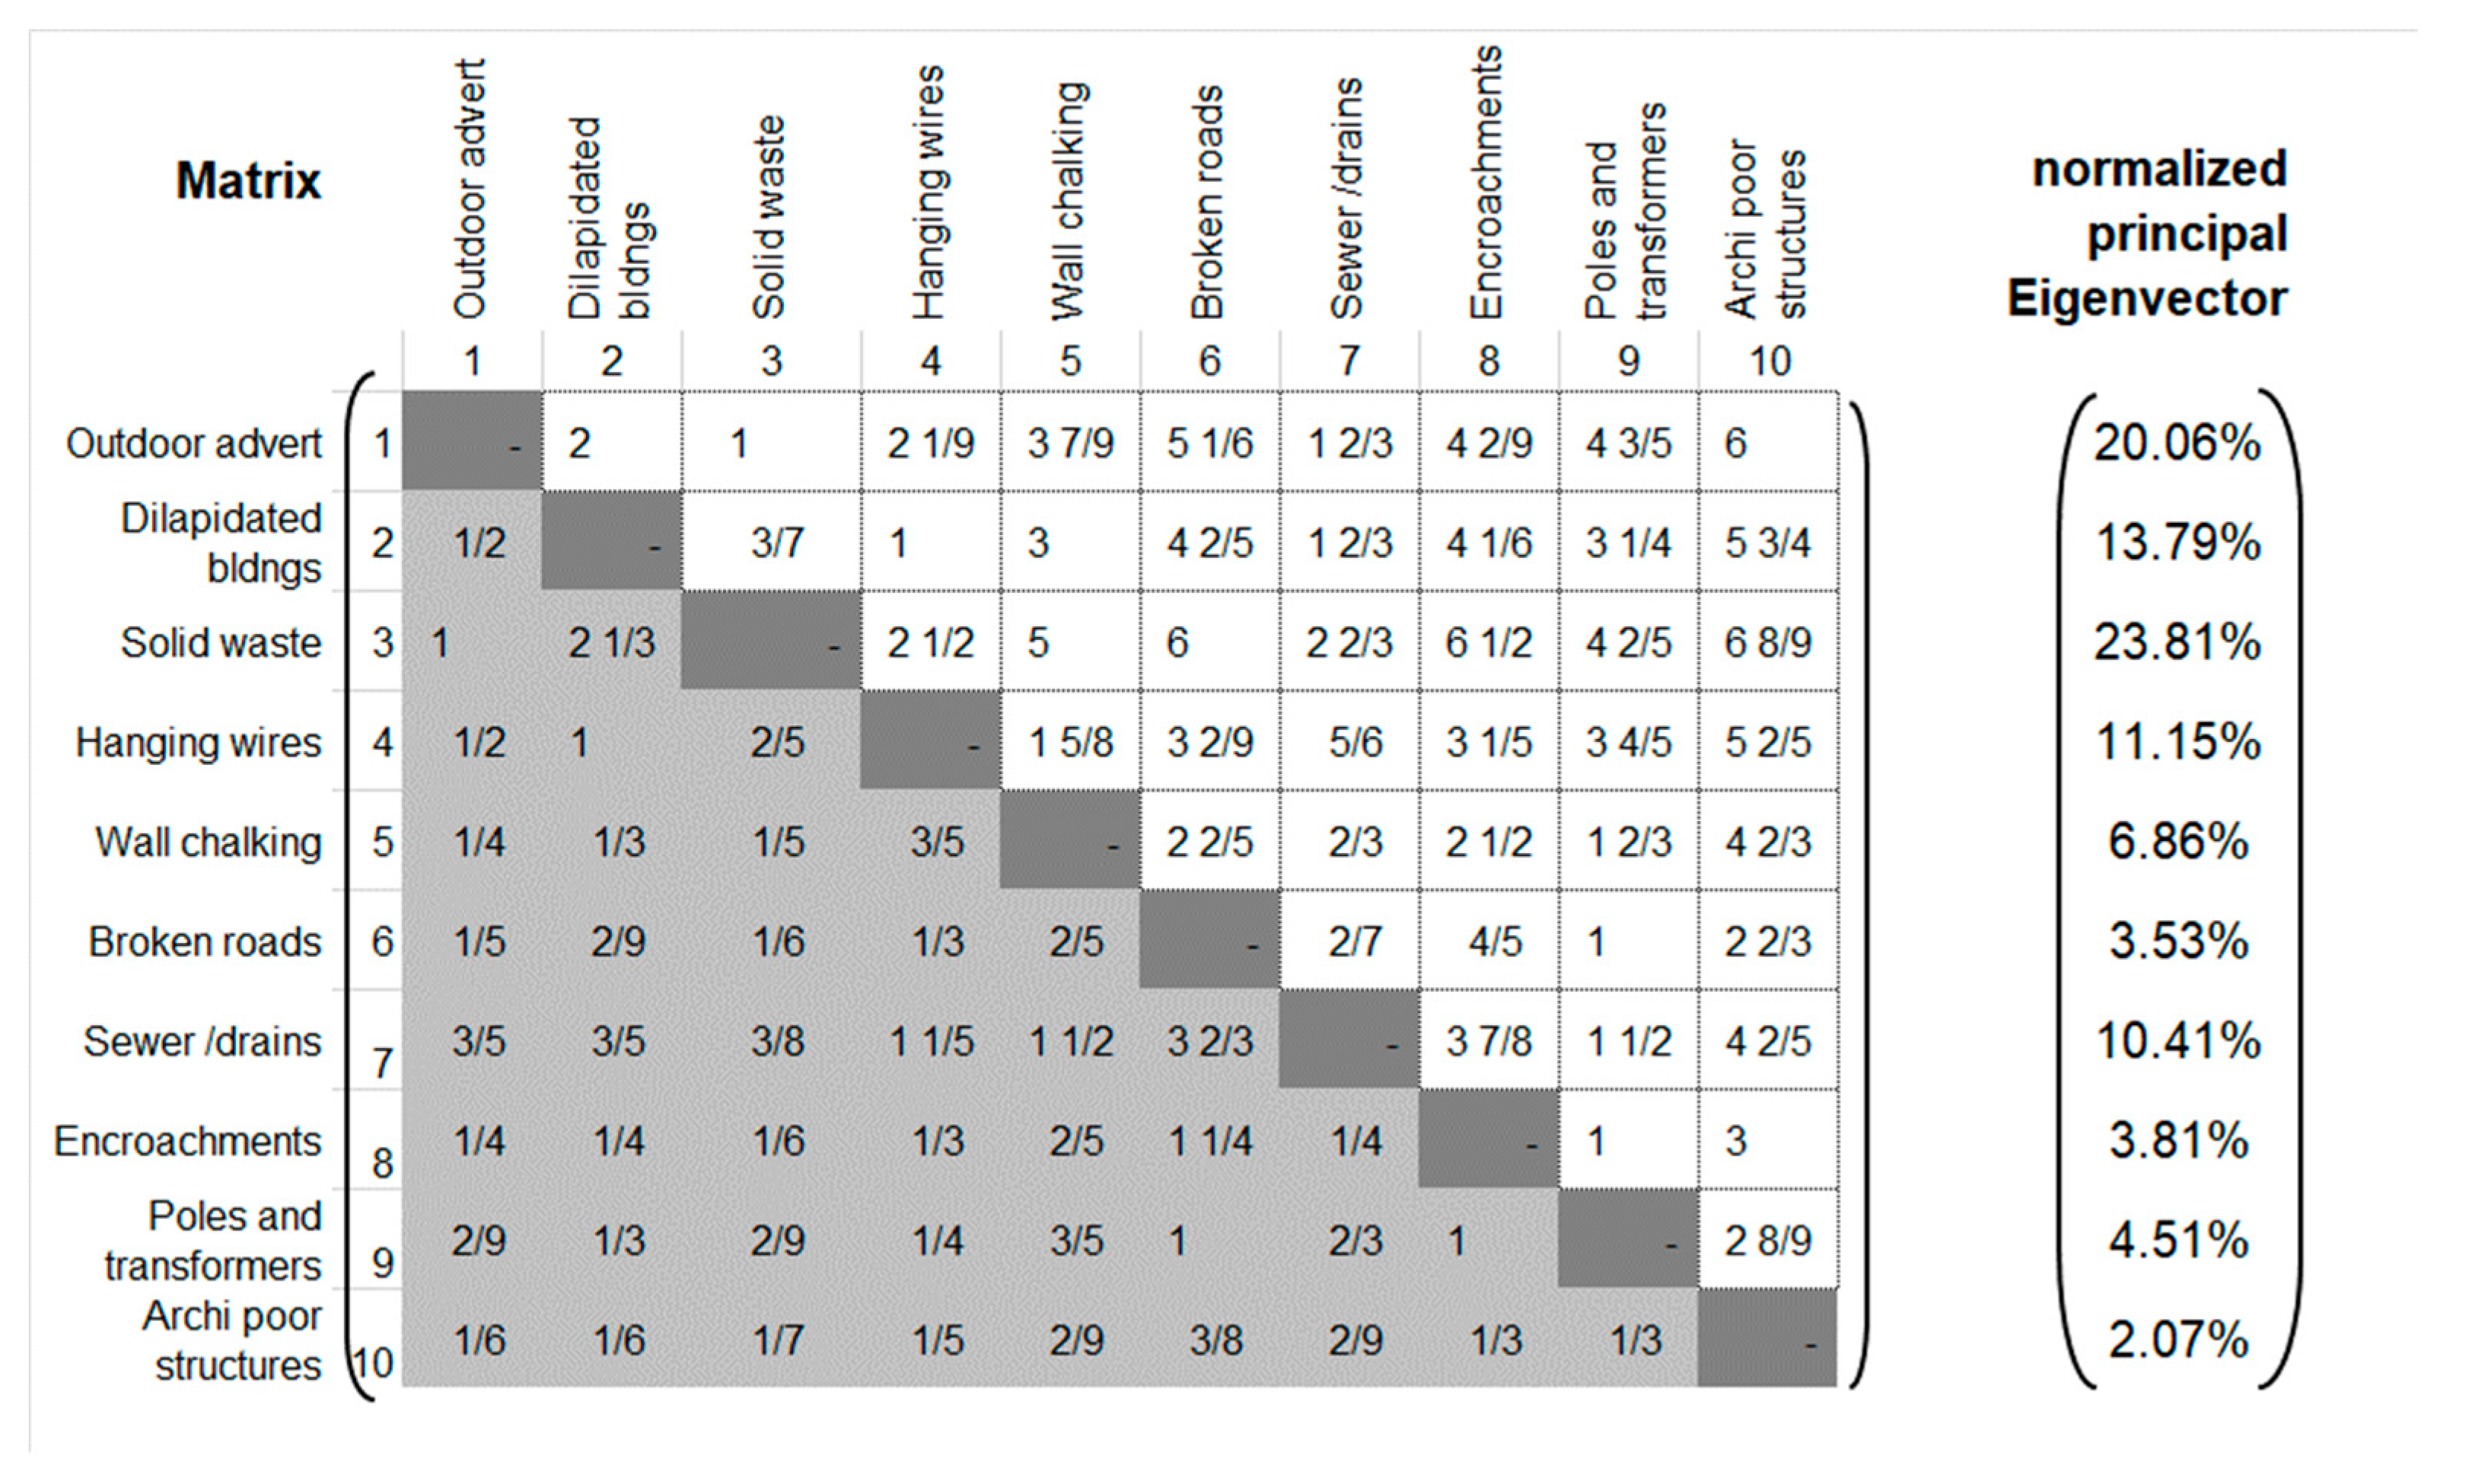
Since there were 10 VPO groups, a 10 × 10 matrix was formed. The AHP template by Goepel [60] had been adopted for the compilation of results. Since the matrix size and number of panel experts was reasonably large, we used a commercial spreadsheet application (Microsoft Excel) for the compilation of results. To capture their opinion, each member was asked to provide (1) ranking for the VPOs and (2) pairwise comparison of all VPOs groups among themselves based on the level of a VPO’s contribution to visual pollution.
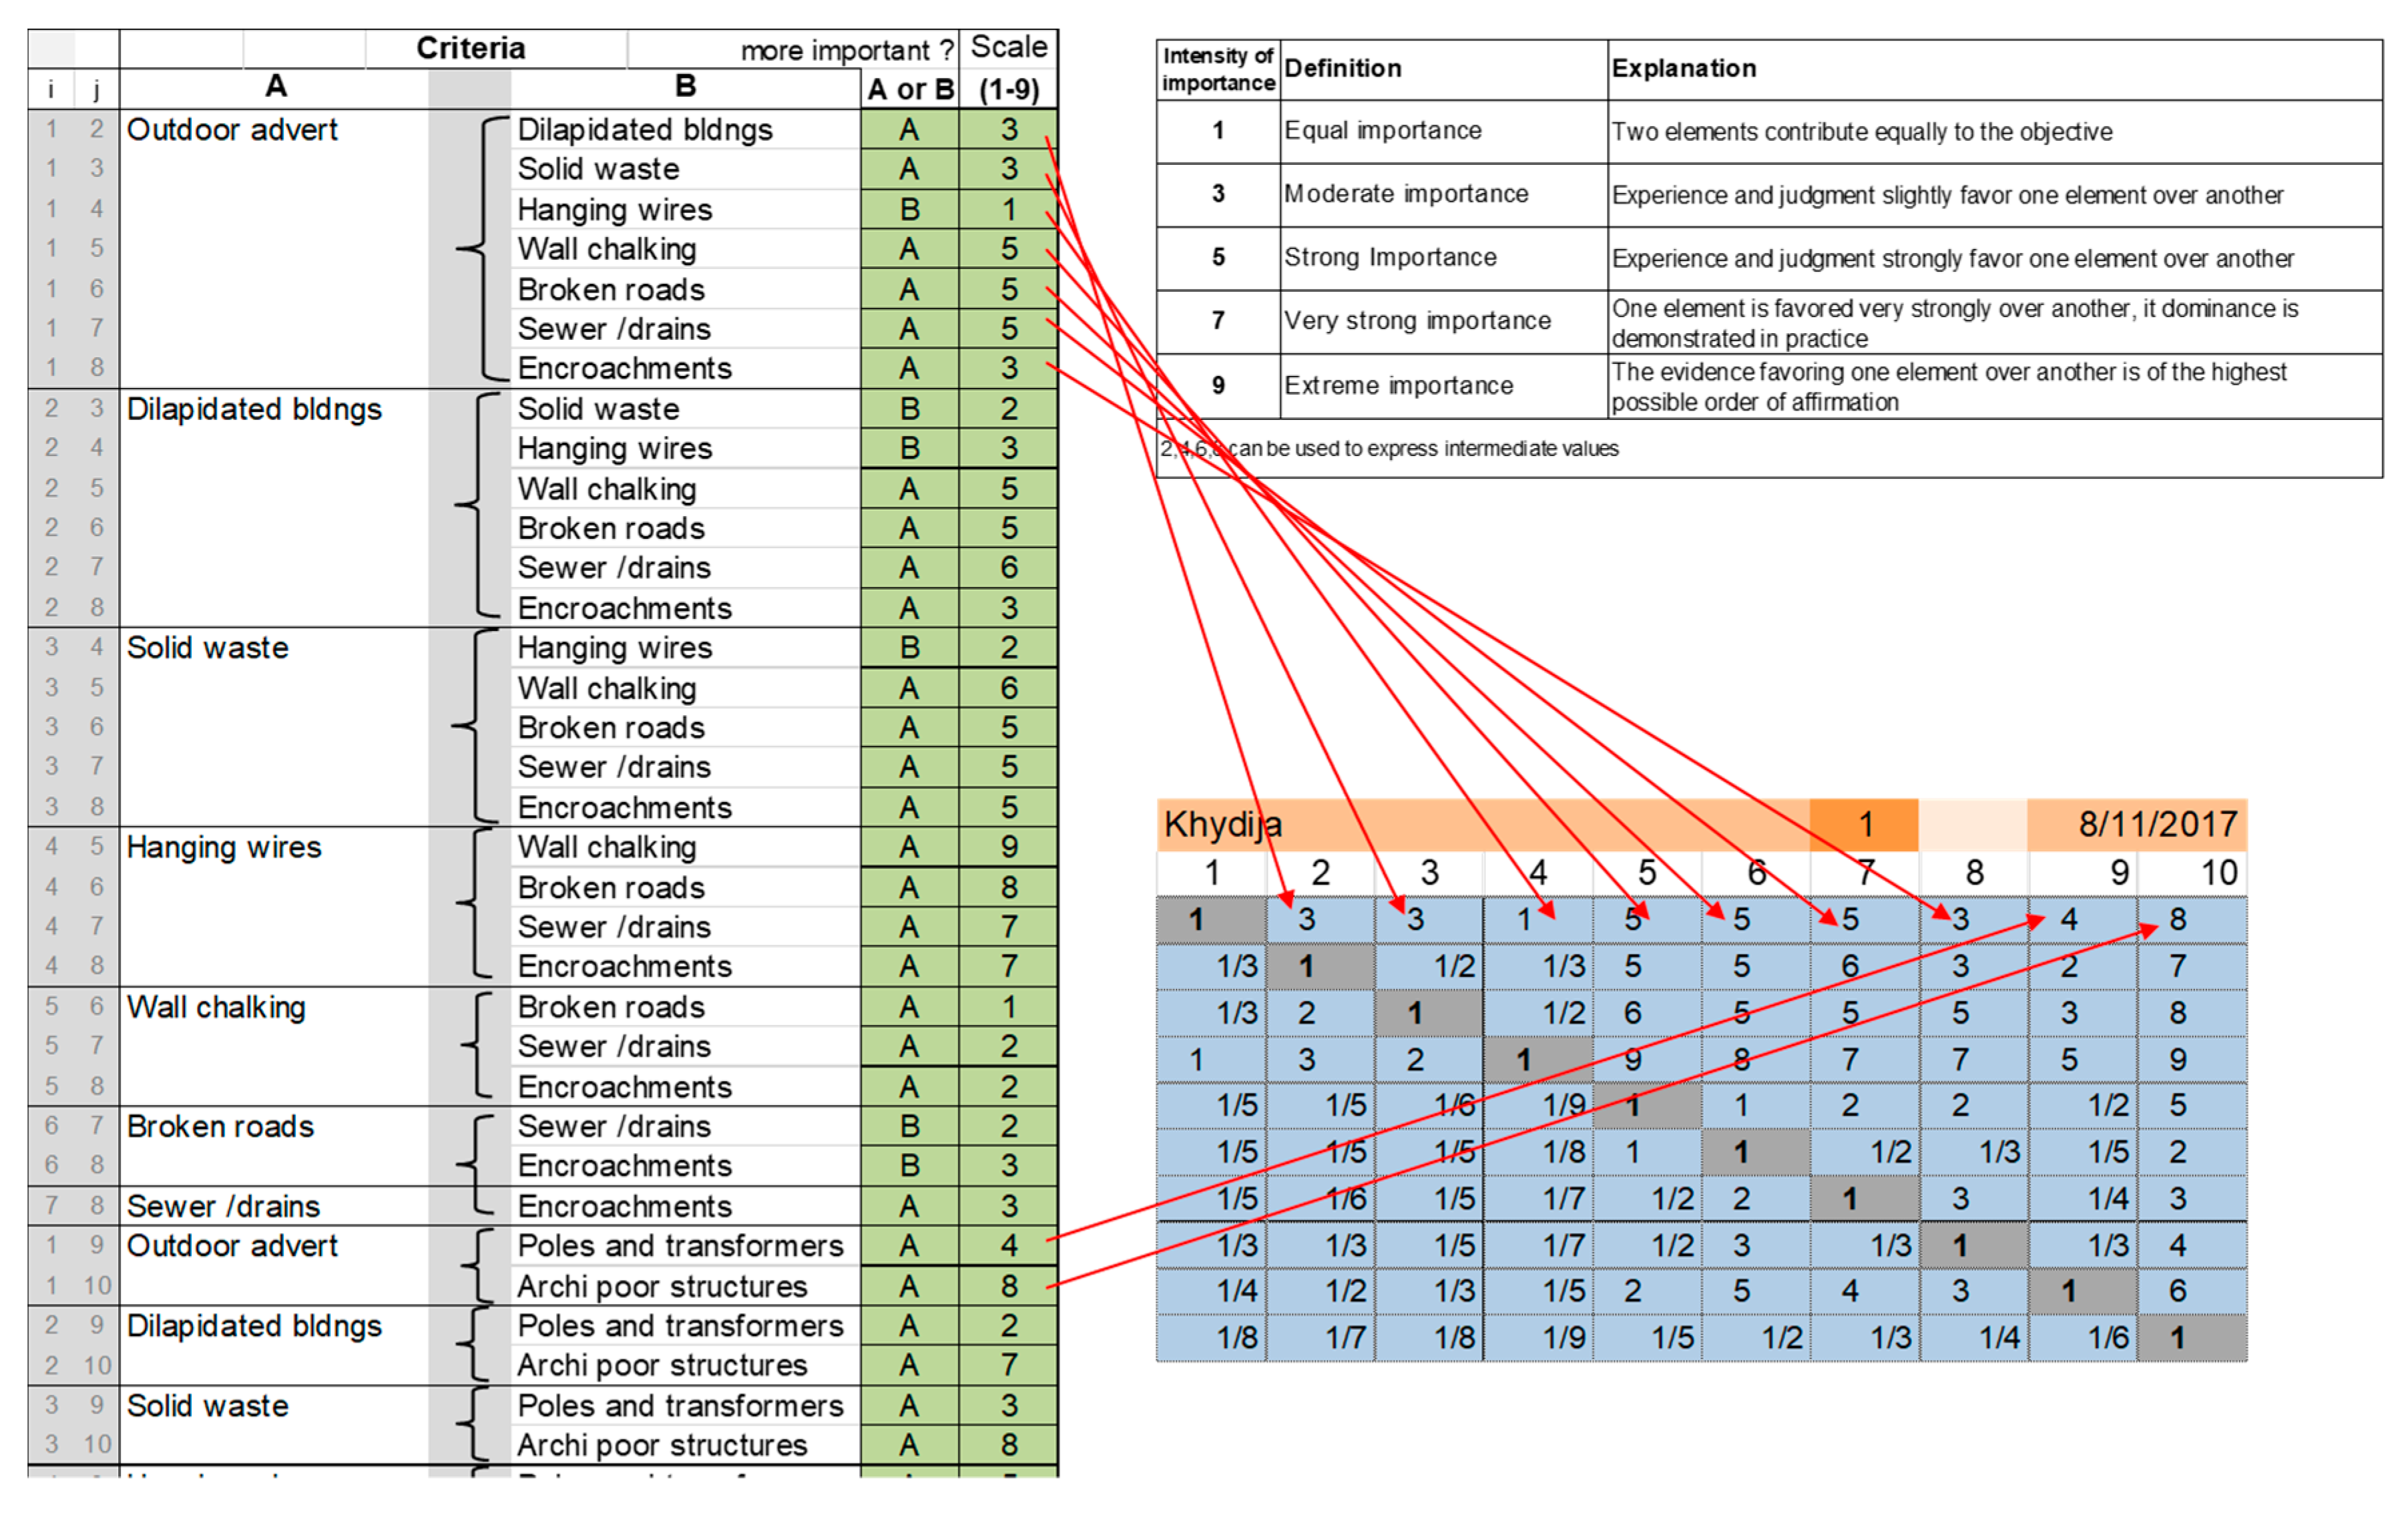
Similarly, each of the criteria (VPOs group) were compared with every other criterion by means of a pair-wise comparison over a 9-point Saaty scale. Every member was thoroughly trained on the process and the definitions of scale values. To do so, a series of the dedicated session was conducted with experts where along with the scale and ranking criteria, practical examples were also discussed in detail. For example, in a typical comparison, the expert decides which among outdoor advertisement (A) and wall chalking (B) is the bigger contributor to visual pollution. Suppose the expert selects A, then the next question is that on a scale of 1-9 how much more A contributes to visual pollution than B (while 1 means equally severe, 3 means moderately more severe than the other, 5 means more strongly severe than the other, 7 means very strongly severe and 9 means extremely severe compared to the other while the values 2, 4, 6 and 8 represent the micro-scale between them). Figure 2 presents the screenshot of the excel sheet where pairwise comparisons are recorded and how they are used to generate the automated matrix.
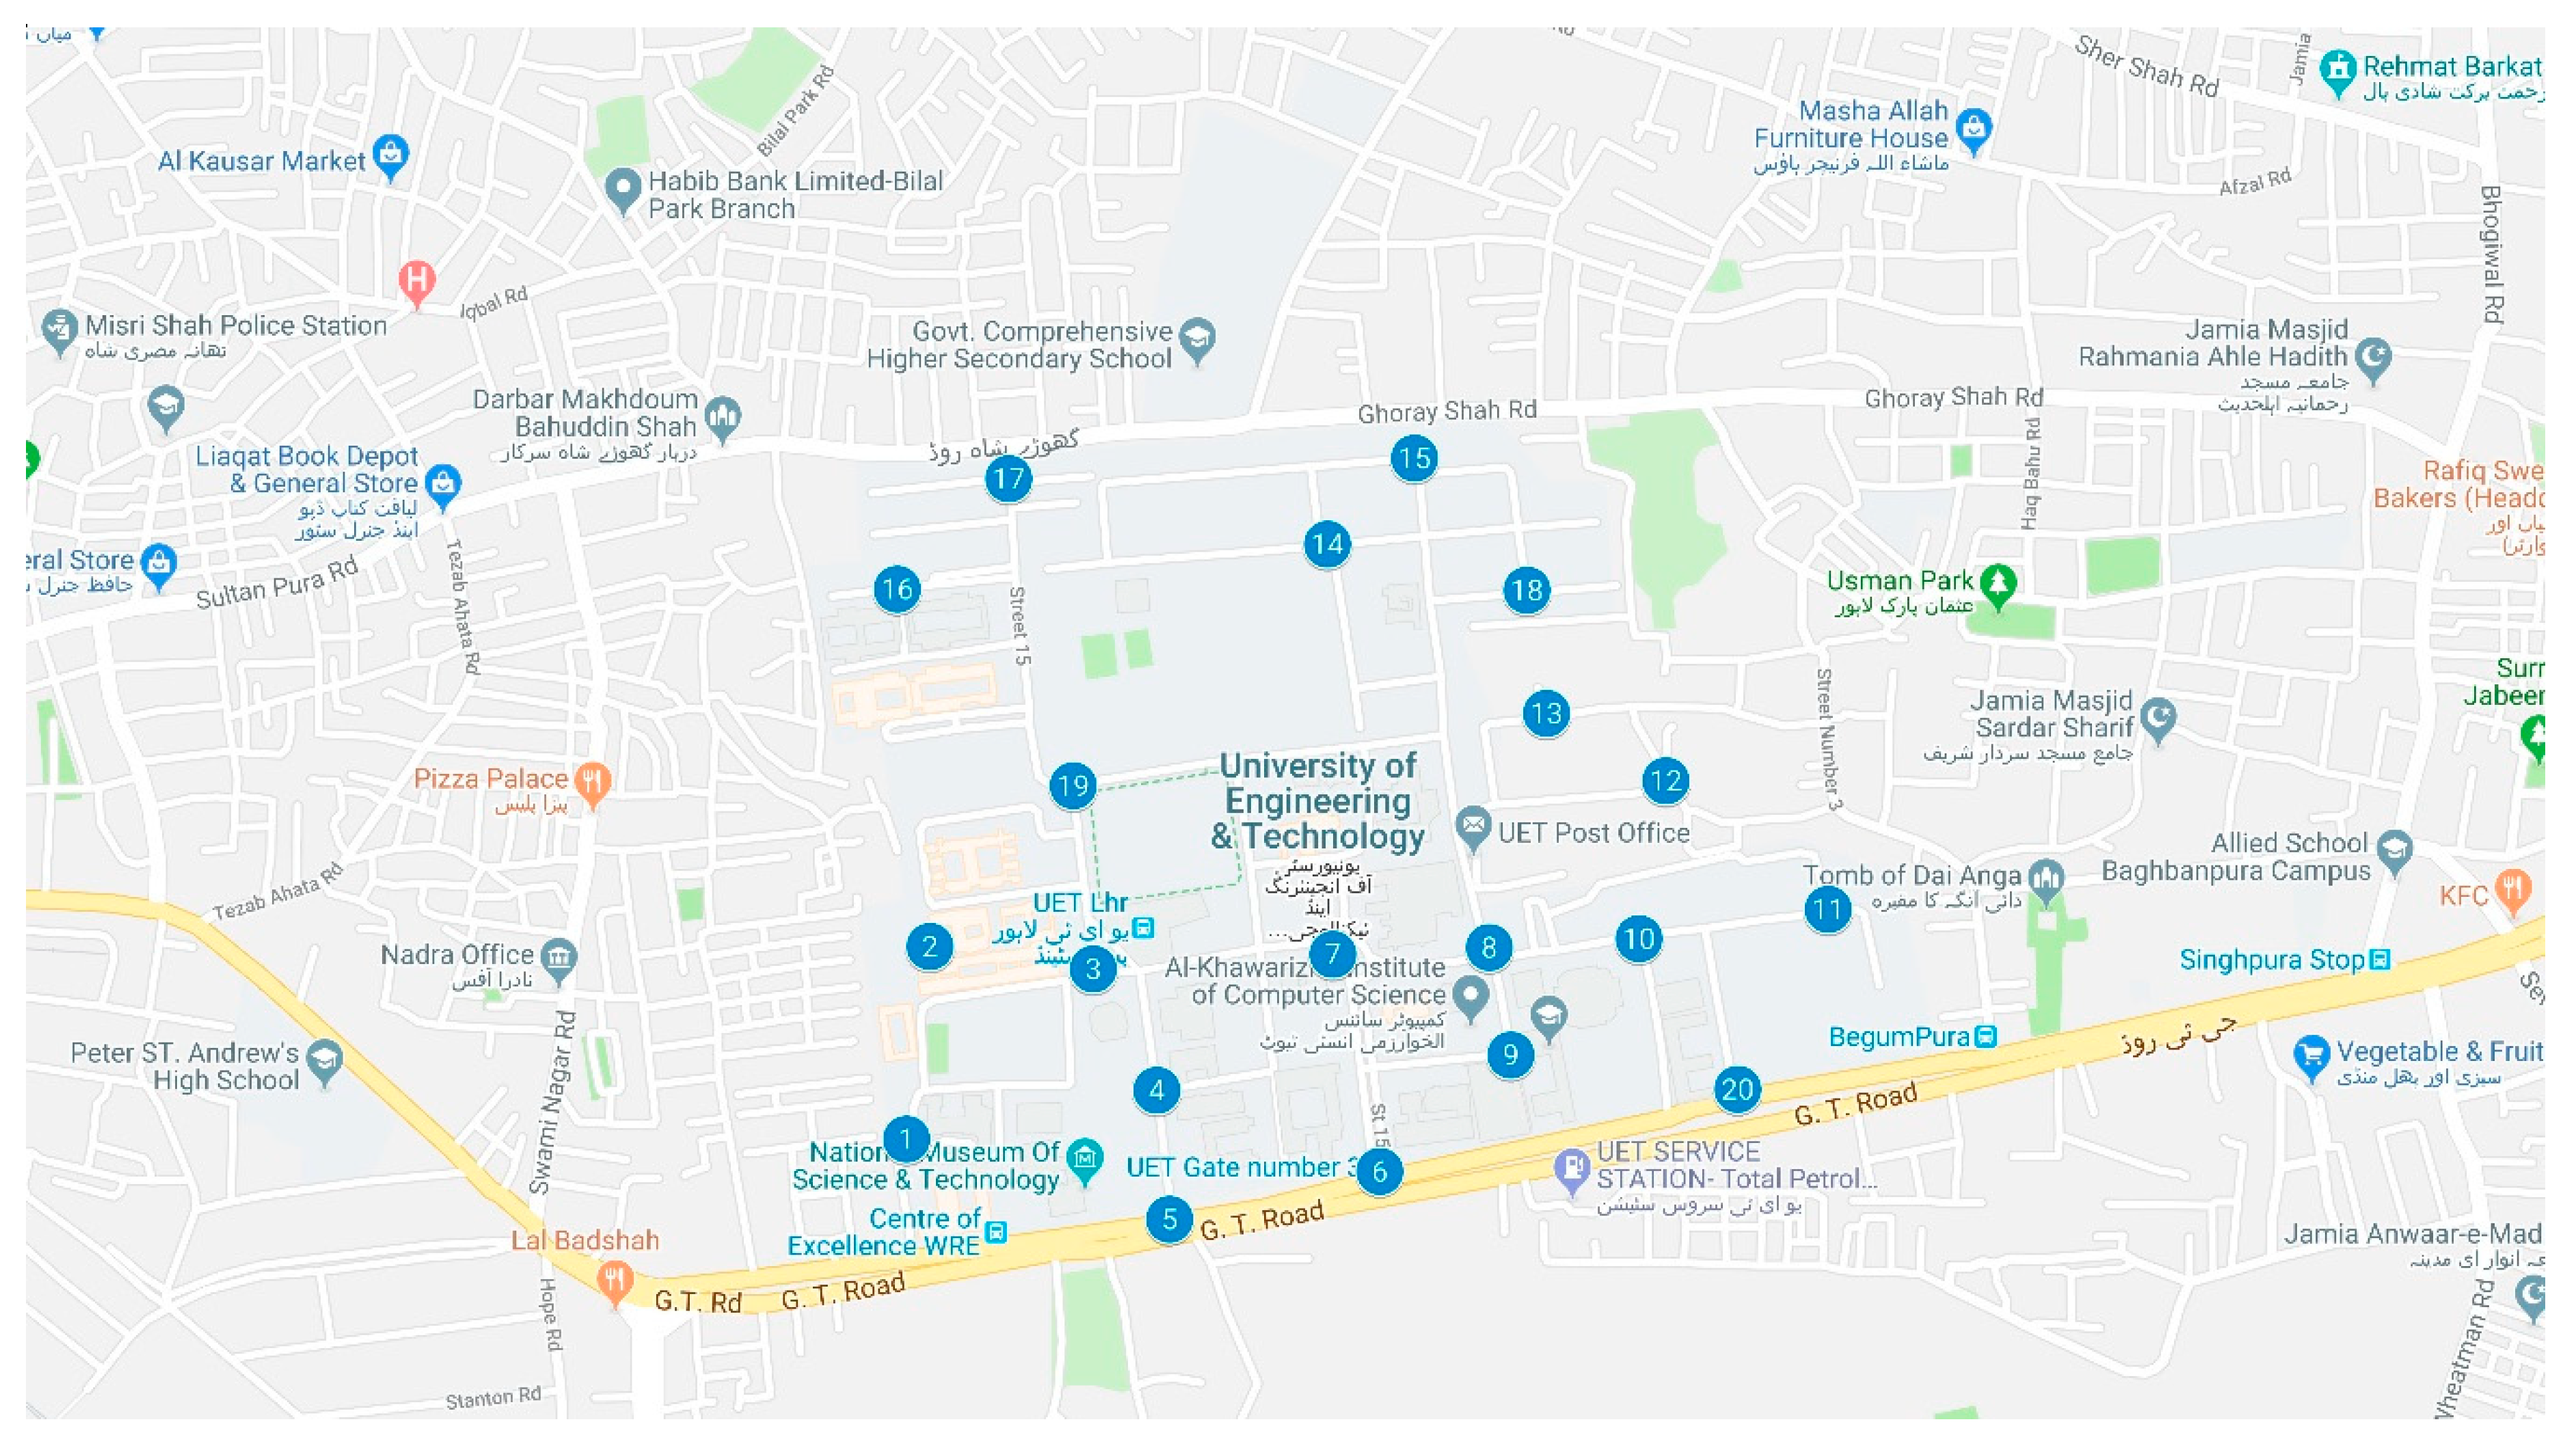
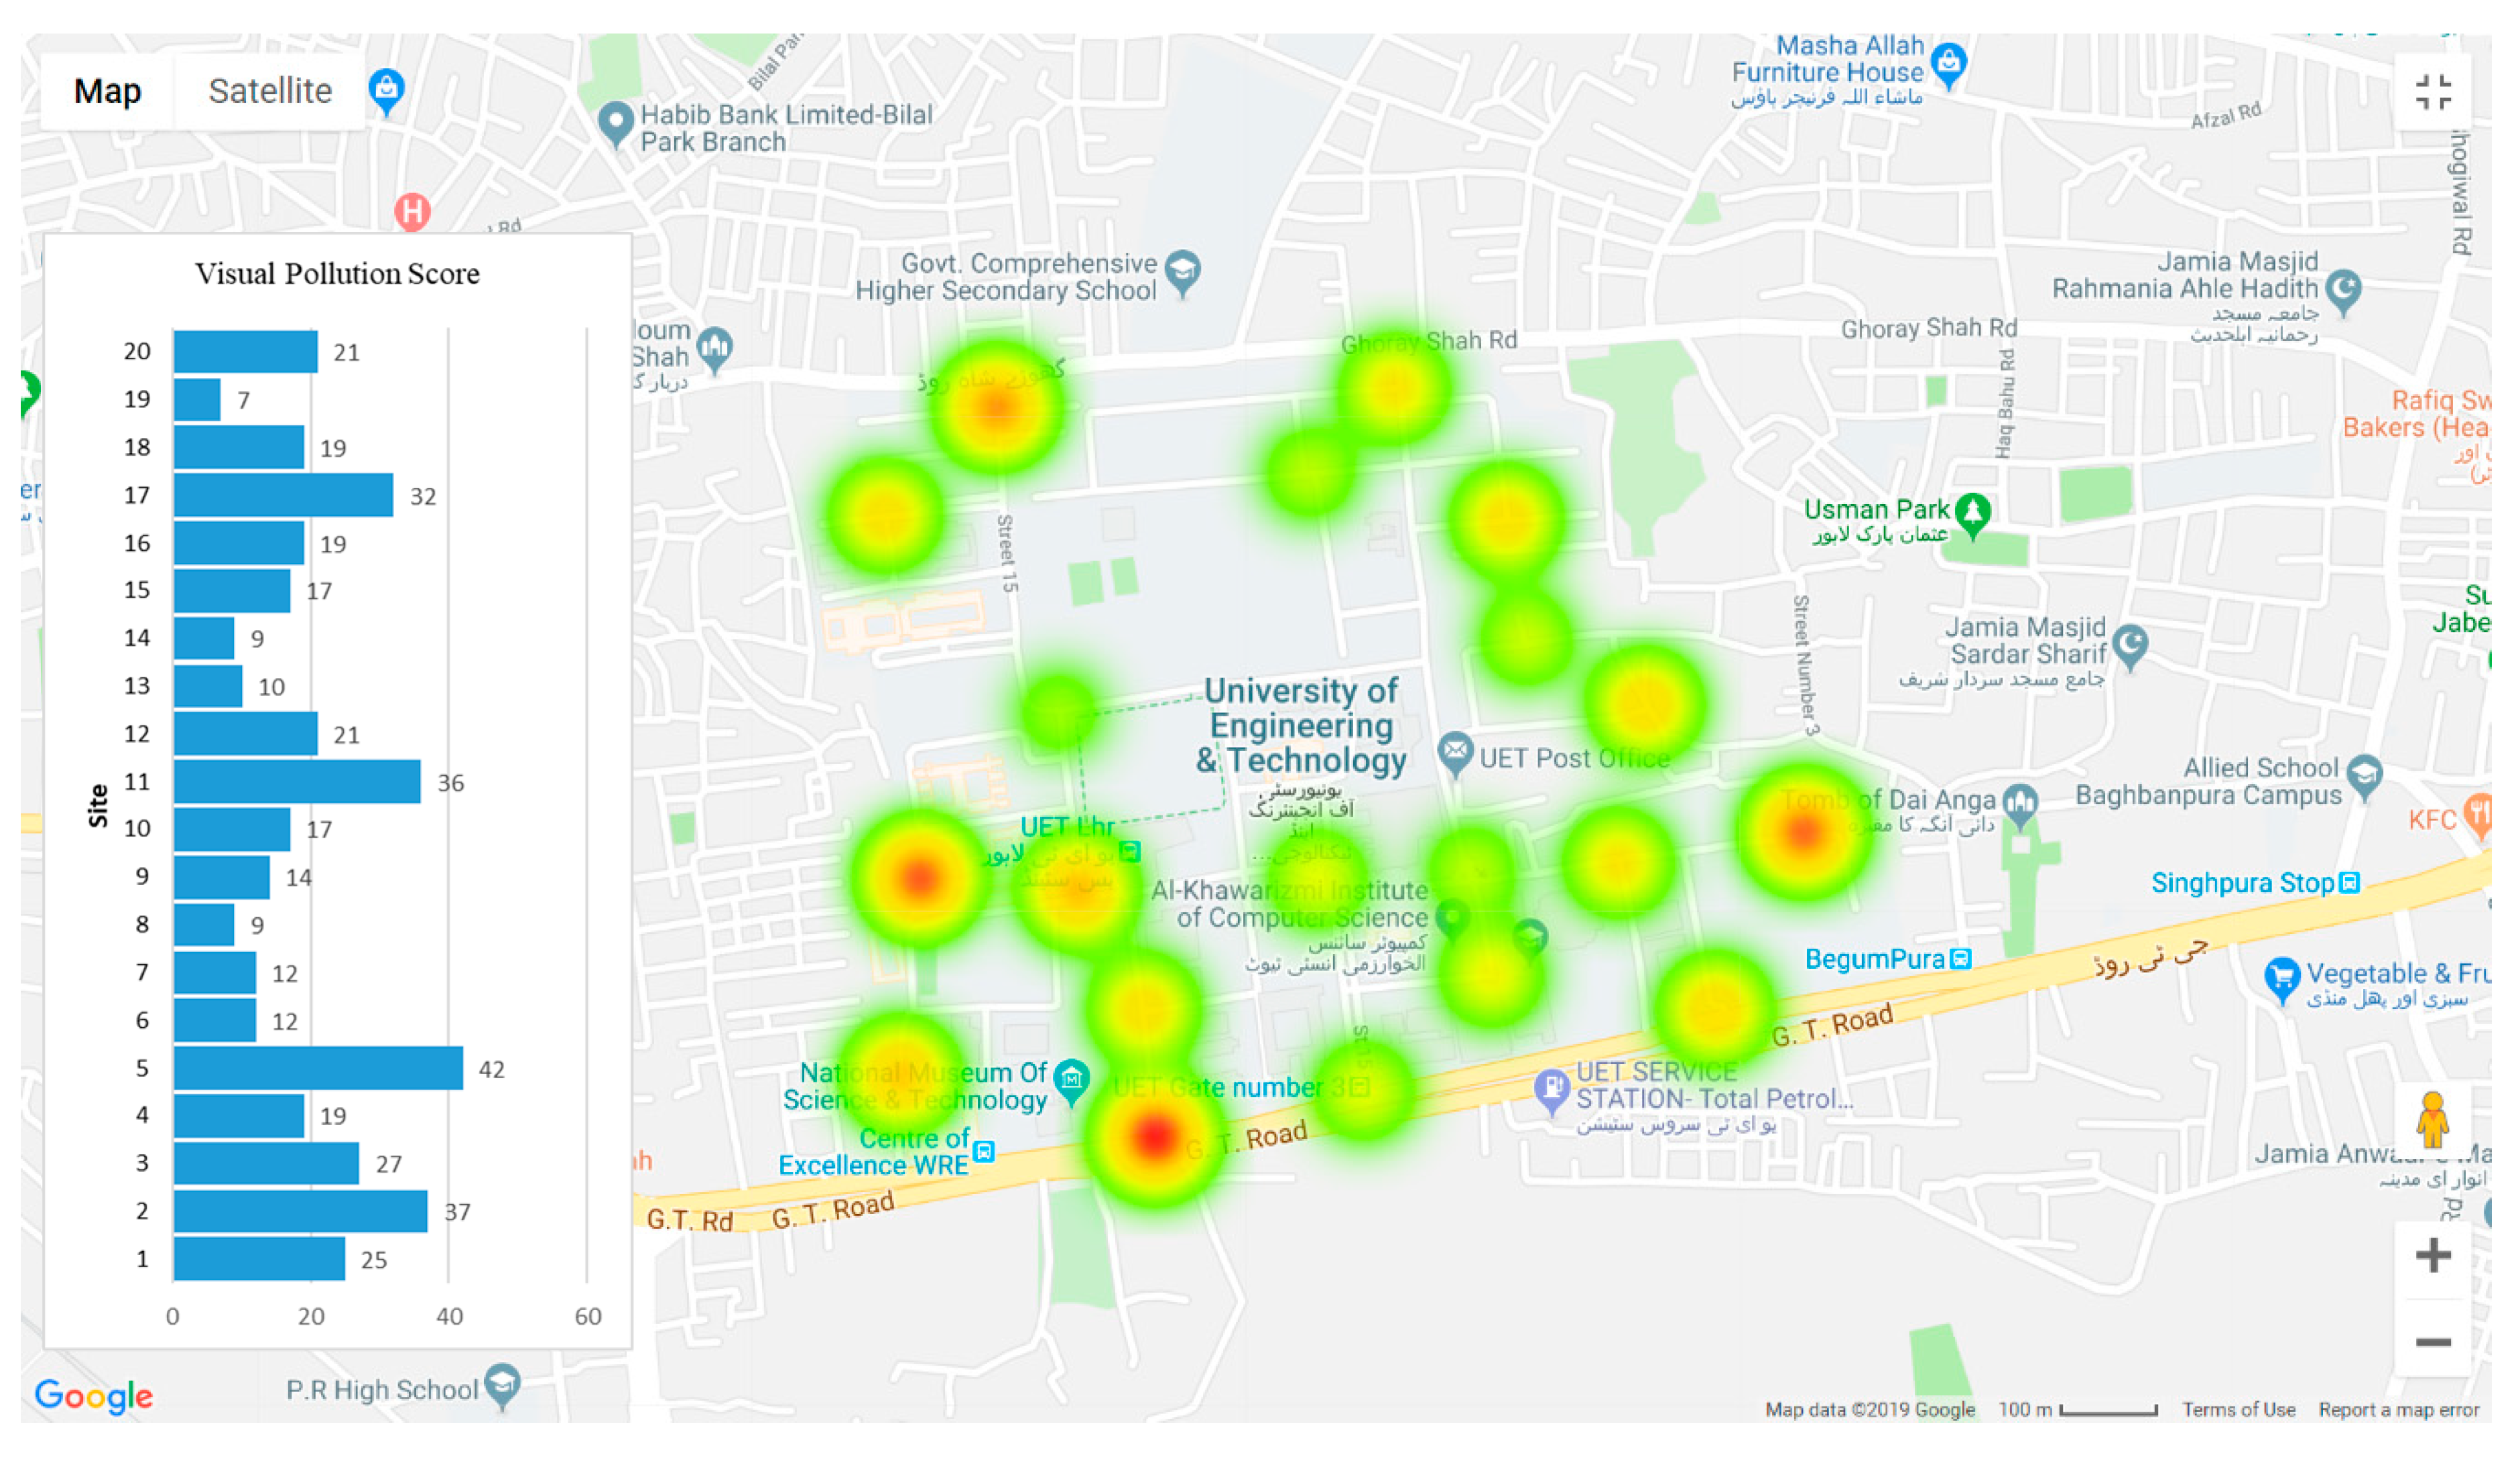
Parallel to the ranking and weighting of VPOs, characteristics of each type of VPO were listed and rubrics for these characteristics were prepared. At this stage, panel members identified those characteristics for each VPOs that have a direct relationship with the visual impact generated by that VPO. Furthermore, rubric values have been defined against each characteristic. At the next step, intra-group VPOs were weighted and finally, the objects were arranged in the form of a scorecard to be used in the field (see Figures 7 and 8). Finally, the validation and reliability of the VPA tool were assessed. The inter-observer/ inter-rater reliability (IRR) analysis (also called the inter-observer agreement) by a pilot study was applied. Reliability analysis facilitated in finding the extent to which results in scale is consistent even when observed by different observers. For IRR, the tool was also experimented with at 20 distinct locations of different land-uses in Lahore (the second largest city of Pakistan) by a group of five trained observers (Figure 3). The reason behind selecting 20 locations was to ensure that they cover different combinations of land-uses (residential, commercial, open spaces and public buildings, etc.) and land-use activity intensity. Each location was a three-or-more-legged road junction. The observer was positioned at the centre of a junction or a similarly appropriate location with a 360o view of the location to record VPOs on the tool. The observers were final year students of urban and regional studies undergraduate programme, who were thoroughly trained on the VPO identification and assessment of their characteristics. Each observer completed the VPA exercise for all 20 locations. Resultantly, 5 assessments (filled VPA scorecards) were available for each location – it is important to highlight that the VPA tool requires capturing 205 values to represent characteristics of different VPOs. Subsequently, responses were analyzed in ten observer pairs and several agreements between each were calculated to get percentage agreement-based IRR.
4. Results
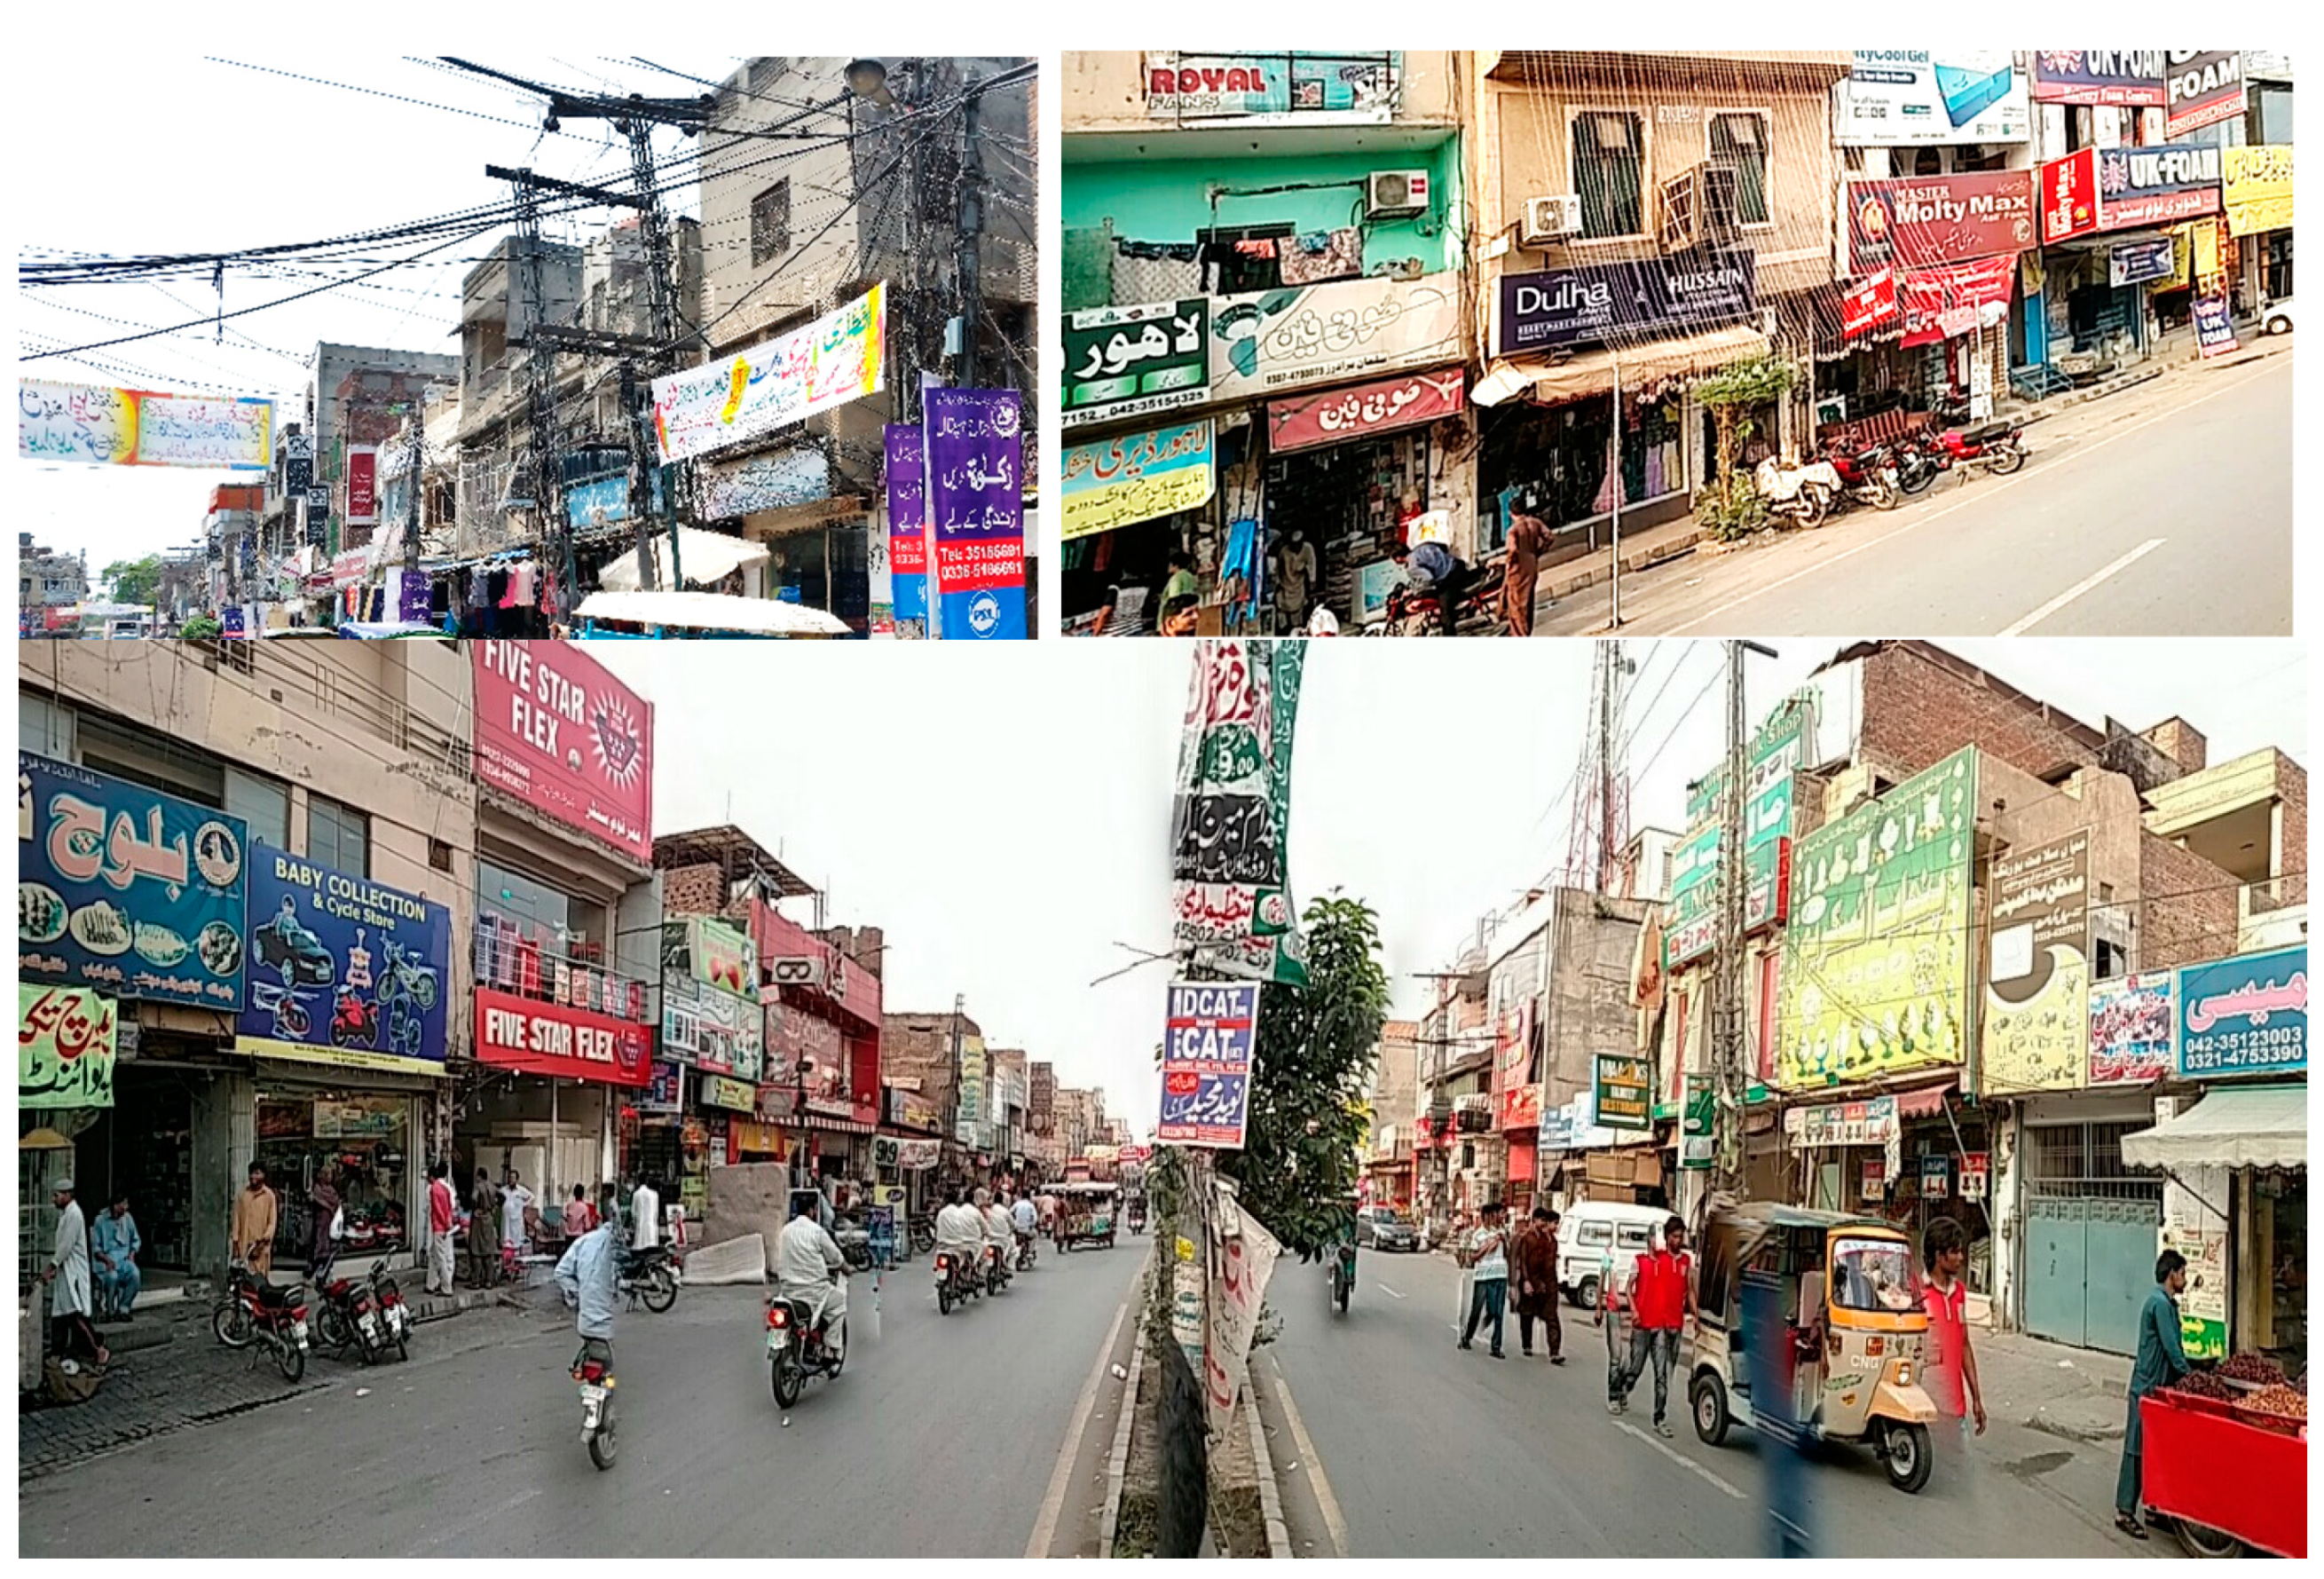
The first stage of VPO identification and listing resulted in a long list of 42 VPOs containing more localized and non-conventional visual pollution objects including hanging wires, electricity transformers, broken poles, dilapidated buildings, etc. Such VPOs have not been considered in earlier studies with such emphasis. The listed VPOs have been classified by the panel experts on the basis of the similarity of objects which resulted in 10 wider groups as presented in Table 2. A few glimpses presenting some key VPOs from the streets of Lahore, Pakistan are presented in Figure 4. More graphical evidence of these VPOs can be accessed at https://urbanvisualpollution.wordpress.com.
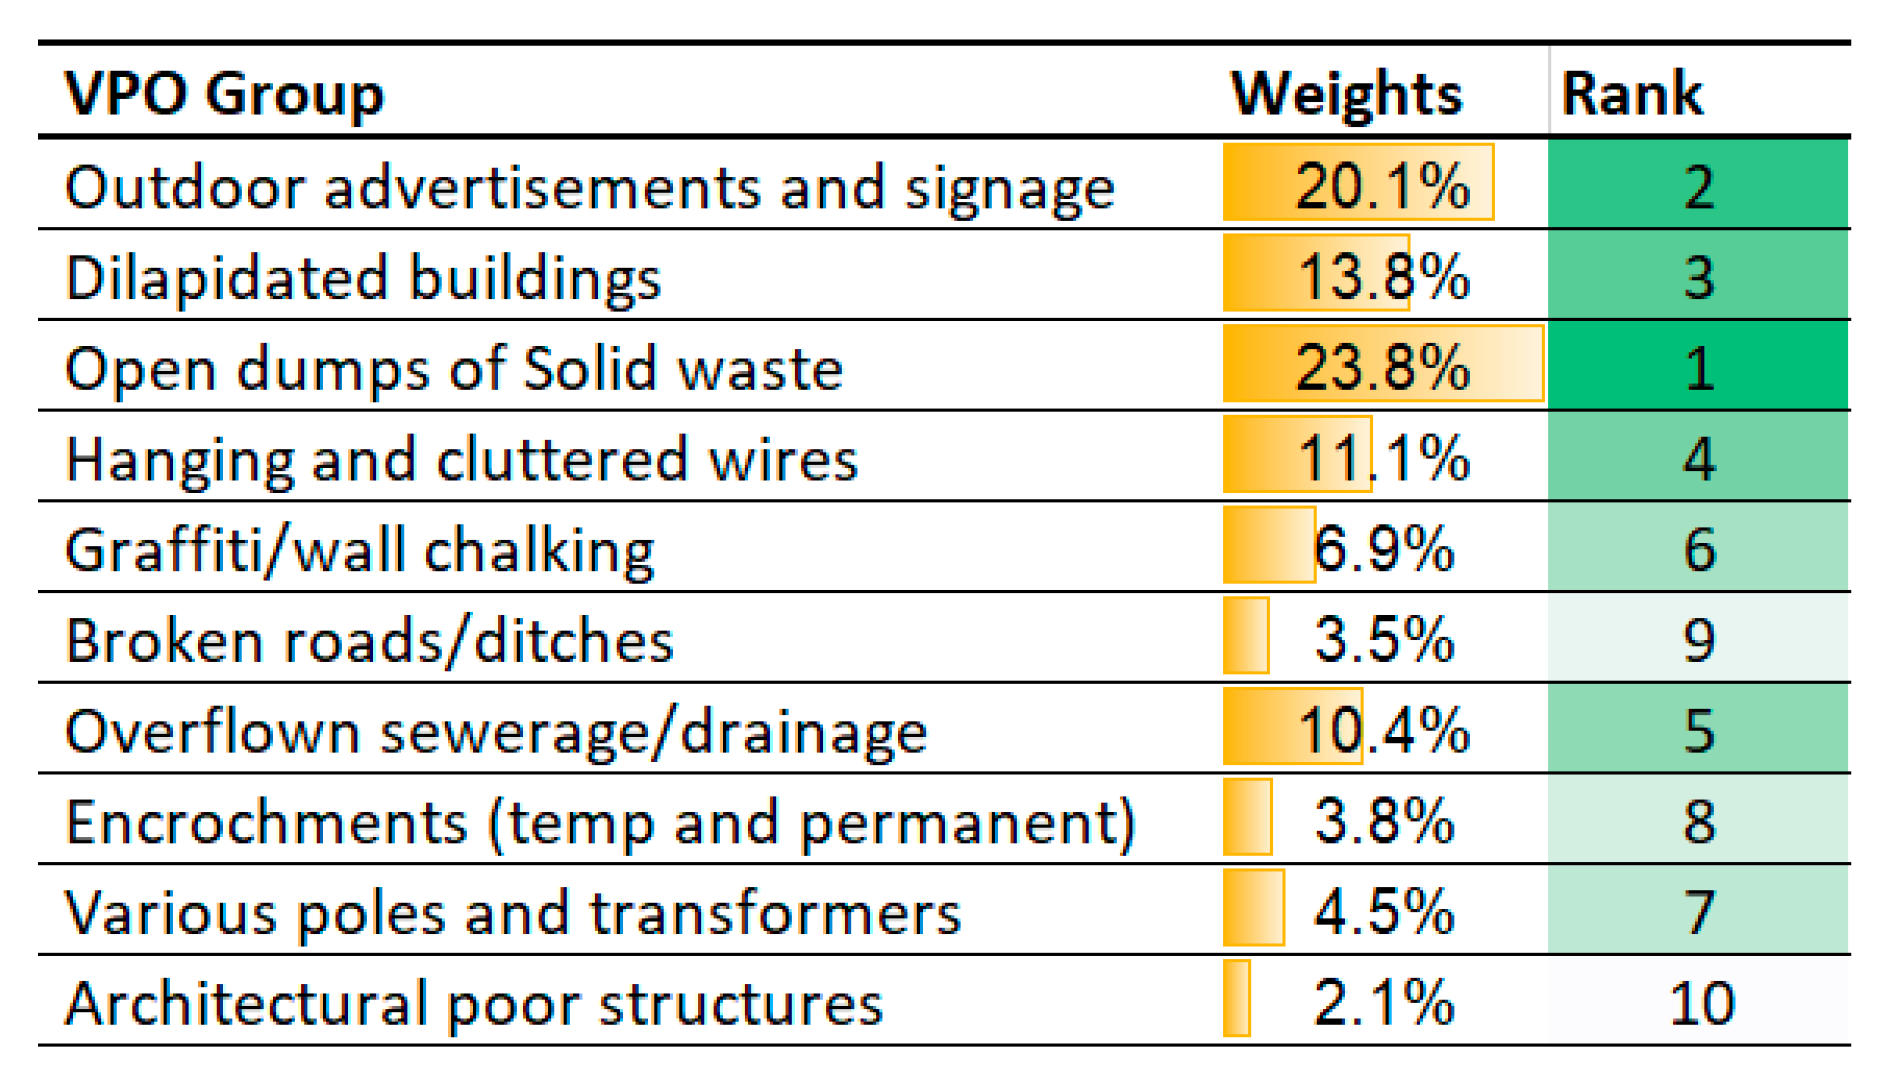
The identified groups were ranked by the experts and their weights were calculated. The consolidated weights and ranks generated by experts through AHP reveal that open dumping of solid waste is marked as the largest contributor to visual pollution (23.8%), followed by outdoor advertisements and signage (20.1%). Dilapidated buildings have been ranked as the third major contributing VPO (13.8%) followed by hanging and cluttered wires (11.1%). The list continues with overflown sewers and drains at fifth place (10.4%), graffiti/wall chalking at sixth place (6.9%), various poles and transformers at seventh place (4.5%), encroachments at eighth place (3.8%), and broken roads/ditches at ninth place (3.5%). The VPO group of architecturally poor structures is ranked at the tenth place with a score of 2.1%. Figure 5 presents the consolidated matrix generated from the individual responses of panel experts while Figure 6 represents the final weights and ranks for VPO groups.
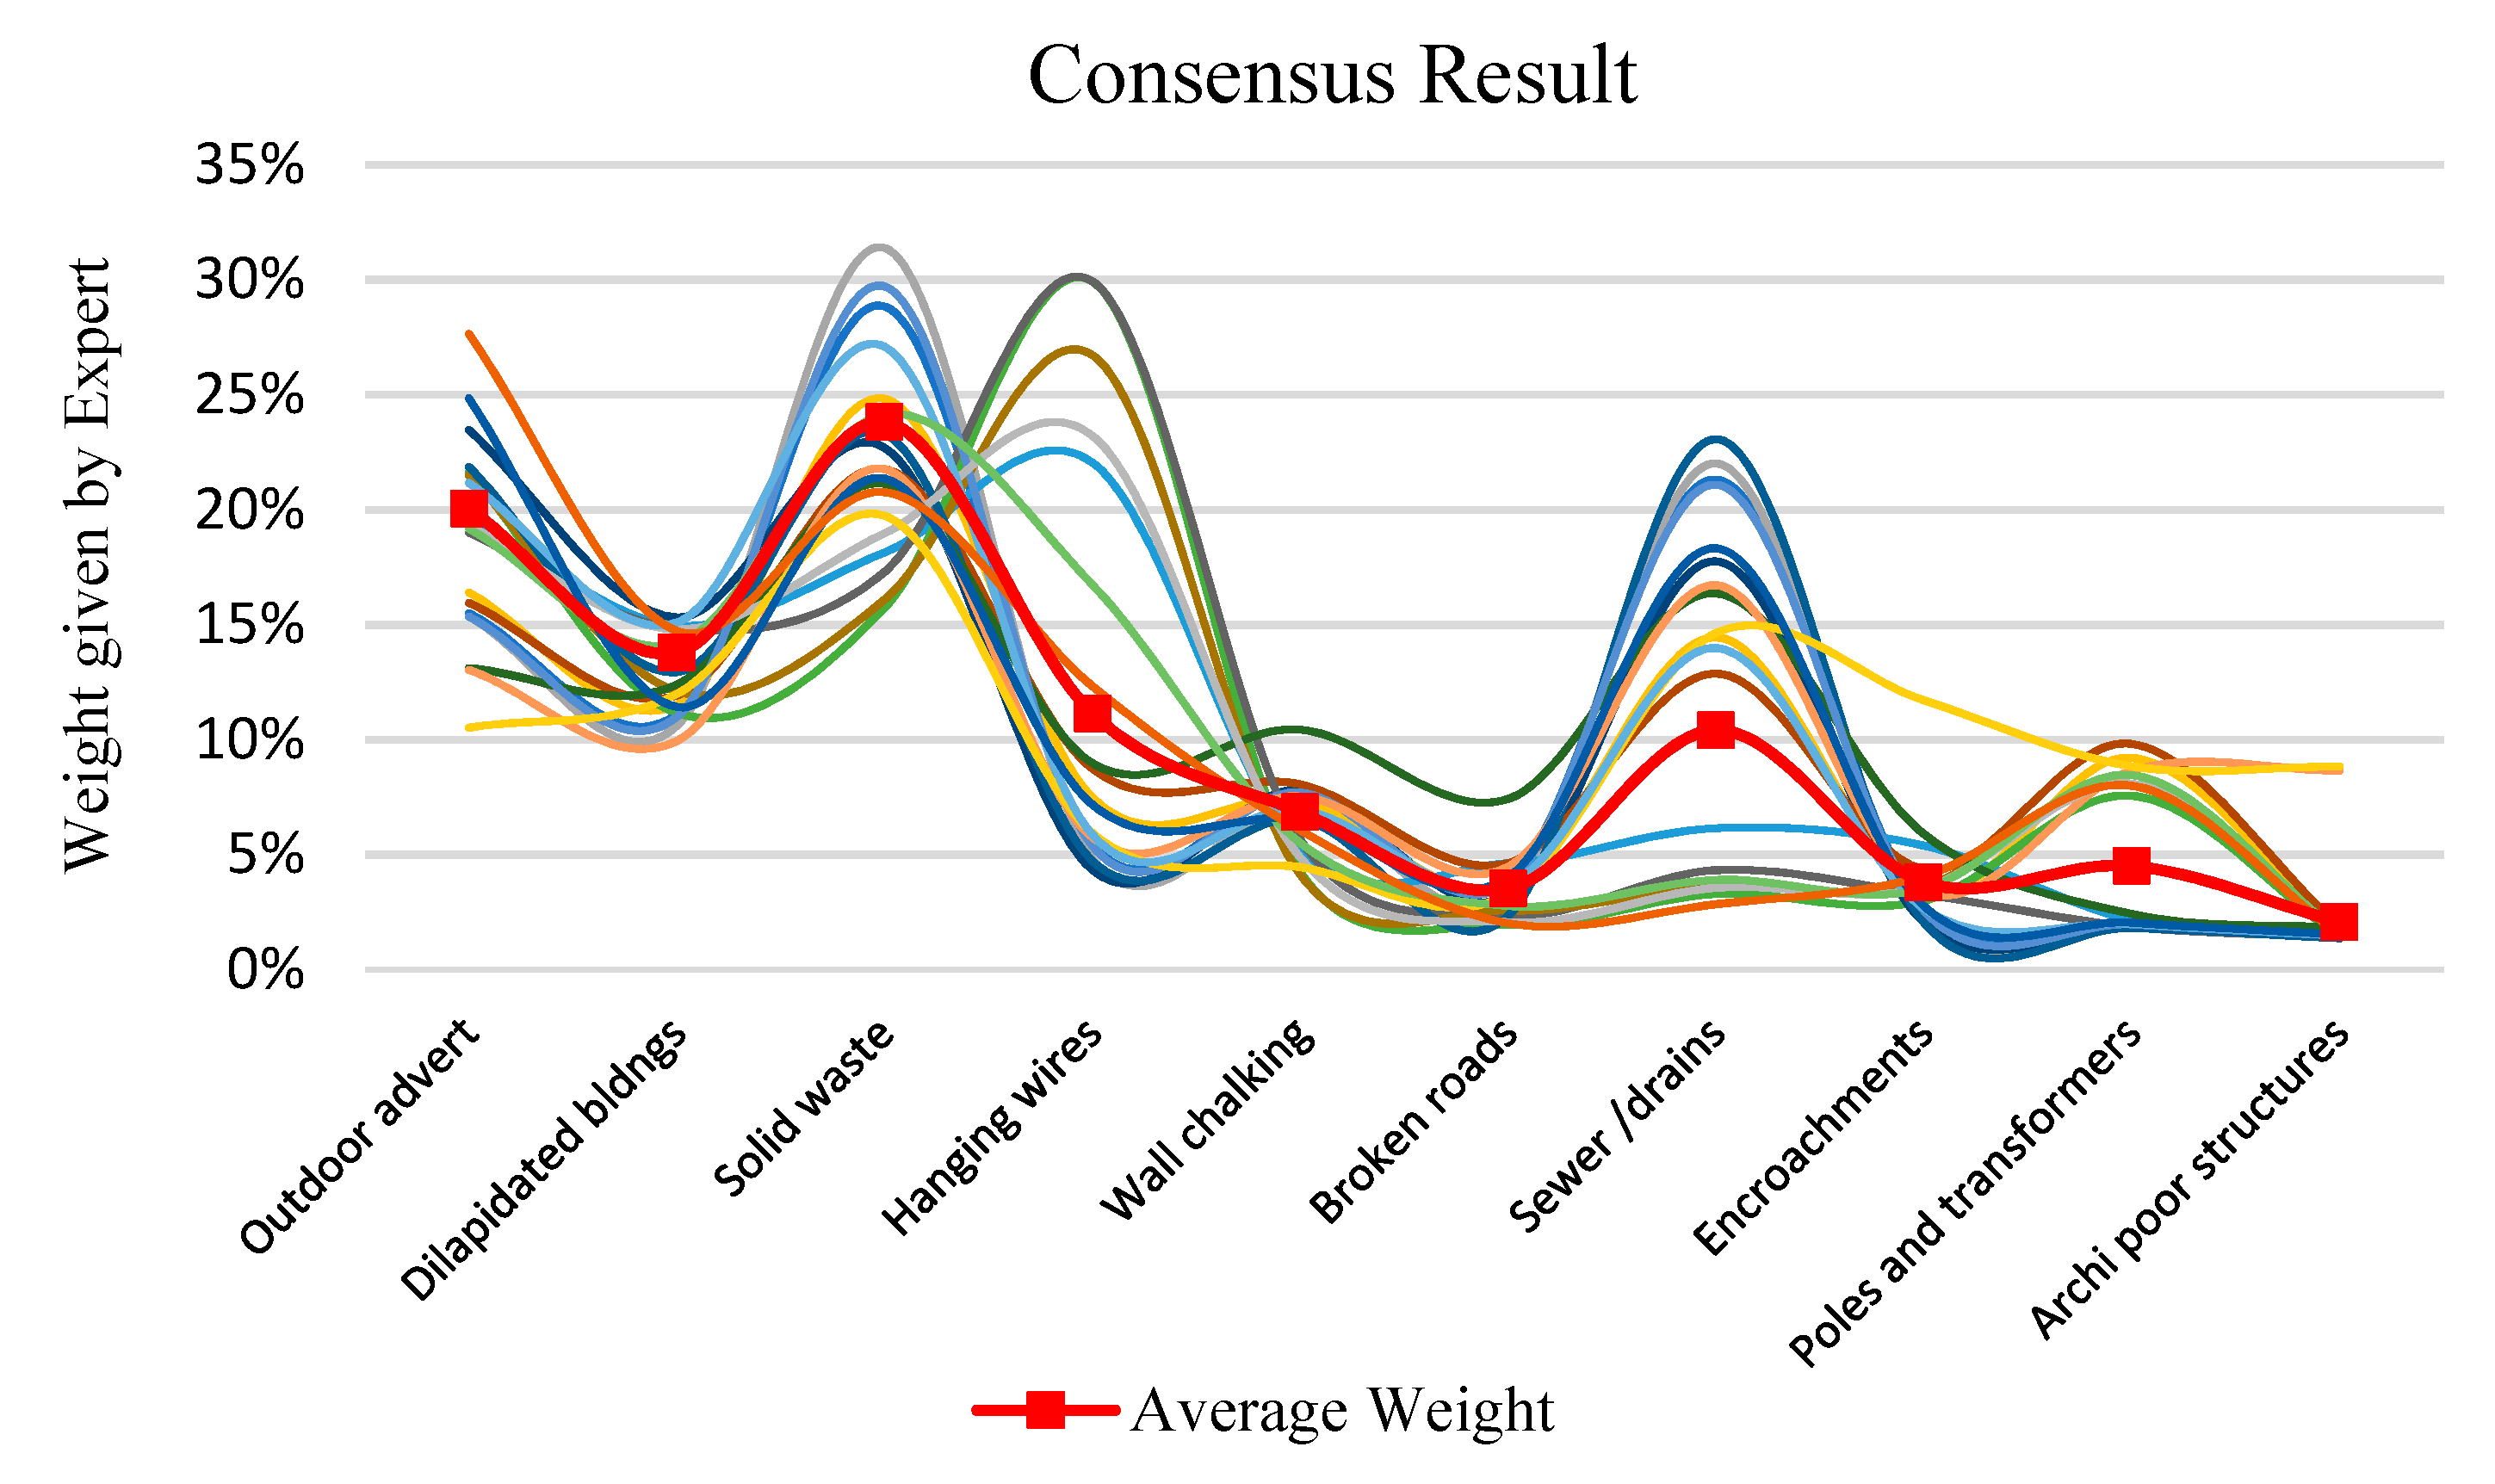
In order to understand the pattern of ranking by each expert, an AHP consensus indicator was calculated using Shannon alpha and beta entropy [60]. The consensus indicator ranges from 0% (no consensus) to 100% (full consensus). The calculated consensus turned out to be 80.1%, which reflects a high overall level of consensus among the experts. Figure 7 represents the mapping of VPO weights given by each panel member. Each line represents one expert while the bold red line shows the average value. The dispersion in the opinion of experts on certain VPOs reflects the diversity which comes in opinion because of their experience, knowledge or professional background.
After ranking, rubrics were prepared to systematically measure the characteristics of VPOs. Table 3 shows some of the characteristics and rubric values listed for billboards. Similar tables were prepared for each VPO under study and vetted by the panel of experts.
After the AHP based ranking, the weighting of VPO and preparation of rubrics, VPOs and their characteristics were arranged in the form of a scorecard. This VPA scorecard is a condensed resource (available at https://urbanvisualpollution.files.wordpress.com/2019/02/visual-pollution-assessment-tool-scorecard.png) that can be used to record the prevalence of various VPOs and their characteristics on a site under observation. In addition to VPO related information, the tool records the elements related to place character (number of road legs, dominant land-use, nature of activity, average height of buildings, average road width, average distance between facing building lines, area type (planned/ unplanned), and socio-economic status of the place along with the geospatial coordinates. Place character is particularly useful to generate correlations at the analysis stage. The data collected through the scorecard is processed through a visual pollution score calculator sheet (available at https://urbanvisualpollution.files.wordpress.com/2019/02/visual-pollution-assessment-tool-score-calculator-sheet.png) that presents the sequential stages of assigning inter-group weights, rubric values for VPOs and then the contribution of the total of those assigned numbers in the VPO score calculator.
The final form of the VPA tool has been made available under GNU General Public License v3.0 at GitHub with open public access at https://github.com/khydijawakeel/UrbanVisualPollution. Furthermore, the tool has been placed at https://urbanvisualpollution.wordpress.com as well where other researchers can access and use for similar studies.
As discussed previously, the tool has been tested at 20 locations to assess its validity and reliability through IRR analysis. Figure 8 shows the level of calculated visual pollution on those 20 assessed sites. Table 4 presents the number of inter-observer agreements for each location/site. Furthermore, agreement ratio has been calculated for each observer pair and then the mean of each row has been calculated to see the overall agreement ratio at each site, as presented in Figure 9.
The results of inter-rated reliability analysis reflect a very good level of agreement at 83% which indicates the potential soundness of the methodology and the resulting VPA tool. It is important to highlight that out of 100 observer pairs, the minimum agreement ratio is 73% while the highest agreement ratio is 93%. The key reason behind the higher agreement ratio is that the tool collects data on 205 variables out of which 134 can get discrete answers with almost no potential of variance in observations (if observers are well trained).
From the initial testing, it is clear that the developed VPA tool tends to mitigate the previously identified limitations related to the assessment and quantification of visual pollution. The tool can deal with the subjective problem of visual pollution in a more objective way. It offers a wider coverage of 40 VPOs in local urban settings. Furthermore, it can record detailed characteristics against each VPO and quantify them by assigning weights and calculating visual pollution score. The tool can be used at both the micro and macro level scale for the measurement of visual pollution, i.e., nodes, street, neighborhood, or a city. The effective utilization of the tool requires the collection of geolocation and pictorial evidences as complementary information. In addition to the VPA scorecard, the collection of such attributes requires handling of additional gadgets (GPS device, camera or a hybrid device). From initial testing, it has been learnt that careful attention must be given to the systematic storage and labeling of these additional pieces of information so that they can be synchronized with the score card data.
5. Conclusions and Future Work
In this paper, we have presented a novel methodology for the systematic development of a robust and consistent VPA tool, which provides a structured mechanism for quantification of visual pollution at any given location by measuring the presence and characteristics of various VPOs. Since the VPO characteristics have been explicitly quantified, the tool provides the resultant quantitative score representing the level of visual pollution on a scale of 1-100. The incorporation of (diverse) expert opinion makes the methodology robust and suitable for almost all urban areas of Pakistan. Moreover, given the broad coverage of the tool, it is applicable in other parts of the world, especially the developing countries. This VPA tool can help urban planners and government stakeholders to better understand the prevalence of visual pollution, assess its spatial spread, identify primary contributing VPOs per location, take any corrective actions, and (most importantly) inform policy decisions in a robust, quantifiable and evidence-driven manner.
Further to the national and global application of this tool, an interesting future research dimension will be the determination of visual pollution threshold defined by means of public opinion and statistical method. Although the tool has been primarily designed, tested and being implemented in different geographical contexts and it has wide coverage of the VPOs (local, national, international), there is a possibility to upgrade/adapt it, especially for the more developed part of the world where the frame of visual pollution is different from developing countries. In addition to this, the transformation of a paper-based VPA tool into a mobile-based VPA tool is another important area of future work, which will (in itself) lead to further research avenues.
Author Contributions
Conceptualization, K.W., G.A.A., M.A.N.; methodology, K.W., G.A.A., M.A.N., M.Q.H., A.W., and R.N.; software, K.W. and M.Q.H.; validation, K.W., and M.Q.H.; formal analysis, K.W., and M.Q.H.; investigation, A.W., M.J.T.; resources, M.A.N., R.N.; data curation, K.W., and M.Q.H.; writing—original draft preparation, K.W., G.A.A., M.A.N., M.Q.H.; writing—review and editing, A.W., M.J.T., and R.N.; visualization, M.Q.H.; supervision, M.A.N. and R.N.; project administration, K.W. and M.A.N.; funding acquisition, M.A.N and R.N.
Funding
This research received no external funding.
Acknowledgments
We want to thank the anonymous reviewers whose comments and suggestions contributed a lot in the refinement of research methodology and write-up.
Conflicts of Interest
The authors declare no conflict of interest.
References
- UN Habitat. Urbanization and Development Emerging Futures; UN Habitat: Nairobi, Kenya, 2016. [Google Scholar]
- Ogunbodede, E.F.; Sunmola, R. Posters, Banners and Billboards Visual Pollution in Nigerian Urban Environment: Challenges to Urban Managers. IOSR J. Humanit. Soc. Sci. 2014, 19, 56–64. [Google Scholar] [CrossRef]
- Jana, M.K. Visual pollution can have a deep degrading effect on urban and sub-urban community: A study in few places of bengal, india, with special reference to unorganized billboards. Eur. Sci. J. 2015, 7881, 1–14. [Google Scholar]
- Nagle, J.C.; Adler, B.; Appel, P.; Barrett, A.; Bellia, A.J.; Bellia, T.; Cassuto, D.; Dana, D.; Dewey, S.; Garnett, N.; et al. The Idea of Pollution. Environments 2009, 43, 1–78. [Google Scholar]
- Wakil, K.; Hussnain, M.Q.; Waheed, A.; Naeem, A.M. Contextual Review of Outdoor Advertisements: Impacts and Regulatory Practices. Sci. Int. 2016, 1, 531–535. [Google Scholar]
- Choudhary, A. Model to mitigate visual pollution by ads and signage. Int. J. Eng. Res. Gen. Sci. 2016, 4, 516–521. [Google Scholar]
- Nami, P.; Jahanbakhsh, P.; Fathalipour, A. The Role and Heterogeneity of Visual Pollution on the Quality of Urban Landscape Using GIS; Case Study: Historical Garden in City of Maraqeh. Earth Environemntal Sci. 2016, 6, 20–29. [Google Scholar] [CrossRef]
- Azeema, N.; Nazuk, A. Is Billboard a Visual Pollution In Pakistan? Int. J. Sci. Eng. Res. 2016, 7, 862–874. [Google Scholar]
- Muthukrishnan, N. Visual Pollution-More Dangerous than You Think It Is. C.P.R. Environ. Educ. Syst. 2015. Available online: http://cpreec.org/161.htm (accessed on 5 March 2019).
- Chmielewski, S.; Lee, D.J.; Tompalski, P.; Chmielewski, T.J.; Wężyk, P. Measuring visual pollution by outdoor advertisements in an urban street using intervisibilty analysis and public surveys. Int. J. Geogr. Inf. Sci. 2016, 30, 801–818. [Google Scholar] [CrossRef]
- Kamičaitytė-Virbašienė, J.; Godienė, G.; Kavoliūnas, G. Methodology of Visual Pollution Assessment for Natural Landscapes. J. Sustain. Archit. Civ. Eng. 2016, 13, 80–91. [Google Scholar] [CrossRef]
- McMahon, E. Litter on a Stick. Plan. Comm. J. 1998, 45, 123. [Google Scholar]
- Nagle, J.C. Cell Phone Towers as Visual Pollution. Notre Dame JL Ethics Pub. Pol’y 2009, 23, 537. [Google Scholar]
- Elena, E.; Cristian, M.; Suzana, P. Visual pollution: A new axiological dimension of marketing? Ann. Fac. Econ. 2012, 1, 820–826. [Google Scholar]
- Cercleux, A.-L.; Merciu, F.-C.; Merciu, G.-L. A Model of Development Strategy Encompassing Creative Industries to Reduce Visual Pollution—Case study: Strada Franceză, Bucharest’s Old City. Procedia Environ. Sci. 2016, 32, 404–411. [Google Scholar] [CrossRef]
- Parsons, J.A.; Singh, G.; Scott, A.N.; Nisenbaum, R.; Balasubramaniam, P.; Jabbar, A.; Zaidi, Q.; Sheppard, A.; Ramsay, J.; O’Campo, P.; et al. Standardized observation of neighbourhood disorder: Disorderoes it work in Canada? Int. J. Health Geogr. 2010, 9, 1–19. [Google Scholar] [CrossRef]
- Kamali, K.; Tahmouri, P. An Analysis on Urban Beautification and Its Socio-economic Effects. World Appl. Program. 2013, 3, 232–235. [Google Scholar]
- Galea, S.; Ahern, J.; Rudenstine, S.; Wallace, Z.; Vlahov, D. Urban built environment and depression: A multilevel analysis. J. Epidemiol. Community Health 2005, 59, 822–827. [Google Scholar] [CrossRef]
- Jackson, L.E. The relationship of urban design to human health and condition. Landsc. Urban Plan. 2003, 64, 191–200. [Google Scholar] [CrossRef]
- Tobergte, D.R.; Curtis, S. Urban advertising control in commercial streets: The case of Oscar Freire street. In III International Seminar NECC; UNESP: São Paulo, Brazil, 2012. [Google Scholar]
- Edquist, J. The Effects of Visual Clutter on Driving Performance; Monash University: Melbourne, Australia, 2009; p. 226. [Google Scholar]
- Dukic, T.; Ahlstrom, C.; Patten, C.; Kettwich, C.; Kircher, K. Effects of Electronic Billboards on Driver Distraction. Traffic Inj. Prev. 2013, 14, 469–476. [Google Scholar] [CrossRef]
- Wakil, K. A Study of Regulating Advertisement Boards in Lahore; University of Engineering and Technology: Lahore, Pakistani, 2012; pp. 1–70. [Google Scholar]
- Amin, K. Urban quality and designing of spaces Case study for Nasr City, Cairo. In Proceedings of the 38th International Planning Congress, Athens, Greece, 21–26 September 2002; pp. 1–11. [Google Scholar]
- Portella, A.A. Visual Pollution: Advertising, Signage and Environmental Quality; Routledge: London, UK, 2014; ISBN 978-0-7546-7534-1. [Google Scholar]
- Marco, M.; Gracia, E.; Tomás, J.M.; López-Quílez, A. Assessing neighborhood disorder: Validation of a three-factor observational scale. Eur. J. Psychol. Appl. Leg. Context 2015, 7, 81–89. [Google Scholar] [CrossRef] [Green Version]
- Sampson, R.J. Analytic approaches to disorder. Br. J. Sociol. 2009, 60, 83–93. [Google Scholar] [CrossRef]
- Portella, A.A. Evaluating Commercial Signs in Historic Streetscapes: The Effects of the Control of Advertising and Signage on User’s Sense of Environmental Quality; Oxford Brookes University: Oxford, UK, 2007. [Google Scholar]
- Nasar, J.L.; Hong, X. Visual Preferences in Urban Signscapes. Environ. Behav. 1999, 31, 671–691. [Google Scholar] [CrossRef]
- Allahyari, H.; Nasehi, S.; Salehi, E.; Zebardast, L. Evaluation of visual pollution in urban squares, using SWOT, AHP, and QSPM techniques (Case study: Tehran squares of Enghelab and Vanak). Pollution 2017, 3, 655–667. [Google Scholar]
- Karimipour, H.; Mojtahedi, M.; Dehkordi, F.A. Introduction to a quantitative method for assessment of visual impacts of Tehran Towers. J. Soil Sci. Environ. Manag. 2015, 6, 132–139. [Google Scholar]
- Chmielewski, S.; Samulowska, M.; Lupa, M.; Lee, D.J.; Zagajewski, B. Citizen science and WebGIS for outdoor advertisement visual pollution assessment. Comput. Environ. Urban Syst. 2018, 67, 97–109. [Google Scholar] [CrossRef]
- Bankole, O.E. Urban Environmental Graphics: Impact, Problems and Visual Pollution of Signs and Billboards in Nigerian Cities. Int. J. Educ. Res. 2013, 1, 1–12. [Google Scholar]
- Gokhale, V. Examining Impact of Visual Pollution on City Environment: Case Study of Pune, India. Spandrel J. Sch. Plan. Archit. Bhopal 2011, 1, 10. [Google Scholar]
- Kamičaitytė-Virbašienė, J.; Samuchovi, O. Free Standing Billboards in a Road Landscape: Their Visual Impact and Its Regulation Possibilities (Lithuanian Case). Eineerinviron. Res. Eng. Manag. 2013, 4, 66–78. [Google Scholar] [CrossRef]
- Atta, H.A. Visual pollution and statistical determination in some of Karrada district main streets, Baghdad. J. Eng. 2013, 19, 414–428. [Google Scholar]
- Wakil, K.; Hussnain, M.Q.; Naeem, A.M.; Tahir, A. Regulating outdoor advertisement boards; employing spatial decision support system to control urban visual pollution. In Proceedings of the 8th IGRSM International Conference and Exhibition on Geospatial and Remote Sensing, IOP Conference Proceedings, Kuala Lumpur, Malaysia, 13–14 April 2016. [Google Scholar]
- Voronych, Y. Visual pollution of urban space in LVIV. Sp. Form 2013, 309–314. [Google Scholar]
- Ginevicius, R.; Podvezko, V. Objective and Subjective Approaches Determining the Criterion Weights in Multicriteria Models. Transp. Telecommun. 2005, 6, 133–137. [Google Scholar]
- Saaty, T.L. Fundamentals of Decision Making and Priority Theory with the AHP; RWS Publications: Pittsburgh, PA, USA, 1994. [Google Scholar]
- Maggino, F.; Ruviglioni, E. Obtaining weights: From objective to subjective approaches in view of more participative methods in the construction of composite indicators. Proc. NTTS New Tech. Technol. Stat. 2019, 37–46. [Google Scholar]
- Hsu, C.-C.; Ohio, T.; Sandford, B.A. The Delphi technique: Making sense of consensus. Pract. Assess. Res. Eval. 2007, 12, 1–8. [Google Scholar]
- Bramley, T. A rank-ordering method for equating tests by expert judgment. J. Appl. Meas. 2005, 6, 202–223. [Google Scholar] [PubMed]
- Linstone, H.A.; Turoff, M. The Delphi Method; Addison-Wesley: Reading, MA, USA, 2002. [Google Scholar]
- Franek, J.; Kresta, A. Judgment Scales and Consistency Measure in AHP. Procedia Econ. Financ. 2014, 12, 164–173. [Google Scholar] [CrossRef] [Green Version]
- Saaty, R.W. The Analytic Hierarchy Process-What and How it is Used. Math Model. 1987, 9, 161–176. [Google Scholar] [CrossRef]
- Forman, E.H.; Gass, S.I. The Analytic Hierarchy Process—An Exposition. Oper. Res. 2001, 49, 469–486. [Google Scholar] [CrossRef]
- Belton, V. A comparison of the analytic hierarchy process and a simple multi-attribute value function. Eur. J. Oper. Res. 1986, 26, 7–21. [Google Scholar] [CrossRef]
- Verdinelli, S.; Scagnoli, N.I. Data Display in Qualitative Research. Int. J. Qual. Methods 2013, 12, 359–381. [Google Scholar] [CrossRef] [Green Version]
- Ritchie, J.; Lewis, J. Qualitative Research Practice a Guide for Social Science Students and Researchers; SAGE Publications: London, UK, 2013. [Google Scholar]
- Mooney, S.J.; Bader, M.D.M.; Lovasi, G.S.; Teitler, J.O.; Koenen, K.C.; Aiello, A.E.; Galea, S.; Goldmann, E.; Sheehan, D.M.; Rundle, A.G. Street Audits to Measure Neighborhood Disorder: Virtual or In-Person? Am. J. Epidemiol. 2017, 186, 265–273. [Google Scholar] [CrossRef]
- De Vaus, D. Surveys in Social Research, 5th ed.; Routledge: London, UK, 2002; ISBN 0415268575. [Google Scholar]
- Saaty, T.L. Decision making with the analytic hierarchy process. Int. J. Serv. Sci. 2008, 1, 83. [Google Scholar] [CrossRef]
- Kil, S.-H.; Lee, D.; Kim, J.-H.; Li, M.-H.; Newman, G.; Kil, S.-H.; Lee, D.K.; Kim, J.-H.; Li, M.-H.; Newman, G. Utilizing the Analytic Hierarchy Process to Establish Weighted Values for Evaluating the Stability of Slope Revegetation based on Hydroseeding Applications in South Korea. Sustainability 2016, 8, 58. [Google Scholar] [CrossRef]
- Peterson, D.L.; Silsbee, D.G.; Schmoldt, D.L. A case study of resources management planning with multiple objectives and projects. Environ. Manag. 1994, 18, 729–742. [Google Scholar] [CrossRef]
- Al-Harbi, K.M.A.-S. Application of the AHP in project management. Int. J. Proj. Manag. 2001, 19, 19–27. [Google Scholar] [CrossRef] [Green Version]
- Armacost, R.L.; Componation, P.J.; Mullens, M.A.; Swart, W.W. An AHP Framework for Prioritizing Customer Requirements In QFD: An Industrialized Housing Application. IIE Trans. 1994, 26, 72–79. [Google Scholar] [CrossRef]
- Mawapanga, M.N.; Debertin, D.L. Choosing between Alternative Farming Systems: An Application of the Analytic Hierarchy Process. Appl. Econ. Perspect. Policy 1996, 18, 385–401. [Google Scholar] [CrossRef]
- Huang, R.; Yeh, C. Development of an assessment framework for green highway construction. J. Chin. Inst. Eng. 2008, 31, 573–585. [Google Scholar] [CrossRef]
- Goepel, K.D. Implementing the analytic hierarchy process as a standard method for multi-criteria decision making in corporate enterprises—A new AHP excel template with multiple inputs. In Proceedings of the Proceedings of the International Symposium on the Analytic Hierarchy Process, Kuala Lumpur, Malaysia, 23–26 June 2013. [Google Scholar]
Figure 1.
Visual Pollution Assessment (VPA) Tool Development Process.

Figure 2.
Screenshot of AHP sheet reflecting the capturing of pair-wise comparison and formation of a comparison matrix by one expert. A Similar process has been adopted to capture inputs of all panel members.
Figure 2.
Screenshot of AHP sheet reflecting the capturing of pair-wise comparison and formation of a comparison matrix by one expert. A Similar process has been adopted to capture inputs of all panel members.

Figure 3.
Map showing the distribution of sites for piloting of VPA tool and IRR analysis (each blue numbered dot represents one site).
Figure 3.
Map showing the distribution of sites for piloting of VPA tool and IRR analysis (each blue numbered dot represents one site).

Figure 4.
Pictures from the streets of Lahore, Pakistan capturing some key VPOs including outdoor advertisements, poles, hanging and cluttered wires, architecturally poor structures, dilapidated building and encroachments.
Figure 4.
Pictures from the streets of Lahore, Pakistan capturing some key VPOs including outdoor advertisements, poles, hanging and cluttered wires, architecturally poor structures, dilapidated building and encroachments.

Figure 5.
Consolidated AHP matrix generated from individual responses of panel experts.

Figure 6.
Final weights and ranks for VPO groups.

Figure 7.
Mapping of weights assigned to VPO groups by each panel expert.

Figure 8.
Map showing the spatial spread of visual pollution on the 20 assessed sites (heat map color scale from red to green represents highest to lowest visual pollution).
Figure 8.
Map showing the spatial spread of visual pollution on the 20 assessed sites (heat map color scale from red to green represents highest to lowest visual pollution).

Figure 9.
Site wise mean agreement ratio based on inter-observer agreements.


Table 1.
List of studies containing components similar to visual pollution assessment.
| Sr. | Study | Scale | VPOs Coverage | Methods Employed |
|---|---|---|---|---|
| 1 | Visual Preferences in Urban Signscapes [29] | City | Single VPO; Signs | Color Photograph |
| 2 | Evaluating Commercial Signs in Historic Streetscapes: the Effects of the Control of Advertising and Signage on User’s Sense of Environmental Quality [28] | Street | Single VPO; Commercial signs, (outdoor advertisements) | Opinion survey |
| 3 | Evaluation of visual pollution in urban squares, using SWOT, AHP, and QSPM techniques [30] | Neighborhood | Multiple VPOs; Outdoor advertisements, Garbage, Congestion, Graffiti, Absence of green spaces, Building heights | AHP, QSPM, and SWOT (Strengths, Weaknesses, Opportunities, Threats) |
| 4 | Measuring visual pollution by outdoor advertisements in an urban street using inter-visibility analysis and public surveys [10] | Street | Single VPO; Outdoor advertisements | Inter-visibility analysis Public survey |
| 5 | Introduction to a quantitative method for assessment of visual impacts of Tehran Towers [31] | City | Single VPO; Cell Towers | Quantitative, Visibility Analysis using GIS |
| 6 | Visual pollution can have a deep degrading effect on urban and suburban community: a study in a few places of Bengal, India, with special reference to unorganized billboards [3] | District | Single VPO; Billboards | Visual comparisons |
| 7 | Citizen science and WebGIS for outdoor advertisement visual pollution assessment [32] | City | Single VPO; Outdoor advertisements | Opinion survey Visual pollution score Spatial mapping |
| 8 | Urban Environmental Graphics: Impact, Problems and Visual Pollution of Signs and Billboards in Nigerian Cities [33] | City | Single VPO; Billboards | Color photos |
| 9 | Examining Impact of Visual Pollution on City Environment: Case Study of Pune, India [34] | City | Multiple VPOs; Hoardings, Billboards, Dustbins, Utility Wires, Light Poles, Parking | Public Opinion Survey |
| 10 | Free Standing Billboards in a Road Landscape: Their Visual Impact and Its Regulation Possibilities (Lithuanian Case) [35] | State road | Single VPO; Free Standing Boards (FSB) | Orthophoto Maps, Field Survey |
| 11 | Visual pollution and statistical determination in some of Karrada district main streets, Baghdad [36] | Street | Multiple VPOs; Garbage, electric wires, military weapons, demolished buildings, excavation works and rubbles, billboards, etc. | Public Opinion, Statistical Analysis |
| 12 | Regulating outdoor advertisement boards; employing spatial decision support system to control urban visual pollution [37] | Primary road | Single VPO; outdoor advertisement | GIS |
Table 2.
Classification of VPOs in Major VPO Groups.
| VPO Group | VPOs |
|---|---|
| 1. Outdoor Advertisements | 1. Over bright digital signboards |
| 2. Billboards | |
| 3. Political advertisement | |
| 4. Unethical advertisements | |
| 5. Banners | |
| 6. Hanging Steamers | |
| 7. Irregular signboards | |
| 8. Posters | |
| 2. Graffiti/wall chalking | 1. Wall Chalking |
| 2. Graffiti | |
| 3. Open dumps of solid waste | 1. Solid waste dumps |
| 2. Medical waste | |
| 3. Overflowing trash bins | |
| 4. Construction material dumps | |
| 4. Overflown sewerage/drainage | 1. Uncovered manholes |
| 2. Blocked manholes | |
| 3. Standing water in streets | |
| 4. Open sewers | |
| 5. Wide open drains | |
| 5. Architecturally poor structures | 1. Bad building structures, out of proportion |
| 2. Irregular building faces | |
| 3. Uneven and irregular building skyline | |
| 4. Blue water tanks on rooftops | |
| 5. Dish receivers and broken antennas | |
| 6. Dilapidated buildings | 1. Dilapidated buildings |
| 2. Squatter settlements | |
| 3. Poorly maintained structures | |
| 4. Unpainted buildings | |
| 7. Encroachments (temp and permanent) | 1. Roof projections in front houses |
| 2. Uneven ramps | |
| 3. Encroachments (permanent and temporary) | |
| 8. Various poles and transformers | 1. Improper placement of Electricity poles |
| 2. Communication towers | |
| 3. Improper placement and broken/leaning Tel poles | |
| 4. Improper placement and broken TV cable poles | |
| 5. Improper placement and broken street lights | |
| 9. Hanging and cluttered wires | 1. Cluttered Electric, communication and other wires |
| 10. Broken roads/ditches | 1. Broken roads |
| 2. Ditches |
Table 3.
Listing of VPOs Characteristics and Preparation of Rubrics for “Billboards”.
| Characteristics | Rubrics | Assigned Values |
|---|---|---|
| 1. Physical appearance | Structure Broken | 5 |
| Leaning | 4 | |
| Torn off | 3 | |
| Normal | 2 | |
| Very well shaped | 1 | |
| 2. Adjacent land-use | Cultural Heritage | 5 |
| Education | 5 | |
| Open space | 4 | |
| Health | 4 | |
| Religious | 3 | |
| Residential | 2 | |
| Commercial | 1 | |
| 3. Functional hindrance | 1 means no hindrance while 5 means max hindrance | Scale of 1-5 |
| 4. Placement | Standalone | 2 |
| On wall | 3 | |
| On rooftop | 5 | |
| 5. Display Surfaces | Single facing | 1 |
| Double facing (back to back) | 3 | |
| V facing Triangle | 5 | |
| 6. Size | Small | 1 |
| 10X20 | 2 | |
| 20X30 | 3 | |
| 30X40 | 4 | |
| Larger | 5 | |
| 7. Color scheme | Pleasant | 1 |
| Normal | 2 | |
| Irritating | 3 | |
| Disturbing | 4 | |
| Highly disturbing | 5 | |
| 8. View hindrance | 1 means no hindrance while 5 means max hindrance | Scale of 1-5 |
Table 4.
Number of inter-observer agreements.
| Site No. | Total Observations | Combinations of Observer Pairs (O=Observer) | |||||||||
|---|---|---|---|---|---|---|---|---|---|---|---|
| O1/O2 | O1/O3 | O1/O4 | O1/O5 | O2/O3 | O2/O4 | O2/O5 | O3/O4 | O3/O5 | O4/O5 | ||
| 1 | 205 | 178 | 158 | 151 | 190 | 190 | 166 | 169 | 186 | 172 | 167 |
| 2 | 205 | 189 | 176 | 174 | 173 | 160 | 189 | 159 | 167 | 151 | 169 |
| 3 | 205 | 164 | 187 | 180 | 186 | 171 | 153 | 181 | 157 | 179 | 179 |
| 4 | 205 | 182 | 150 | 188 | 190 | 168 | 156 | 153 | 155 | 170 | 165 |
| 5 | 205 | 188 | 175 | 184 | 175 | 155 | 158 | 151 | 190 | 157 | 153 |
| 6 | 205 | 152 | 152 | 187 | 171 | 160 | 168 | 166 | 181 | 164 | 184 |
| 7 | 205 | 158 | 173 | 188 | 187 | 168 | 156 | 163 | 159 | 158 | 184 |
| 8 | 205 | 169 | 169 | 172 | 184 | 171 | 166 | 160 | 152 | 164 | 184 |
| 9 | 205 | 183 | 165 | 179 | 152 | 172 | 179 | 151 | 150 | 154 | 171 |
| 10 | 205 | 174 | 162 | 189 | 154 | 190 | 156 | 177 | 180 | 152 | 186 |
| 11 | 205 | 186 | 183 | 183 | 186 | 171 | 179 | 181 | 157 | 176 | 186 |
| 12 | 205 | 172 | 165 | 177 | 168 | 182 | 167 | 166 | 158 | 170 | 152 |
| 13 | 205 | 182 | 182 | 177 | 165 | 158 | 159 | 164 | 157 | 151 | 184 |
| 14 | 205 | 181 | 190 | 175 | 184 | 169 | 185 | 187 | 181 | 157 | 161 |
| 15 | 205 | 184 | 190 | 169 | 160 | 173 | 157 | 152 | 190 | 178 | 165 |
| 16 | 205 | 165 | 176 | 151 | 152 | 174 | 158 | 155 | 182 | 168 | 186 |
| 17 | 205 | 182 | 163 | 163 | 190 | 163 | 166 | 154 | 151 | 158 | 186 |
| 18 | 205 | 181 | 188 | 167 | 175 | 177 | 188 | 171 | 165 | 160 | 173 |
| 19 | 205 | 173 | 151 | 158 | 153 | 180 | 167 | 160 | 183 | 184 | 160 |
| 20 | 205 | 187 | 179 | 189 | 186 | 172 | 182 | 161 | 155 | 159 | 180 |
© 2019 by the authors. Licensee MDPI, Basel, Switzerland. This article is an open access article distributed under the terms and conditions of the Creative Commons Attribution (CC BY) license (http://creativecommons.org/licenses/by/4.0/).
Share and Cite
MDPI and ACS Style
Wakil, K.; Naeem, M.A.; Anjum, G.A.; Waheed, A.; Thaheem, M.J.; Hussnain, M.Q.u.; Nawaz, R. A Hybrid Tool for Visual Pollution Assessment in Urban Environments. Sustainability 2019, 11, 2211. https://doi.org/10.3390/su11082211
AMA Style
Wakil K, Naeem MA, Anjum GA, Waheed A, Thaheem MJ, Hussnain MQu, Nawaz R. A Hybrid Tool for Visual Pollution Assessment in Urban Environments. Sustainability. 2019; 11(8):2211. https://doi.org/10.3390/su11082211
Chicago/Turabian StyleWakil, Khydija, Malik Asghar Naeem, Ghulam Abbas Anjum, Abdul Waheed, Muhammad Jamaluddin Thaheem, Muhammad Qadeer ul Hussnain, and Raheel Nawaz. 2019. "A Hybrid Tool for Visual Pollution Assessment in Urban Environments" Sustainability 11, no. 8: 2211. https://doi.org/10.3390/su11082211
Note that from the first issue of 2016, this journal uses article numbers instead of page numbers. See further details here.