Cradle-to-Site Carbon Emissions Assessment of Prefabricated Rebar Cages for High-Rise Buildings in China

1
School of Architecture, Nanjing Tech University, Nanjing 211816, China
2
School of Architecture and Built Environment, Deakin University, Locked Bag 20001, Geelong, Victoria 3220, Australia
3
School of Architecture Engineering, Nanjing Institute of Technology, Nanjing 211167, China
4
Department of Architecture, The University of Hong Kong, Hong Kong 999077, China
*
Authors to whom correspondence should be addressed.
Sustainability 2019, 11(1), 42; https://doi.org/10.3390/su11010042
Submission received: 13 November 2018
/
Revised: 14 December 2018
/
Accepted: 18 December 2018
/
Published: 21 December 2018
Abstract
:Construction industrialization is growing rapidly and has received significant attention worldwide in recent years. The industrialization of construction results in several benefits, including the promotion of sustainable construction and the development and application of prefabrication techniques. The Prefabricated Rebar Cage (PRC) is an emerging solution applied to high-rise buildings as a replacement of the In-situ Reinforcing Bar (ISRB) construction method. This paper investigates the cradle-to-site carbon emissions of PRC, and compares the results with those of conventional in-situ rebar construction methods for high-rise buildings. The cradle-to-site cycle is divided into three stages, namely, material preparation, transportation, and on-site construction. For the material preparation stage, it is found that CO2 emissions are increased by 3% when using PRC due to the operation of machinery during the prefabrication process. In the transportation stage, CO2 emissions are found to increase by 3.3 times for PRC, as there is more transportation required for PRCs than for conventional construction methods. During the on-site construction stage, the PRC method demonstrates its advantages by reducing CO2 emissions by 44.7%, which is attributed to decreased hoisting frequency and lower mechanical utilization for fewer joining activities. Overall, CO2 emissions can be reduced by 1.24% by adopting the PRC method for high-rise buildings, and it is therefore recommended to adopt PRCs for this purpose. This research studies carbon emissions of PRC and contributes to promoting the sustainable development of prefabricated building techniques.
1. Introduction
A bulletin, issued by the Ministry of Environmental Protection of the People’s Republic of China (MEP) on December 18, 2016, highlighted the severe environmental problems caused by the heavy pollution in large urban cities located in the central and eastern parts of China, and stated that the average pollutant concentration levels were becoming worse in 71 cities. One of the major environmental problems is attributed to greenhouse gas (GHG) emissions, of which carbon dioxide is the most important anthropogenic contributor [1]. The fifth assessment report of the Intergovernmental Panel on Climate Change (IPCC) states that “if no action is taken, global warming will exceed 4 degrees Celsius” [2]. Meanwhile, in the International Energy Agency (IEA) research report, China has been named as the world’s largest carbon emitter, accounting for approximately 21% of the total global carbon emissions [3]. Being aware of the seriousness of the problem, the Chinese government recently launched the “National Plan for Coping with Climate Change” at the United Nations (UN) Climate Summit held on September 23, 2015, at the UN headquarters in New York, in order to realize the target of reducing carbon emission intensity by 40 to 45 percent by 2020 [4].
As a major contributor to carbon emissions, the Chinese construction industry consumes approximately 40% of total energy resources worldwide, and accounts for nearly 36% of global CO2 emissions [5] and 40% of the global turnover of raw materials [6]. Concrete is an indispensable building material with a global average annual consumption of 1t per capita [7]; it is also recognized as a carbon intensive material. Cement, as the key ingredient of concrete, accounts for 5–7% of global anthropogenic carbon emissions [8]. In China, concrete accounts for the largest proportion of all construction materials. As a result, one of the key ways to reduce carbon emissions of the construction industry is optimizing the construction method of concrete building.
Residential buildings dominate in the global building sector, and thus contribute prodigiously to energy consumption and carbon emissions. For example, residential buildings account for 63% of total energy consumption and 77% of carbon emissions in the European building sector [9]. Residential buildings also take up the greatest proportion of newly-built buildings in China over the past 20 years due to a rapid increase in the size of the urban population. In order to save use the land most efficiently, high-rise buildings have become a typical construction method throughout most of China, with an average height from 18–33 stories (less than 100 m). Li et al. [10] compared the carbon emissions of different types of buildings in China and found that high-rise buildings have the highest carbon emissions per unit of 54.51 kg/m2, and account for 84% of the carbon dioxide emissions produced during the construction of residential communities. As a result, research on carbon reduction in terms of high-rise buildings in China is very necessary.
The Chinese government encourages a variety of construction modes for high-rise buildings [11], including on-site construction and prefabricate construction methods. Though it has been proved that precast concrete technology can lead to lower carbon emission than on-site construction, i.e., about 10% carbon reduction for one cubic meter concrete [12], on-site construction technology is used more in China due to limits in terms of local standards and technological levels. As an important structure composition of modern reinforced concrete construction technology, the industrialization of reinforcements (product diversification, numerically controlled auto-processing and digital product management) represents the advanced direction of on-site construction technology [13,14]. Developed countries have gradually perfected the reinforcement industrialization system since 1990s; for example, more than 80% of construction reinforcement is currently processed and distributed in an industrial way in Singapore [15]. More than 95% of residential buildings in China are built with reinforced concrete structures [16]. The production of construction reinforcements has relied on manual work and simple on-site machinery operation for a long time in China. With the increase of labor costs and the requirements of sustainability, some developed regions in China have been implementing industrialized production and distributing reinforcements since 2004, while the processing and distribution rate of reinforcements is, to date, still very low (10–15%), as it is limited by cost and the availability of technology [15]. The speed of the industrialization of reinforcements has accelerated in the 2010s, and the Chinese building sector had formulated new technical standards of reinforcement industrialization [17]. What’s more, many Chinese construction companies also carry out their own research and development of new reinforcement products, together with a new mode of coordinated development defined as “greenization, industrialization and informationization” [18]. As one of many achievements, a new reinforcement system, the Prefabricated Rebar Cage (PRC), has been introduced to concrete systems. This new reinforcement is an alternative to the rebar cage applied in traditional reinforced concrete for faster and easier construction [19]. Furthermore, PRC shortens the construction schedule and reduces the total construction costs. Shamsai et al. [20] claim that using PRC can lead to an average of 3.6% savings on total project costs, an average of 22.2% savings on total column costs, and 20.4% savings on total project time.
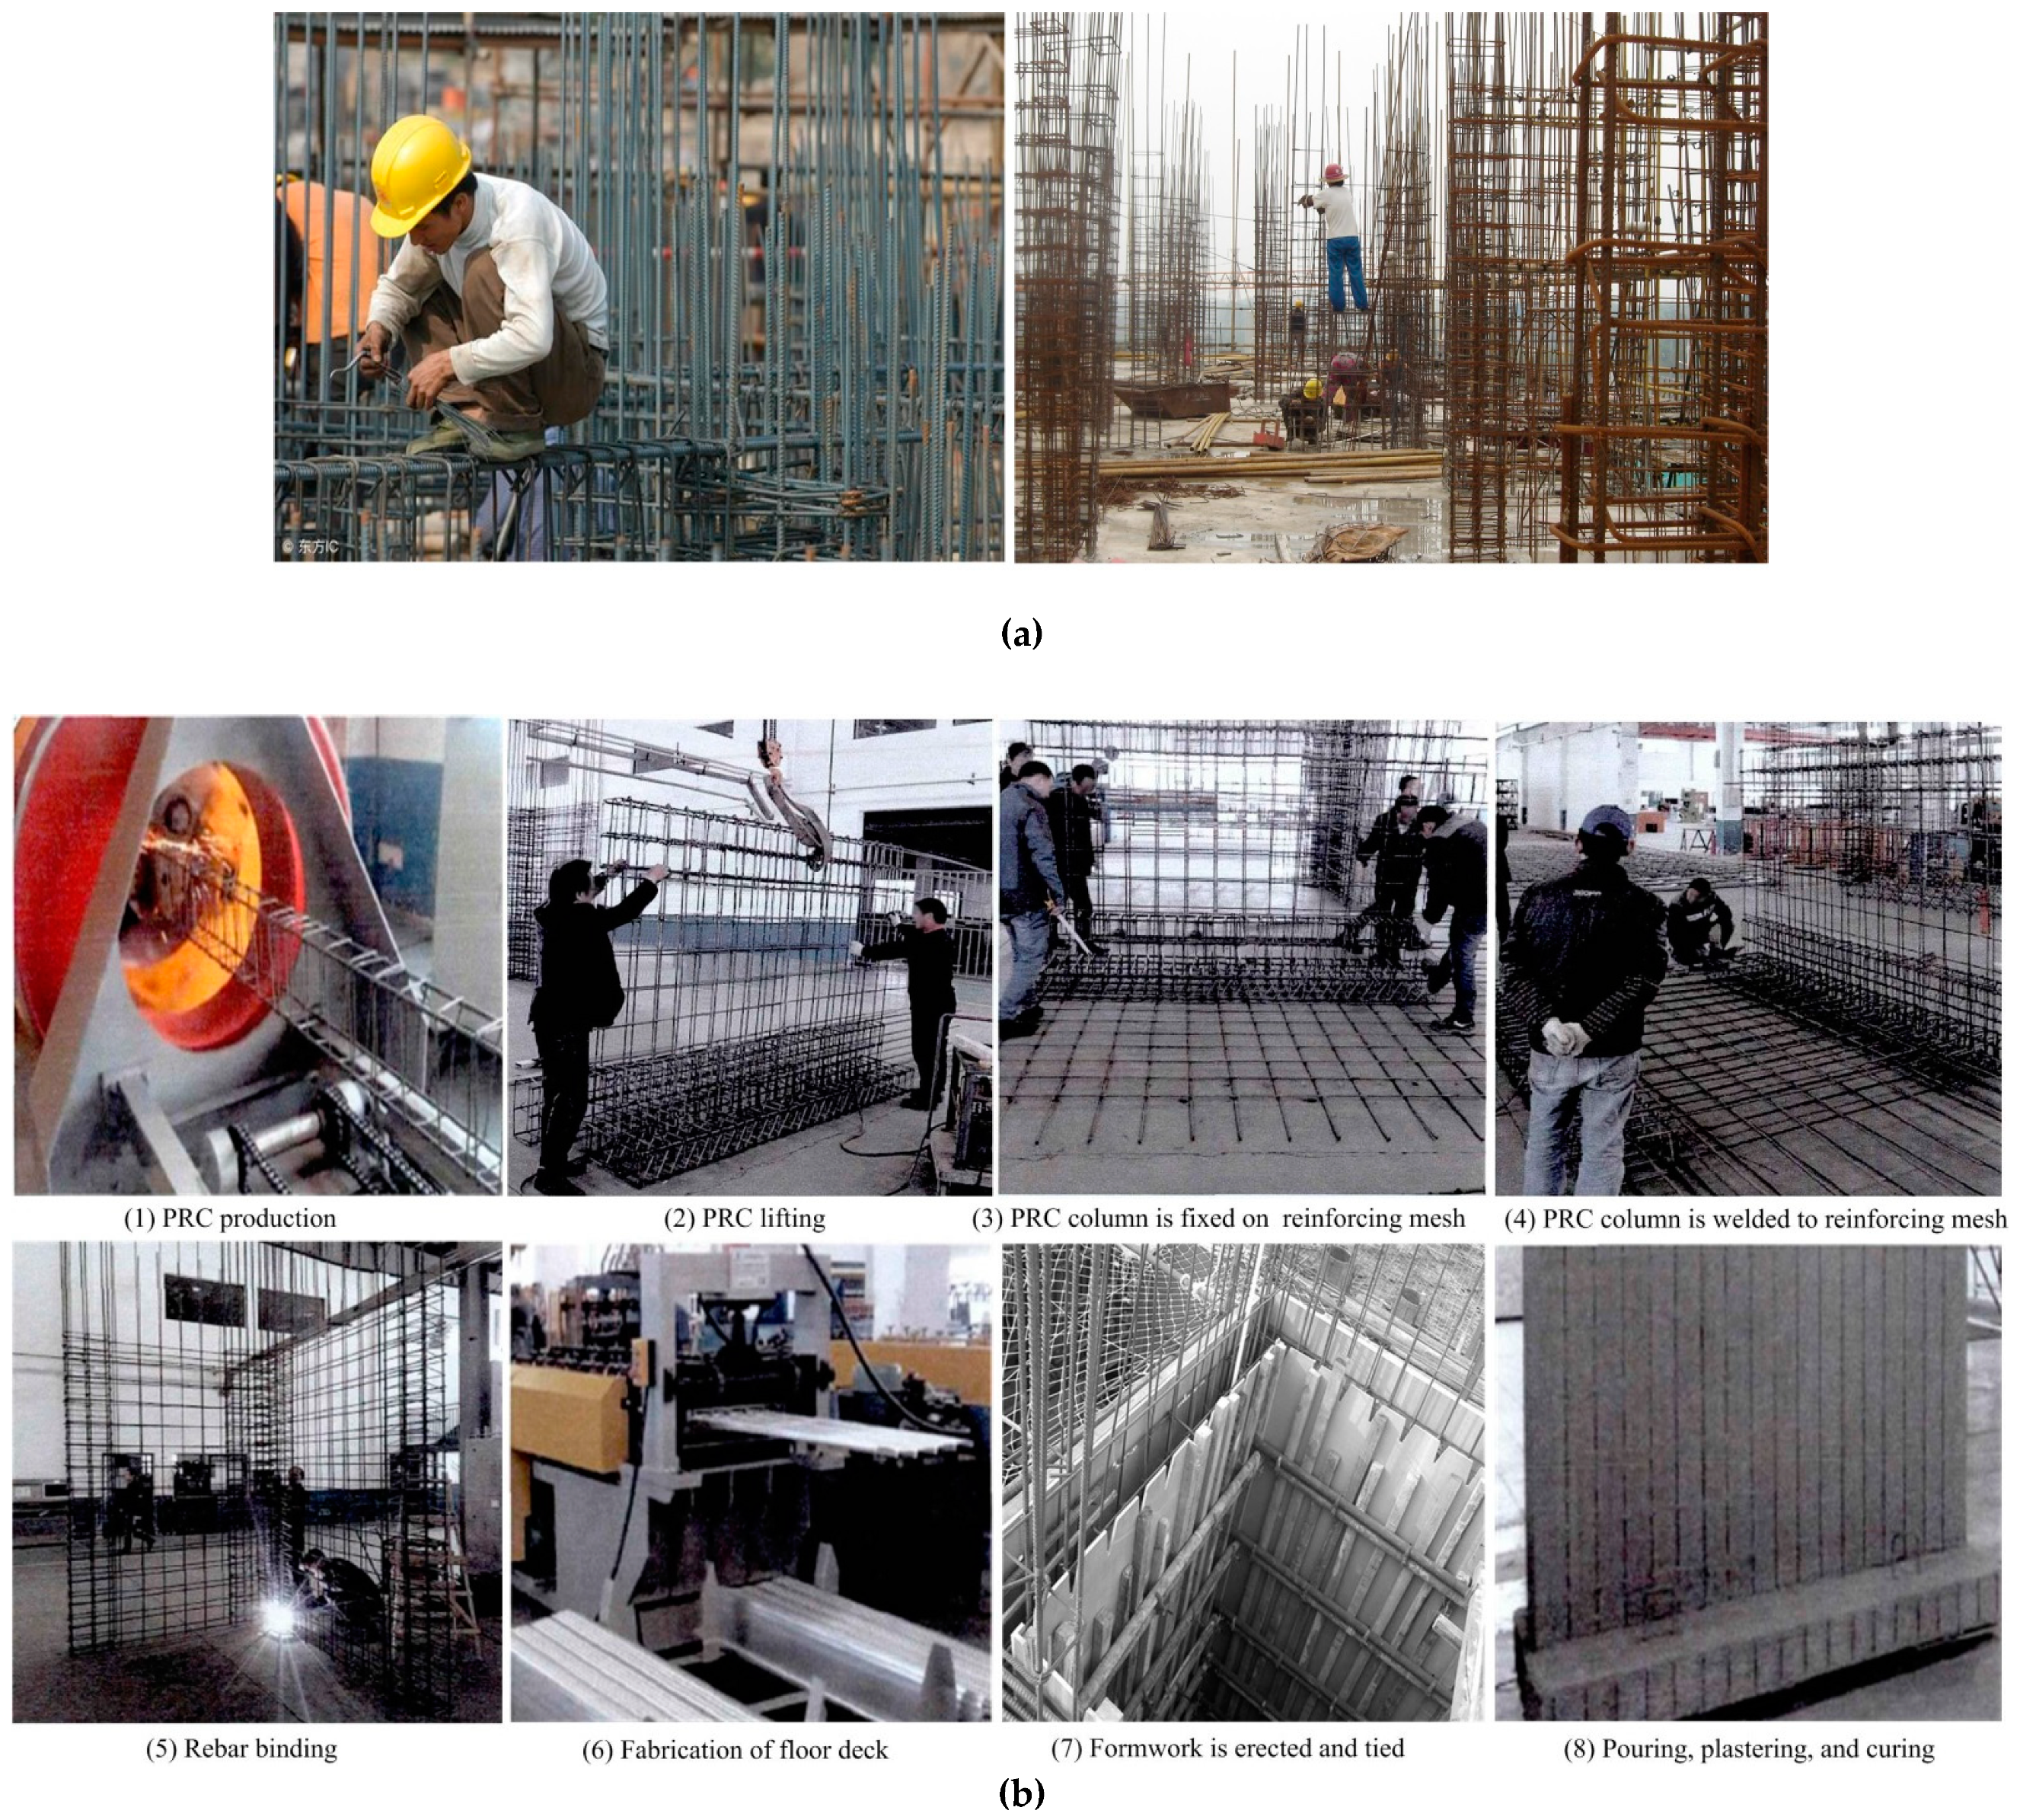
Prefabricated assembly is one of the most important developments in energy-saving buildings, as it can reduce construction waste by 52% and save 70% of timber formwork [21]. With the benefits of low carbon emissions and energy consumption, precast technology has been applied in China for about twenty years. It is generally accepted within the construction industry that precast concrete elements of buildings are manufactured in factories, including those for facades, staircases, garbage chutes, slabs, balconies, kitchens, etc. Almost all indicators and data systems, i.e., prefabricated rate, are also based on precast concrete elements. The limitation of this process is that it restricts the development of industrialized construction technology in the field of reinforcing bars (rebar) on site. For this reason, the technological system for an innovative PRC for the shear walls, floor slabs, and coupling beams can be prefabricated off-site and then transported and placed on site, eliminating the use of extra energy and costly labor associated with cutting, bending, and tying steel bars in traditional rebar construction. The system was applied to a high-rise building located in Nanjing city, as illustrated in Figure 1b. PRC converts the conventional reinforcing bar binding work on-site (see Figure 1a) to precast reinforced welded mesh, especially for shear walls and slabs, in order to increase fully-automatic production and achieve material wastage reductions in the precast yard (see Figure 2b). PRC is a factory-made reinforcement solution which can meet the various requirements of developers through customization. It is fabricated using machines or jigs. The manufacturing process includes mechanical bending, automatic welding, binding and cutting. All the work is completed without using a wire cutter in a factory-controlled environment, as indicated in Table 1.
Compared to current on-site construction methods, a large proportion of on-site work on reinforcements is undertaken by automated manufacturing in factories using PRC systems. As a result, a detailed assessment of the differences will help to find more carbon reduction potential of the new technology and to further promote the industrialization of reinforcement. Life Cycle Assessment (LCA) is a world-wide technique for assessing the potential environmental aspects and potential aspects associated with a product (or service) [22]. LCA involves cradle-to-grave analyses of the full life cycle, from extraction to the disposal phase, while partial LCA considers a partial product lifetime, such as cradle-to-gate, cradle-to-site, etc. Yet, most studies tend to be centered on the full life cycle rather than just the construction phase [23,24,25], as carbon emissions in the operation phase often account for the highest proportion [2]. However, it must be emphasized that the environmental impact caused by CO2 emissions from material production and site construction processes are unlikely to ease off, and may even expand with building life span. Zhang et al. [26] suggested that although the carbon emissions at the operational stage accounted for approximately 82% to 86% of total emissions, the control of carbon emissions during the cradle-to-site life cycle stages also played an important role in relieving environmental pressures. The cradle-to-site life cycle accounts for a significant part of the construction industry, and the construction phase is when most energy and materials are consumed [27,28,29,30]. During this phase, carbon emissions occur during the production, transportation, manufacture, and assembling of the construction components of buildings [31]. The on-site construction method is an important source of carbon emissions, mainly due to the high fuel consumption of heavy equipment for transportation and the energy consumed by manufacturing. As a result, the carbon sources in material, scaffolding equipment, and the workforce should not be overlooked. Wong et al. [32] and Dong et al. [12] compared the carbon emissions of the precast and cast-in-situ method; their research focused on the public and private residential building sectors over the last decade. Foraboschi P. et al. [33] assessed the total energy of tall buildings with reinforced concrete structures, and indicated that the control of the total energy of a structure is of great importance to the sustainability of tall buildings. Kim et al. [34] applied a process-based cradle-to-site life cycle assessment methodology to analyze the environmental impacts resulting from two rebar delivery systems.
According to previous studies, the research of prefabrication focused more on precast concrete components that are finished in the factory. There are few studies on the LCA impact of the system applied with half-precast technology such as the PRC. Therefore, the LCA impact for innovative prefabrication techniques applied to high-rise buildings requires further study; this would help to explore the carbon reduction potential of new construction technology, especially for the cradle-to-site stages. What’s more, comprehensive research to investigate the carbon emission reductions from the use of rebar construction technology through the application of cradle-to-site LCA has yet to be carried out.
In order to assess the LCA impacts of emerging rebar technology, the present research aims to identify the life cycle of PRC structural buildings, to evaluate the environmental performance of innovative PRC technology, to compare carbon emissions for PRC construction technology with the conventional In-situ Reinforcing Bar (ISRB) construction method, and to propose solutions for carbon reductions. The research object is a high-rise building. The Life Cycle Assessment (LCA) method is applied to calculate the “cradle-to-site” carbon emissions. The comparison is based on three stages, i.e., preparation of construction materials stage, transportation stage, and on-site construction stage; three types of structural components, i.e., shear walls, slabs, and beams; three resources, i.e., workforce, material, and machinery; and two scenarios, i.e., ISRB and PRC. The proposed carbon reduction-driven LCA of the innovative rebar technology significantly promotes the sustainability of high-rise buildings.
2. Research Methodology
2.1. LCA Framework
The LCA approach is fundamental in calculating the overall impact in terms of carbon footprint and it is an effective solution for minimising the environmental impact. Figure 3 considers the prefabrication process for PRC components and demonstrates three stages of the cradle-to-site life cycle (materials preparation stage, transportation stage, and on-site construction stage) for a high-rise building. Some studies replace the “materials preparation” by the term “manufacturing”, such as the work by Penadés-Plà et al. [35], but the concept is the same.
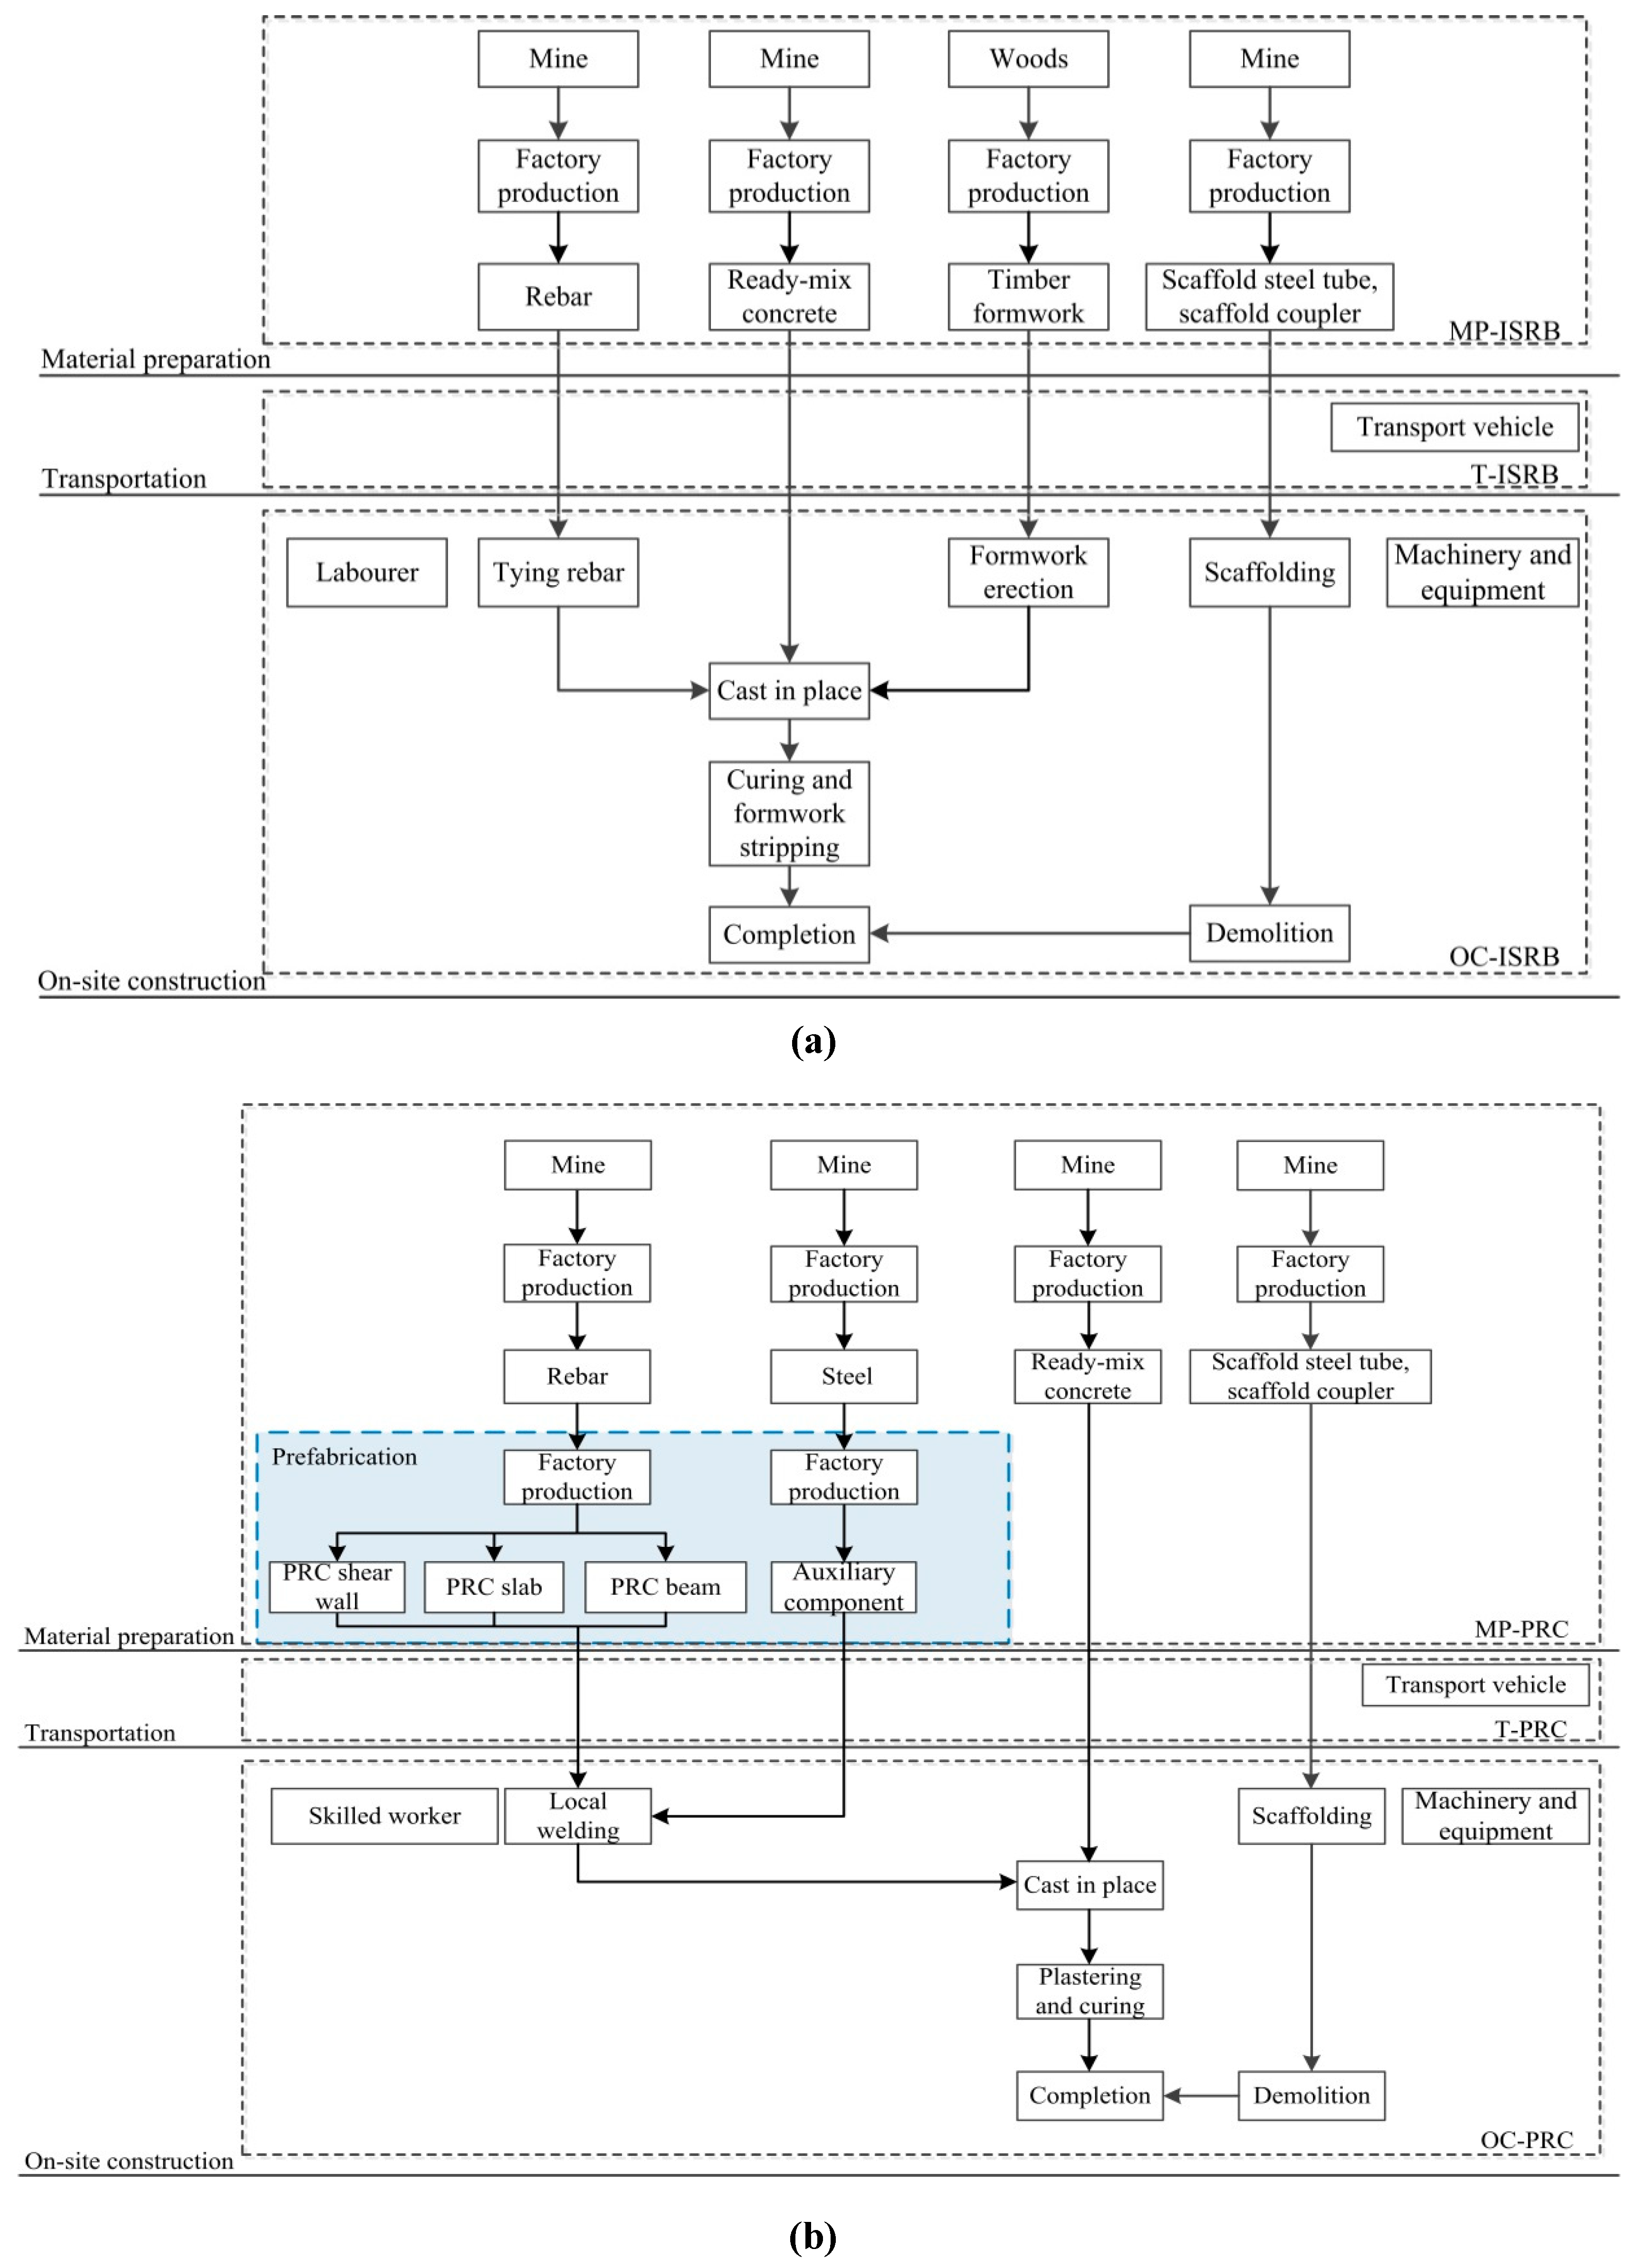
The LCA framework for high-rise buildings is shown in Figure 3. The construction materials preparation stage indicates (i) the conversion of raw materials (mine) to structural components, including reinforcing bar, among others; and (ii) the use of factory-manufactured reinforcing bars to prefabricate rebar cage components (shear wall, floor slab, beam). The transportation stage includes the arrangement of transportation tools, transport distances, and transport loads, all of which are essential factors in the control of carbon emissions for this stage. The main components used during the on-site construction stage are the workforce, machinery, and repetitive use of temporary structure, such as scaffolds; this is a vital stage for the foundation construction and component assembly of the studied high-rise building.
The comparisons between the construction technology for the PRC structure and the ISRB structure are conducted through analysis methods of the LCA framework in order to explore the influence of the PRC construction technology on CO2 emissions control. The comparison scenarios and construction methods of PRC and ISRB are demonstrated in Table 2. The manufacturing process of shear walls using the ISRB and PRC methods is presented in Figure 2a,b. The detailed scenarios and boundaries of the systems are depicted in Figure 3a,b.
2.2. LCA Inventory
In LCA modelling, the combination of specific site data and existing databases is usually inevitable, although the ideal LCA model should be based entirely on specific site data, which requires a considerable amount of time and energy to collect data from stakeholders [22]. As a result, in this work, both data sources are used.
There are various approaches to collect site-specific data, as summarized in Table 3. Documentation was used to gather information about the annual energy consumption for PRC production from the manufacturer. A factory visit was arranged to observe the manufacturing process for PRC, and detailed information about the labor and machining parameters for the studied project was collected. Semi-structured interviews were conducted by the factory manager for further validation of the calculation results.
Various information related to on-site construction work was primarily collected from documentation of the case study project, including overall transportation method, precast yard location, rebar assembling steps and activities, main machinery and equipment, energy sources and consumption, and scaffolding quantities on the construction site. The transportation distance between the factory and construction site for rebar materials and precast rebar elements were estimated using Google maps. The interview from the contractor and subcontractor was conducted to validate the results. Additional information, i.e., stage plans, building and construction drawings, and the developer’s annual report, was collected. The floor layout and design of the PRC were used to calculate the quantities of reinforcing bars for the case study building.
2.2.1. CO2 Emission Factors for Fossil Fuels
The major CO2 emission factors for fossil fuels are available from the authoritative database in China. The CO2 emission factor (EF) is calculated using Equation (1). The net calorific value (NCV) is provided by the General Principles for Calculation of Total Production Energy Consumption (GB/T 2589-2008). Specific carbon contents and oxidation factors can be found in the Provincial Greenhouse Gas Inventory Guidelines (1041 [2011] of the General Office of the Climate Development and Reform Commission). The CO2 emission factor (3.18 kg CO2/kg) for commonly-used diesel oil was listed by Chen C. [36].
EF = NCV × Carbon Content × Oxidation Factor × (44/12)
Referring to CO2 emissions data provided by China’s regional power grid, the CO2 emission factor for electric power of Nanjing (the capital city of Jiangsu province, located on the East China Power Grid) is 0.6826 kg CO2/kWh, as presented by Yin S. C. [37], in accordance with the Provincial Greenhouse Gas Inventory Guidelines (1041 [2011] of the General Office of the Climate Development and Reform Commission).
2.2.2. CO2 Emission Factors for Workers, Material, and Machinery
(1) CO2 emission factors for the workforce
Based on the General Rules for Calculation of National Standard Comprehensive Energy Consumption of the People’s Republic of China (GB2589-81), one kilogram of standard coal is equivalent to 29.27 MJ. The energy consumption of eighteen jobs was statistically analyzed by Yu et al. [38]. Yu proposed that in the construction industry with physical labor, each worker consumed about 1175 kilocalories of energy in 8 h. More specifically, according to the national physical labor intensity grading standards (GB3869-83), Chen et al. [39] found that the average metabolic rate of a worker engaged in rebar-related work, whose body surface area is about 1.5695 m2, is 2.1267 kcal/min·m2. If the net working time in 8 h is 359 min for one rebar worker, 1198.29 kcal of energy is consumed in a day, which is equivalent to 5 MJ when using the conversion factor of 0.00418 MJ per kcal in China. Based on a conversion rate of 3.6 MJ per kWh, one rebar worker will generate 0.95 kg of carbon emissions per working day (8 h).
(2) CO2 emission factors for materials
The emissions data are published in the Chinese Life Cycle Database (CLCD), China Life Cycle Database developed jointly by the School of Architecture & Environment of Sichuan University and Provincial Greenhouse Gas Inventory Guidelines (1041 [2011] of the General Office of the Climate Development and Reform Commission). The CO2 emission factors of major materials published by the Provincial Greenhouse Gas Inventory Guidelines are used in the present study as a main reference (see Table 4).
(3) CO2 emission factors for construction machinery
According to the energy consumption for various machine-shifts provided by the National Unified Expense Quota Items of Construction Machine-shifts, the CO2 emission factors of machinery should be coupled with the fossil fuels database. The carbon emission factors for construction machinery commonly used in China were listed by Yin S. C. [37].
2.3. Life Cycle Impact Assessment
The life cycle impact assessment is a key step in explaining the potential impact of each process, activity, or component of a product on the environment. It is a relative evaluation method based on functional units to provide environmental data or information support to decision makers [41]. The indicator is the carbon dioxide equivalent (CO2 eq). The analysis presented in this paper mainly focuses on fossil-based carbon emissions, as the CO2 emissions from a high-rise building are primarily produced by the combustion of fossil fuels, while other impact categories, such as biogenic carbon and carbon from land transformation, are negligible in this study.
The established analytical framework for the LCA assessment of traditional buildings [26,42] is suitable for the PRC case study. Based on the energy consumption estimated for the prefabrication process, the present research optimizes the current framework. As mentioned before, three phases are defined for the calculation of the cradle-to-site life cycle carbon emissions for a high-rise building, to which a unified Equation (2) can be applied.
where Ects represents the total carbon emissions for PRC construction technology applied to the high-rise building cradle-to-site life cycle; and Em (material preparation emissions), Et (transportation emissions), and Ec (site construction emissions) represent the carbon emissions of the three stages mentioned in Section 2.1, respectively. Specific methods and equations for this concept are presented in the following sections.
2.3.1. Material Preparation Emissions ()
As the same structural design is applied in both construction methods, and similar composition of materials are used for both types of construction, the material embodied emissions (Eme) are not described in detail in the calculation scope when considering prefabrication emissions (Ep). More importantly, since scaffolding can be used repeatedly, the carbon emissions for its preparation should be allocated based on the turnover frequency for each project. In general, steel products can be used 50 to 100 times [43].
where Em represents the carbon emissions for material preparation; Eme represents the material embodied emissions (for material preparation stage which is replaced by product stage “A1–A3” in Annex 57 of the IEA) [44]; and Ep represents the prefabrication emissions, including carbon emissions for prefabricating PRC shear walls, PRC floor slabs, PRC beams, and other auxiliary components, respectively.
As mentioned before, PRC components are fabricated in the precast yard. The carbon emissions of prefabrication depend on the complexity of the manufacturing process. The more that production runs in a standard manner and minimizes specially-shaped components, the greater the reduction of carbon emissions at the prefabrication stage. Structural components are considered as the primary construction materials in the study, while auxiliary components required for on-site construction are also considered, as they have a direct relationship to the construction project. The calculation method for Ep is based on the energy consumption and carbon emission factor of a specific production process, as follows:
where Pa and Pb represent the rated power of the machines used in type a and type b production processes, respectively; Ta and Tb represent the working time of type a and type b production processes, respectively; EFe represents the carbon emission factor of electricity consumption in the precast yard; EFb represents the carbon emission factor of type b energy consumption in the precast yard; and Nc represents the number of all structural components, including shear wall PRC, floor slab PRC, beam PRC, and auxiliary components.
2.3.2. Transportation Emissions ()
The specific process of transportation includes three phases: (1) the first vertical transport or lift from factory to trucks; (2) the horizontal transport from factory to construction site; and (3) the second vertical transport from trucks to construction site. Transportation emissions are primarily dependent on the arrangement of transport planning, including (1) transport equipment with appropriate energy consumption of fuels such as diesel oil; and (2) rational arrangement of transport routes. The equation for transportation emissions () is expressed as
where Ev1 represents the carbon emissions of the first vertical transport, Eh represents the carbon emissions of the horizontal transport, and Ev2 represents the carbon emissions of the second vertical transport. Ev1 and Ev2 can be calculated according to Appendix A (Equation (A1)). Eh can be assessed with reference to the categories of transport method described by Appendix A (Equation (A2)).
It should be noted that due to the same vehicle route for transporting materials and components, phases (1) and (3) are given the same importance, since PRC is produced by rebar manufacturers. The main differences between the two types of materials in phase (2) are related to the volume of materials transported, which is limited by local requirements. PRC components require more cargo space, which results in additional transportation journeys. The loss rate stays low due to the minimal loss quantities.
In China, the typical construction mode of transport is a diesel truck. According to the China Statistical Yearbook [45], the diesel consumption of a loaded diesel truck is L/(t km). Furthermore, trucks are typically empty when returning from construction sites, so their fuel consumption can be assumed to be two-thirds of L/(t km) [46]. Thus, the total fuel consumption for trucks can be calculated as . The energy density of diesel fuel is 0.85 kg/L. Therefore, the synthetic fuel consumption for trucks can be calculated as kg/(t km). Consequently, the carbon emission factor for diesel trucks is kg CO2 /(t km).
2.3.3. On-site Construction Emissions ()
The measurement range of the carbon footprint defined by European Network of Construction Companies for Research and Development (ENCORD) is made up of three components: direct carbon emissions, indirect carbon emissions, and other indirect carbon emissions. According to the classification and calculation method of carbon sources in this standard, carbon source analysis is carried out in the context of construction methods in China. Carbon emissions during the on-site construction stage, Ec, primarily consist of two parts: direct space carbon emissions (Ei1) and indirect space carbon emissions (Ei2). The detailed equation is as follows:
Direct space carbon emissions mainly come from energy consumption during the construction process. This analysis, with large amounts of process data, is closely related to site building activity such as connecting joints. Ei1 can be determined as follows:
where represents carbon emissions for all construction procedures in the conventional construction method; n represents the total number of construction process types; Pj represents the rated power of the machines used in type j construction process; Tj represents the working time of type j construction process; EFj represents the carbon emission factor of type j energy consumption on the construction site.
As for the prefabrication method, CO2 emissions () during the assembly process for a high-rise building can be accurately computed according to the site data collection. As a result, the carbon emissions of assembly machinery for joining, welding, and cutting can be assessed effectively during the on-site construction phase.
where represents carbon emissions for all construction procedures applying with the prefabrication method; Ql represents the quantity of type l joints for an assembly component; Pl represents the rated power of the machines used in type l assembly process; Tl represents the unit working time of type l assembly process such as joining, welding, cutting of type l joint; and EFec represents the carbon emission factor of electricity consumption in the construction area. According to Equation (5b), the quantity of joints and the joining, welding, bending, and cutting time are critical factors for carbon emissions control during the site construction stage. Decreasing the quantity of joints and optimizing the assembly process for PRC construction technology are the two primary methods to achieve improved assembly efficiency.
Indirect space carbon emissions (Ei2) are emitted in the staging area around the building, where vehicles, equipment, or material are assembled or processed before use. The analysis of this process data is indirectly related to the site building activity. The emissions include three components, namely, transport vehicles on the construction site (Etc), construction machinery operation (Eo), and provisional measures (Epr). Accordingly, Ei2 can be described by the following equation:
Truck operations and diesel for transport vehicles can be assessed effectively on site, and the carbon emissions attributed to electricity can be directly calculated or estimated according to the project budget. As in Equation (4), Etc represents transport vehicles on the construction site. Moreover, the carbon emissions for provisional measures (Epr), including lighting and power supply, can be estimated based on energy consumption records of high-rise building construction projects.
represents the carbon emissions for machinery operation used for the second processing of materials or components on a designated location. can be accurately calculated according to the site data. For both ISRB and PRC construction methods, the process emissions (Em−p) are equal for Equation (5a) and Equation (5b). Elift represents the carbon emissions from the operation of machinery used for lifting materials or components.
represents the carbon emissions from lifting all materials in the conventional construction method; n represents the total number of lifting process types; Pg represents the rated power of the lifting machines used for type g material; and Tg represents the working time for the lifting process of type g material.
As for the prefabrication method, Pc represents the rated power of the machinery used in the component lifting process; Tc represents the working time for the component lifting process; and EFec represents the carbon emission factor of electricity consumption on the construction site. In China, the machine-shift is normally defined as an 8-h shift per day for the operation of machinery. According to in-situ construction data statistics, the material was lifted and transported between 1.1 and 1.6 times per m2 [47] in relation to building function, lifted load, floor height, and lifting position.
Generally, the carbon emissions from the workforce are rarely considered in the general carbon emission measurement of buildings; however, the carbon emissions from the workforce should be included in the LCA inventory considering the large number of workers on site. The workforce can be categorized as laborers and the skilled workers. A detailed equation for Ewk can be expressed as
where Ewk represents the carbon emissions of workers with basic construction skills; n represents the total number of material types; represents the quantity of workers for a unit volume of type i material; Ci represents the volume of type i material in the construction process; and EFwk represents the carbon emission factor of worker energy consumption for the RC construction method. In the case of the PRC method, carbon emissions during the construction process can be accurately estimated based on the site workforce records. As a result, the workforce emissions () are calculated using the following equation:
represents the carbon emissions from skilled workers with industrial assembly techniques on the construction area; represents the quantity of trained workers for a unit volume of structural components; Cc represents the volume of structural components; and represents the carbon emission factor for skilled workers’ energy consumption using the PRC construction method.
3. Case Study
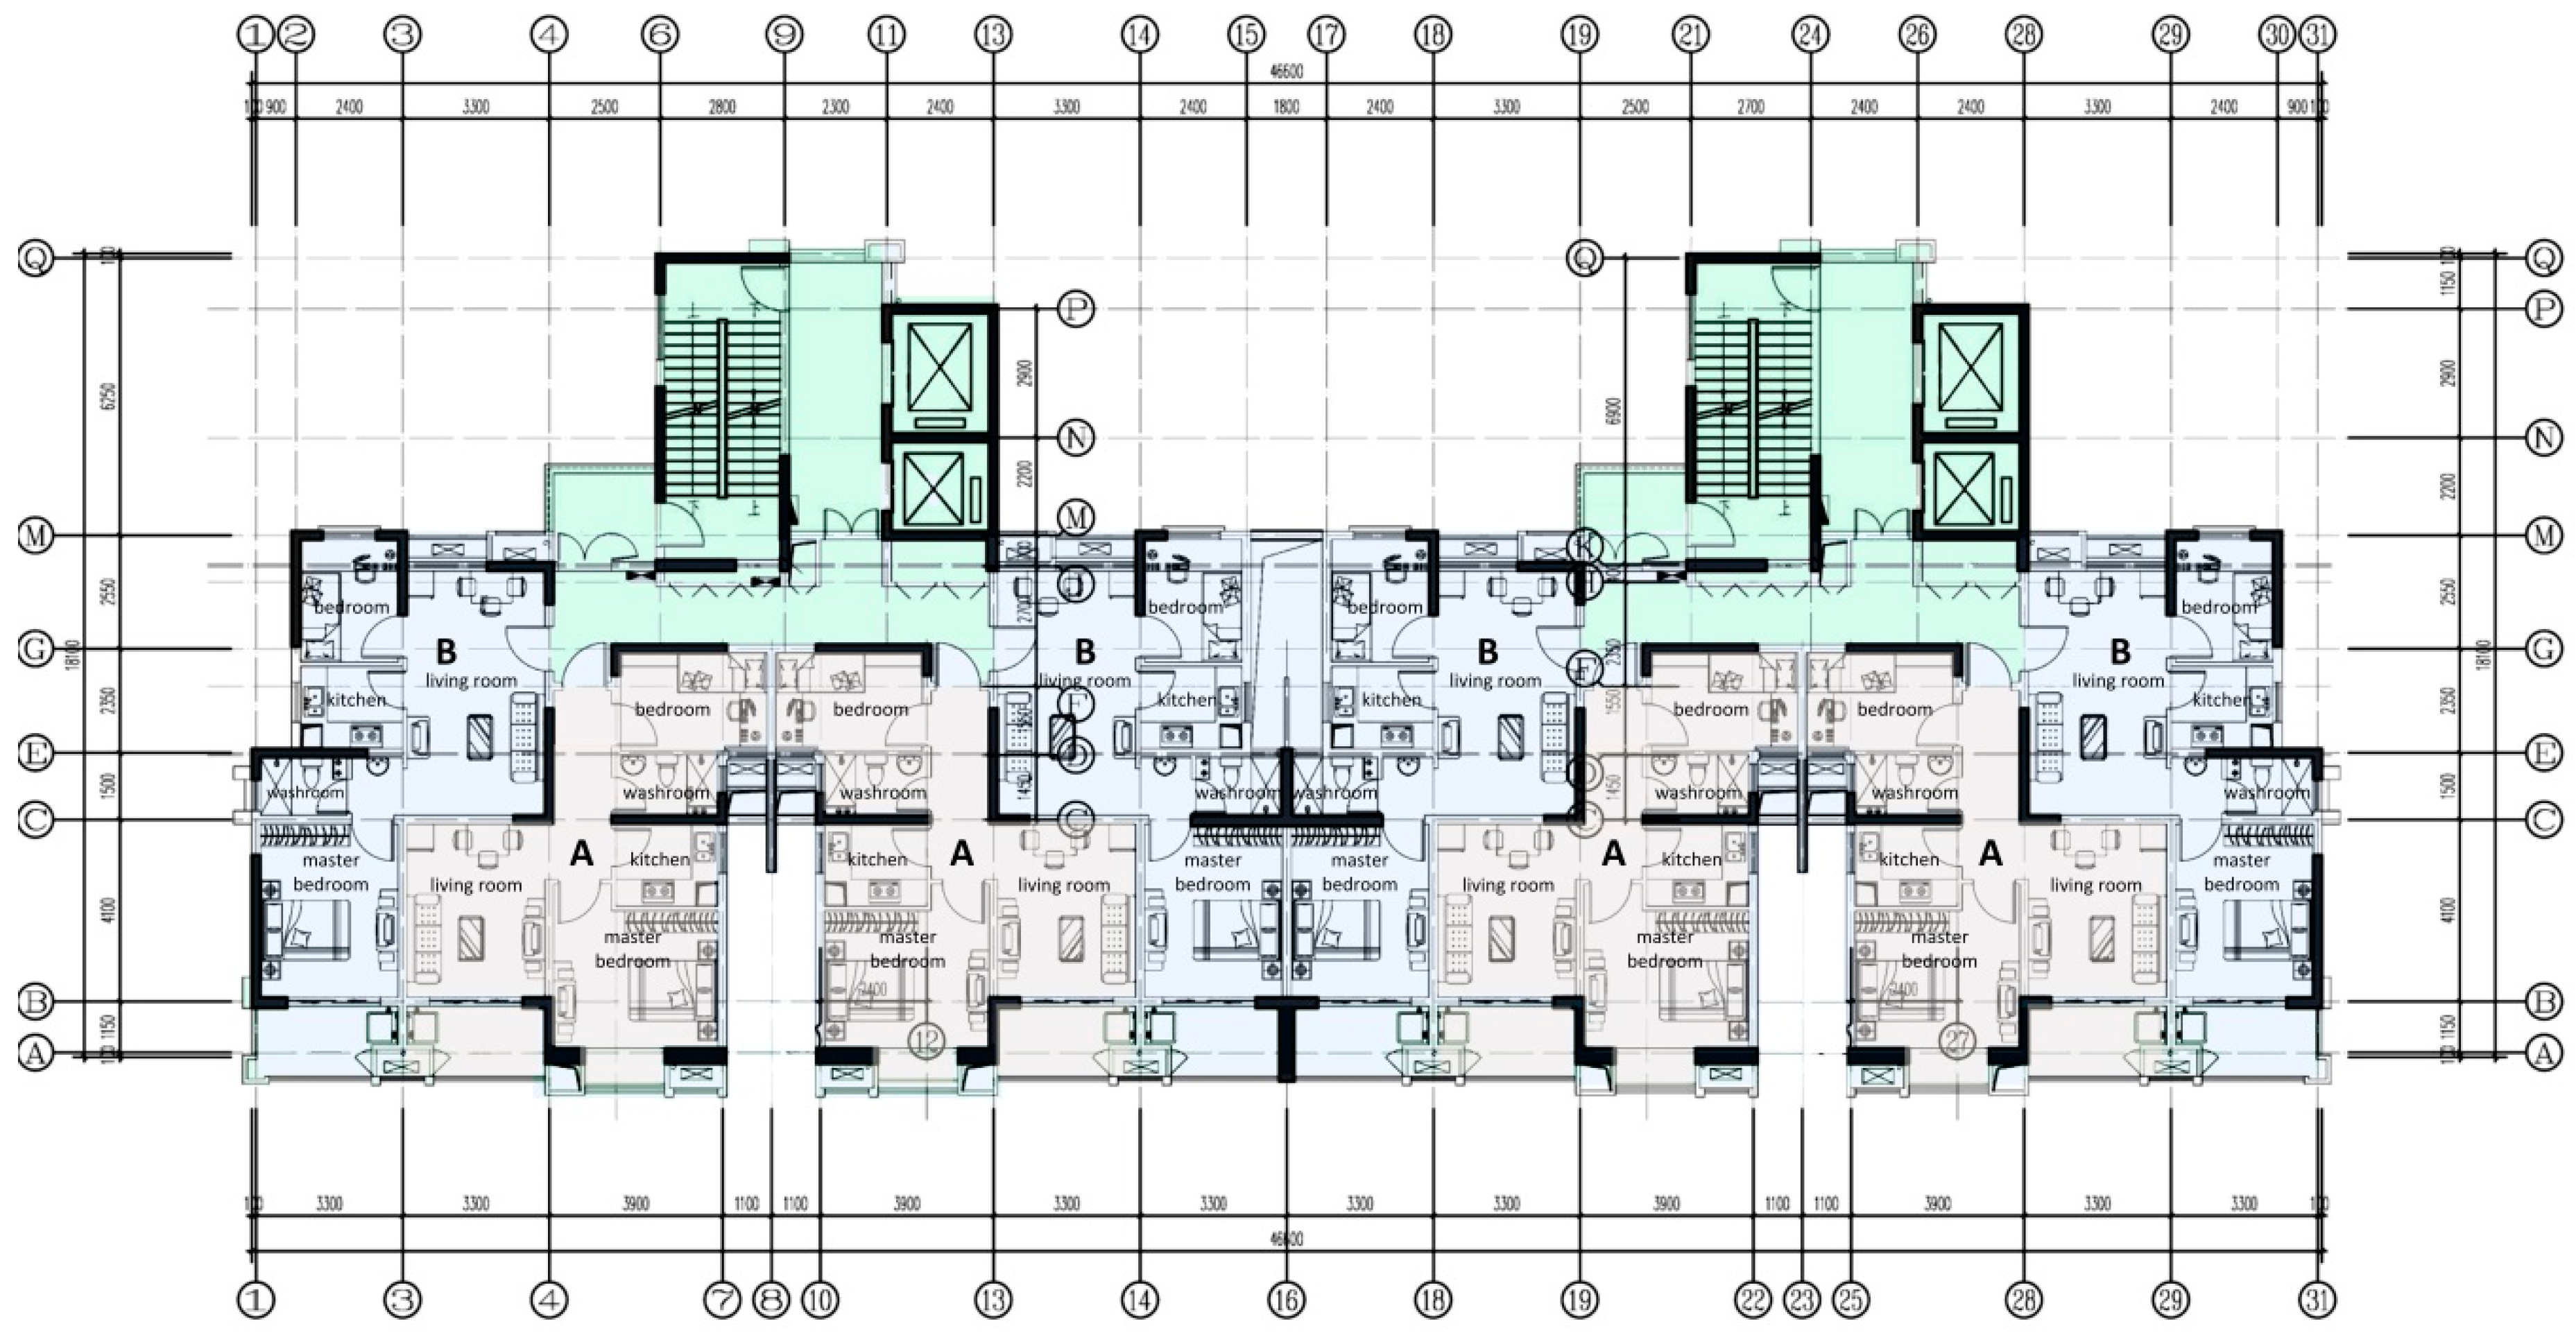
A 27-storey high-rise building in Nanjing, non-seismic area in China, is used as a case study for the proposed research framework, and to compare the carbon emissions from PRC and cast-in-situ RC. This project has a gross floor area (GFA) of 16,360 m2, with 8 apartment units per floor. The layout plan of a typical floor is displayed in Figure 4. The project adopts PRC for the modular construction of structural elements including shear walls, slabs, and beams.
The processes for ISRB and PRC construction methods (refer to Section 2.1 for the description of methods) are different (see Table 1), as demonstrated in Figure 2a,b. For the ISRB method, this study considers the initial stages of raw material preparation and material production, transportation, and on-site construction. In order to obtain the required structural strength, the cast-in-situ concrete is produced by tying reinforcing bars (rebar) and casting concrete in a timber formwork after the assembly of scaffolding.
The PRC method follows the construction process of the traditional ISRB structure. The precast yard is situated in Nanjing, Jiangsu Province, China. PRC structure component processing is conducted in the ISRB material production factory, including reinforcing mesh and customized floor deck, which are transported to the construction site for assembling and in-situ casting. For the floor slabs, the concrete mix, the PRC parallel truss, and precast reinforcing meshes are then poured into the mold on site. The site installation process includes the local welding of PRC trusses to the longitudinal and transverse reinforcements in a staging area around the building.
During the first stage, the model is set up to compare the two construction methods based on the materials required for all floors. The set-up for MP-ISRB (material preparation for in-situ reinforcing bar) differs from that for MP-PRC (material preparation for prefabricated rebar cage) in relation to the processing of the materials (Table 5). In the prefabrication process, the automatic rebar tying machine is driven by battery, which has a charging current of less than 100 mA; thus, the energy consumption can be negligible. Moreover, unlike traditional 2D parallel trusses, 3D rebar trusses have better stress performance and can be produced by automatic machinery.
Scenario MP-ISRB also includes the interior and exterior scaffolding, while scenario MP-PRC includes the first mentioned of the two. In the case study, 1393 kg of steel tubes and 270 kg of steel couplers for double-pole scaffolding were utilized for a unit area of 100 m2. The detailed scaffolding material is given in Table A1 of the Appendix B. As scaffolding can be used repeatedly, its turnover frequency for each project should be taken into consideration when calculating the carbon emissions.
During the second stage, the model is set up to analyze the influence of the energy consumption of machinery used for transporting ISRB materials and PRC components. Transportation distances are estimated using Google maps. The rated loads of the machinery and transport distances remain unchanged for the hypothetical scenarios. Proper load securement to ensure the safe transportation of building materials is based on the data collected for cast in-situ construction. The transportation details are provided in Table 6.
During the site construction phase, the model is set up to compare the two methods based on workforce and machinery in a site-controlled environment. Scenario OC-ISRB is hypothetical to replace the PRC construction method with ISRB. The consumption of electricity and fuel is then revised based on the data collected from cast in-situ construction. As a result, the difference of the construction technology between the ISRB and the PRC structure regarding the three types of main components stated above can be reflected. Table 7 and Table 8 provide the set-up for the three structural components, as well as the parameters for the workforce and machinery. Site construction emission inputs are listed in Table A2 of the Appendix B. Table 9 provides the set-up for the machinery lifting of scaffolding.
The model structure of LCA is designed according to the components and the supply chain for high-rise housing in Nanjing city. The model structure is further validated by LCA experts through several rounds of meetings.
4. Results
4.1. Assessment of Material Preparation Emissions ()
4.1.1 Assessment of Carbon Emissions of Scaffolding () Considering Reuse
In the case study, 1393 kg of steel tubes and 270 kg of steel couplers for double-pole scaffolding were used for a unit area of 100 m2. The quantity of scaffold materials used in the high-rise building case study is provided in Table A1 of the Appendix B.
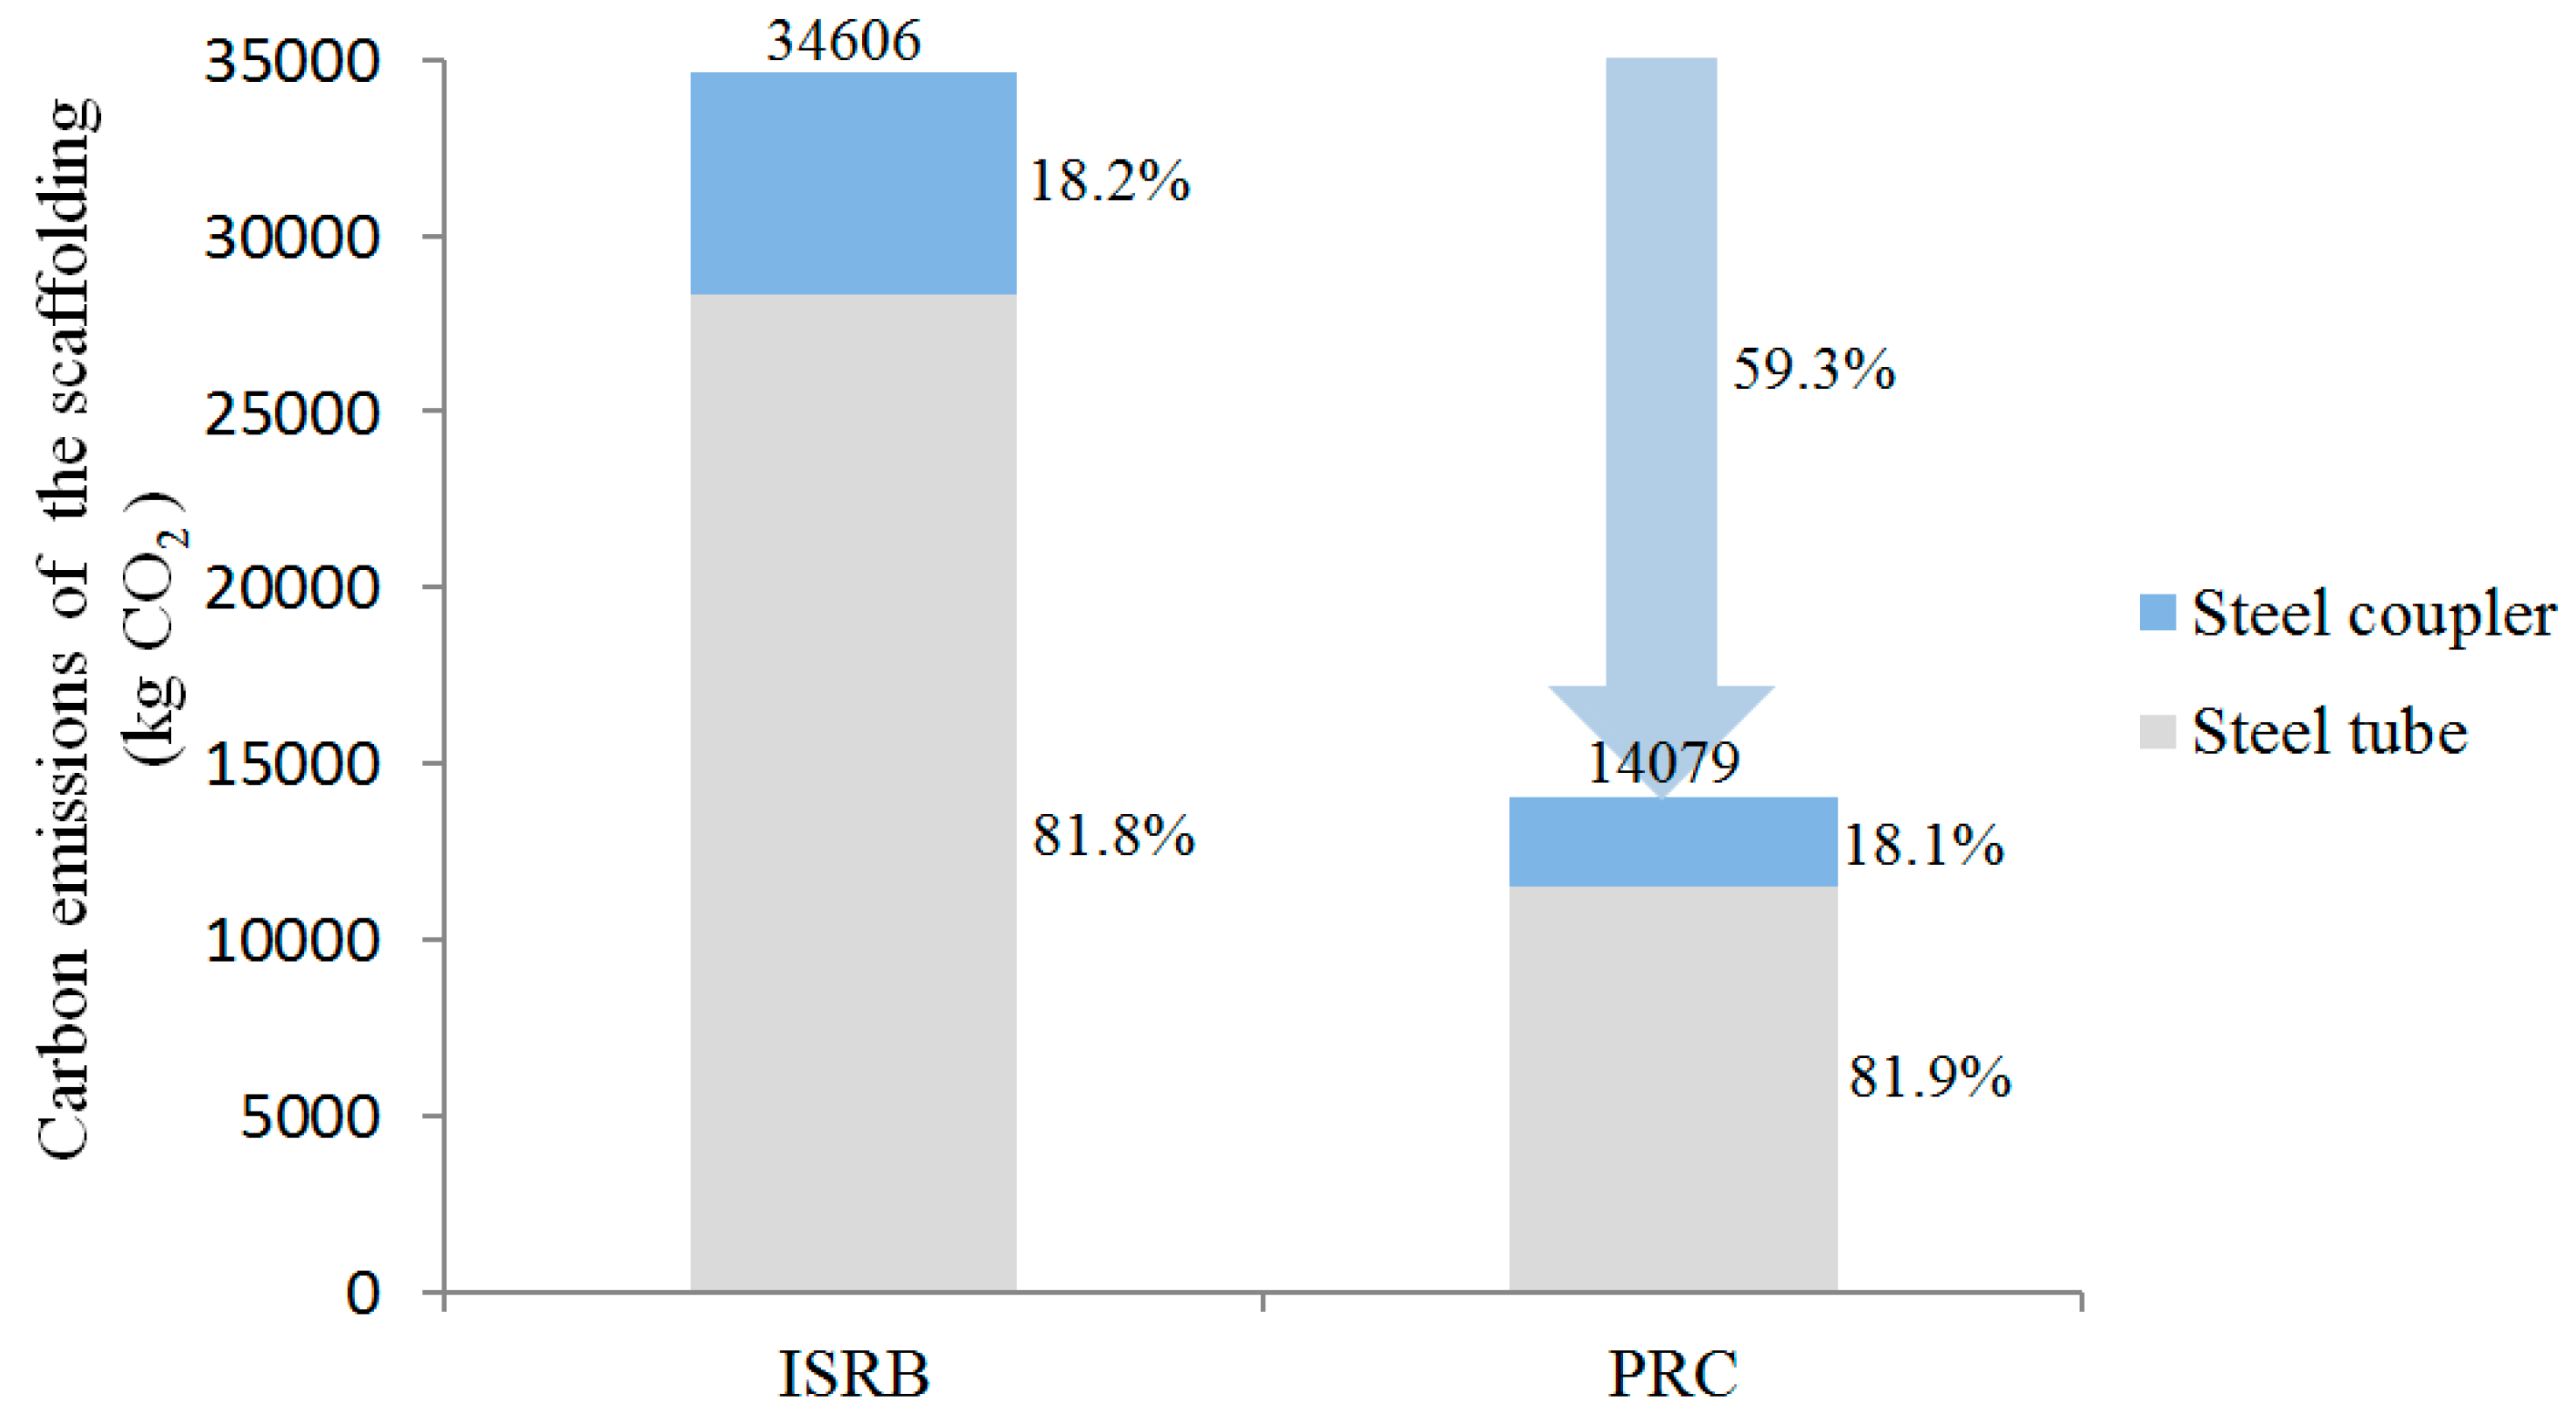
The scaffold could be reused 100 times. Based on site data collection, it is estimated that the material wastage rate for steel tubes is 1.8% and 3% for scaffold couplers. For the ISRB method, therefore, it is demonstrated that steel scaffold tubes emit 28,325 kg CO2 and scaffold couplers emit 6281 kg CO2, while the figure for the PRC structure is only 11,525 kg CO2 and 2555 kg CO2, respectively, which is approximately 59.3% lower than that for the ISRB method (see Figure 5). This is mainly because no exterior scaffolding was used.
4.1.2 Assessment of Prefabrication Emissions ()
The quantities of raw material for the two types of structures are similar. The differences in the material embodied emissions (Eme) are, at best, minimal. This is not a real concern. In relation to the prefabrication process, the PRC shear walls, slabs, and beams need to be fabricated in a weather-resistant precast yard. PRC is a factory-made reinforcement solution in the form of a cage which facilitates the modular construction of structural elements on site. With the benefit of mechanized mass production, controlled bending and welding operations can be carried out by trained specialists in a factory-controlled environment. What’s more, customized PRC components can be detailed to suit site conditions and complexity, coupled with experienced technical workers.
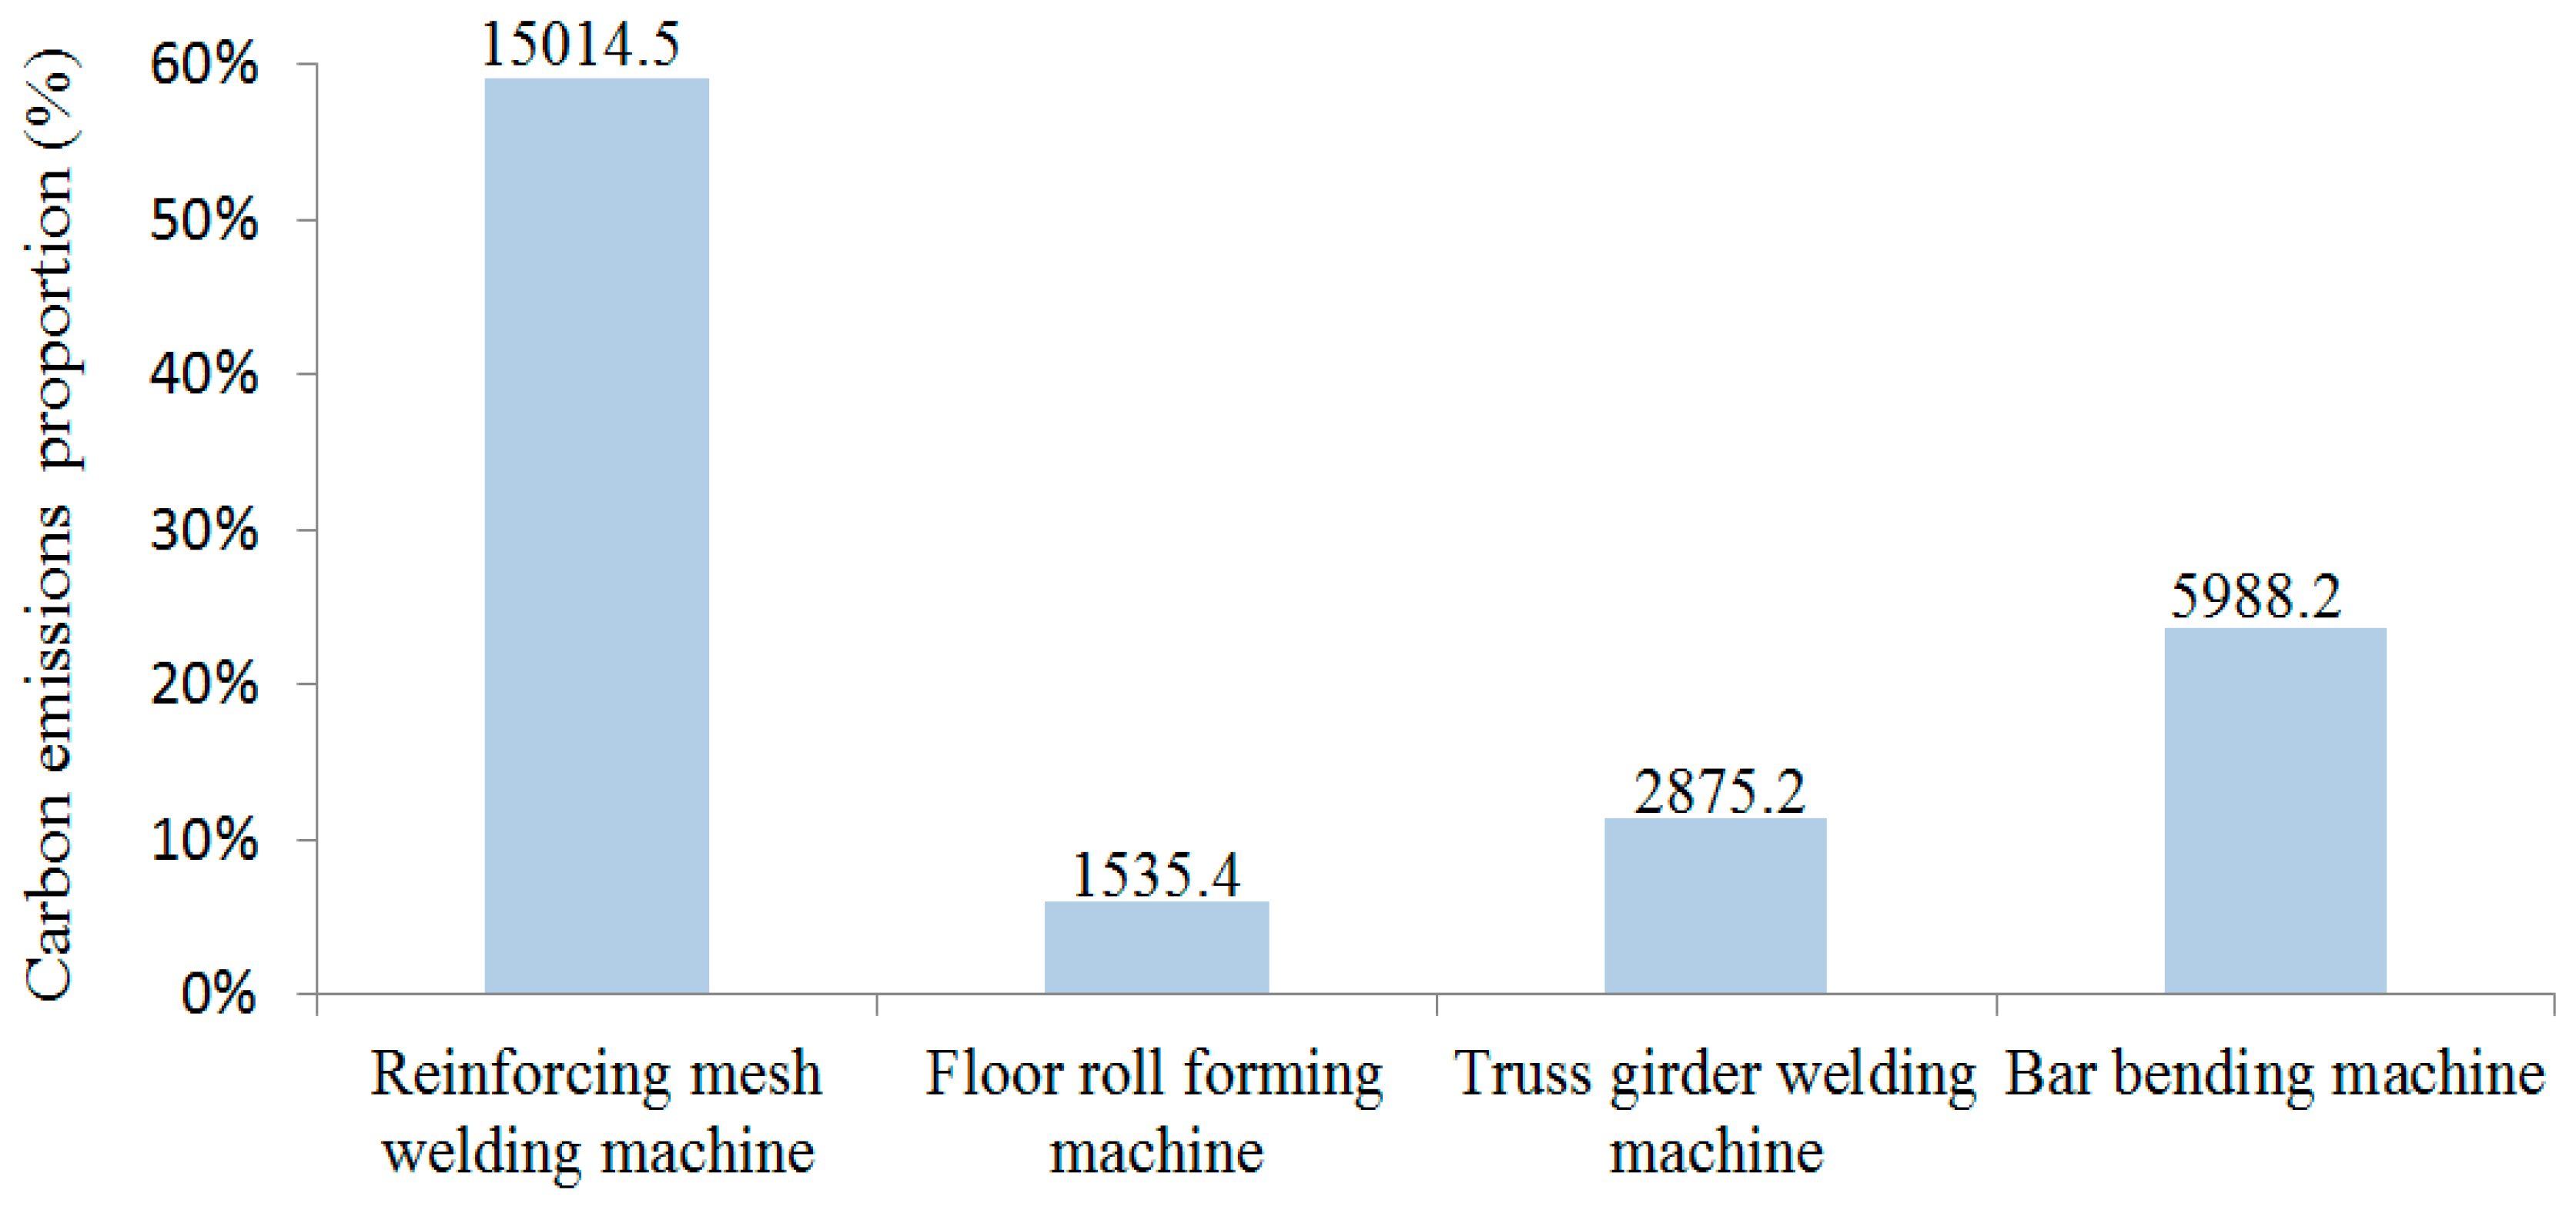
For customized mass production, energy consumption primarily comes from machinery operation. Therefore, total prefabrication CO2 emissions (Ep) are estimated according to the electrical power consumption. As illustrated in Figure 6, PRC manufacturing during the preparation stage emits 25,413 kg CO2, among which, 59.1% (15,014 kg CO2) are produced by reinforcing mesh welding and 23.6% (5988 kg CO2) is contributed by the operation of the bar bending machine. In comparison, CO2 emissions emitted from the operation of the truss girder welding machine and floor roll forming machine are responsible for 11.3% and 6.0% of the total emissions, respectively, while the difference in carbon emissions emitted by the other operations is less significant.
Consequently, the negative environmental impact in mechanical prefabrication processes of PRC systems should be considered in addition to the positive impact. For instance, the systems promote low carbon emissions of manpower. In a factory, waste and unqualified products can be processed locally, which indirectly reduces the consumption of machinery, manpower and materials caused by waste disposal after the completion of construction.
4.2. Assessment of Transportation Emissions ()
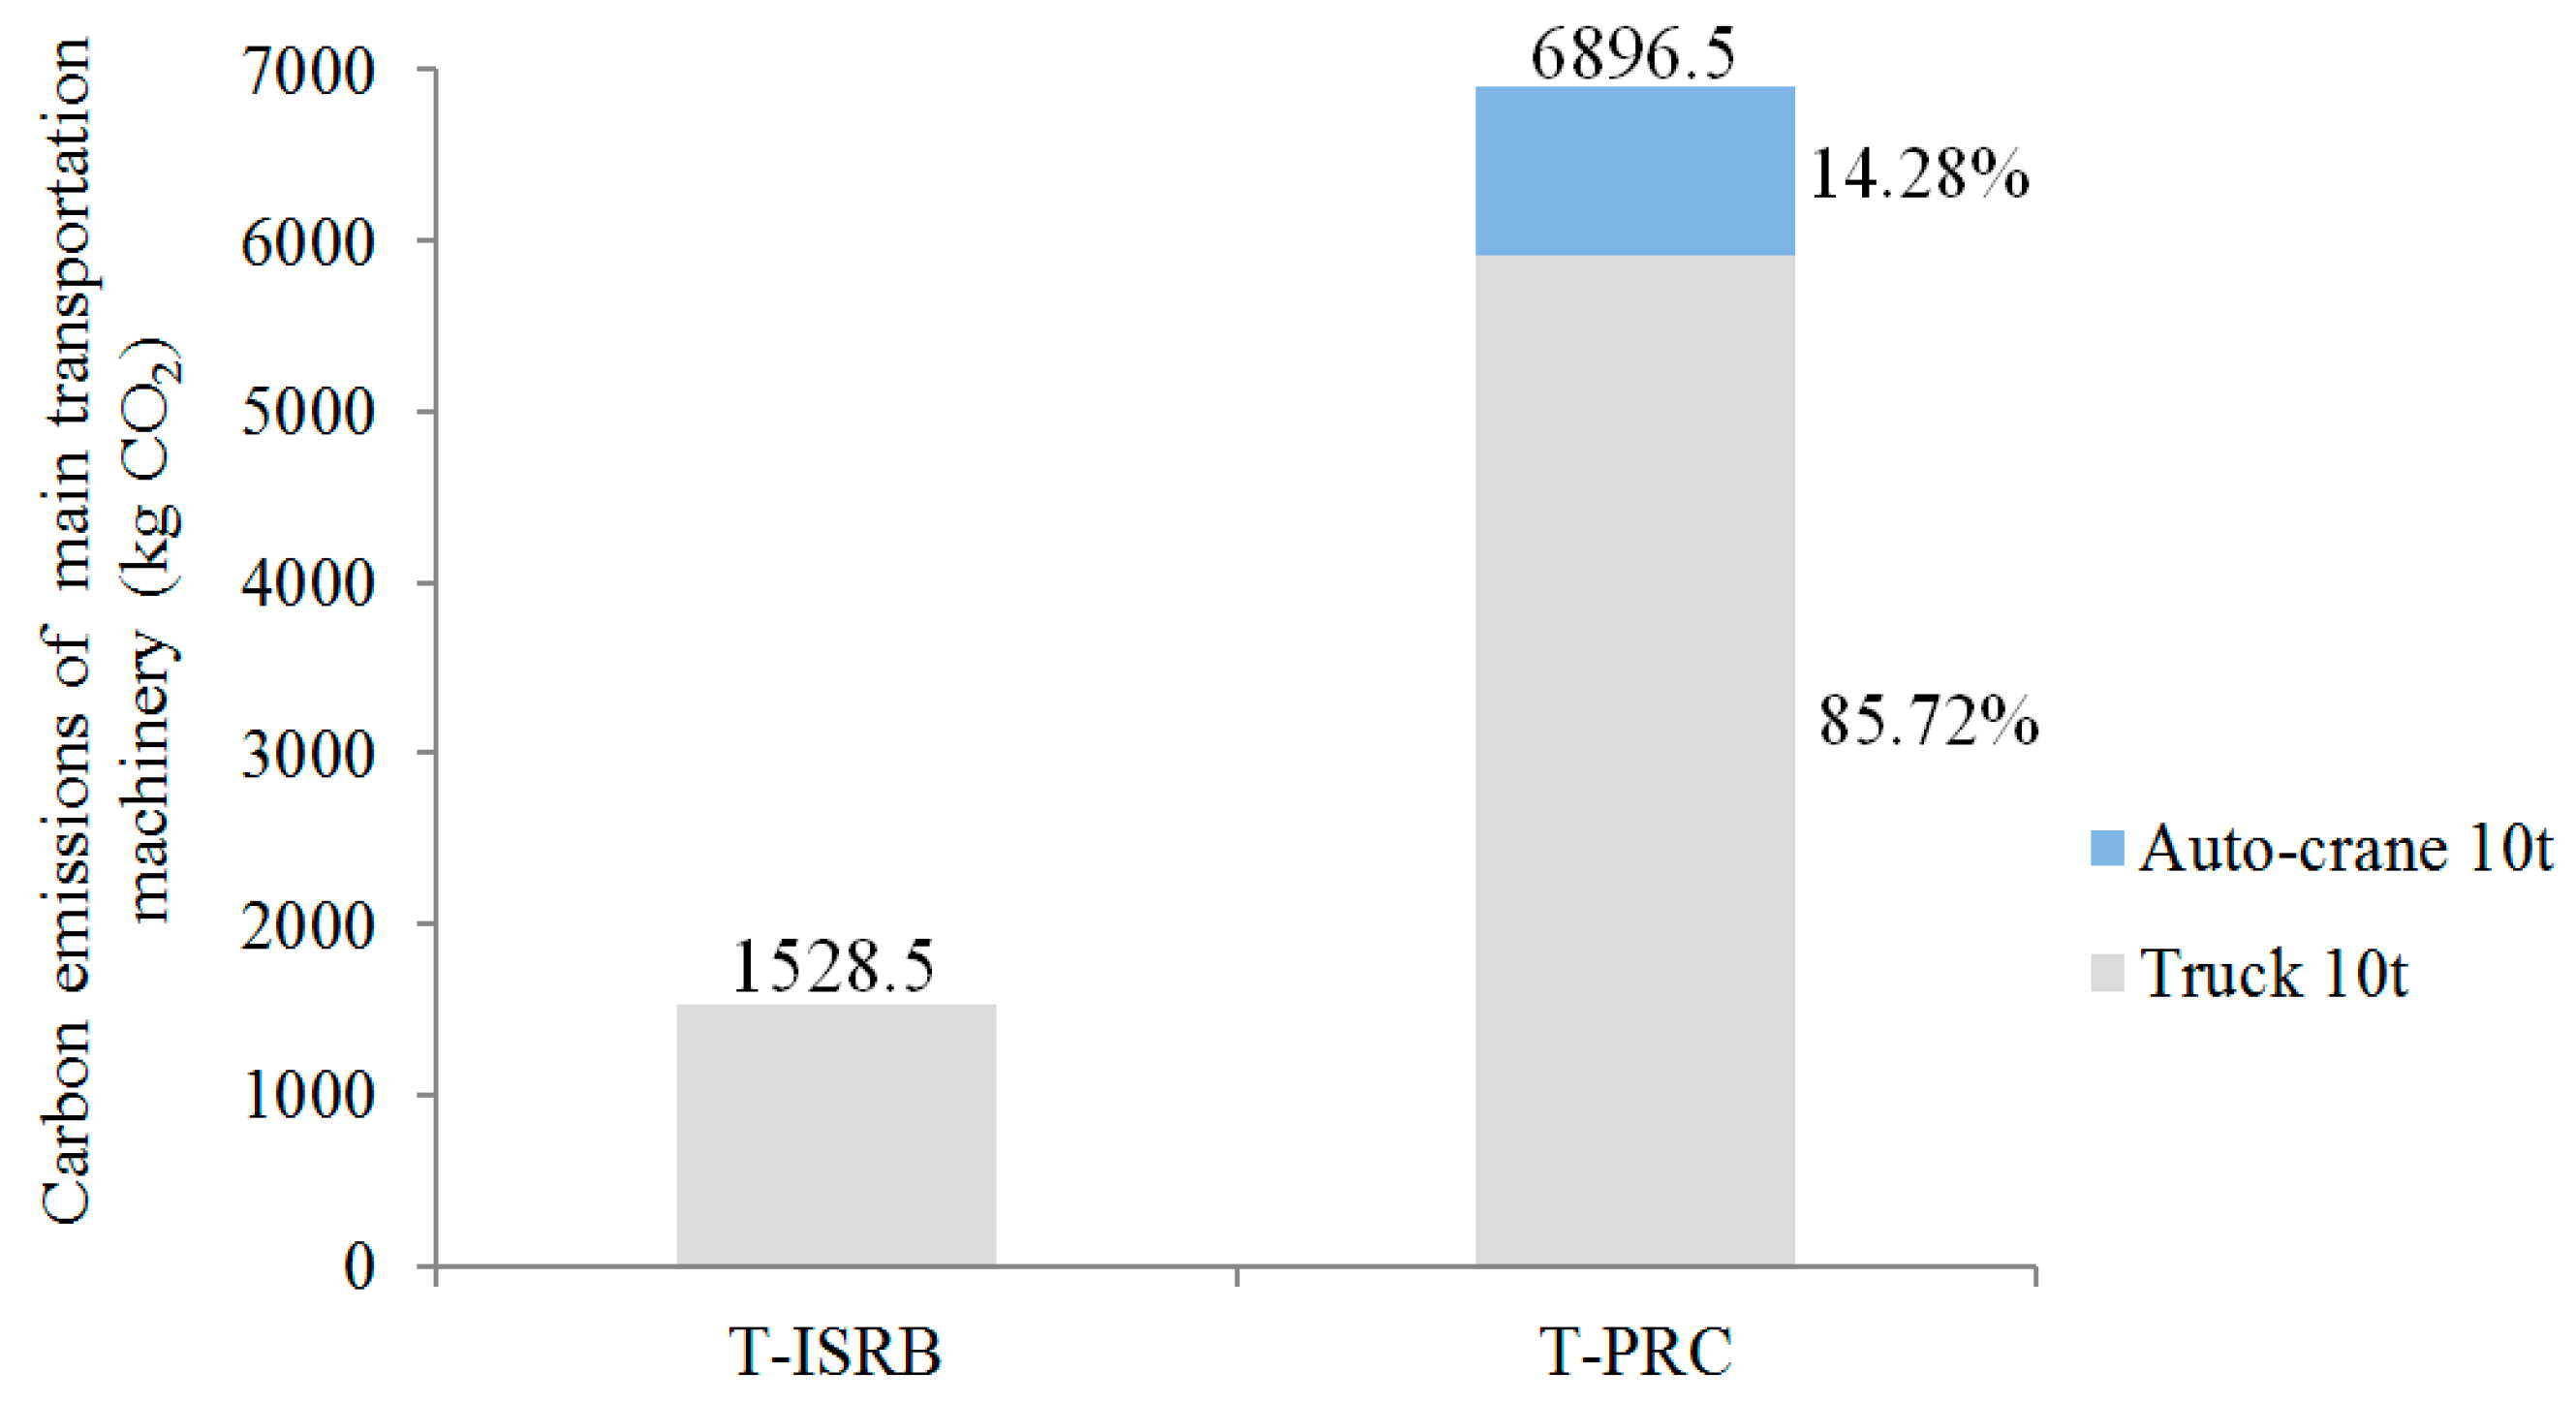
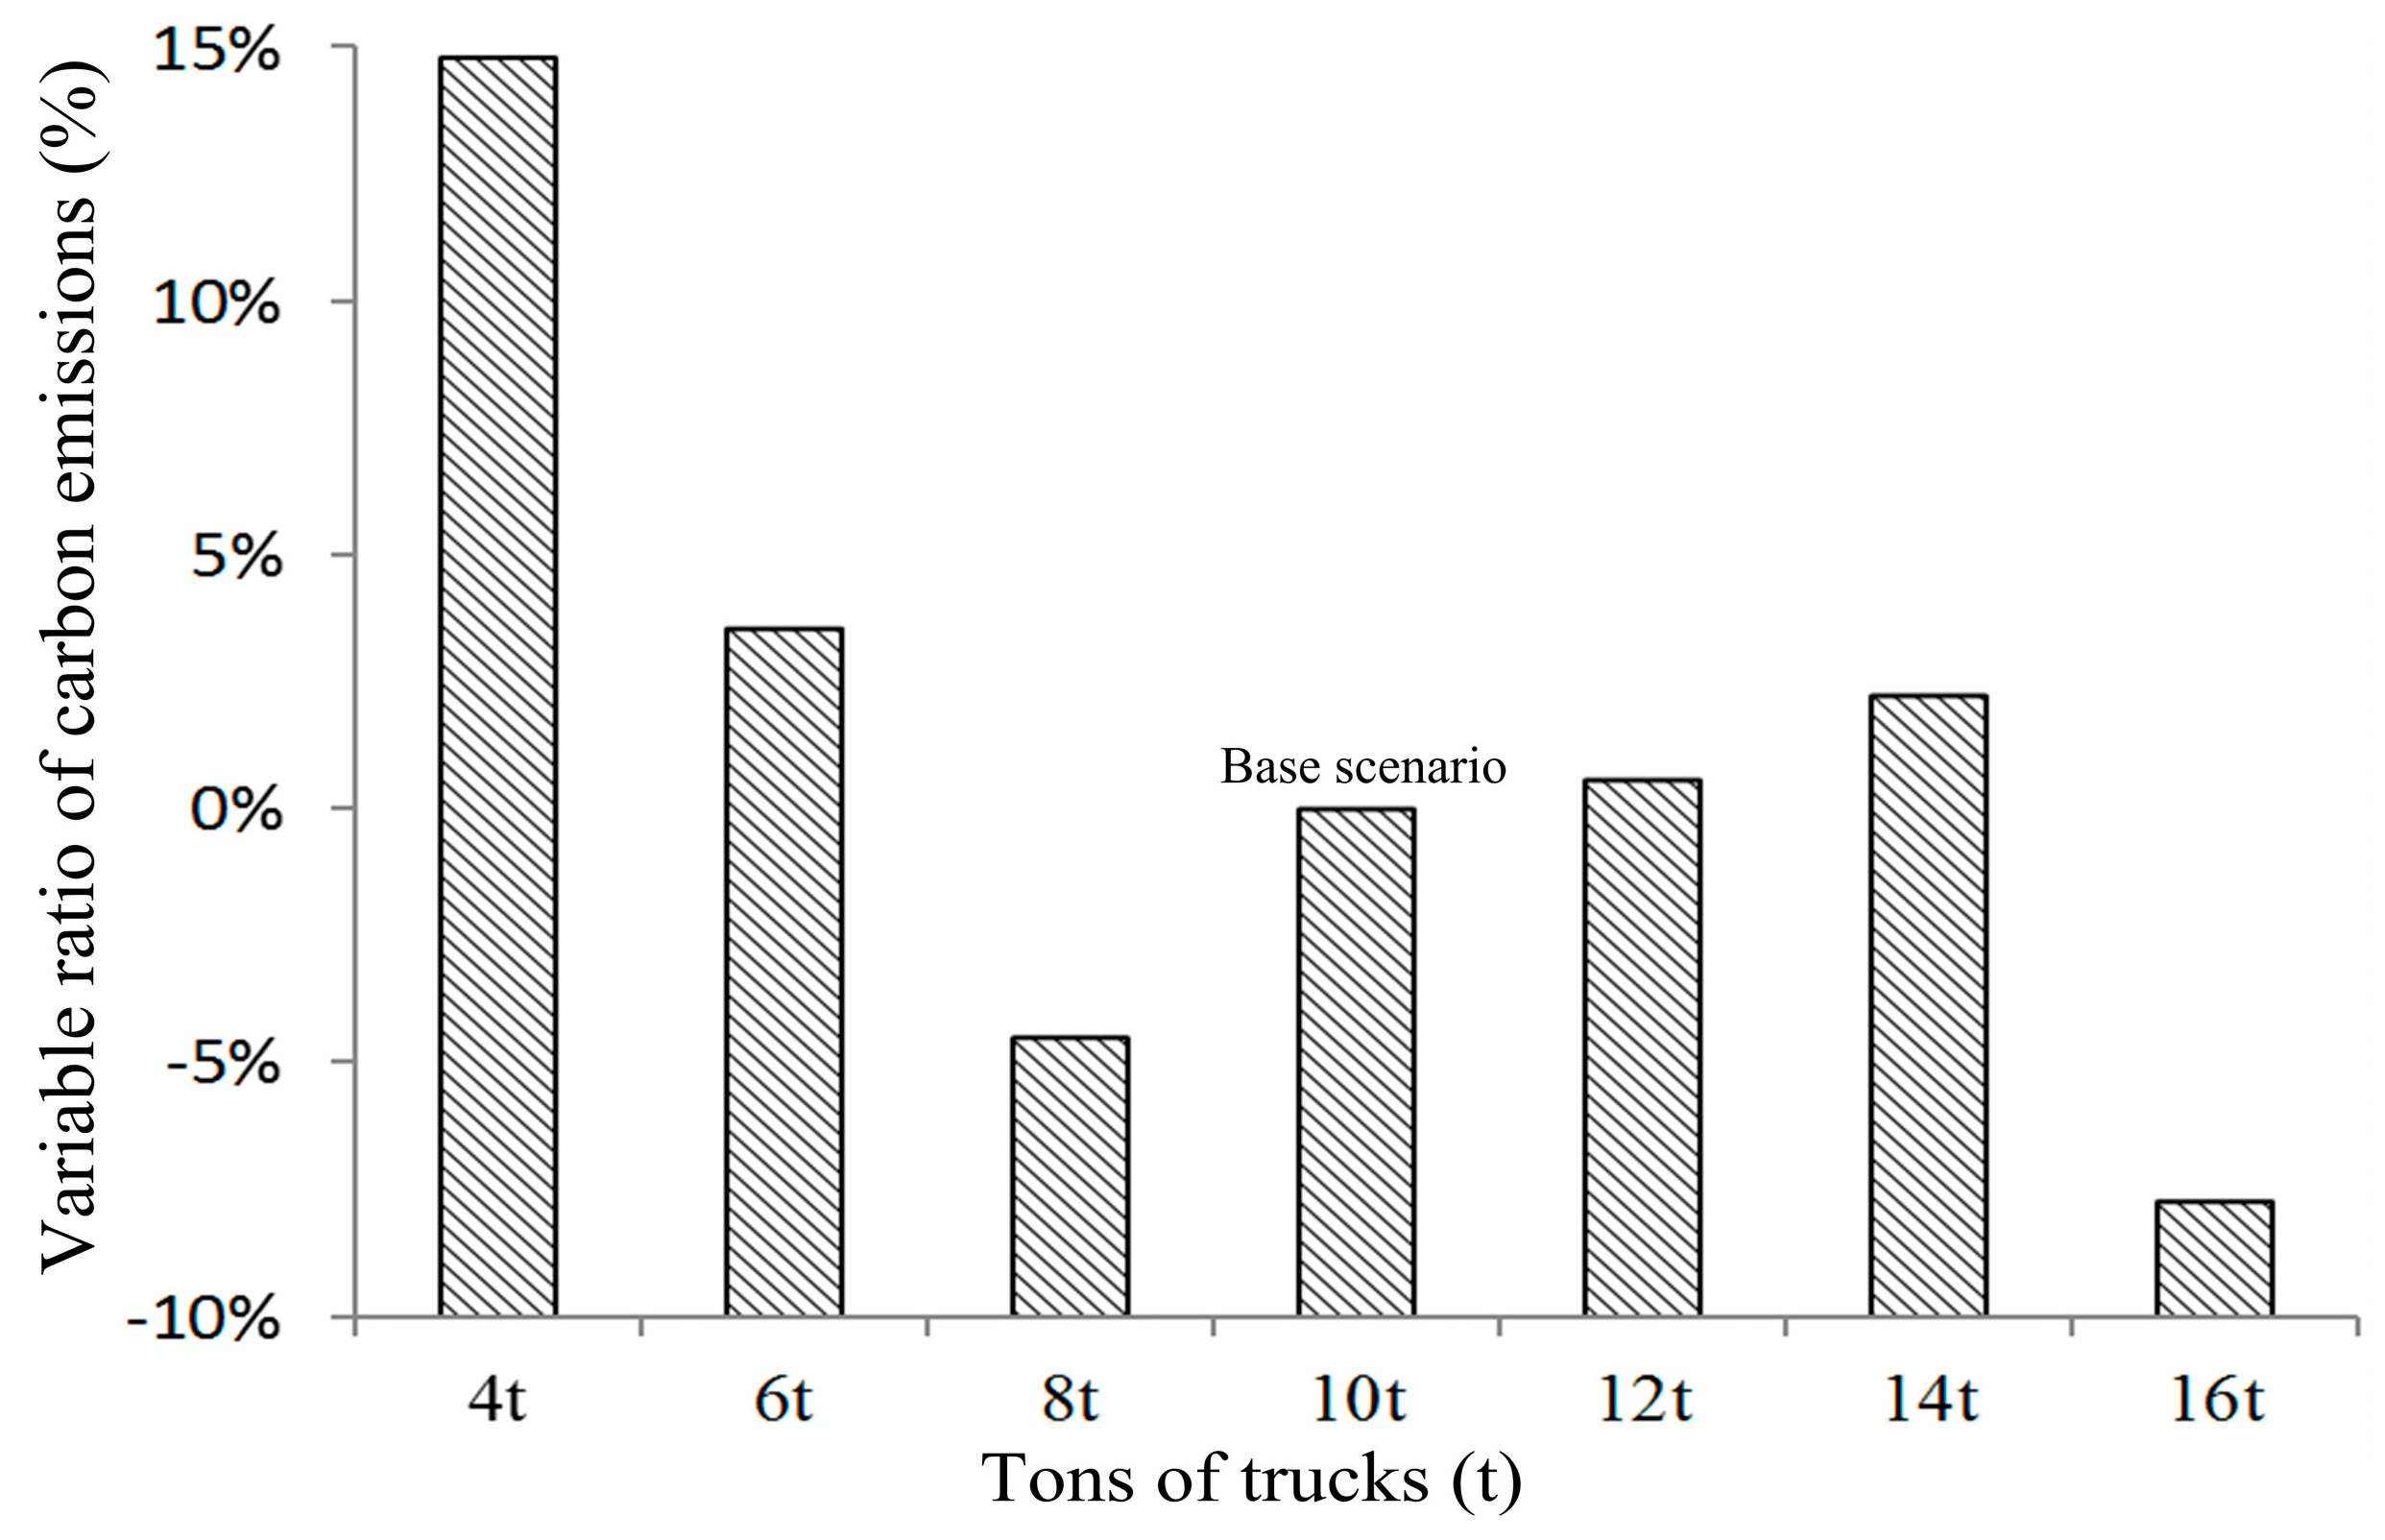
The results comparing the transport scenarios for ISRB and PRC are shown in Figure 7. The location of the precast yard and the material production factory are the same for the two scenarios because PRC manufacturing can be performed by the rebar manufacturer. In these circumstances, it is found that the transportation emissions of PRC structure (6896.5 kg CO2) are approximately 4.5 times higher than those of ISRB structure (1528.5 kg CO2). The main proportion of the PRC transport emissions is the 10 t truck which emits 5911.6 kg of CO2, accounting for approximately 85% of the total transport emissions. Based on the base scenario, variable ratio of CO2 emissions for other six scenarios of trucks with different tonnages (see Figure 8) shows the 8 t truck (−4.54%) and 16 t truck (−7.77%) are the most carbon-efficient means of PRC transport because of high space utilization.
The main reason for larger transport emissions of the PRC structure is the volume limitations of PRC columns and beams in transportation increasing the total transportation frequency. The capacity of a 10 t truck cannot exceed a cargo volume of 12 m3, which means that the truck can carry a load of ISRB that is 7.1 times greater than PRC for the columns and beams for each transport. The other components, such as the reinforcing mesh, floor deck or parallel truss, could be piled on top of one another in the truck and the parallel trusses could be separated into smaller parts, the load of which is similar to that of ISRB; therefore, the load difference of other components could be negligible.
In general, horizontal transport emissions are related to the transportation tool selection, the transport routes planning, the cargo limit and the quality and volume of PRC. Vertical transport emissions are primarily dependent on the lifting equipment and arrangement of lifting process. The main proportion of the PRC transport emissions is the 10 t truck, and the negative impact of PRC systems of the transportation process should be taken into account.
4.3. Assessment of On-Site Construction Emissions ()
4.3.1. Assessment of Workforce Emissions (, )
CO2 emissions of the workforce are rarely considered in the general CO2 emission assessments of buildings. In fact, a reduction in labor force can make a project more environmentally beneficial and cost effective. As a result, it should be considered when setting up a carbon inventory. Based on the energy consumption statistics mentioned in Section 2.2.2, every man-day defined as an 8-h day for one rebar worker emits 0.95 kg of CO2 emissions.
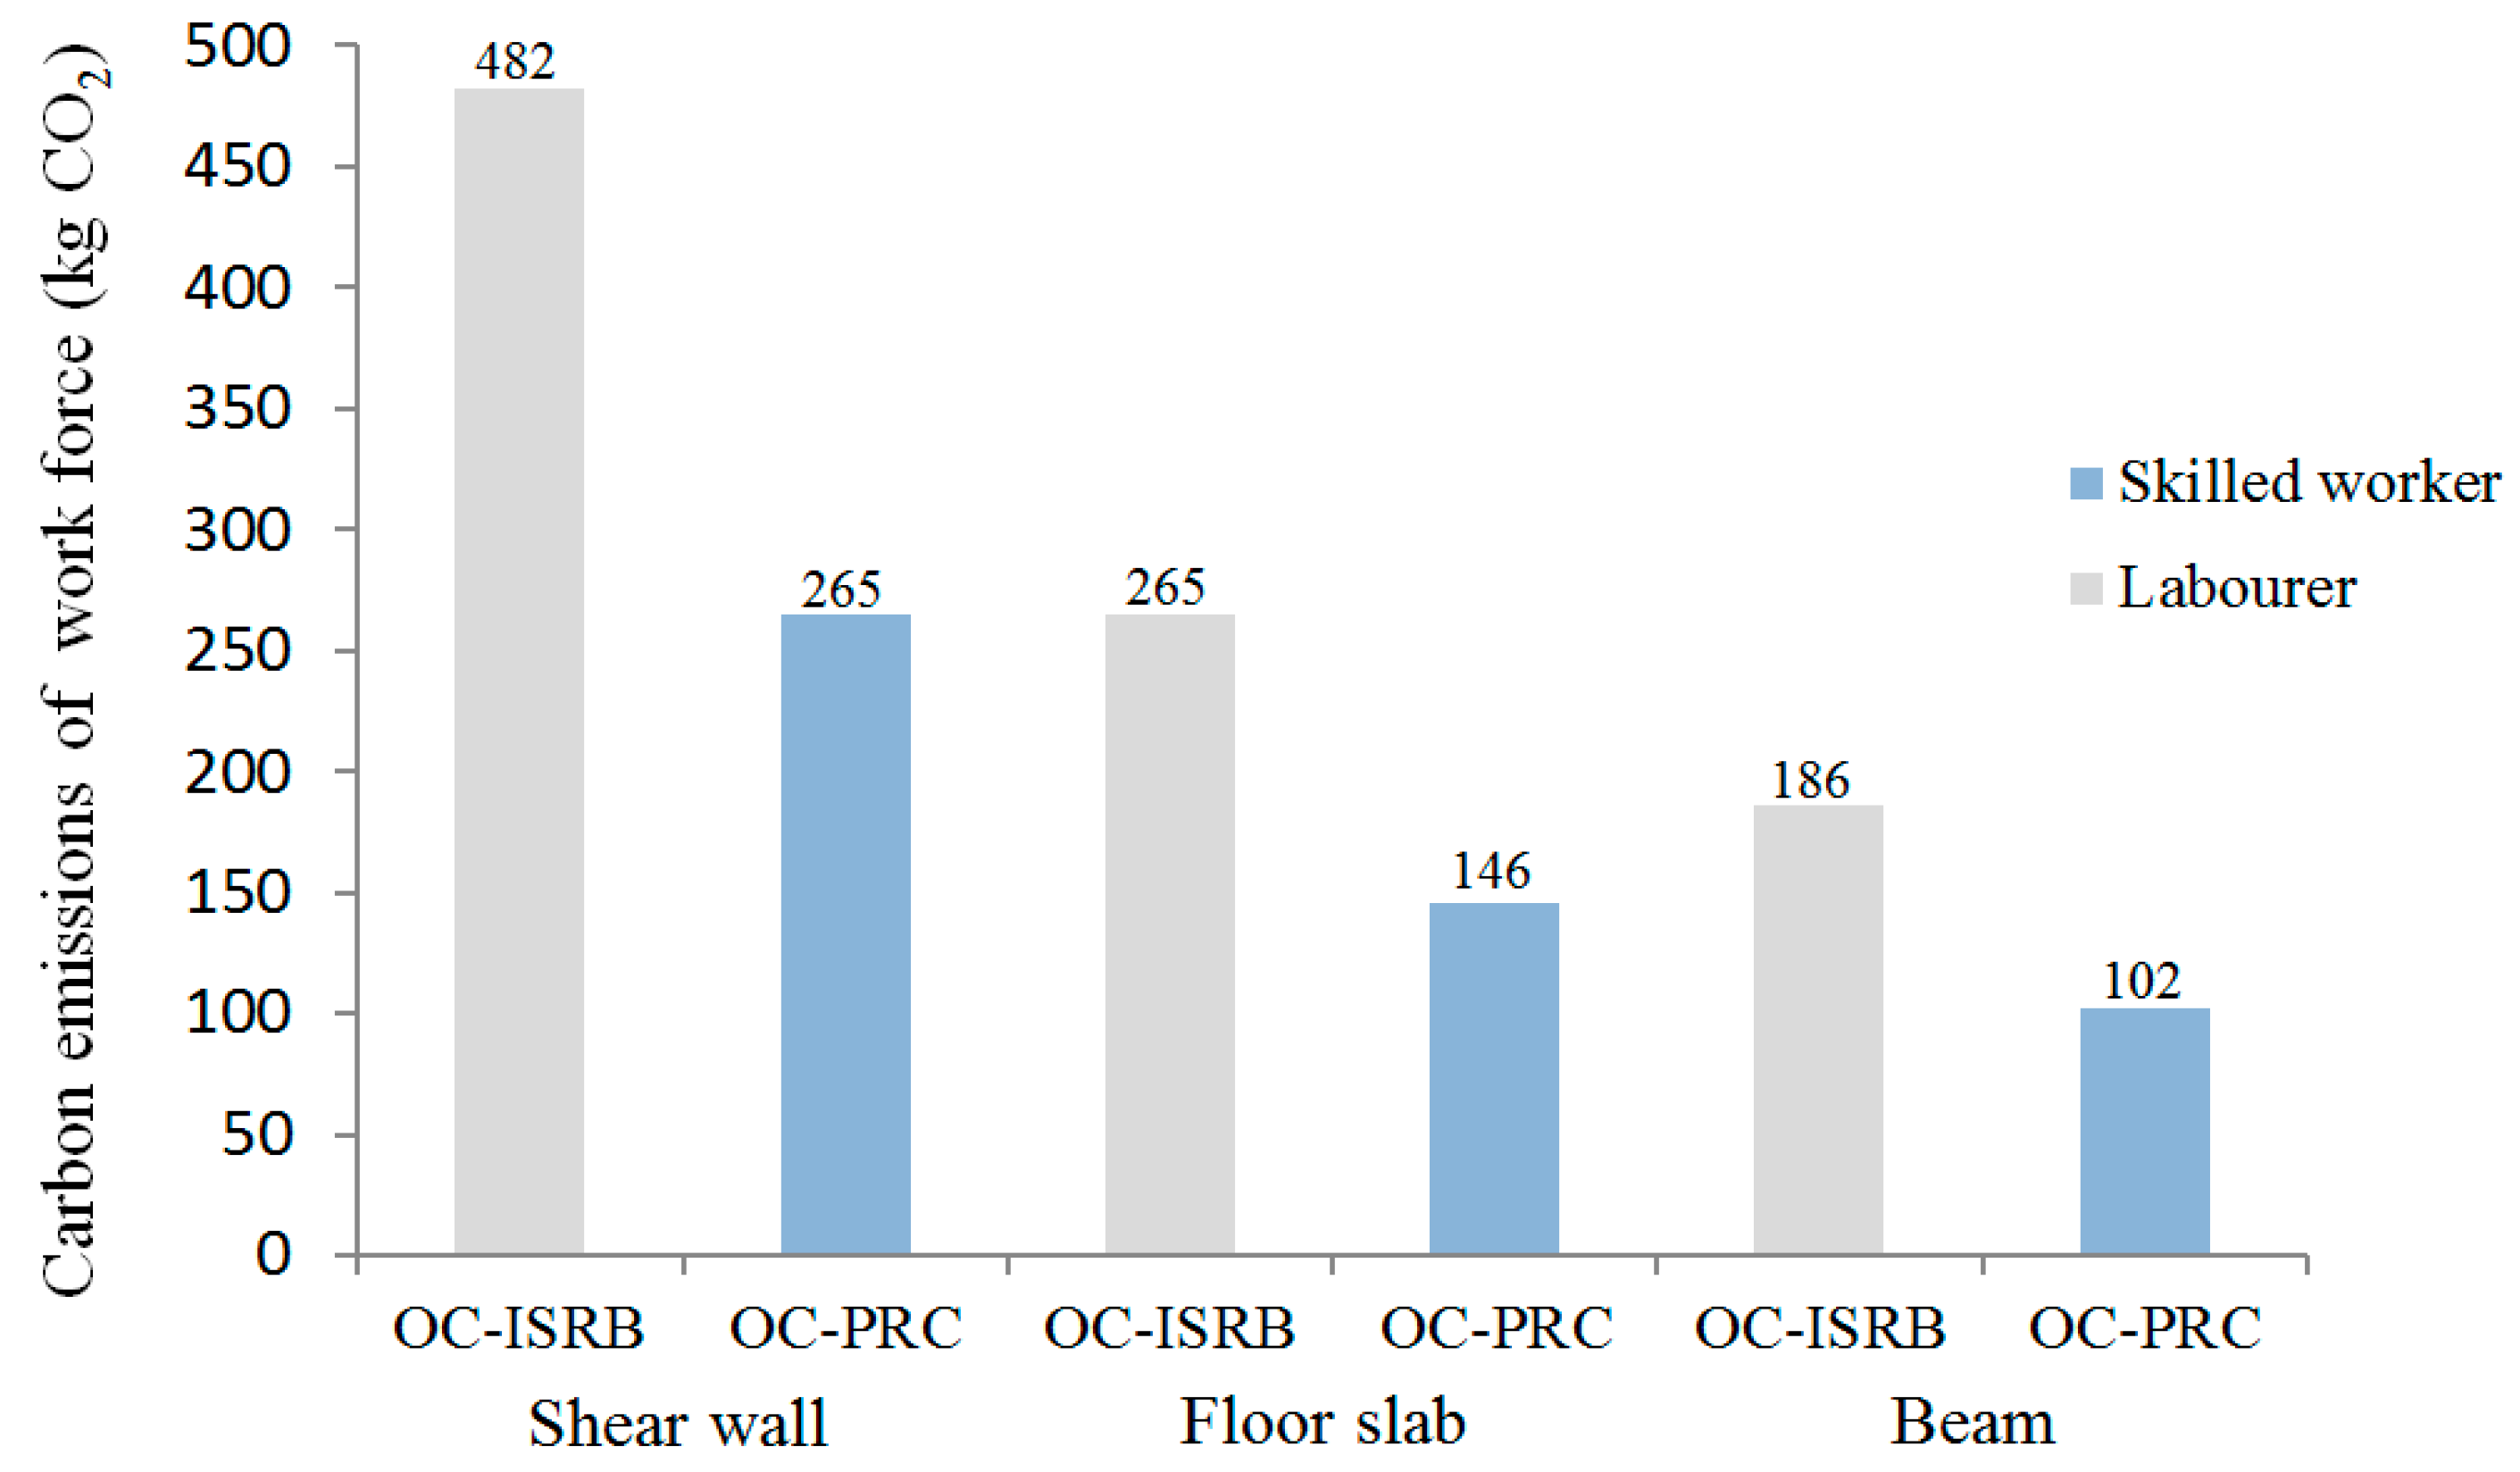
As for ISRB construction, 1 m3 of concrete components, including rebar, requires 5.50 man-days, while using OC-PRC construction method, 1 m3 concrete work requires 3.025 man-days. Overall, for 1 m3 of concrete components, the OC-ISRB method requires 1.82 times man-days more than OC-PRC.
Figure 9 indicates that the ISRB construction workforce for a shear wall emits 482 kg CO2, while with the in-situ PRC construction method the value is only 265 kg CO2, which is just 45% lower than that of ISRB. The workforce for floor slabs and beams of PRC contributes a similar proportion of carbon reduction. In conclusion, the highest contribution of CO2 emissions comes from workers assembling shear walls. In comparison with the OC-ISRB method, the OC-PRC method requires less on-site skilled labor for assembly, thereby increasing the pace of construction.
4.3.2. Assessment of Machinery Emissions (, )
Assessment of the Machinery Emissions from Structure
For industrialized assembly, due to the larger and heavier structural components, almost all the components need to be lifted by crane. Therefore, to ensure efficient operation, large cranes are necessarily required during the construction process in order to lift heavy and large construction materials and components, which help to improve the utilization of working hours, quicken the pace of construction, and ensure safe operations. The tower crane energy consumption is the reason for the increased CO2 emissions from machinery, especially for the shear walls and floors.
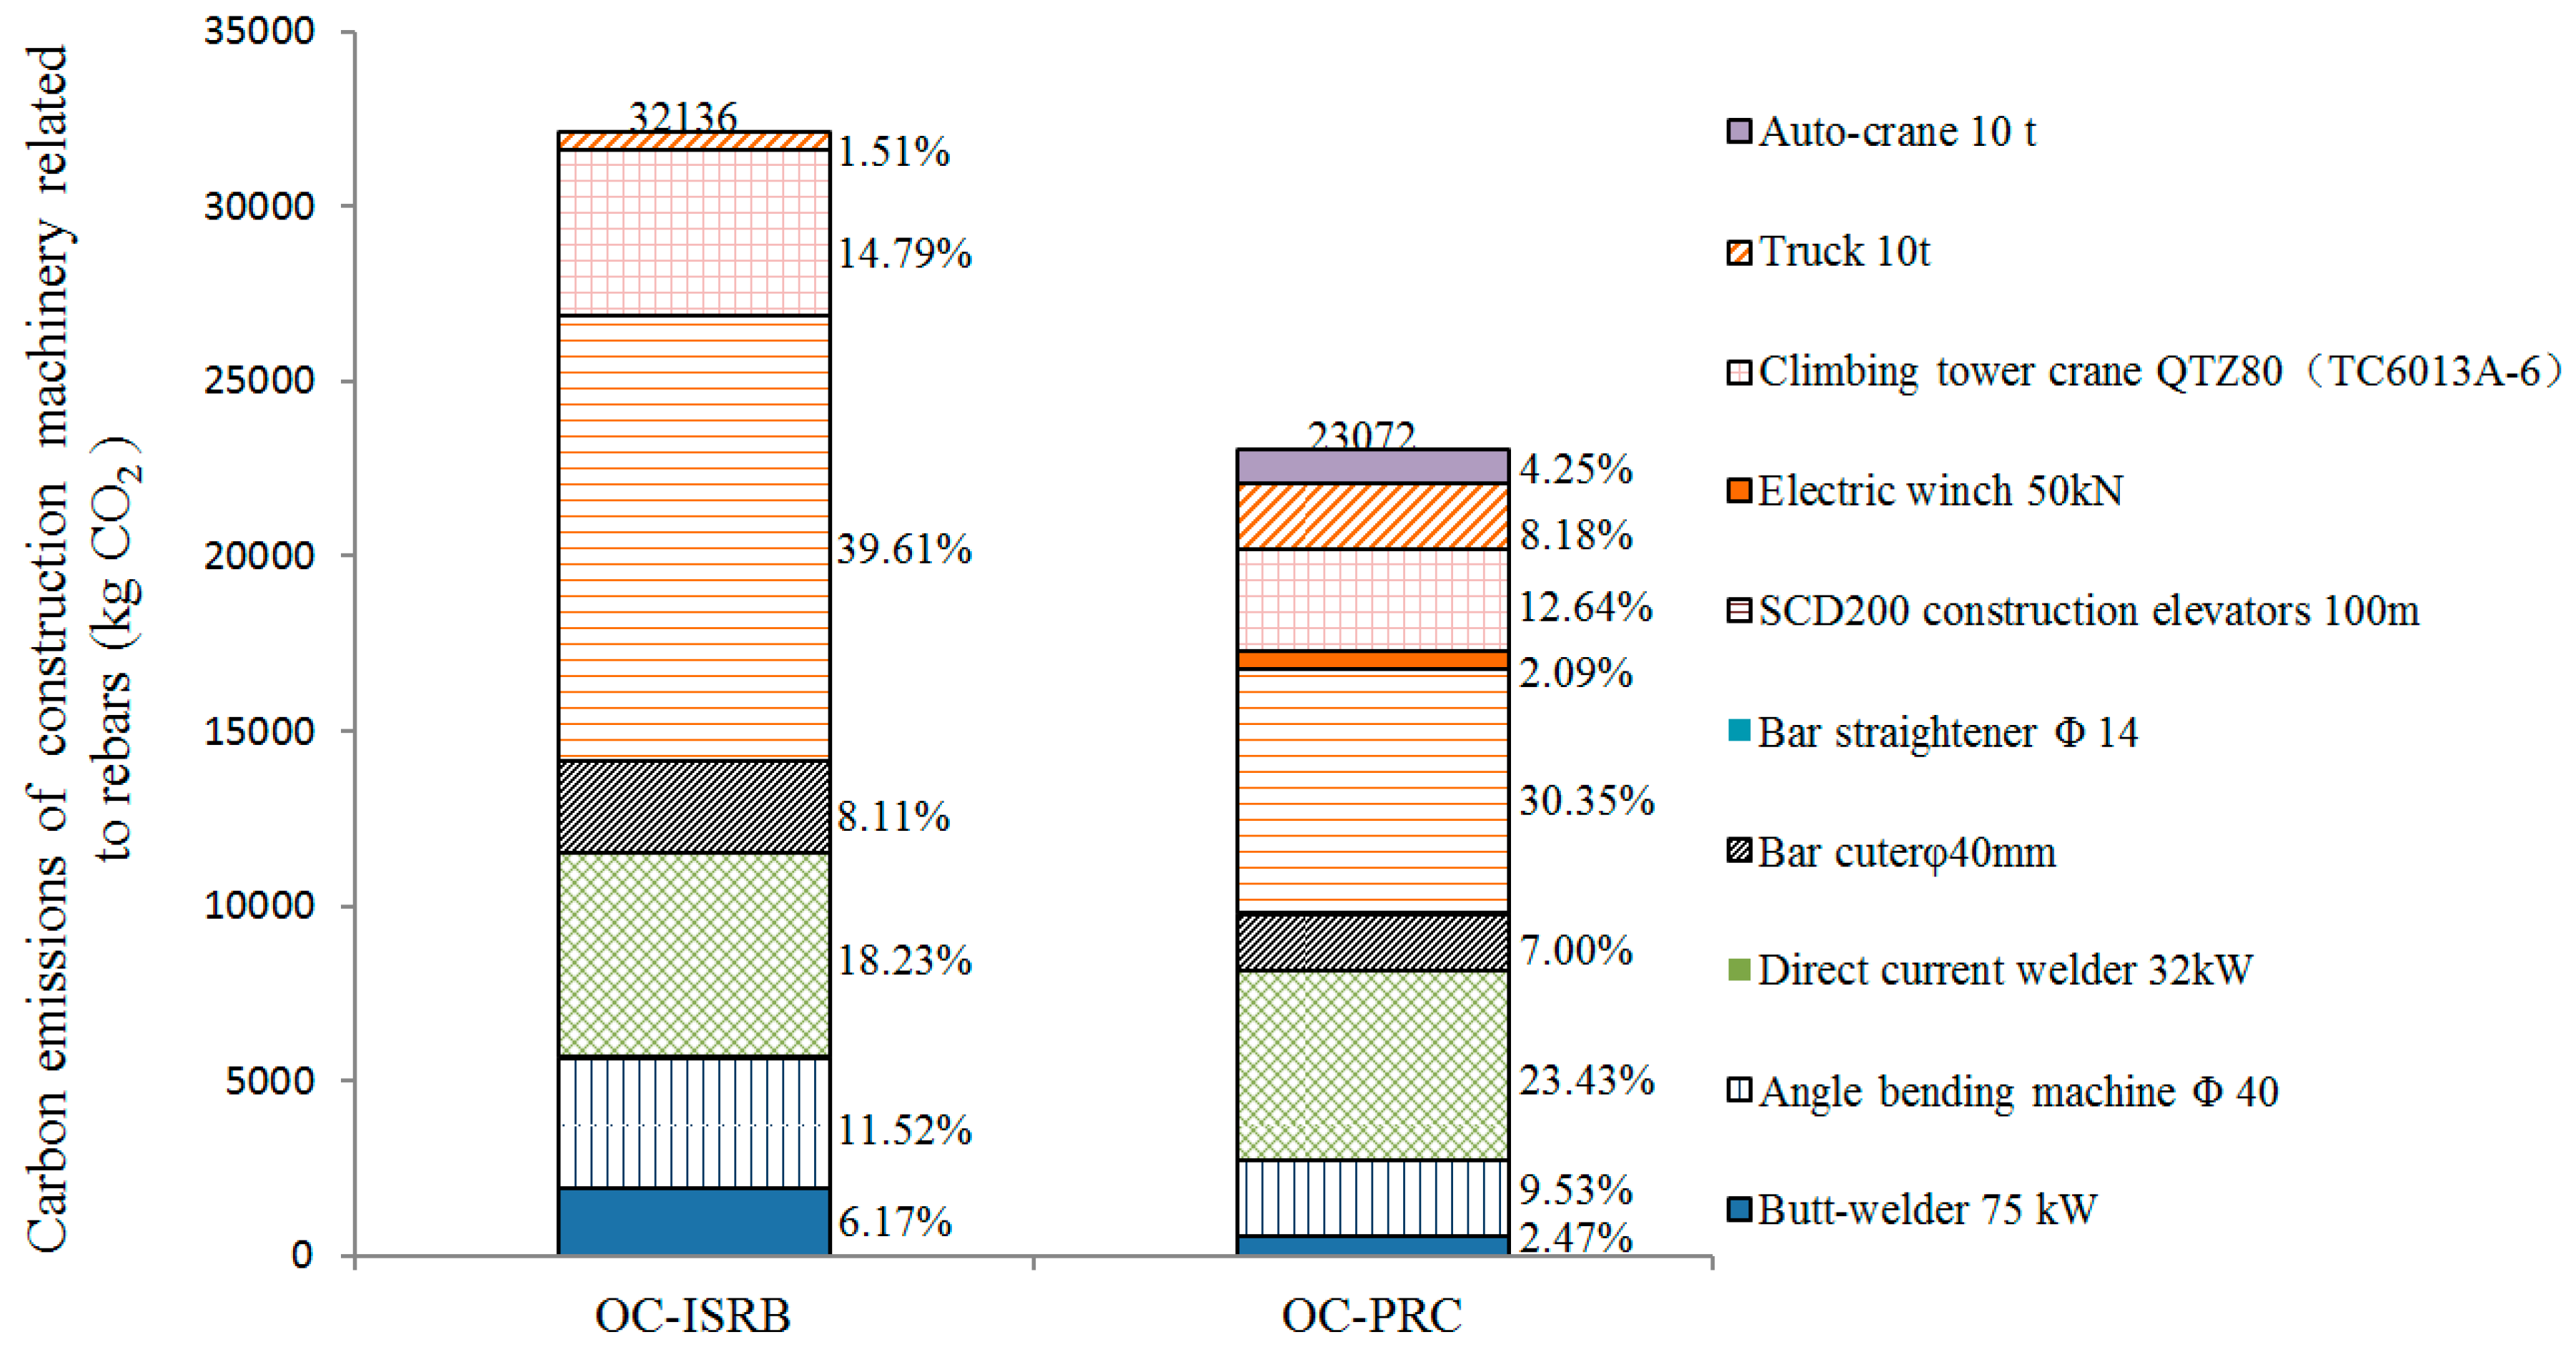
Electricity and diesel are the major contributors to CO2 emissions on site. Figure 10 indicates that the emissions from machinery and equipment elevators account for 39.61% and 30.35% of the total emissions for the ISRB and PRC method, respectively. Among all the energy consumptions, the primary usage of elevators for the transportation of workers takes up the largest proportion; the second largest is the movement of cargo, and the third is the climbing tower crane QTZ80 used for lifting.
With the ISRB method, the CO2 emissions from the direct current welder, angle bending machine, bar cutter, and butt-welder account for 18.23%, 11.52%, 8.11% and 6.17% of the total emissions, respectively, due to the consumption of electricity. In terms of diesel consumption, the CO2 emissions from the 10 t truck account for approximately 1.51%. Although the PRC method reduces the machine operations for cutting, welding, bending, and straightening, the direct current welder contributes the most CO2 emissions due to its higher power and mechanical utilization rate.
Overall, the CO2 emissions from machinery and equipment for rebar are 32,136 kg CO2 in the OC-ISRB site, while the amount for OC-PRC 23,072 kg CO2 on the OC-PRC site, representing an emission reduction of 28.13%. In the machinery category, the CO2 emissions from the climbing tower crane QTZ80 are 4754 kg CO2 for the OC-ISRB scenario and 2915 kg CO2 for the OC-PRC scenario, the latter is 38.67% lower than the former. As for conventional construction methods, the rebar is tied into standard bundles prior to lifting in order to prevent bars or bundles from being dropped. This process requires more time than that of PRC because the customized rebar components require little tying. Another cause for the increase of CO2 emissions using the RC method is that it is inappropriate to carry too many loose bars in one lift.
As is shown in Figure 10, the highest levels of CO2 emissions relate to the highest mechanical usage. In addition, the SCD200 construction elevators have a reduction in emissions for the OC-PRC site of 45% compared to OC-ISRB site because less on-site skilled labor is required for assembly. Thus, it can be observed that the machinery emissions for the ISRB structure are higher than those for the PRC structure.
Assessment of the Machinery Emissions from Scaffolding
For the scenario OC-PRC, the total weight of steel tubes and scaffold couplers are 232 t and 45 t, respectively, and for scenario OC-ISRB, which are 569 t and 110 t (Table 9), respectively.
The maximum length of the layout plan is 46 m, and the maximum weight of the components to be lifted is less than 1.3 t; thus, the QTZ80 (TC6013A-6) crane is suitable for the task. (Details of the energy consumption of the climbing tower crane QTZ80 is listed in Table A3 of the Appendix C).
In the case study, the maximum lifting height is 90 m and the lifting speed is 40 m per minute; thus, the lifting time can be calculated as 90 m/40 (m/min) = 2.25 min. The radius changing time is 1 min while half the main boom length is 30 m and the radius changing speed is 30 m per minute. The rotating time is 1.96 min for a 1/4 circle rotation (π/2) when the rotating speed is 0.8 r/min. The up and down lifting time is estimated as (2.25 min + 1 min + 1.96 min) × 2 = 10.42 min, and the climbing tower crane can lift 5.76 times in one hour. It can be calculated as 46.08 lifting times over an 8-h day (equal to one machine-shift).
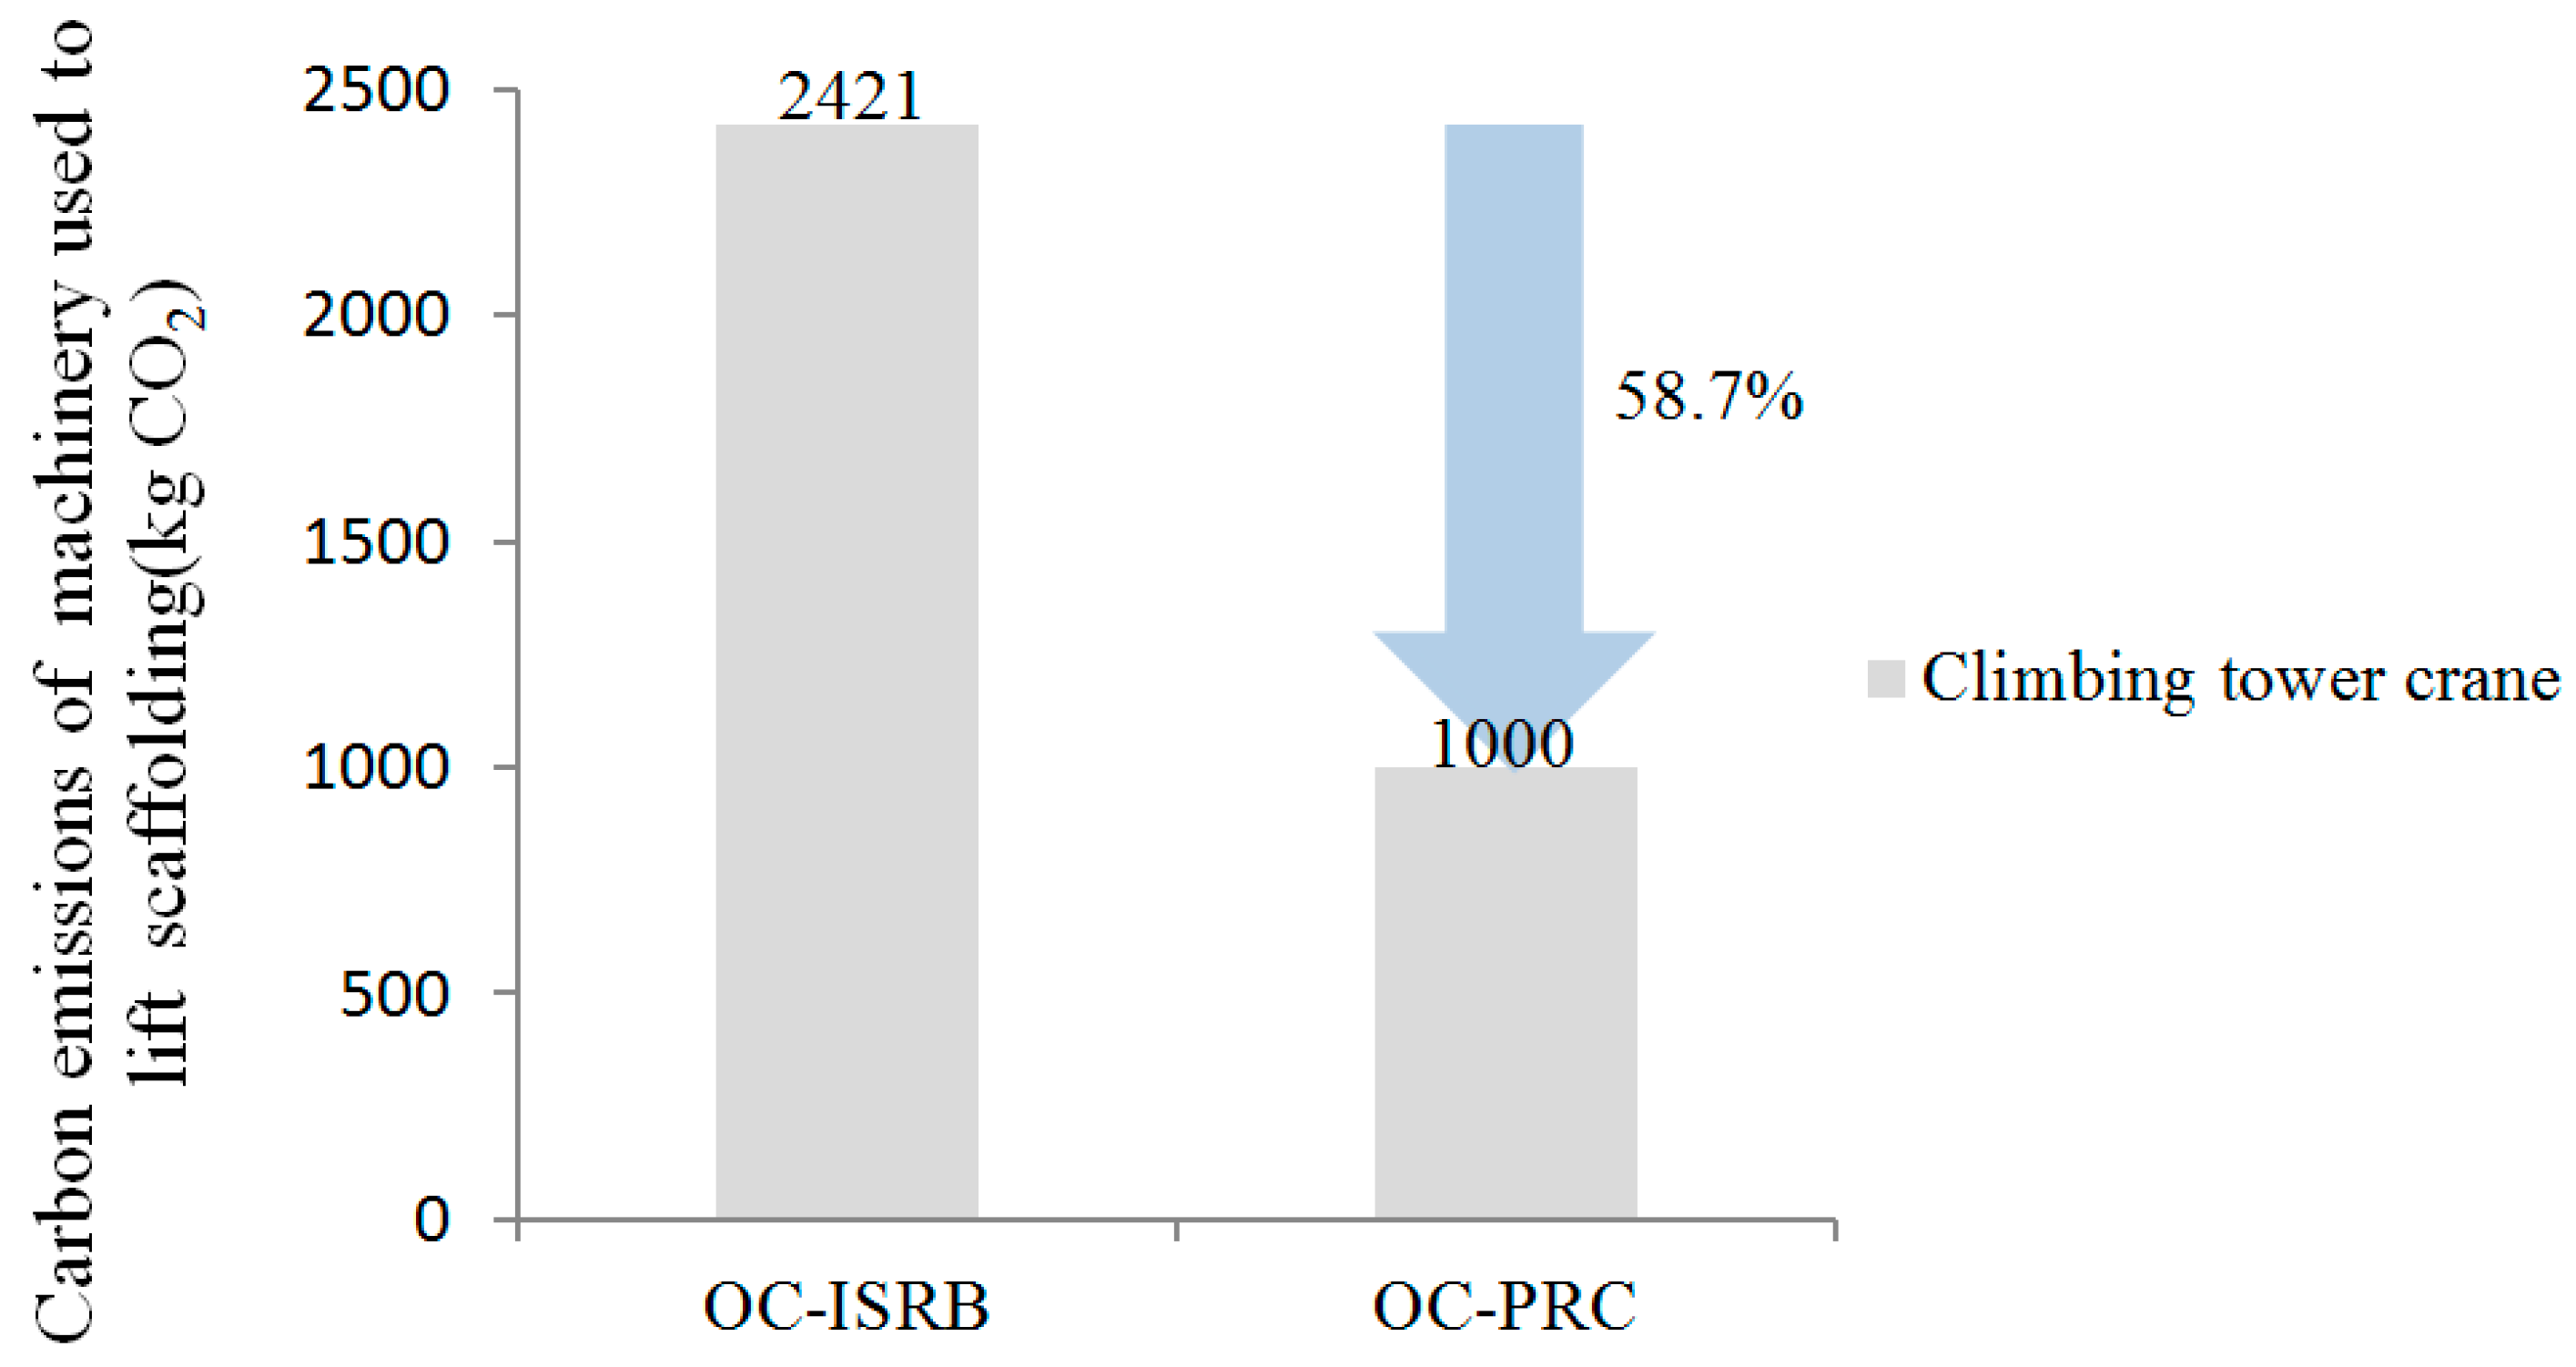
The scaffolding is mainly lifted by climbing tower crane and the crane lifts 1 t per lift in the ISRB scenario. In China, a machine-shift is normally defined as an 8-h day. Therefore, the machine operation time required for 679 t weight is 679 t/1 (t/times)/46 (times/day) = 15 days (equal to 15 machine-shifts). In the same way, for the PRC scenario, 6 machine-shifts are required for lifting scaffolding. As a result, the OC-PRC method can achieve 58.7% carbon reduction from lifting, as presented in Figure 11.
4.4. Comparison of Total CO2 Emissions ()
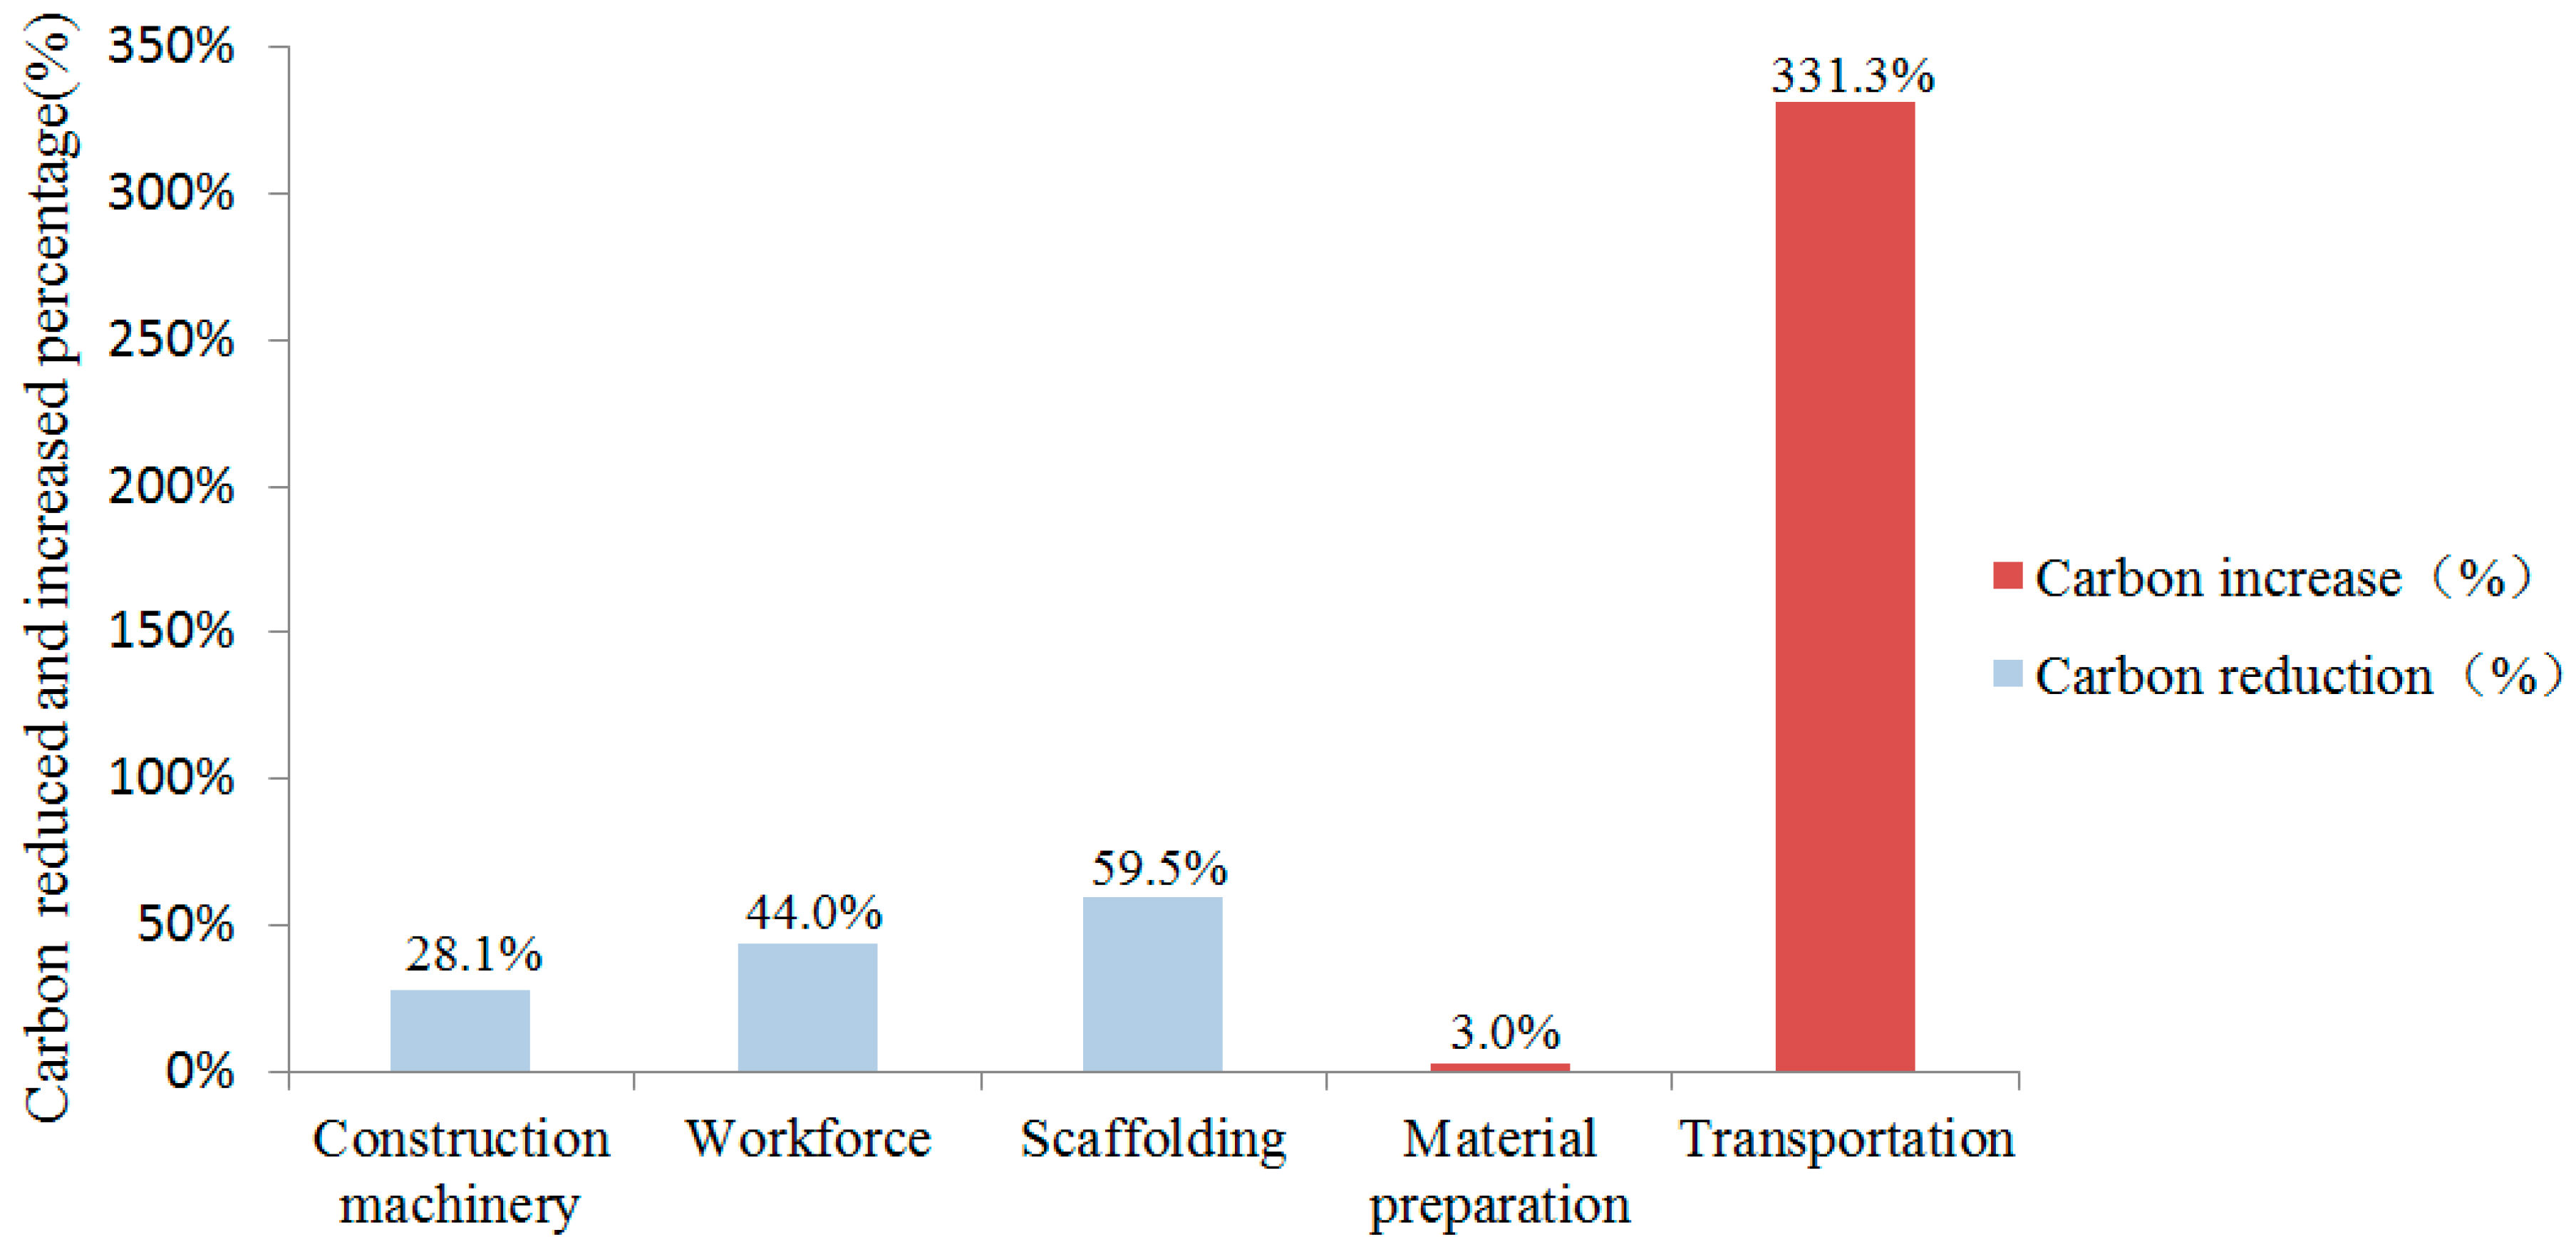
Based on the cradle-to-site LCA over the three stages, the adoption of the PRC construction method can lead to carbon emission reductions when compared to cast-in-situ ISRB. Figure 12 reveals that for the component prefabrication process, the increase of CO2 emissions for factory-manufactured PRC components is 3%, and for material transportation, the increase of emissions is 331.3%. For other elements, the carbon reduction for scaffolding in PRC construction is 59.5%, the reduced workforce and machinery operations result in a reduction by 44% and 28.1%, respectively. These results reveal that construction machinery and equipment, workforce, and scaffolding are the key contributors (reductions of 9 t CO2, 11 t CO2, and 22 t CO2, respectively) to carbon reductions, and the adoption of PRC construction technology in a high-rise building project can reduce CO2 emissions by 1.24% overall, as demonstrated in Table 10, while the influence of increased PRC emissions is less important during the prefabrication process.
5. Discussion
The material of reinforced concrete structures has developed a lot since the 1990s in China, and its construction method has matured over the past decade. However, the development of rebar construction technology is still relatively backward as a result of employing large-scale cheap labor. This study, in turn, attempts to re-examine the rebar approach, and raises the question of whether the emerging PRC construction method would make up the weaknesses of traditional ISRB, and whether it would be sustainable and environmentally friendly. This study proposes a CO2 assessment of the emerging PRC method for three stages which contributes a strong promotion for the healthy and rapid development of low-carbon high-rise buildings in China.
5.1. Carbon Reduction Measures
5.1.1. Measures for Material Preparation Stage
The assessment of material preparation emissions data revealed that the current prefabrication process had a negative influence on carbon reduction in this study. For customized mass production, energy consumption primarily comes from machinery operation for automatic manufacturing. About 59.1% of carbon emissions (15,014 kg) are produced by reinforcing mesh welding. However, the prefabrication process would have a significantly positive effect on construction emissions, for in the factory-controlled environment, waste and unqualified products could be processed locally, which indirectly reduces the consumption of machinery, manpower and materials caused by waste disposal during the process of on-site construction.
More strategies should be used to reduce the negative environmental impact in mechanical manufacturing processes in the future, including: (1) The machining efficiency should be enhanced as much as possible, especially for reinforcing mesh welding; (2) The quality of products should be improved to avoid repeated mechanical operation; (3) The optimization of processing technology might avoid the waste of materials; (4) Mass production might reduce the mechanical carbon emission per unit time; (5) Reasonable utilization of recyclable, reusable materials in situ is crucial for carbon reduction.
5.1.2. Measures for Transportation Stage
In general, the negative impact of PRC systems of the transportation process should be considered. A 10 t truck contributes the main proportion of the PRC transport emissions, i.e., 5911.6kg CO2, accounting for approximately 85% of the total transport emissions. It is for this reason that the volume (12 m3) of a 10 t truck is limited, PRC columns and beams are transported 7.1 more times than that of ISRB system. More importantly, CO2 emissions from the horizontal transport are estimated based on diesel consumption.
Future designs should take some strategies into consideration: (1) Making reasonable transport routes to reduce transport emissions produced by consumption of diesel. (2) It is necessary to choose a reasonable transport vehicle, considering the limitation of height, width and turning radius, as well as relevant regulations of traffic management. (3) The size and weight of the PRC components should be optimized to save transport times.
What’s more, better control of vertical transport emissions primarily depends on the appropriate arrangement of lifting planning, including (1) reasonable choice of lifting equipment with appropriate energy consumption; and (2) rational arrangement of lifting process in order to improve assemble efficiency.
5.1.3. Measures for On-site Construction Stage
Measures for Workforce
In comparison with the OC-ISRB method, the OC-PRC method requires less on-site skilled labor for assembly, thereby making a project environmentally friendly. The largest contribution of CO2 emissions comes from rebar work for assembling shear walls, which accounts for the largest proportion in a project. The structure node is well designed to reduce the joints processing, which not only improves the assembly efficiency, but also effectively decreases the amount of workforce. Consequently, the OC-PRC method has a significant positive effect on construction emissions.
Measures for Machinery
Overall, the CO2 emissions (32,136 kg CO2) from machinery and equipment for rebar realize a reduction by 28.13%. Among all the energy consumptions, the largest proportion is coming from the usage of elevators for the transportation of workers; the second largest proportion comes from the movement of cargo, and the third the climbing tower crane used for lifting. Electricity and diesel are the major contributors on site.
In addition to other causes such as less loose bars for vertical transport, less on-site skilled labor is a primary factor for the decrease of CO2 emissions from elevators. Moreover, there would be another two reasons for the decrease of CO2 emissions when lifting PRC by the climbing tower crane: (1) Customized rebar components require little tying; (2) Compared to ISRB method, PRC components require less hoisting times. In terms of connecting joints, the direct current welder contributes the most CO2 emissions due to its higher power and mechanical utilization rate, while it causes fewer emissions than ISRB for fewer joining activities.
There might be several strategies to promote the positive environmental impact on site construction processes: (1) improving the design of joints to reduce the connecting time and achieve lower carbon emission of machinery operation; (2) optimizing assembly process to ensure that the each component is accurately positioned so as to save redundant energy consumption of adjustment; (3) choosing the equipment with higher energy efficiency ratio and reasonable power consumption; (4) optimizing the type of mechanical equipment and decreasing the idling frequency of machinery; and (5) improving the mechanical efficiency of the tower crane.
5.2. Time Duration
For the case study, it is projected that the construction of a standard floor would take 8 days with PRC method, and the whole construction work would be end in 216 days. In comparison, it would take 14 days for a standard floor and 378 days for the whole project using conventional construction methods. The use of ready-to-install PRC components can reduce the duration of construction significantly, i.e., by 40%.
5.3. Electricity Savings on Construction Site
It is assumed that the temporary accommodation of dimensions 6.3 m × 3.6 mm × 3.0 mm, with two 15 W light bulbs and a 75 W electric fan, is required for workers on site during the construction process. Each mobile home with a floor area of 22.68 m2 can accommodate 7 workers and will consume electricity for 6 h (see Table 11). Due to the workforce savings of 442.1 man-days (equal to the savings of 442.1/7 = 63.16 units of mobile homes) for a typical floor, (30 W + 75 W) × 6 h × 63.16 = 39.79 kWh can be saved so that for a construction rate per 14 days per floor, 39.79 kWh × 14 days = 557.06 kWh can be saved. Overall, a 27-storey building could achieve electricity savings of 10,266.68 kWh and an emission reduction of 10.3 t CO2.
6. Conclusions
PRC is an environmentally-friendly construction method when compared to conventional ISRB. The study investigates the difference of CO2 emissions between the two different construction methods based on partial LCA from cradle-to-site. A case study of a high-rise building project in Nanjing is used to investigate six scenarios with three comparison stages, i.e., material preparation, transportation, and on-site construction, and three types of structural components, i.e., shear wall, slab, and beam.
The application of PRC construction technology can reduce carbon emissions compared with ISRB. On the material preparation stage, the precast method results in an increase of 3% CO2 emissions because of more energy generated from machinery operation for automatically manufacturing in factory. On the transportation stage, the adoption of prefabrication results in an increase of 5.3 t CO2 emissions due to that the volume limitation (12 m3) of a 10 t truck increases the transport frequency. During the on-site construction stage, the CO2 emissions from machinery and the workforce can be reduced by 35.1%. The better performance of PRC is attributed to decreased hoisting frequency and lower mechanical utilization for fewer joining activities. In total, the adoption of PRC construction technology in the case study of high-rise building project can reduce CO2 emissions by 1.24%.
Additionally, for scaffolding, it is estimated that the material embodied emissions for the PRC scenario can achieve a carbon reduction by approximately 59.3%, and the CO2 emissions from machinery could be reduced by 58.7%, because no exterior scaffolding would be used. Furthermore, the duration of construction can be reduced by 40%, and approximately 1.39% (386.7 GJ) of overall energy consumption can be saved using PRC. In relation to the electricity consumption on the construction site, 10.27 MWh of power consumed by temporary accommodation could be saved, offering a reduction of 10.3 t of CO2 emissions.
Some study related to PRC involved structure and performance analysis (such as dynamic analysis of the stress of PRC in the process of concrete pouring [48], or high-strength concrete columns reinforced with PRC [19]), construction technology [49] and economic evaluation [20]. Reinforcement industrialization is an emerging issue, while, based on the research findings, it was found that the PRC construction method can offer a better environmental performance. For a relatively large amount of construction in China, the technology would have great potential for carbon reduction. Therefore, it is highly recommended that the PRC framework be adopted in high-rise buildings. The building industry should consider the positive carbon reduction effect as a benefit of PRC, which should be incorporated into the Assessment Standard for Green Buildings and LEED. The government should provide more incentives to encourage the adoption of PRC in high-rise buildings.
7. Limitations and Future Work
Apart from other studies that only consider the quantity of materials used in a construction project [50,51], the present study establishes a model including detailed construction methods of PRC components according to the structural groups of a high-rise building. There are some clear benefits, such as the innovative construction technology and construction process development, both of which operate in a more sustainable manner, but the collection of detailed data and material quantities requires considerable time. In addition, the proposed LCA model helps to justify stakeholder decisions with respect to material preparation, transportation, and on-site construction data inputs in relation to the PRC method. In future, the full life circle study should be given to provide a more comprehensive analysis.
Currently, the joint connection of PRC is not flexible, accurate and efficient enough for the free-form surface architecture [49]. Furthermore, during the prefabrication process, the efficiency of automatic production for PRC is not very high, so manual labor is still needed. In the future, VR (virtual reality) method could be used to improve the efficiency and customized flexibility [52].
The study compares the construction methods for the ISRB and the PRC construction method. In order to further explore the CO2 emissions for the prefabrication process, buildings with various precast methods should be studied, as they could provide more information to establish a benchmark system for the carbon auditing of prefabricated construction processes for high-rise buildings.
Presently, prefabricated construction is supported by the government of China due to the reduction in construction time and waste, improved quality, and better safety performance, while the benefits of carbon reduction are still excluded from the rationale. Future research can strength the investigation of this point; the more CO2 emissions can be reduced by adopting PRC, the more environment benefits can be achieved for the Chinese construction industry. As a result, this construction method could be included as another point for credits in the Assessment Standard for Green Buildings.
Author Contributions
B.J. and H.L. conceived and designed the experiments; B.J. and H.L. wrote the paper; L.D. collected data and analyzed the data; Y.W. contributed materials/analysis tools; L.D. and Y.T. reviewed the paper.
Funding
This research was funded by National Natural Science Foundation of China (Grant No.51708282): A co-simulation framework for carbon emissions in lightweight prefabs based on LCA.
Acknowledgments
Thanks are due to the research members, Zhang Hong and Zhang Junjun from Southeast University, who provided the engineering data for the case study building.
Conflicts of Interest
The authors declare no conflict of interest.
Appendix A. Life Cycle Impact Assessment
Appendix B. Data Used in Case Study

Table A1.
Details of scaffolding materials.
| Material | Unit | For A Unified Area of 100 m2 | ||
|---|---|---|---|---|
| Single-Pole Scaffold | Double-Pole Scaffold | |||
| Steel tube (Φ48; 3.5–3.84 kg/m) | Standard | m | 57.3 | 109.3 |
| Long Ledger | m | 87.7 | 168.4 | |
| Ledger | m | 74.8 | 65.1 | |
| Diagonal brace | m | 18 | 20 | |
| ∑ | kg | 931 | 1393 | |
| Steel coupler | Double coupler (1.32 kg/pcs) | pcs | 85 | 155.5 |
| Sleeve coupler (1.84 kg/pcs) | pcs | 20 | 41.2 | |
| Swivel coupler | pcs | 4.5 | 5 | |
| Base plate | pcs | 4.3 | 5.5 | |
| ∑ | kg | 147 | 270 | |
Note: In the case study, 1393 kg of steel tube and 270 kg of steel coupler for double-pole scaffold were adopted.
Table A2.
Site construction emissions (Ec) inputs for emission factors of commonly used construction machinery (working for 8 h).
Table A2.
Site construction emissions (Ec) inputs for emission factors of commonly used construction machinery (working for 8 h).
| Construction Process | Construction Machinery | Electricity (kWh) | Diesel (kg) | CO2 Emission (kg CO2) |
|---|---|---|---|---|
| Join | Butt-welder 75 kW | 122.9 | — | 83.9 |
| Join | Angle bending machine Φ40 | 12.8 | — | 8.7 |
| Join | Direct current welder 32 kW | 93.6 | — | 63.9 |
| Join | Bar cuter Φ 40 mm | 32.1 | — | 21.9 |
| Join | Bar straightener Φ14 | 11.9 | — | 8.1 |
| Join | Electric winch 50 kN | 88.0 | 36.6 | |
| Lift | SCD200 construction elevators | 53.6 | — | 60.1 |
| Lift | Climbing tower crane QTZ80 | 236.5 | — | 161.4 |
| Lift | Auto-crane 10 t | — | 30.6 | 127.3 |
| Transport | Truck 10 t | — | 40.0 | 97.1 |
Appendix C. Data Used in Results
Table A3.
Capacity index of the crane QTZ80 (TC6013A-6).
| Lifting Torque | Max. Main Boom Length | Max. Lifting Load at The End of Boom Length | Available Working Range | Max. Rated Lifting Load | Indepen-dent Max. Lift Height | Attached Max. Lift Height | The Velocity Ratio (V.R.) 2 of The Pulley for Wire Rope | The Velocity Ratio (V.R.) 4 of The Pulley for Wire Rope | Radius Changing Speed | Rotating Speed | |
|---|---|---|---|---|---|---|---|---|---|---|---|
| 800 kN·m | 60 m | 1.3 t | 2.5–60 m | 6.0 t | 46 m | 220 m | 80 m rope per minute can be pulled while lifting 1.5 t | 40 m rope per minute can be pulled while lifting 3 t | 20 m rope per minute can be pulled while lifting 6 t | 0–55 m per minute | 0–0.8 r per minute |
References
- Intergovernmental Panel on Climate Change. Climate Change 2014: Mitigation of Climate Change; Contribution of Working Group III to the Fifth Assessment; IPCC: Geneva, Switzerland, 2014. [Google Scholar]
- Core Writing Team; Pachauri, R.K.; Reisinger, A. Climate Change 2007: Synthesis Report; IPCC: Geneva, Switzerland, 2007; pp. 10–25. [Google Scholar]
- Yang, M.G.; Wang, G.X. Regional differences and influencing factors of carbon emissions in China: Empirical evidence from provincial panel data. J. Shandong Univ. (Nat. Sci.) 2017, 52, 16–23. (In Chinese) [Google Scholar]
- Environment Bureau. Hong Kong’s Climate Change Strategy and Action Agenda—Consultation Document; Environment Bureau: Hong Kong, China, 2010.
- Chau, C.K.; Hui, W.K.; Ng, W.Y.; Powell, G. Assessment of CO2 emissions reduction in high-rise concrete office buildings using different material use options. Resour. Conserv. Recycl. 2012, 61, 22–34. [Google Scholar] [CrossRef]
- Horvath, A. Construction materials and the environment. Annu. Rev. Environ. Resour. 2004, 29, 181–204. [Google Scholar] [CrossRef]
- Flower, D.J.; Sanjayan, J.G. Green house gas emissions due to concrete manufacture. Int. J. Life Cycle Assess. 2007, 12, 282. [Google Scholar] [CrossRef]
- Meyer, C. The greening of the concrete industry. Cem. Concr. Compos. 2009, 31, 601–605. [Google Scholar] [CrossRef]
- Balaras, C.A.; Gaglia, A.G.; Georgopoulou, E.; Mirasgedis, S.; Sarafidis, Y.; Lalas, D.P. European residential buildings and empirical assessment of the Hellenic building stock, energy consumption, emissions and potential energy savings. Build. Environ. 2007, 42, 1298–1314. [Google Scholar] [CrossRef]
- Li, L.; Chen, K. Quantitative assessment of carbon dioxide emissions in construction projects: A case study in Shenzhen. J. Clean. Prod. 2017, 141, 394–408. [Google Scholar] [CrossRef]
- Nie, T. Design and production mode of standard module of green affordable housing. Archit. Technol. 2017, 48, 461–464. (In Chinese) [Google Scholar]
- Dong, Y.H.; Jaillon, L.; Chu, P.; Poon, C.S. Comparing carbon emissions of precast and cast-in-situ construction methods—A case study of high-rise private building. Constr. Build. Mater. 2015, 99, 39–53. [Google Scholar] [CrossRef]
- Foraboschi, P. Structural layout that takes full advantage of the capabilities and opportunities afforded by two-way RC floors, coupled with the selection of the best technique, to avoid serviceability failures. Eng. Fail. Anal. 2016, 70, 387–418. [Google Scholar] [CrossRef]
- Foraboschi, P. Versatility of steel in correcting construction deficiencies and in seismic retrofitting of RC buildings. J. Build. Eng. 2016, 8, 107–122. [Google Scholar] [CrossRef]
- Zheng, Q. Reinforced industrialized development and application. China Build. Mater. Sci. Technol. 2016, 25, 79–81. (In Chinese) [Google Scholar]
- Bi, W.Z. Discuss advantages and disadvantages of PC buildings development. Archit. Decor. 2018, 16, 178–179. (In Chinese) [Google Scholar]
- Chen, J.W. Factory-fabricating and commercially distributing reinforcement components made from steel bars. South. Met. 2010, 173, 7–14. (In Chinese) [Google Scholar]
- Wang, Y. Construction of evaluation index system for the industrialization level of affordable housing. Hous. Sci. 2017, 12, 18–21. (In Chinese) [Google Scholar]
- Sezen, H.; Shamsai, M. High-strength concrete columns reinforced with prefabricated cage system. J. Struct. Eng. 2008, 134, 750–757. [Google Scholar] [CrossRef]
- Shamsai, M.; Whitlatch, E.; Sezen, H. Economic evaluation of reinforced concrete structures with columns reinforced with prefabricated cage system. J. Constr. Eng. Manag. 2007, 133, 864–870. [Google Scholar] [CrossRef]
- Jaillon, L.; Poon, C.S.; Chiang, Y.H. Quantifying the waste reduction potential of using prefabrication in building construction in Hong Kong. Waste Manag. 2009, 29, 309–320. [Google Scholar] [CrossRef]
- US Environmental Protection Agency. Defining Life Cycle Assessment (LCA). Available online: http://www.gdrc.org/uem/lca/lca-define.html (accessed on 5 April 2018).
- Rey, F.J.; Velasco, E.; Varela, F. Building Energy Analysis (BEA): A methodology to assess building energy labelling. Energy Build. 2007, 39, 709–716. [Google Scholar] [CrossRef]
- Pérez-García, A.; Víllora, A.G.; Pérez, G.G. Building’s eco-efficiency improvements based on reinforced concrete multilayer structural panels. Energy Build. 2014, 85, 1–11. [Google Scholar] [CrossRef]
- Castellano, J.; Castellano, D.; Ribera, A.; Ciurana, J. Developing a simplified methodology to calculate CO2/m2 emissions per year in the use phase of newly-built, single-family houses. Energy Build. 2015, 109, 90–107. [Google Scholar] [CrossRef]
- Zhang, X.; Wang, F. Life-cycle assessment and control measures for carbon emissions of typical buildings in China. Build. Environ. 2015, 86, 89–97. [Google Scholar] [CrossRef]
- Nadoushani, Z.S.M.; Akbarnezhad, A. Effects of structural system on the life cycle carbon footprint of buildings. Energy Build. 2015, 102, 337–346. [Google Scholar] [CrossRef]
- Li, X.; Yang, F.; Zhu, Y.; Gao, Y. An assessment framework for analyzing the embodied carbon impacts of residential buildings in China. Energy Build. 2014, 85, 400–409. [Google Scholar] [CrossRef]
- Oh, B.K.; Park, J.S.; Choi, S.W.; Park, H.S. Design model for analysis of relationships among CO2 emissions, cost, and structural parameters in green building construction with composite columns. Energy Build. 2016, 118, 301–315. [Google Scholar] [CrossRef]
- Park, H.S.; Lee, H.; Kim, Y.; Hong, T.; Choi, S.W. Evaluation of the influence of design factors on the CO2 emissions and costs of reinforced concrete columns. Energy Build. 2014, 82, 378–384. [Google Scholar] [CrossRef]
- Ramesh, T.; Prakash, R.; Shukla, K.K. Life cycle energy analysis of buildings: An overview. Energy Build. 2010, 42, 1592–1600. [Google Scholar] [CrossRef]
- Wong, F.; Tang, Y.T. Comparative embodied carbon analysis of the prefabrication elements compared with in-situ elements in residential building development of Hong Kong. World Acad. Sci. 2012, 62, 161–166. [Google Scholar]
- Foraboschi, P.; Mercanzin, M.; Trabucco, D. Sustainable structural design of tall buildings based on embodied energy. Energy Build. 2014, 68, 254–269. [Google Scholar] [CrossRef]
- Kim, Y.W.; Azari-N, R.; Yi, J.S.; Bae, J. Environmental impacts comparison between on-site vs. prefabricated Just-In-Time (prefab-JIT) rebar supply in construction projects. J. Civ. Eng. Manag. 2013, 19, 647–655. [Google Scholar] [CrossRef]
- Penadés-Plà, V.; Martí, J.V.; García-Segura, T.; Yepes, V. Life-cycle assessment: A comparison between two optimal post-tensioned concrete box-girder road bridges. Sustainability 2017, 9, 1864. [Google Scholar] [CrossRef]
- Chen, C. Research of Building Carbon Emissions Control and Forecast Based on LCA Theory. Master’s Thesis, Huazhong University of Science and Technology, Wuhan, China, 2013; pp. 27–28. (In Chinese). [Google Scholar]
- Yin S., C. Study of Life-Cycle Carbon Emission in Buildings. Master’s Thesis, Harbin Institute of Technology, Harbin, China, 2012. (In Chinese). [Google Scholar]
- Yu, Y.Z.; Li, T.L.; Liu, Z.Y.; Huang, H.C.; Lv, Y.F.; Chen, H.; Jin, S.X.; Zhang, X.C. Study on the grading standard of physical labor intensity. Chin. J. Occup. Dis. Labor Hyg. 1983, 4, 195–198. (In Chinese) [Google Scholar]
- Chen, X.D.; Bai, S.G.; Ceng, Z.S.; Yin, Y.L.; Lin, Q.H.; Zhang, Z.X. Survey on physical labor intensity of construction workers. Chin. J. Occup. Dis. Labor Hyg. 1992, 10, 375–377. (In Chinese) [Google Scholar]
- Yan, Y. Research of Energy Consumption and CO2 Emission of Building in Zhejiang Province Based on Life Cycle Assessment. Master’s Thesis, Zhejiang University, Hangzhou, China, 2011. (In Chinese). [Google Scholar]
- Reap, J.; Roman, F.; Duncan, S.; Bras, B. A survey of unresolved problems in life cycle assessment. Int. J. Life Cycle Assess. 2008, 13, 374. [Google Scholar] [CrossRef]
- Li, D.Z.; Chen, H.X.; Hui, E.C.; Zhang, J.B.; Li, Q.M. A methodology for estimating the life-cycle carbon efficiency of a residential building. Build. Environ. 2013, 59, 448–455. [Google Scholar] [CrossRef]
- Zhang, X.C. Carbon Emissions Measurement Methods and Comparative Studies on Green Building Structural System. Master’s Thesis, Harbin Institute of Technology, Harbin, China, 2014. (In Chinese). [Google Scholar]
- International Energy Agency. Evaluation of Embodied Energy and CO2eq for Building Construction (Annex 57). 2016. Available online: http://www.iea-ebc.org/Data/publications/EBC_Annex_57_ST4_Case_Studies_Recommendations.pdf (accessed on 1 December 2018).
- National Bureau of Statistics of the People’s Republic of China. Chinese Statistical Yearbook 2013/2014. Available online: http://www.stats.gov.cn/tjsj/ndsj/2013/indexch.htm (accessed on 5 October 2017).
- Bhat, I.K.; Prakash, R. LCA of renewable energy for electricity generation systems—A review. Renew. Sustain. Energy Rev. 2009, 13, 1067–1073. [Google Scholar]
- Shen, X.T.; Zhu, J.P. Analysis and prediction of energy-saving, energy consumption and pollution reduction in green construction for industrialized residential building. Build. Constr. 2007, 29, 983–985. (In Chinese) [Google Scholar]
- Pan, X.Y.; Liu, Y.F.; Liu, H. Technologies of preventing steel reinforcement cage up-floating in bored piles construction. Constr. Technol. 2015, 44, 41–44. (In Chinese) [Google Scholar]
- Zhu, Y.M.; Wang, Y.Q. Study and application of prefabrication technology for concrete reinforcing cage. Build. Constr. 2011, 33, 283–285. (In Chinese) [Google Scholar]
- Dong, Y.H.; Ng, S.T. A life cycle assessment model for evaluating the environmental impacts of building construction in Hong Kong. Build. Environ. 2015, 89, 183–191. [Google Scholar] [CrossRef]
- Ng, T.K.; Kwok, S.M. Carbon emission estimation—A design verification tool for new public housing developments in Hong Kong. In Proceedings of the HKU-HKHA International Conference, Hong Kong, China, 2–3 May 2013. [Google Scholar]
- Garg, A.; Kamat, V.R. Virtual prototyping for robotic fabrication of rebar cages in manufactured concrete construction. J. Arch. Eng. 2013, 20, 06013002. [Google Scholar] [CrossRef]
Figure 1.
(a) ISRB Technique; (b) PRC Technique.

Figure 2.
(a) ISRB construction method for shear walls; (b) PRC construction method for shear walls.
Figure 2.
(a) ISRB construction method for shear walls; (b) PRC construction method for shear walls.

Figure 3.
(a) ISRB manufacturing process; (b) PRC manufacturing process.

Figure 4.
Layout plan of a typical floor in the high-rise building.

Figure 5.
Material emissions of scaffolding considering reuse.

Figure 6.
Carbon emissions for PRC prefabrication in factory.

Figure 7.
Transport CO2 emissions of a high-rise building.

Figure 8.
Variable ratio of CO2 emissions of trucks with different tonnages for PRC transport.

Figure 9.
Man-day CO2 emissions for a typical floor of a high-rise building.

Figure 10.
Carbon emissions from the machinery for rebar.

Figure 11.
Machinery emissions of scaffolding.

Figure 12.
Carbon increases and reductions for the five categories in three stages.

Table 1.
A comparison of the manufacturing processes included in ISRB method and PRC method.
| Structural Components | ISRB Method | PRC Method | ||||
|---|---|---|---|---|---|---|
| Manufacture Processes | Main Material | Workforce | Manufacture Processes | Main Material | Workforce | |
| Shear wall | Binding rebar→fabricating timber formwork on site→installing scaffolding tied to timber mold→rebar binding and hole drilling→concrete pouring and vibrating→curing and stripping the mold | Rebar, scaffolding, concrete | Laborer | PRC transported to the site→locally welding PRC to reinforcing mesh→formwork assembly→grouting and vibrating→plastering and curing | PRC column and reinforcing mesh, scaffolding, rebar, concrete | Skilled worker |
| Slab | Setting out→fabricating timber formwork on site→installing scaffolding tied to timber mold→rebar binding and hole drilling→concrete pouring and vibrating→curing and stripping the mold | Rebar, scaffolding, concrete | Laborer | PRC transported to the site→floor deck assembly→locally welding PRC truss to reinforcing mesh→grouting and vibrating→plastering and curing | Floor deck, PRC truss and reinforcing mesh, scaffolding, rebar, concrete | Skilled worker |
Table 2.
Description of methods for comparison.
| Stage | Method | Description of Method |
|---|---|---|
| Material preparation | ISRB | ISRB shear wall, slab, beam, including reinforcing bar produced in a factory |
| PRC | PRC shear wall, slab, beam, including PRC column, reinforcing mesh, PRC truss, floor deck produced in a factory | |
| Transportation | ISRB | Machinery for transporting materials for casting on site, including delivery truck |
| PRC | Machinery for transporting components for assembling and casting on site, including delivery truck and auto-crane | |
| On-site construction | ISRB | Laborer and machinery included in the ISRB construction method |
| PRC | Skilled worker and machinery included in the in-place PRC construction method |
Table 3.
Data sources for life cycle inventory.
| Item | Data Source |
|---|---|
| Quantity of materials and formwork | Estimated from drawings |
| Transport distance | Estimated using Google maps based on the factory locations |
| Transport method | Documentations |
| Factory location | Documentations |
| Energy, water and fuel consumption | Documentations/Stakeholder interviews |
| Adoption of construction machinery | Documentations/Stakeholder interviews |
| Electricity mix in Nanjing | Provincial Greenhouse Gas Inventory Guidelines |
Table 4.
CO2 emission factors for workers and material.
| Category | Item | Unit | CO2 Emission Factor kg CO2/Unit |
|---|---|---|---|
| Workforce | Worker | Man-day | 0.95 [38] |
| Material | Steel * | kg | 1.722 [36] |
| Steel wire * | kg | 2.208 [36] | |
| Rebar * | kg | 1.53 [40] |
Note: the recycling rate of building materials is considered in the items marked *.
Table 5.
Main equipment used for MP-PRC.
| Manufacture Process | Machine Type | Power Rate (kW) | Working Time (h) | Electricity (kWh) |
|---|---|---|---|---|
| Weld | Reinforcing mesh welding machine, YLWH-220 | 120.0 | 183.3 | 21,996.0 |
| Produce | Floor roll forming machine, YF720 | 37.0 | 60.8 | 2249.3 |
| Weld | Truss girder welding machine, SJL300T-18 | 61.7 | 68.3 | 4212.2 |
| Bend | Bar bending machine, YZ-WG-12 | 30.0 | 292.4 | 8772.7 |
Table 6.
Model set-up for T-ISRB (transportation for in-situ reinforcing bar) and T-PRC (transportation for prefabricated rebar cage).
Table 6.
Model set-up for T-ISRB (transportation for in-situ reinforcing bar) and T-PRC (transportation for prefabricated rebar cage).
| Machinery Equipment Name | Type | Power Rate (kW) | Fuel Consumption (L/t·100 km) | CO2 Emission Factor (EF) kg CO2 /(t·km) |
|---|---|---|---|---|
| Truck 10 t (diesel oil) | JUNCHI 4800 | — | 28.6 | 0.0556 [38] |
| Auto-crane 10 t (diesel oil) | EQ5250JSQGZ5D1 | 140 | 28.7 | — |
Table 7.
Model set-up for the OC-ISRB (on-site construction for in-situ reinforcing bar) workforce and OC-PRC (on-site construction for prefabricated rebar cage) workforce.
Table 7.
Model set-up for the OC-ISRB (on-site construction for in-situ reinforcing bar) workforce and OC-PRC (on-site construction for prefabricated rebar cage) workforce.
| Workforce | Unit | Shear Wall | Slab | Beam | Components Group | ||||
|---|---|---|---|---|---|---|---|---|---|
| OC-ISRB | OC-PRC | OC-ISRB | OC-PRC | OC-ISRB | OC-PRC | OC-ISRB | OC-PRC | ||
| Laborers | Man-day | 508 | 0 | 279 | 0 | 196 | 0 | 982 | 0 |
| Skilled workers | Man-day | 0 | 279 | 0 | 153 | 0 | 108 | 0 | 540 |
Table 8.
Model set-up for OC-ISRB machinery and OC-PRC machinery.
| Construction Machinery | Machine-Shift (Working for 8 h) | CO2 Emission Factor kg CO2/Machine-Shift | Energy Source | |
|---|---|---|---|---|
| OC-ISRB | OC-PRC | |||
| Butt-welder 75 kW | 23.6 | 6.8 | 83.9 | Electricity |
| Angle bending machine Φ40 | 423.6 | 251.7 | 8.7 | Electricity |
| Direct current welder 32 kW | 91.7 | 84.6 | 90.8 | Electricity |
| Bar cuter Φ 40 mm | 119.0 | 73.7 | 21.9 | Electricity |
| Bar straightener Φ14 | 2.0 | 16.4 | 8.1 | Electricity |
| SCD200 construction elevators | 348.1 | 191.4 | 36.6 | Electricity |
| Electric winch 50 kN | 0.0 | 8.0 | 60.1 | Electricity |
| Climbing tower crane 200 t m | 29.5 | 18.1 | 161.4 | Electricity |
| Truck 10 t | 3.8 | 14.8 | 127.3 | Diesel |
| Auto-crane 10 t | 0.0 | 10.1 | 97.1 | Diesel |
Table 9.
Total weight of scaffolding tubes and couplers for 27-storey high-rise building.
| Item | Unit | Interior Steel Scaffold | Steel Scaffold on the External Wall | Group | |||||
|---|---|---|---|---|---|---|---|---|---|
| Shear Wall | Slab | ||||||||
| ISRB | PRC | ISRB | PRC | ISRB | PRC | ISRB | PRC | ||
| Fixing area | m2 | 462 | 462 | 604 | 604 | 13,662 | 0 | ||
| Steel tube | kg | 6436 | 3862 | 8414 | 5048 | 190,312 | 0 | ||
| Coupler | kg | 1247 | 748 | 1630 | 978 | 36,887 | 0 | ||
| pcs | 957 | 574 | 1304 | 782 | 29,510 | 0 | |||
| Tube lifting capacity | t | 167 | 100 | 219 | 131 | 183 | 0 | 569 | 232 |
| Coupler lifting capacity | t | 33 | 19 | 42 | 25 | 36 | 0 | 110 | 45 |
| ∑ | t | 679 | 277 | ||||||
Table 10.
Variable ratio of CO2 emissions (%).
| Three Stages | ISRB ∑(t CO2) | PRC ∑(t CO2) | Variety (t CO2) | Variable Ratio (%) | |
|---|---|---|---|---|---|
| Material preparation | 846 t | 871 t | +25 t | +2.96% | |
| Transportation | 1.6 t | 6.9 t | +5.3 t | +331.25% | |
| On-site construction | Construction machinery and equipment | 32 t | 23 t | −9 t | −28.13% |
| Workforce | 25 t | 14 t | −11 t | −44.00% | |
| Scaffolding | 37 t | 15 t | −22 t | −59.46% | |
| ∑(t CO2) | 941.6 t | 929.9 t | −11.7 t | −1.24% | |
Table 11.
Parameters for temporary accommodation.
| Item | Unit | For A Mobile Home of 22.68 m2 |
|---|---|---|
| One day power supply (6 h) | W | 630 |
| No. of workers | ― | 7 |
© 2018 by the authors. Licensee MDPI, Basel, Switzerland. This article is an open access article distributed under the terms and conditions of the Creative Commons Attribution (CC BY) license (http://creativecommons.org/licenses/by/4.0/).
Share and Cite
MDPI and ACS Style
Jiang, B.; Li, H.; Dong, L.; Wang, Y.; Tao, Y. Cradle-to-Site Carbon Emissions Assessment of Prefabricated Rebar Cages for High-Rise Buildings in China. Sustainability 2019, 11, 42. https://doi.org/10.3390/su11010042
AMA Style
Jiang B, Li H, Dong L, Wang Y, Tao Y. Cradle-to-Site Carbon Emissions Assessment of Prefabricated Rebar Cages for High-Rise Buildings in China. Sustainability. 2019; 11(1):42. https://doi.org/10.3390/su11010042
Chicago/Turabian StyleJiang, Boya, Hongxian Li, Ling Dong, Yu Wang, and Yiqi Tao. 2019. "Cradle-to-Site Carbon Emissions Assessment of Prefabricated Rebar Cages for High-Rise Buildings in China" Sustainability 11, no. 1: 42. https://doi.org/10.3390/su11010042
Note that from the first issue of 2016, this journal uses article numbers instead of page numbers. See further details here.