A Coordinated Approach for Supply-Chain Tracking in the Liquefied Natural Gas Industry

1
Australasian Joint Research Centre for Building Information Modelling, School of Design and the Built Environment, Curtin University, Perth 6845, Australia
2
Department of Building and Real Estate, Hong Kong Polytechnic University, Hong Kong, China
3
School of Design and the Built Environment, Curtin University, Perth 6845, Australia
*
Author to whom correspondence should be addressed.
Sustainability 2018, 10(12), 4822; https://doi.org/10.3390/su10124822
Submission received: 25 October 2018
/
Revised: 27 November 2018
/
Accepted: 14 December 2018
/
Published: 17 December 2018
Abstract
:With the increased size and complexity of liquefied natural gas (LNG) projects, supply-chain management has become a challenging process due to involvements of the remote location of the project site and the multiple stakeholders. The transparency and traceability of the supply-chain are critical as any surpluses or shortages of materials will put the project at risk. Currently, limited research has been conducted on LNG projects considering the total supply-chain perspective, which refers to all stages of materials tracking in off-site manufacturing, transportation, and site logistics. The purpose of this research is to propose a framework of a coordinated approach for supply-chain tracking in the LNG industry. Two focus group studies were organized to develop the proposed framework: One for LNG construction supply chain process development, and another for alternative tracking technologies selection. In addition, two experiments, namely off-site fabrication tracking and site logistics tracking, were conducted in a field to evaluate the feasibility of the proposed framework. Technology limitations were also discussed in terms of field implementation.
1. Introduction
Supply-chain management (SCM) is a very challenging process in the liquefied natural gas (LNG) industry. There are three main reasons: (1) They are large and complicated; LNG projects are particularly massive undertakings with thousands of construction workers on site and an extremely long supply-chain during project implementation. Take Australia as an example, the footprint of an LNG project can span an area larger than the entire UK [1]. Other than building, few other such large construction projects are undertaken outside industrialized areas; (2) challenging locations: The new wave of LNG projects are mostly in challenging locations—remote from traditional industry supply bases, and sometimes in tough terrain that may also be environmentally or politically sensitive. For instance, the Gorgon LNG plant on Barrow Island resulted in challenging SCM requirements given that the located area is a Class 1a Nature Reserve [1]; and (3) cumulative impacts: Multiple projects can be constructed in contiguous locations, putting stress on local workforces and suppliers, and leading to sharply rising costs [1]. Such stress also comes from a building up steam of supply chain sustainability, as government and communities become more environmentally conscious and request proper social/environmental impact management plans from LNG corporations [2].
Ineffective supply-chain management for this type of megaproject can result in significant cost blow-outs, waste, and delays in project completion or operation. The waste, such as energy lost and carbon emission from extra routing due to a poor material tracking and control, could cause direct environmental impacts. Such cost inefficiencies will also negatively impact the project performance, especially on surpluses or shortages of materials [3]. To improve the SCM, research effort has been put on many aspects, including supplier selection or evaluation [4], analytical modeling [5], performance measurement [6], and influence analysis of sustainable SCM [7]. Regarding the improvement of the tracking abilities on the supply chain, innovative technologies have the capability to address ineffective issues by integrating all materials with supply-chain work processes to provide project teams with online access to information during all project phases, which produces complete supply-chain management from manufacturer to construction site [8]. The technologies enable effective SCM, delivering cost savings and improved procurement efficiency [9].
Research gaps can be identified that previous studies regarding the use of tracking technologies for SCM have mainly been focused on certain stages of the project lifecycle. Single tracking technology was first tested for improving SCM performance, such as barcodes [3,10], radio frequency identification (RFID) [11,12,13], global positioning systems (GPS) [14,15,16], ultra-wide band (UWB) [17,18,19], and wireless sensor networks (WSN) [20,21]. Then, integrated tracking solutions were developed to allow for efficient SCM on a construction site [22] and a storage yard of a prefabricated plant [23]. Asset tracking during the stages of shipping and building maintenance were also investigated [3,24]. However, limited studies have been conducted on LNG projects considering the total supply-chain perspective, which refers to all stages of materials tracking in off-site manufacturing, transportation, and site logistics.
Therefore, the aim of this paper is to propose a framework of a coordinated approach towards SCM in LNG construction that integrates different tracking technologies. Three main elements are developed within the proposed framework: (1) Supply-chain tracking for general-material management; (2) supply-chain tracking for project specific-material management; and (3) a supply-chain control platform. Two experiments were then conducted in the field to evaluate the feasibility of the proposed approach. The approach presented in this paper can be applied in other industries, such as mining, infrastructure, and building.
2. Related Works
2.1. Coordinated Supply-Chain Management in the LNG Industry
Poor coordination and fragmented practices have impacted the productivity and performance issues of the LNG industry. For instance, the LNG practices in Australia are far from satisfactory: The cost of building new LNG projects has increased tremendously in the past decade and is now about 20%–30% higher than that of the competition in North America and East Africa [25]. The LNG industry comprises complicated practices throughout its project lifecycle from the stages of investment, development, design, construction, and until the downstream phases. The LNG supply-chain can be described as all activities involved from the planning and extraction of the natural gas until it is consumed by the end users [26]. The focus of this paper is on the supply chain required to build an LNG project. The supply chains of the plant operation and LNG itself to the end-consumer are separate topics and are not discussed in this paper. Managing supply chain means ensuring LNG projects get the materials and the people they need to be built and to operate efficiently, on time, in the right order and condition, safely and yet at the lowest possible price. Improving this kind of the LNG supply-chain requires both coordinated and integrated SCM.
A coordinated SCM describes the processes that revolve around the three traditional stages in the supply-chain: Procurement, production, and distribution. It includes coordinated actions from three aspects, such as: Buyer-vendor coordination for the procurement of materials or equipment, production-distribution coordination for transportation of the products, and inventory-distribution coordination for the optimal inventory levels [27,28]. The actions would become more difficult in LNG projects due to their huge project-size, the number of stakeholders involved, and the project’s often remote location. Optimizing the cost, timeliness, quality, and inventory are necessary. This requires full coordination between two perspectives of SCM, namely from: (1) A purchasing and supply management perspective; and (2) a transportation and logistics perspective. Yet, these perspectives originally were separated in SCM’s philosophy [29,30]. Therefore, the coordinated SCM should work with the three coordinated actions within the two perspectives in the LNG supply-chain. This coordinated supply-chain strategy then could avoid any disturbances to the production processes or logistic functions across the project lifecycle.
Furthermore, the coordinated SCM needs to integrate with transparent and traceable information. It is described as the integrated SCM in this context. The materials and information flows are central to the SCM [31,32,33]. The use of related technologies or software is recommended, which will improve the supply-chain relationship by enhancing the trust, communication, and collaboration among the stakeholders [34,35]. Enabling transparency and traceability in the supply-chain tracking is key for this integrated SCM. Hence, tracking technologies should be adopted to enhance this integration. However, the adoption of tracking technologies is very challenging in the LNG supply-chain due to the increased complexity of the project requirements, uncertain demands, production conditions, and large numbers of specialized and interdependent suppliers [36]. Therefore, this research intends to address the supply-chain challenge by integrating various tracking technologies into the LNG industry.
2.2. Tracking Technologies
The integration of tracking technologies in supply-chain monitoring has great potential in improving management outcomes through the transparency of goods delivery. For the last two decades, several tracking technologies have been surveyed, implemented, and evaluated through supply-chain research studies, experimental implementations, and actual applications.
Firstly, barcodes and related paper-based tracking approaches have been widely utilized in current industrial environments with their features, such as low cost, and easy installation, reading, and replacement [37]. Nowadays, the applications for supply-chains have massively adopted barcodes in order to control the traceability of goods, such as equipment and materials tracking, and electronic document management [10]. As a robust tracking approach for asset management applications, barcoding still suffers from a certain amount of problems, such as line-of-sight restrictions, and that they are easily damaged [3], which creates obstacles in supply-chain scenarios. Nevertheless, barcoding is still an essential approach in industrial logistics.
RFID technologies have been progressively adopted in tracking material’s transportation and status during construction in the past 10 years [3]. The RFID system usually contains two main components: Readers and tags. RFID readers acquire the information from tags based on radio wave communications between tags and antennas on the readers [24]. Once the tags of interest have been located within the detecting range of readers, the Identities of these tags can be received and related information regarding the tagged objects can be identified. According to the used RFID technology, the systems can be classified into two types: Passive and active RFID systems [38]. The communication of a passive system only relies on the signal emitted from the antenna of the reader. Tags are responsible for the signal reflection based on their induction coils without battery support, which only offers a short communication range. On the contrary, the active system identifies information by triggering tags and receiving tags’ active signal responses. Due to its decreasing cost and relatively long range communication, RFID has attracted a lot of interests from both researchers and industry professionals. Examples of their use include indoor location identification for construction projects [39], and the improvement of construction supply network visibility [40,41]. However, the tracking system still suffers from environmental factors, which negatively impact the reliability of widespread utilization for total supply-chain management. The environmental factors affect the magnetic flux and weaken the radio frequency signal [42]. They include multipath fading issues [43], the presence of metal and liquid in the vicinity of the tag, and so on. Furthermore, little research has focused on dynamic RFID tracking in supply-chain scenarios [44].
GPS, as an outdoor localization technology, can provide logistic information frequently. It can be utilized for transportation tracking in a medium- or long-range area, such as tracking asset movement from a warehouse to a construction site. GPS was first initialized in the United States during the 1970s. Except for satellites running on the orbit of the earth, the ground-based equipment contains a transmitter and a receiver, which is usually combined into a single unit and is responsible for collecting and decoding the signal from satellites [45]. The latitude, longitude, and altitude of the unit can be determined by triangulation calculations according to the positions and time off-sets of four satellites. Such tracking approaches are now commonly used in the trucking industry.
Apart from the three types of tracking technologies mentioned above, UWB, Bluetooth, and wireless local area networks (WLAN) are also discussed in asset tracking. UWB belongs to the radio frequency positioning family [46]. The feature of UWB is its short pulse, which allows the filtering of the reflected signal and further helps to overcome multi-path distortion for more accurate positioning results [47]; Bluetooth can only obtain two-dimensional positioning data and is known to be extremely accurate in indoor environments [46]. The WLAN system can reuse the existing network infrastructure of the site and be used to calculate the position of the subject based on the signal strength as well [48]. The limitation is the need for the target to be connected to the WLAN [46].
Regarding the performance of the state-of-the-art tracking approaches deployed in different scenarios of a supply-chain, hybrid solutions integrating multiple tracking devices and methods have attracted great research intentions today [3,49]. Ergen et al. [23] integrated RFID technology with a crane-mounted GPS receiver to record the position of items relocated by the crane. Torrent and Caldas [14] utilized a mobile RFID reader with a GPS receiver to collect the signal of tags and proposed a method to automate the localization of construction components in industrial projects. By selecting the most appropriate group of tracking technologies, the advantages of these technologies can be amplified while the drawbacks are minimized because they are complementary to each other. This is especially practical in the case that contains multiple and complex usage scenarios, such as SCM. One single identification approach is not likely to meet the needs of a complete end-to-end application in the supply-chain [3].
3. Research Methods
Focus group methodology was selected to develop the proposed framework. Through focus group discussions, participants’ perceptions, feelings, and experiences were interwoven and stimulated so as to deepen the level of understanding on specific topics (i.e., supply chain and process tracking) and avoid individual bias drawbacks [50]. Two focus group studies were conducted: The first one was for the development of the total supply chain process in LNG construction, and the second one was for the selection of the alternative tracking technologies to improve the visibility of the supply chain process. To decrease dominant voices, homogenous participants were invited to the two focus groups according to their stakeholder status [51].
3.1. First Focus Group Study
Five industry experts were invited to participate in the first focus group study, who were from different companies and had been involved in multiple LNG construction projects. A draft version of the total supply chain process map was firstly introduced, which was developed by the authors based on the previous literature. Then, a series of short questions were asked to check the reasonability and authenticity of the proposed process map. During the discussion, the owner pointed out that there were two different types of materials in LNG construction, namely general materials and project-specific materials, and each of them had different SCM strategies. The former included standard materials and tools; and the latter contained specified instruments and offsite fabricated modules. The logistics solution provider emphasized the shipping difference between the two delivery strategies: Free on Board (FOB) and Ex Works (EXW). Under the FOB agreement, there is no line item payment by the buyer for the cost of getting the goods onto the transport. EXW means that a buyer incurs the risks for bringing the goods to their final destination. The fabricator confirmed the process during fabrication, however, he emphasized that the process was not constant and would be adjusted based on the client’s requirements. For instance, surface treatment and/or pre-assembly were not always necessary for all productions. The general contractor pointed out the difficulties of site logistics management, especially for warehouse management. The final version of the total supply chain process map is shown in Figure 1 and a detailed explained in Section 4.
3.2. Second Focus Group Study
The second focus group study involved seven people. Two of them were from the first focus group and another five from five different tracking solution providers, respectively. Seven types of tracking technologies were introduced and discussed at the beginning, namely barcode, passive RFID, active RFID, GPS, UWB, Wi-Fi, and Bluetooth. Due to the intrinsic safety requirement in the LNG industry (pointed out by the client), the last three technologies (i.e., UWB, Wi-Fi, and Bluetooth) were excluded in the following discussion because they had not been certified so far against explosion protection concepts. Subsequently, the validated version of the total supply chain process for LNG construction, which came from the first focus group study, was introduced to the participants. For each detailed process, they needed to evaluate the feasibility of the four alternative tracking solutions (i.e., barcode, passive RFID, active RFID, and GPS). Five factors were considered during the evaluation: (1) The type of the object to be tracked; (2) indoor or outdoor environment; (3) line-of-sight requirement; (4) location information requirement; and (5) tag removal. Finally, suggested solutions were given in terms of their low complexity in practice and cost-effectiveness. It should be noted that the five factors used to describe the characteristics of tracking events usually take place in each process. They act as selection criteria for suitable tracking solutions, instead of features of tracking technologies.
Table 1 illustrates the final evaluation results. Regarding the identification of objects that need to be tracked in each process, it was very straightforward for processes of number 1, 5–15. However, for processes of number 2–4 (i.e., Programming & Processing, Cutting & Drilling, and Welding), it was difficult to recognize the objects because of either no physical components or massive small steel pieces. According to the fabricator’s suggestion, shop drawings could be treated as the objects to reflect the status of the three processes. The reasons were threefold: (1) The fabrication plan was developed based on the shop drawings; (2) workers needed to reference the shop drawings frequently to finish their tasks; and (3) the shop drawings were always transferred from the end of the last process to the next one.
Tag removal was another significant factor that needed to be considered during field execution. It was ideal to attach the tag once and keep it through the project lifecycle. However, in the following three situations, tags should be considered to be removed: (1) The physical tags would have a negative impact on the quality of the following processes, such as surface treatment; (2) massive tags were attached within one large module, which would reduce the efficiency of searching the correct tag to be scanned during the following processes. For instance, large LNG offsite modules always started from small components or modules, and ended with several times of assemblies; (3) the price of the tags was so high that they need to be reused to lower the hardware cost for each implementation.
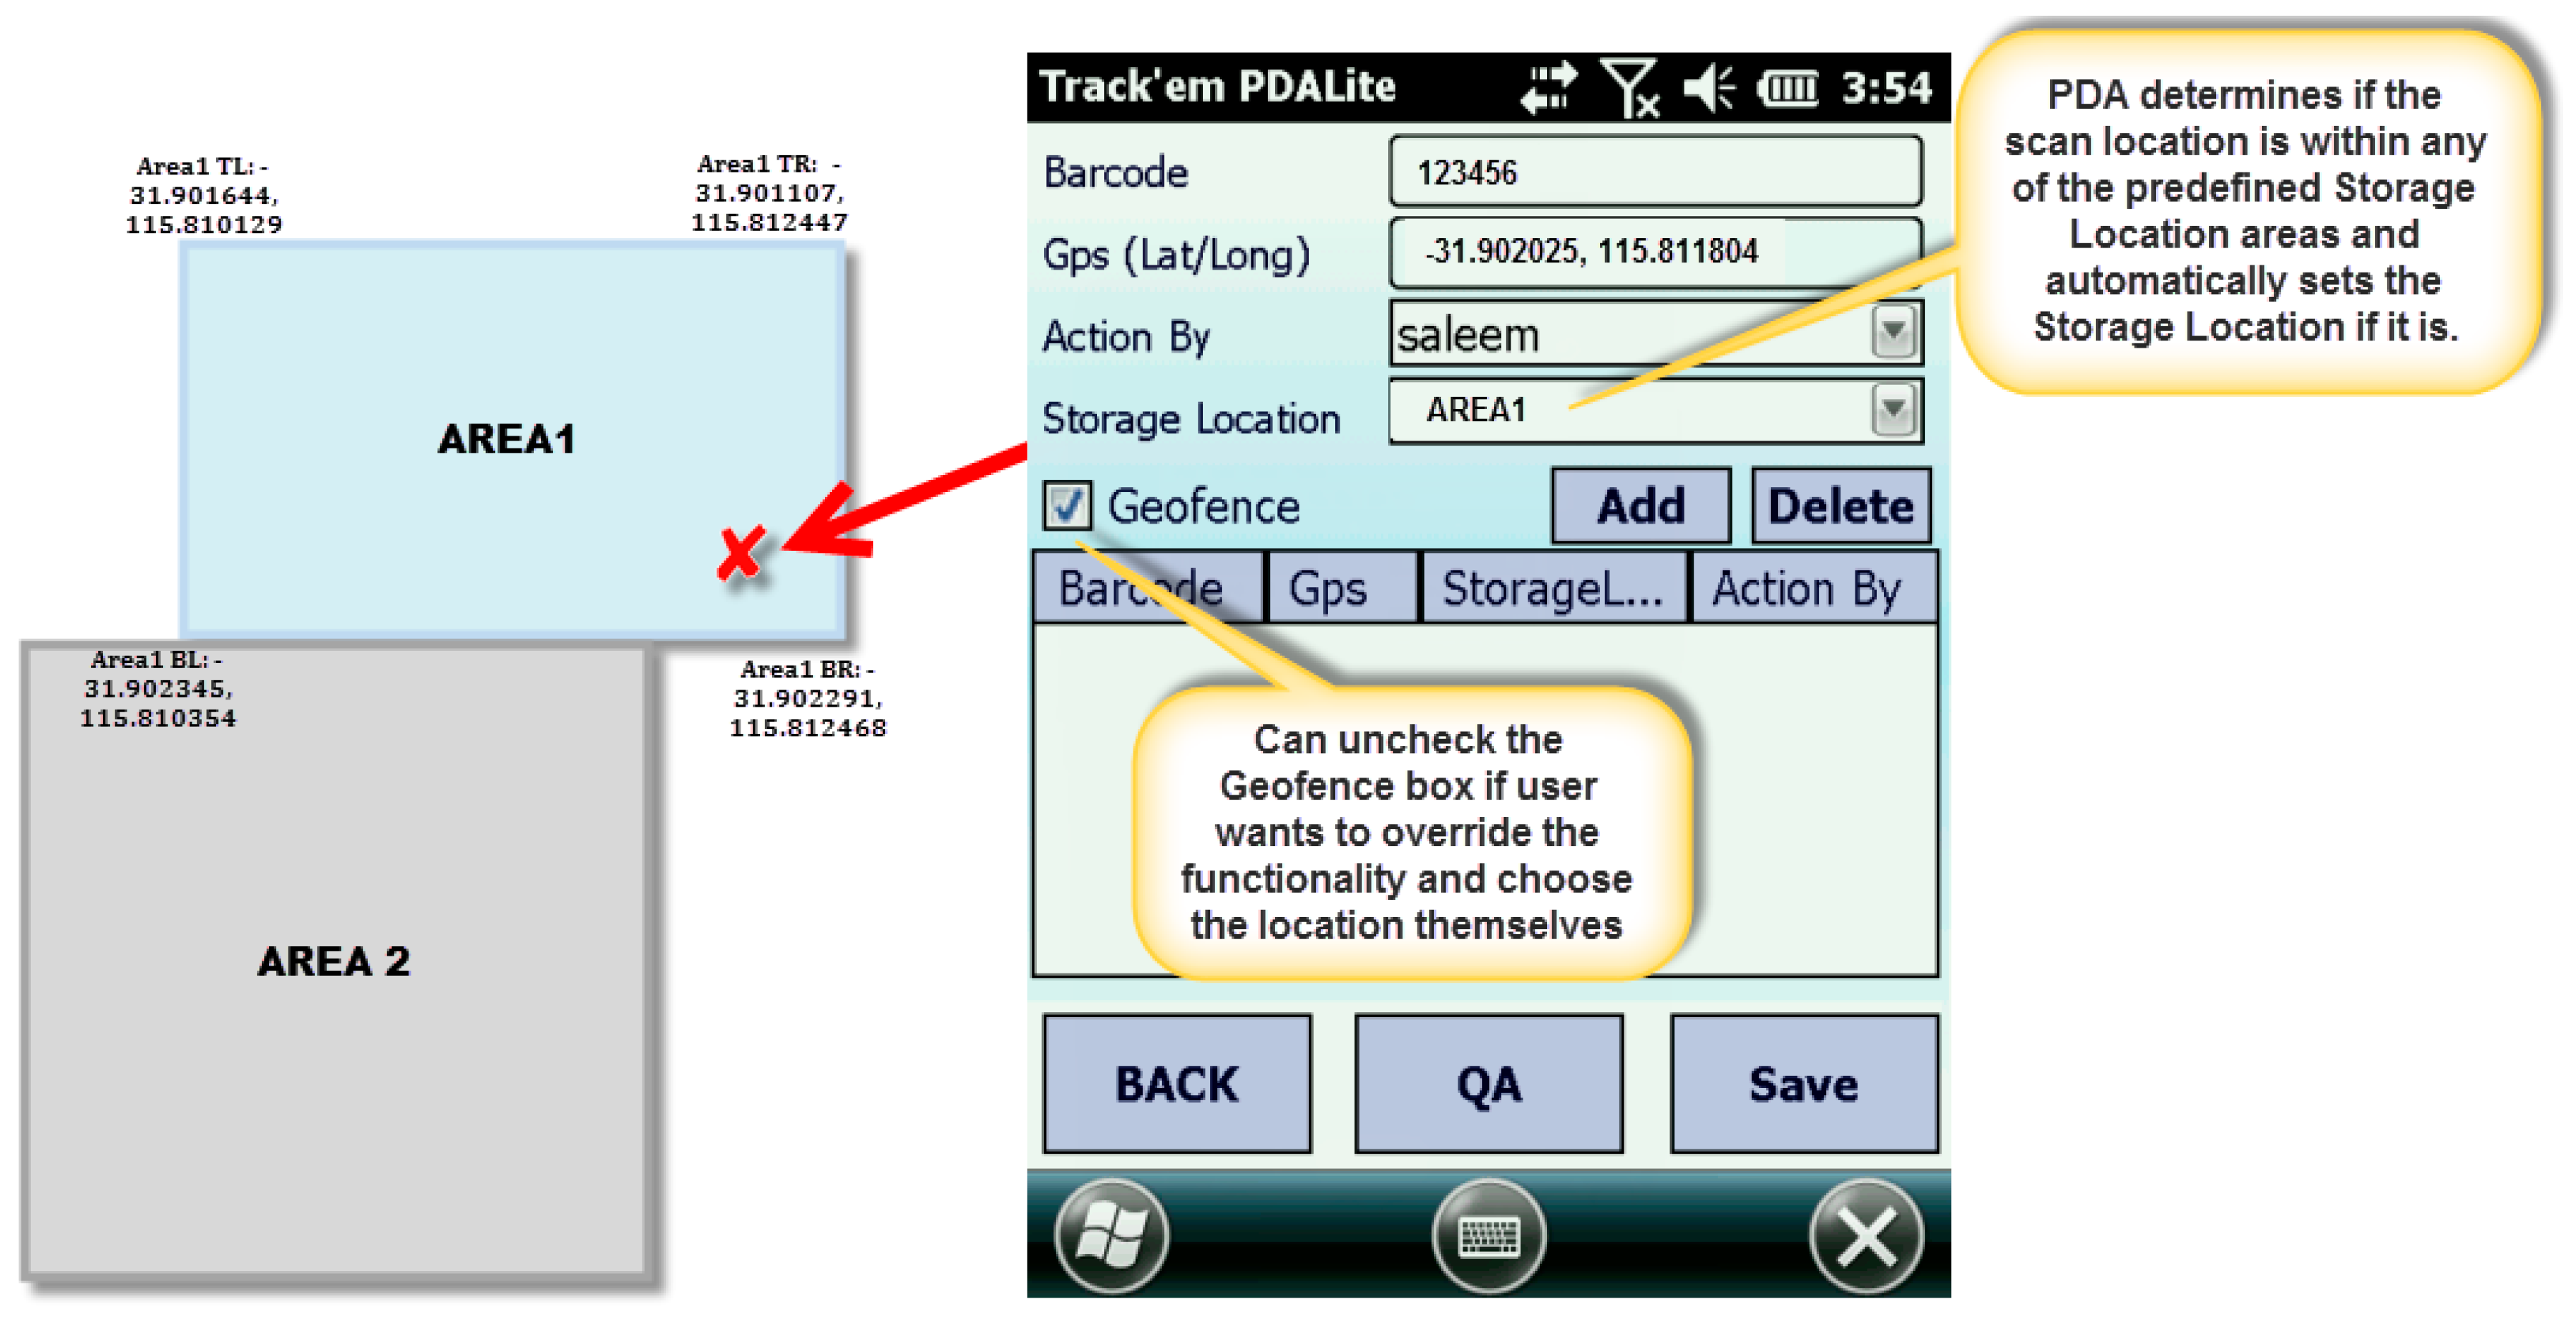
The feasibility assessment of the four alternative tracking solutions was critical to the effectiveness of the proposed framework. A detailed comparison of the four technologies was conducted (as shown in Table 2). Barcode and passive RFID were firstly discussed because they were very similar. When compared with passive RFID, barcode was more convenient to be generated and implemented in a real project. However, passive RFID was more powerful in terms of tracking capability, such as the ruggedness, reliability, data storage, and read speed. Considering the five factors for each detailed process, barcode and RFID were thought feasible for tracking all processes in the stages of offsite fabrication and construction site logistics. Although both technologies could not directly record the location information, there were two indirect approaches. The first one was GPS-enabled locating, which relied on the GPS data from the mobile reader. If the GPS data was within any of the predefined location areas, the mobile reader could automatically set the predefined location to the scanned barcode. Predefined locations should be assigned to a rectangular area (geo-fence) using four GPS coordinates (top left, top right, bottom left, bottom right). If the predefined location was not assigned a geo-fence, the second method could be used. The user could manually choose a predefined location for a component if needed.
In the shipping and delivery stage, the ability to continuously monitor and record sensor input as well as sensor’s geographical locations was necessary. That is why only barcode and passive RFID were supposed to be infeasible. Although active RFID had the ability, it was impossible to set up massive portals across a geographical area, let alone for transoceanic shipments. GPS technology was nominated as a feasible approach because of its continuous location tracking abilities and easy implementation with no additional infrastructure requirement.
4. Framework of a Coordinated Approach for Supply-Chain Tracking in LNG Construction
According to the outputs of the two focus group studies, a framework of a coordinated approach for supply-chain tracking in LNG construction was developed (as shown in Figure 1). There are three modules within the proposed framework: (1) Supply-chain tracking for the management of general materials, which is a cycle process that will occur more than once as the project progresses; (2) supply-chain tracking for the management of project-specific materials, which is always a one-off process and needs to be well managed and controlled because any delays will have a big impact on project construction; and (3) supply-chain control platform, which can integrate all the data collected from various tracking technologies (i.e., GPS, barcode, and RFID) so as to visualize and calculate the deviations between as-planned and actual supply-chain schedules. The details of each part are discussed in the subsequent sections.
4.1. Supply-Chain Tracking for the Management of General Materials
There are five main processes that need to be tracked during general-materials management, namely bill of materials (BOM), requisitions, purchasing, shipping and delivery, and warehouse and installation. From engineering documents, BOM is generated and presents the demands of materials’ items. The purchaser needs to summarize all the materials’ requirements into requisitions, then go to the purchasing process, which is to basically buy the materials from suppliers. When all the materials are ready for delivery, shipment is the next process and needs to be well organized to make sure the delivery of them to the site warehouse is at the right time. A staging area is used for staging materials from issue storage location to construction storage location. Material staging is necessary for the general materials, which are staged irrespective of construction orders.
Changes are very common during LNG plant construction due to design alterations, material damages, and missing items, which are revolving around the five processes in a circle for the material supply-chain. All the processes need to be compared and analyzed all the time to avoid a material surplus or shortages. For example, if the purchaser wants to analyze how much materials are needed, he needs to check the engineering drawings or the BOMs, know how much in the requisitions and site warehouse, and how much are damaged during shipping for the latest procurement.
4.2. Supply-Chain Tracking for the Management of Project-Specific Materials
Project-specific materials are mainly referred to offsite fabricated LNG modules. Three stages have been developed for managing the total material supply chain: Offsite fabrication, shipping and delivery, and construction site logistics (as shown in Figure 1). There are seven processes in Stage 1, which start with shop detailing and end with being ready for delivery. Completed shop drawings are transferred from shop detailing to welding. After welding, welded components are sent out for surface treatment or pre-assembly if required. When ready for delivery, small individual components are always needed to be packaged into a single pallet.
After the fabrication process, five milestones are designed in Stage 2 for the shipping progress tracking, namely (1) alongside ship; (2) on board; (3) ship’s arrival; (4) goods unloaded in a material offloading facility; and (5) arrival at a construction site. If the vessel is ready to be shipped, a fabricator is required to notice the owner to arrange the shipment. After the vessel is transported to a harbor that is typically a milestone achieved, which means the vessel is now alongside the ship. The next milestone is to ensure the boarding of the vessel. In an FOB contract, suppliers are responsible for the two milestones. When the ship arrives on the destination harbor, the third milestone is achieved. Owners need to arrange trucks for goods’ unloading and transfer them to a construction site. If the construction sites of the LNG plants are a nature reserve, another milestone of quarantine inspection is necessary to be incorporated after goods are unloaded.
All construction tasks related to site logistics can be categorized into three main types: Transportation, search and identification, and layout arrangement. Transportation represents all kinds of activities related to the movement of construction materials, equipment, and personnel among warehouses, laydown yard, and final installation area. Material search and identification present all the activities related to the check points, such as discovering the delivered goods, determining the construction status, and evaluating the construction performance. The layout arrangement represents the planning efforts in deciding the construction resource distribution. Based on different features of logistics tasks, all work tasks among site related logistics require different tracking approaches. They should be adopted depending on the possibility of human presence and the efficiency of information collection.
4.3. Supply-Chain Control Platform
The supply-chain control platform combines three-dimensional (3D) computer-aided design (CAD) models with as-planned supply-chain information and as-actual tracking data. The purpose of this platform is to visualize all the statuses of SCM, and detect any potential conflicts between materials’ delivery and construction plans. Decisions can be made in a timely fashion in the case that there is variance between the plans and actuals. Data provided by various tracking technologies and 3D CAD can significantly improve and speed up the process of monitoring and deviation analysis.
5. Experiments and Results
It is difficult to test all the suggested tracking solutions for the two types of the material management (i.e., project specific and general materials). Considering the limited resources, in this paper, the authors only validate the feasibility of the proposed framework for the supply-chain tracking of the project-specific materials. Two field experiments were conducted: The first one covered the whole process tracking during the stage 1 of offsite fabrication, and the second one focused on the tracking during the last two stages (i.e., shipping and delivery, and construction site logistics).
In terms of the principles of easy implementation and not interrupting the normal production work, barcode was agreed to be implemented in a real fabrication yard. In the second experiment, according to the discussions with the participants of the two focus group studies, active RFID was more likely to be seen for site logistics tracking because there had been several examples for using barcode or passive RFID for warehouse management. GPS was also tested for shipping and delivery tracking.
To visualize the statuses of the material supply chain, the researchers also developed plugins based on a 3D platform for barcode, RFID and GPS data reading, configuration, mapping, and synchronization. Figure 2 illustrates the architecture of the system integration. All the tracking data, including the received scanning records of barcodes and signals from GPS and RFID tags, were collected to the web portals. For example, the transportation status of material was monitored in a geographical-level map by retrieving GPS signals through time. Furthermore, the RFID signals of every site component tagged with an active RFID tag were collected. The triangulation processes then were performed in near real-time (delay ranged from 3 s to 8 s) to get the position information of the components. Navisworks software was selected as the basis of the 3D environment, and the web-based application programming interfaces (API) were applied to transfer data from the web portals to the 3D platform. By integrating all the tracking data into a 3D virtual plant environment, the status information of the corresponding components could be visualized and color-coded. Through the comparison of the tracking data and the as-planned manufacturing and delivery schedule, all situations, including delays, could be dynamically captured. The results could be further used to notify site managers or crews by short message service on short notice. Progress reports (i.e., items completed, items dispatched, items delivered, and items installed) were generated from the web portals while the overall S-curve graphs were from the 3D platform.
5.1. Experiment One: Offsite Fabrication Tracking
Through a research agreement with Fremantle Steel Group, the researchers were granted access to the fabrication facilities, which utilize state of the art computerized numerical control equipment in a combined covered workshop space of 36,000 square meters that can produce over 40,000 tonnes of fabricated steelwork annually. Pre-assembly and laydown areas of 60,000 square meters with mobile cranes up to a 350-tonne lifting capacity enables the pre-assembly of large modules and storage of large volumes of fabricated steelwork to suit customer delivery schedules.
5.1.1. Experiment Design
Two steel columns and one beam from a real construction project were selected as the tracking objects from cutting and drilling to be ready for delivery. Detailed manufacturing activities and their corresponding locations are defined in Table 3. In order to calculate the overall fabrication progress, the weight for each activity was also added. The weight coefficient was determined based on the existing practices and validated by the project manager. Moreover, the same weight coefficient was also applied in the real project for measuring the production progress. Five zones were recognized based on fabrication processes and their geographical locations are shown in Figure 3.
Fabrication started with the cutting and drilling of standard steel plates in Zone 1 and then went to Zone 2 for assembly and welding. As the three selected components were all needed to be painted, hence, after welding, they were transferred to Zone 3 for surface treatment. The next step was returning them back to Zone 4 for pre-assembly. At the end, the finished products would be moved to Zone 5 for temporary store purpose, and ready for delivery if necessary.
5.1.2. Barcoding Technology Implementation
Five different barcodes were developed for this experiment: Drawing barcode (DB), treatment barcode (TB), pre-assembly barcode (PAB), site barcode (SB), and pallet barcode (PB). Figure 4 illustrates the roles of these five kinds of barcodes and the whole fabrication tracking process map. At the early stage, shop drawings were received and uploaded into the proposed tracking system. Physical barcodes were designed and printed based on information extracted from engineering drawings. Links between barcodes and virtual 3D models should be correctly created, including the internal relationships among barcodes. For example, a PB might link to several SBs. Physical barcodes were not attached to real components during cutting, drilling, assembly, and welding. DBs within the shop drawings were utilized to be scanned and updated the progress because: (1) The process of cutting and drilling were always designed for a batch of components not for one; (2) there were lots of small bits and pieces after cutting and drilling, which were very difficult to affix barcodes to; and (3) shop drawings went through these processes from one work team to another.
After welding, TBs were attached to the three components individually and scanned before being shipped to the surface treatment yard. When the components arrived, treatment workers needed to scan the TBs, update the status, and remove the TBs so as to conduct treatment work. After surface treatment, PABs should be affixed to the components. When the PABs were scanned, workers could get detailed pre-assembly information. SBs were affixed after pre-assembly for load out tracking. In this experiment, the two columns and one beam were packaged into one pallet, hence, a PB was needed to put on the pallet. Quality assurance (QA) and quality control (QC) were also embedded into the tracking process and could be automatically triggered through barcode scanning.
All the physical barcodes were attached by the workers involved in each process. Therefore, it was unnecessary to assign a dedicated worker to handle these attaching activities. In addition, the usage of barcodes would not significantly increase workers’ workload because they need to manually mark each steel item by using a chalk in a conventional way.
5.1.3. Location Tracking
There were two methods for location tracking during fabrication as illustrated in Figure 5. The first one was GPS-enabled locating, which relied on the GPS data from the mobile reader. If the GPS was unable to work, the second method could be used. The user could manually choose a predefined location for a component if needed. In this experiment, the first locating method was used during the stages of surface treatment and ready for delivery because both of them were conducted outside. The other processes used the second locating method.
5.1.4. Results for Experiment One
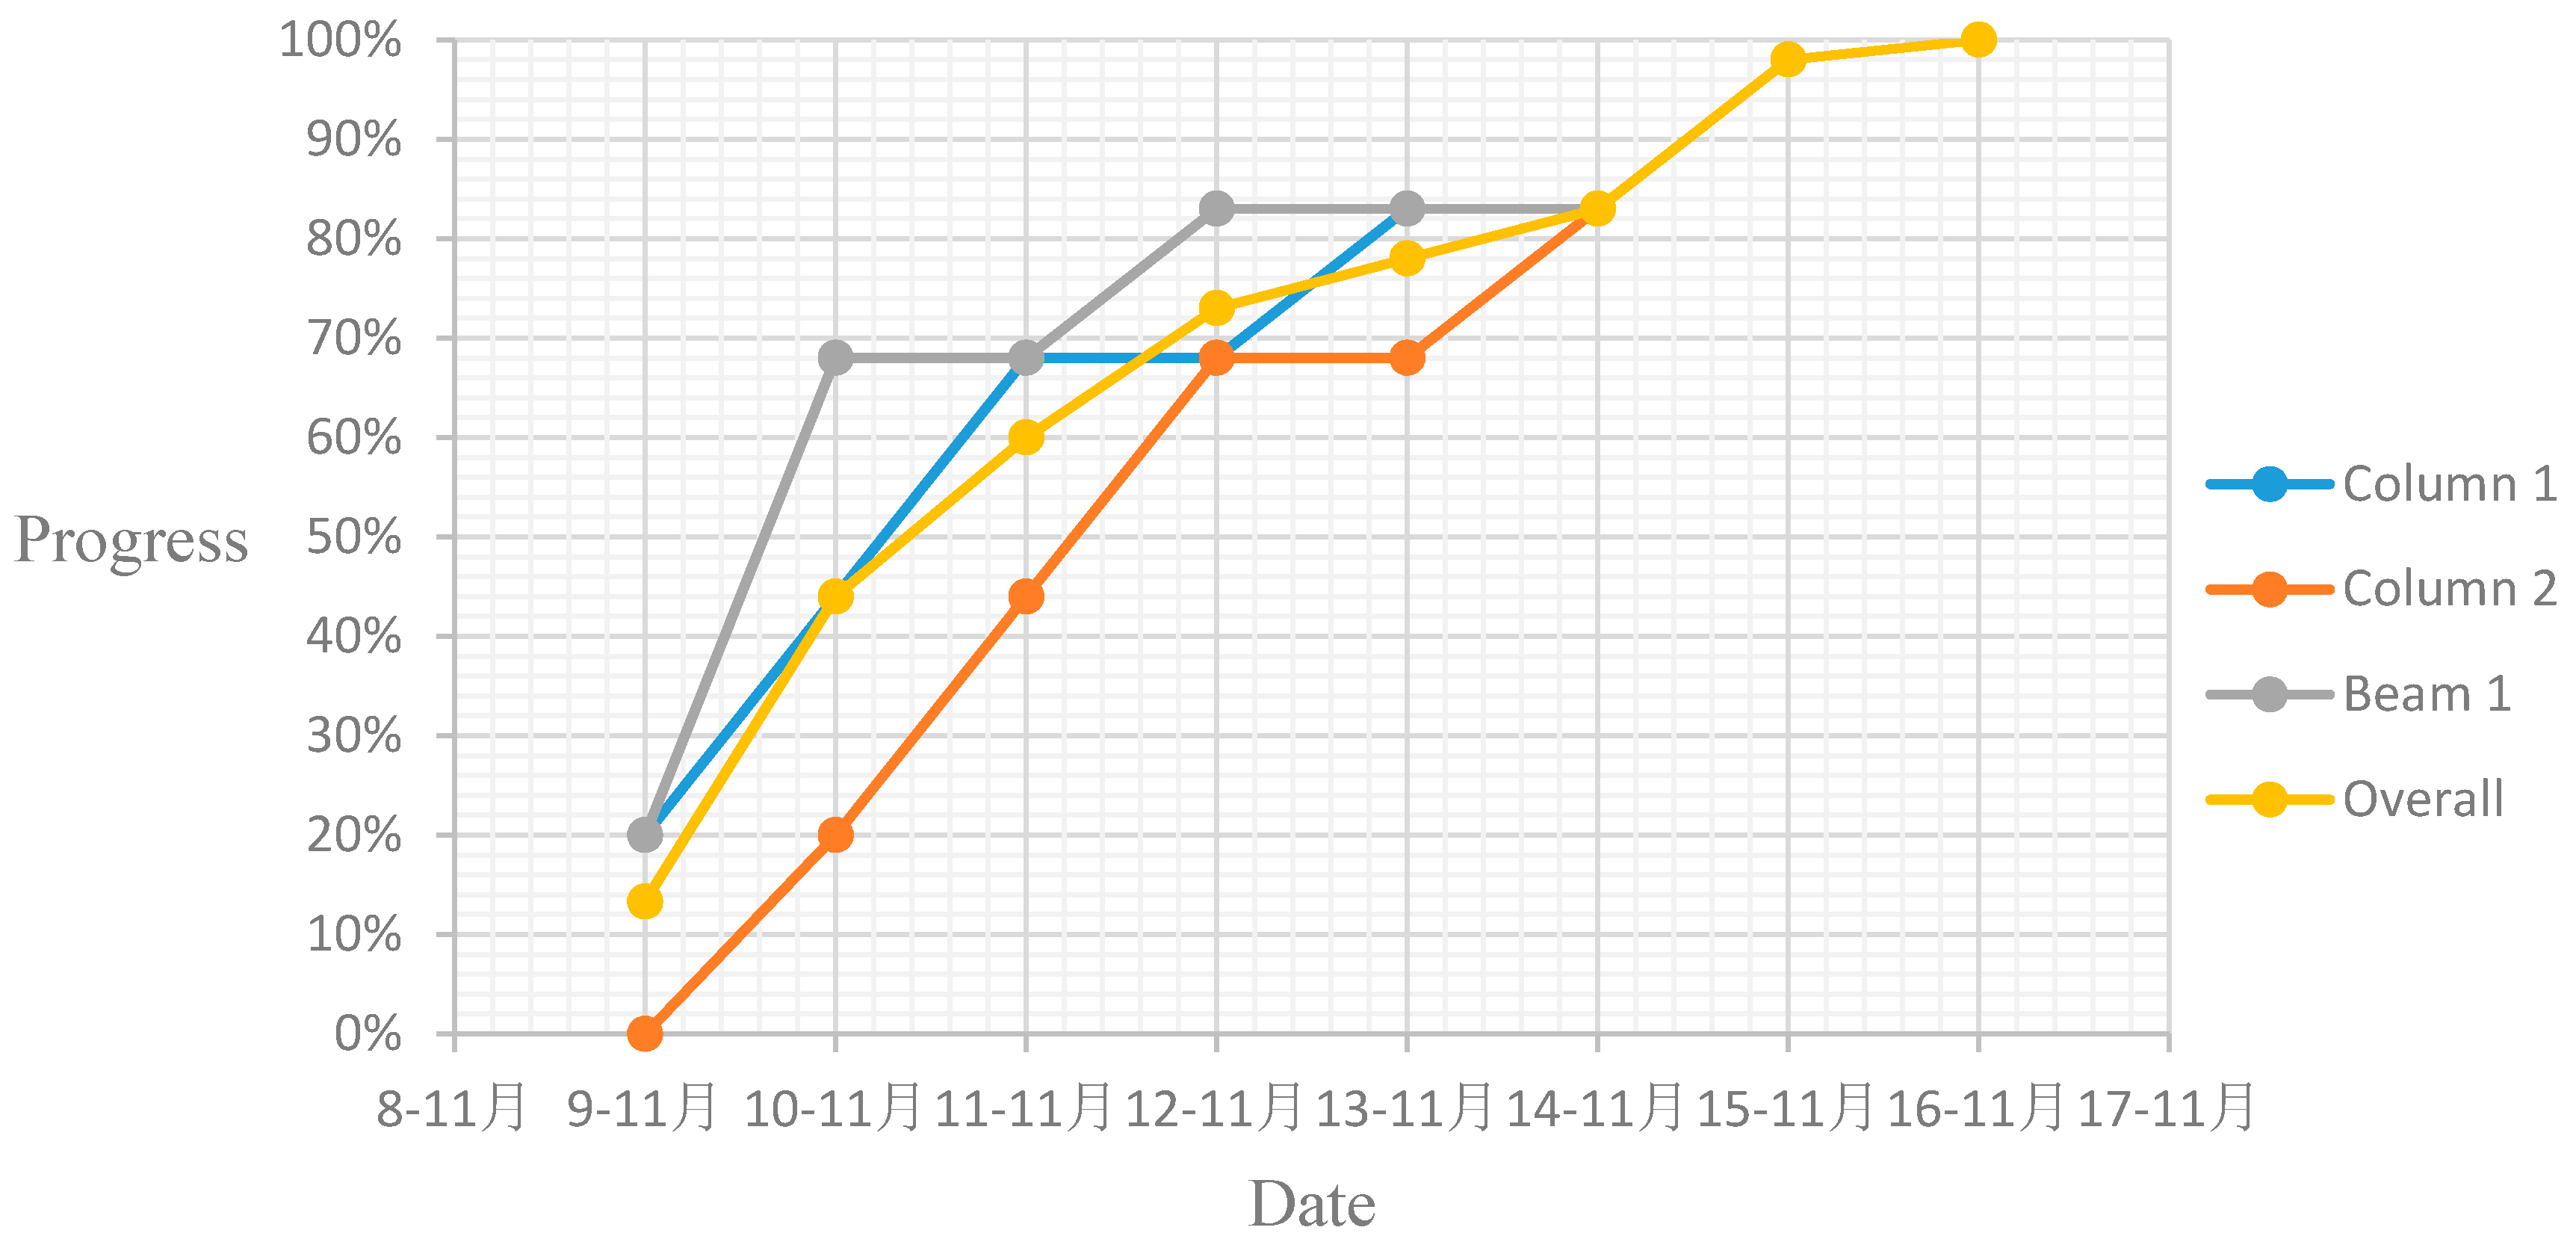
Data collected from barcoding were interpreted. Table 4 shows the locations of the three components at the end of each day during the experiment. Figure 6 illustrates the progress data for each individual component and the overall project. The researchers could locate Column 1 and Beam 1, which were produced faster than Column 2, however, both needed to wait for Column 2 at Zone 4 for the pre-assembly. In this experiment, the researchers did not set a planned schedule for these three components. However, the researchers could assume that if the overall progress was behind schedule, it would be easy for the fabrication manager to find the root cause (the delay of Column 2), and quickly remedy the delay (i.e., assign more resource to Column 2 fabrication).
5.1.5. Discussions for Experiment One Compared with more Conventional Methods (Periodic Reports Driven and Weekly Basis), Three Benefits of the Proposed Barcoding System were Identified and Quantified
- Cost avoidance of lost/missing piece-mark reconciliation: According to the historical data of Fremantle Steel Group, 1% of piece-marks were lost/misplaced during the whole fabrication process. For this pilot project, there were nearly 28,000 pieces, which means 280 pieces of them would have been lost without barcoding. Considering each piece would cost $150 to reconcile/find, a total of $42,000 would be saved. This did not include the emergency fabrication costs of lost pieces, which would cost a minimum of $1000 per piece. If considering the technology adoption cost, such as: Barcode printing cost ($0.01 × 28,000 = $280), mobile readers ($200 × 6 = 1200), software cost ($11.95/month/user × 6 × 6 = $430), and training cost ($100/h × 8 = $800), the total net saving could be $39,290.
- Time and cost savings for checking fabrication progress: A clerk position could be eliminated that previously input progress data from weekly field reports into a planning system (a conventional approach). It could save about $60,000 annually. To quantify the time savings, the research team selected a welding process as an example and calculated the time of generating a progress report, which indicated the number of welds produced per welder by type and X-ray percentage. The time spent compiling this information was reduced from 3 h to an average of 20 min.
- More detailed progress data for decision-making. The frequency of progress tracking with barcoding was nearly in real-time, which enabled the shop manager to identify progress delays and bottlenecks faster. Therefore, with the help of the proposed barcoding system, it was easy to answer questions, like: Which piece-marks need to be pre-assembled together? Where is each individual piece-mark? Which one is behind schedule, and when will that one arrive? They require more time to be solved through reviewing periodic reports.
The experiment has achieved its primary aim of testing the proposed barcoding system for fabrication tracking, and the quantitative and qualitative findings are very promising. Certain limitations need to be considered, which are discussed as follows:
- Barcode scanners need a direct line of sight to the barcode. Scanners can easily find the right barcodes to be scanned before the pre-assembly stage. However, during the stages of pre-assembly and delivering to site, the efficiency of scanning actions declines because scanners need to spend most of the time identifying the target barcode from massive intrusive options. One of the site managers in Fremantle Steel Group suggested that the barcodes could be designed in different colors or sizes so that workers could recognize them quickly and easily;
- barcodes are more easily damaged because they are exposed on the outside of the steel product. If a barcode is ripped or damaged, there is no way to scan and update the statuses of the product. To minimize this complication, the longstanding barcodes, such as SBs and PBs, it is suggested that they are printed with a plastic protective layer; and
- barcode management is a challenging process. Five different types of barcodes were developed for this experiment based on the requirement of fabrication tracking. It was effortless to design and print these barcodes with the help of a computer. However, it was difficult to ensure the actions of attaching and removing barcodes were correct because of human errors. In order to eliminate the error-prone tasks, basic training for site workers is necessary. In addition, a guideline for barcode management is also needed. For example, for each type of steel components (i.e., column, beam and pipe spool), the best positions for barcodes’ attachment should be defined.
5.2. Experiment Two: Site Logistics Tracking
To simulate the delivery of construction materials and related logistics activities, the experiment utilized a real LNG plant training facility as a test bed. The targeted facility was the Australian Centre for Energy and Process Training (ACEPT), run by the Challenger Institute of Technology, located in Perth, Western Australia.
5.2.1. Experiment Design
The simulation scenario can be seen in Figure 7. The materials delivery process started from a remote place, which could be assumed as a warehouse area. The transportation between the warehouse and the facility was monitored by GPS-based tracking. A GPS tag was mounted on a vehicle and communicated with the satellites frequently. Data about the vehicle’s location could be monitored through a web interface, and the progress of the delivery could be recorded. Once the materials had been delivered into the simulated construction site, a customized RFID system, running in both active and passive mode, was established and used to monitor the logistics among the laydown yard and construction (or installation) area. The targeted construction area contains a dehydration module, which is independent of other process units in the field. In addition, the laydown area had laid some spare module components, which could be assumed as delivered construction materials. A simulation of the materials’ delivery was conducted through the use of the above-mentioned systems, and the entire experiment followed the operation protocol of the LNG plant, such as the usage of intrinsically-safe devices, and performing gas leak detection before conducting any experiments.
5.2.2. RFID Technology Implementation
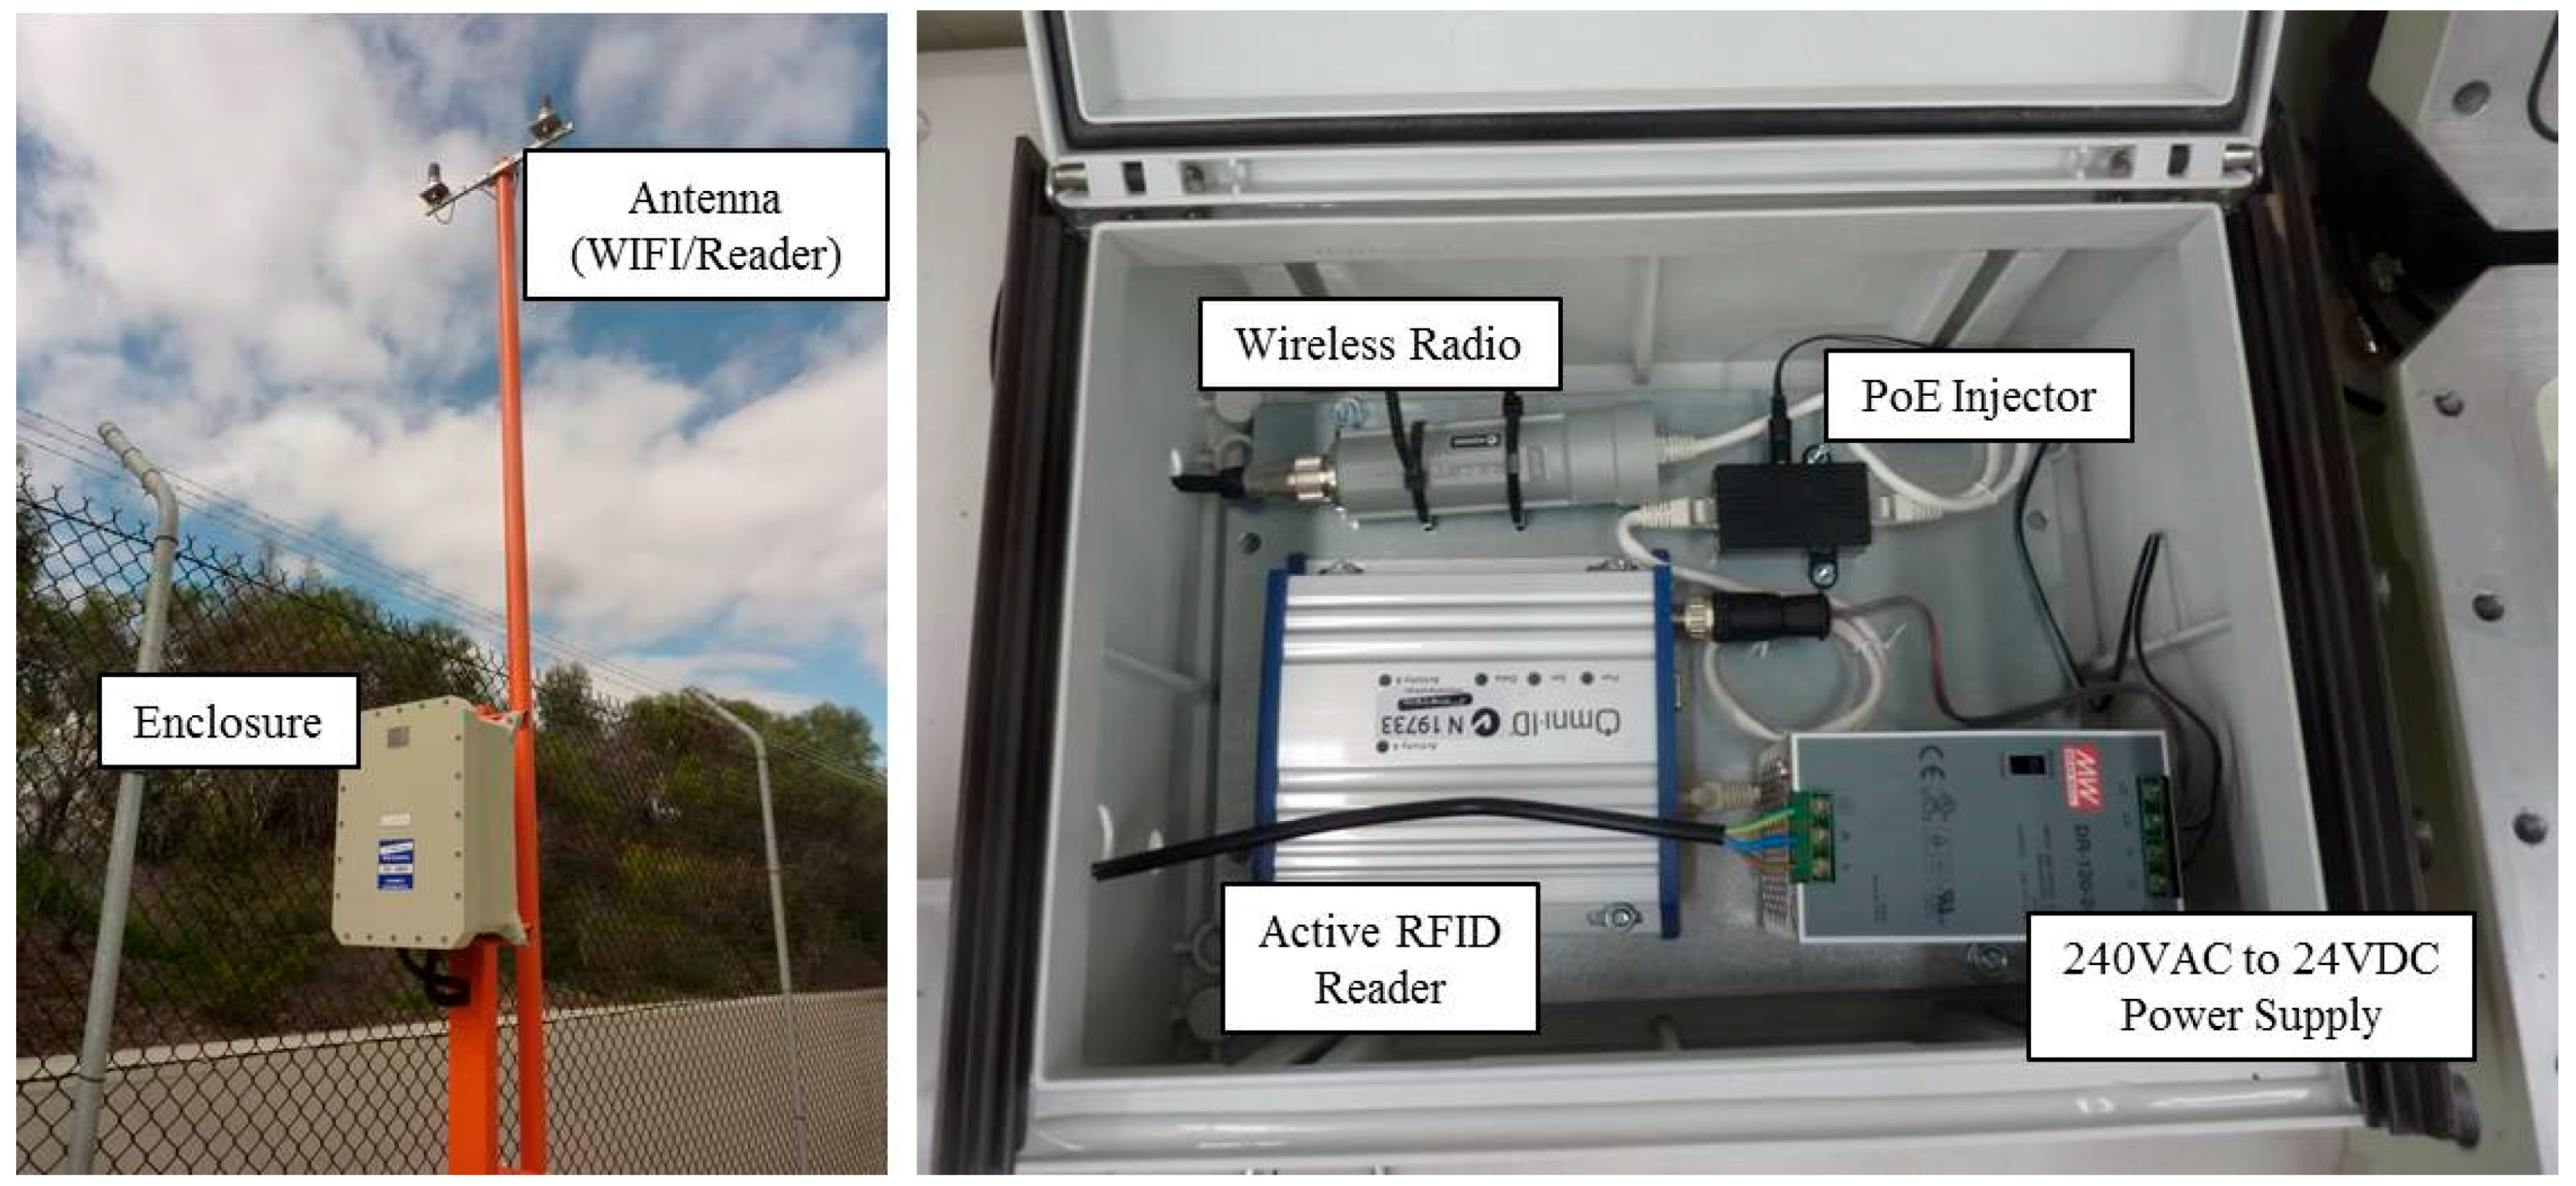
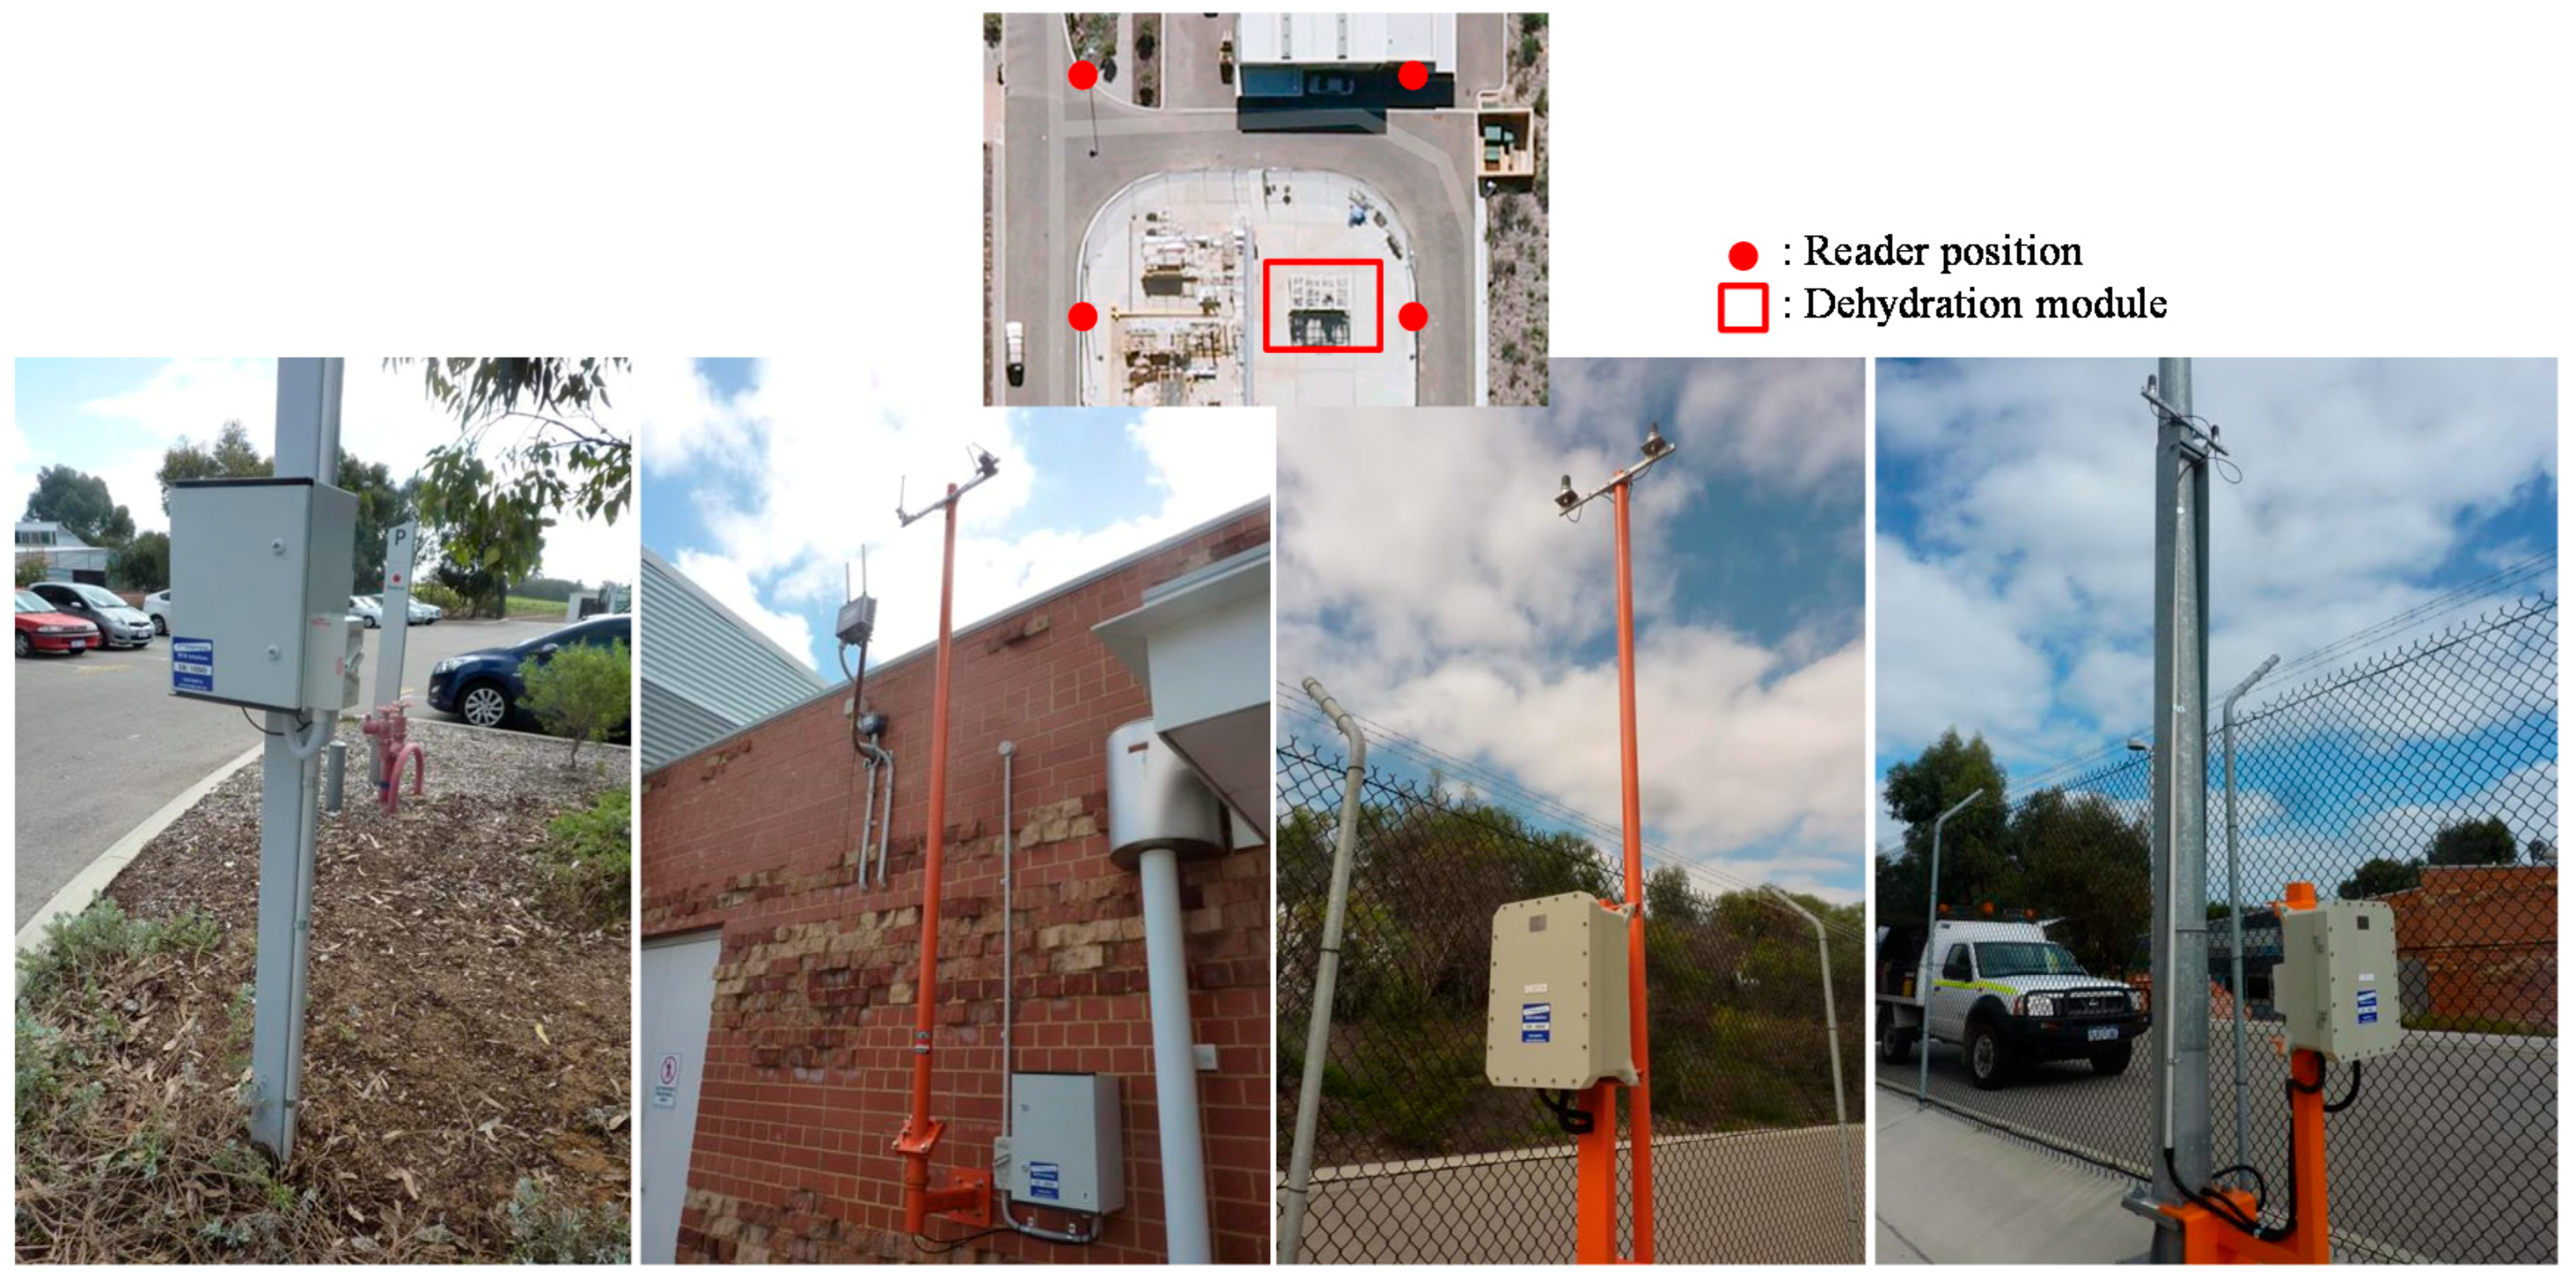
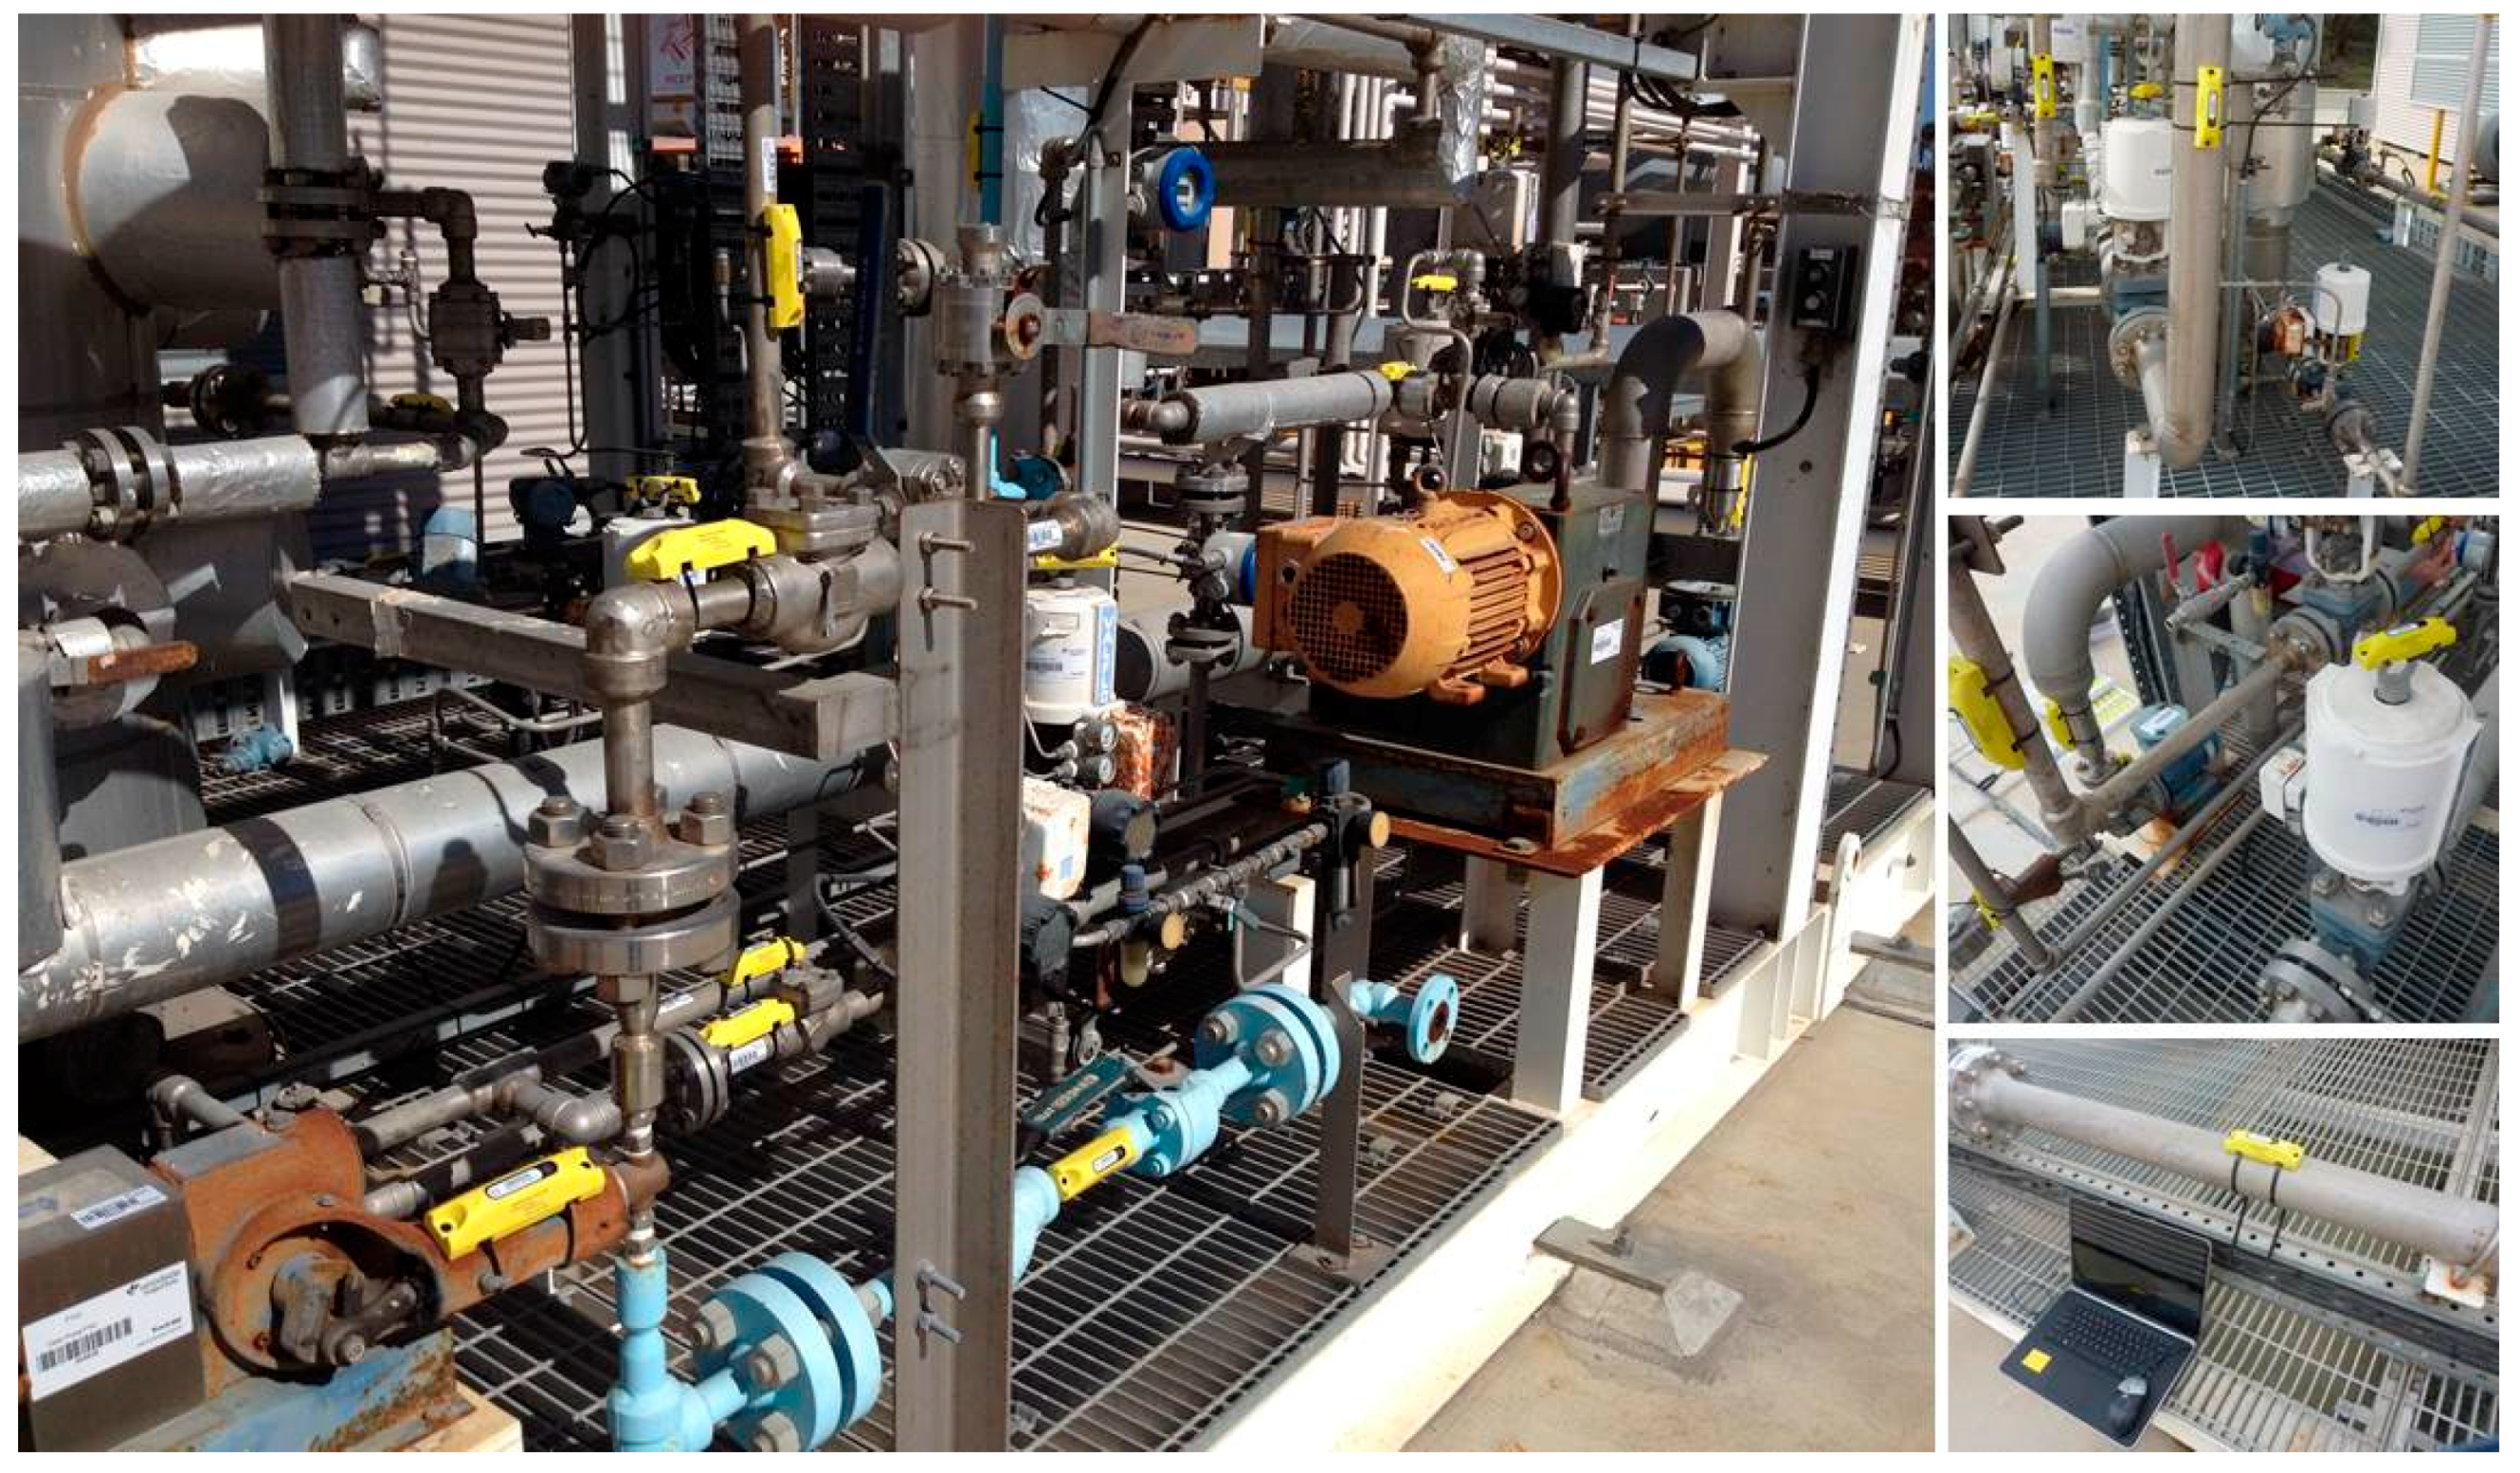
The experiment particularly focused on the use of the active RFID given that the system is rarely used comparing with that of the passive mode and it has the potential in improving the tracking of certain non-line-of-sight activities. The architecture of the active RFID system can be seen in Figure 8, and the reader was put in an explosion proof enclosure for fulfilling the intrinsically-safe requirement of the LNG operation field. The antennas mounted on the top of the four-meter-high pole were responsible for receiving radio signal strength indication (RSSI) from each RFID tag for the reader to capture and upload the processed information to servers through WIFI. As for the content of the enclosure, there was a power supply, a reader, and a wireless radio. The wireless radio was used as a transmitter for converting the processed information in order to upload through the Internet. Like such settings, there were four different sets, which were distributed around the facility. As shown in Figure 9, they were located at four corners of the simulated construction area and formed a rectangle (around 30 m by 15 m) covering the dehydration module. By synchronizing all four received RSSI at an acceptable short time period, the locations of tags could be thus identified through triangulation calculations.
As shown in Figure 10, the dehydration module consisted of vessels, pumps, pipes, electronic lines, and other related components and was located in the simulated construction area. Multiple RFID tags were attached to the selected components of the module. The tag could be read through handheld scanners or the four fixed readers, which means that the detection methods could be either active or passive. The received information could be updated on the materials’ management system through the Internet. The dehydration module and its surrounding regions, including the laydown area, were used as experiment fields in the simulated construction site. They were used to test the performance of active RFID in static and dynamic situations as well as to conduct a material search test comparing different combinations of tracking approaches. These tests are described in the following sections in detail.
5.2.3. Location Tracking
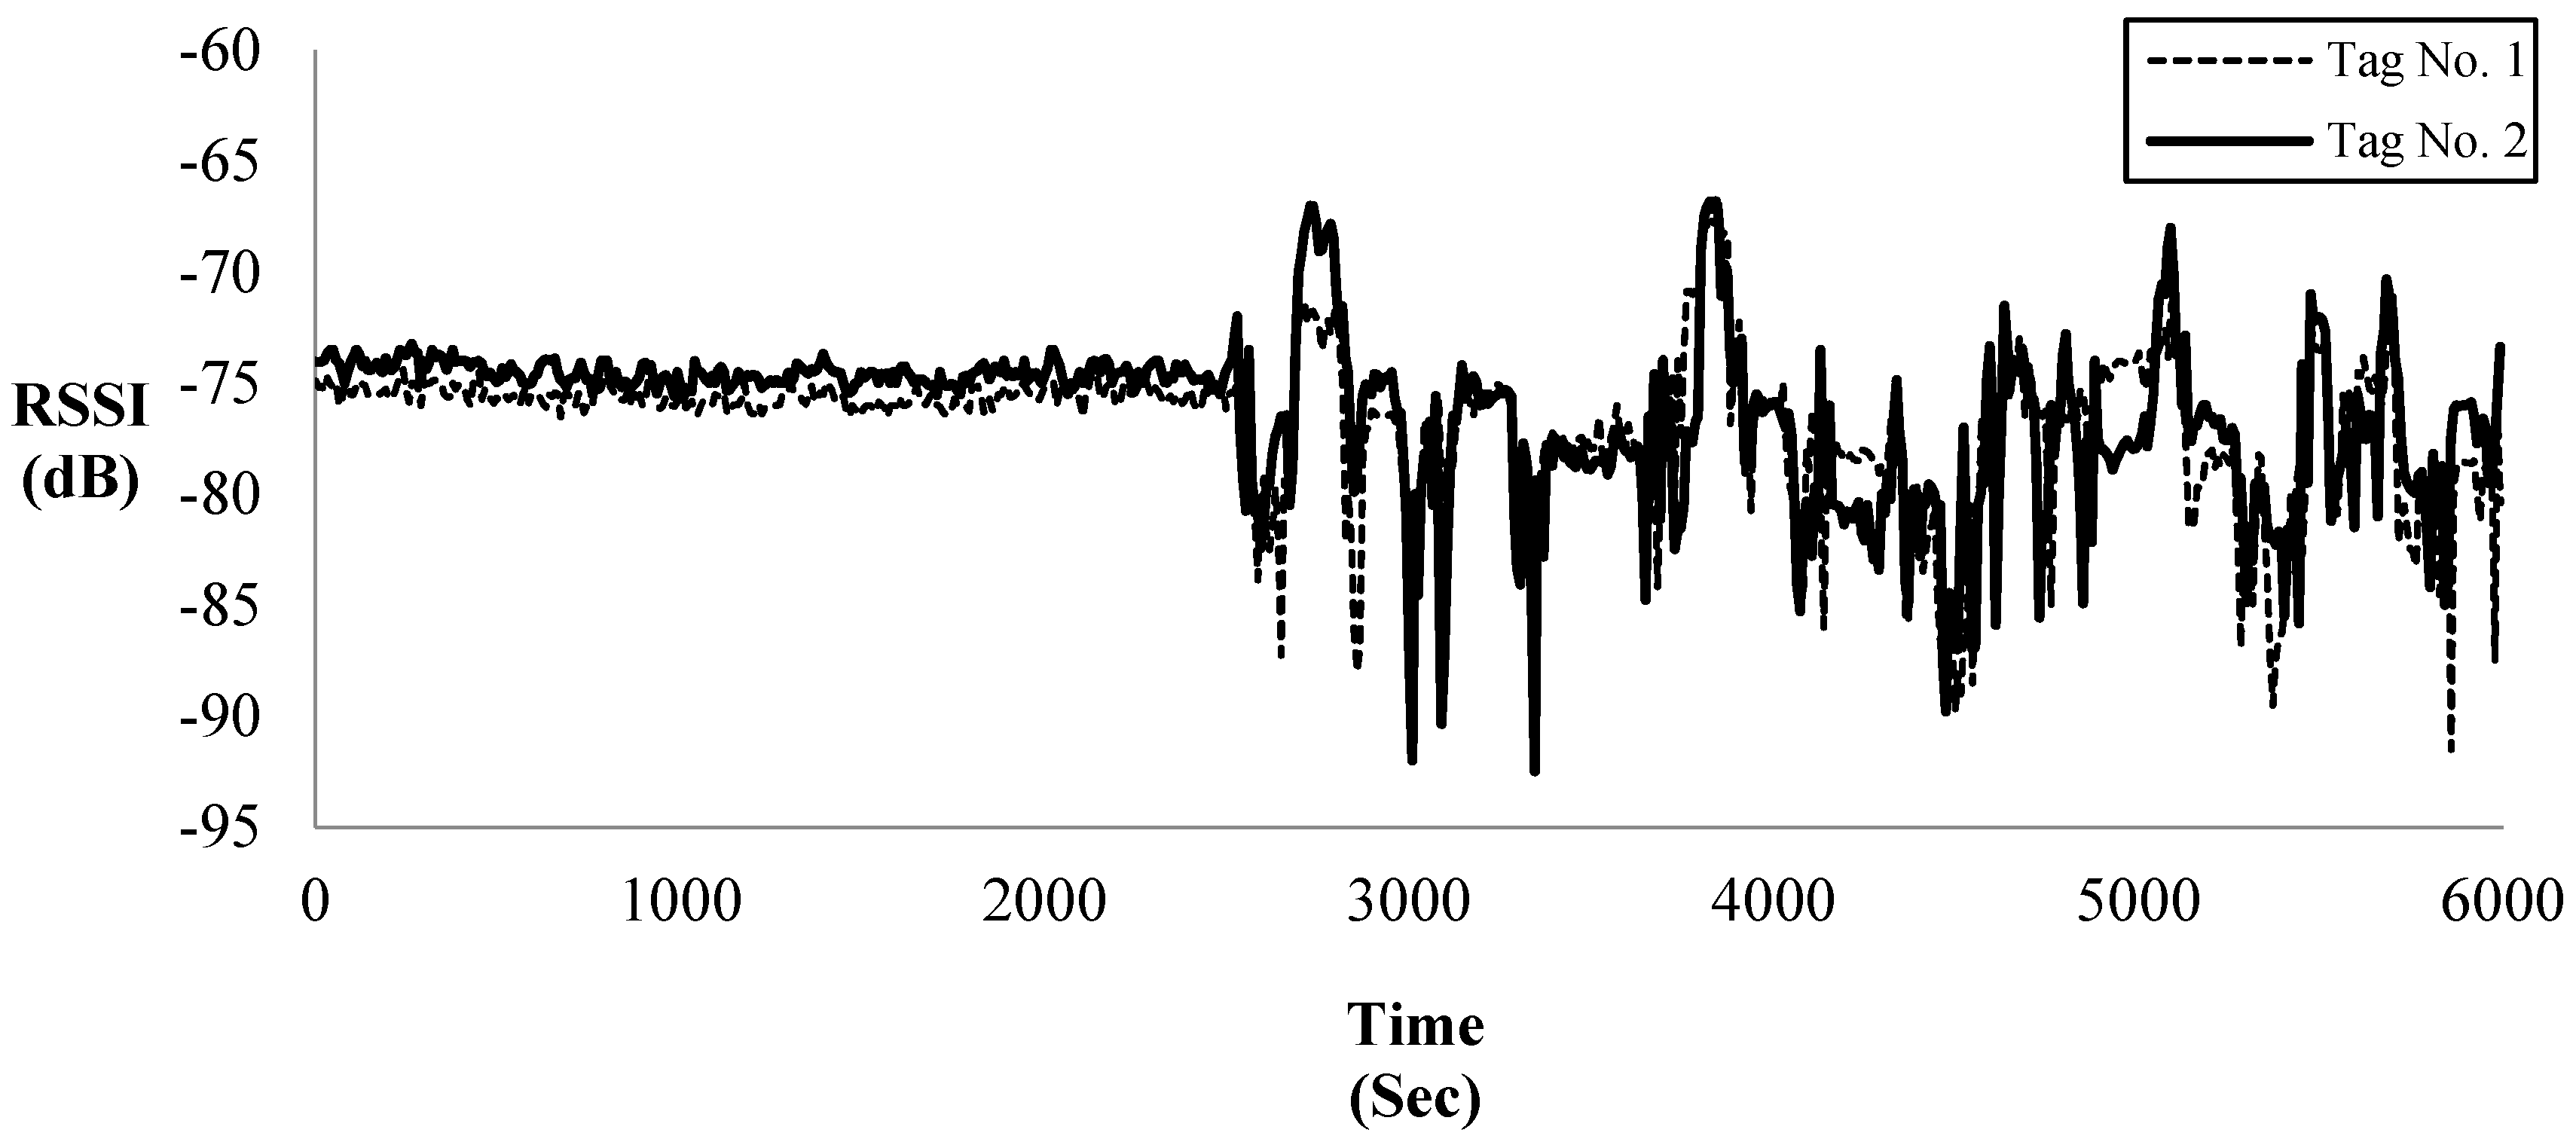
Considering the accuracy concerns of the active RFID system, a performance analysis of the RFID tags localization was carried out. As for knowing the status of each attached component, in general, for site managers and help field workers to search specific ones, accurate location information will be essentially important to shorten the data collection and search time. It could even be extended to monitor the movements of construction equipment or personnel for safety purposes. Given that the magnitude of RSSI is related to the distance between the reader and the tag according to the literature, the researchers first validated the relationship of RSSI between each RFID tag in the simulated LNG plant construction environment. Two randomly selected RFID tags were put at the same position on a trolley located within the detection range of the four fixed readers. Figure 11 illustrates the RSSI distributions of the two tags. The trolley was still at the beginning. After around 2500 s, the trolley started to be pushed and moved around the dehydration module. The results showed that the RSSI distributions of the dynamic cases fluctuated more than that of the static cases. However, both tags at the same place responded with different RSSI values, but the patterns of changes were similar with each other. It suggested that there was a relationship between RSSI responses and the distances of RFID tags, which could be utilized to further improve measurements as long as it could be formed. Once the tags with known locations were obtained as reference tags, the measured location of the target tag could be calibrated by the RSSI responses from those tags through the determined relationship. Further studies on the potential affections of radio signal interference and positioning improvement in such s testing scenario can be referenced to researchers’ further works [24,52].
5.2.4. Results for Experiment Two
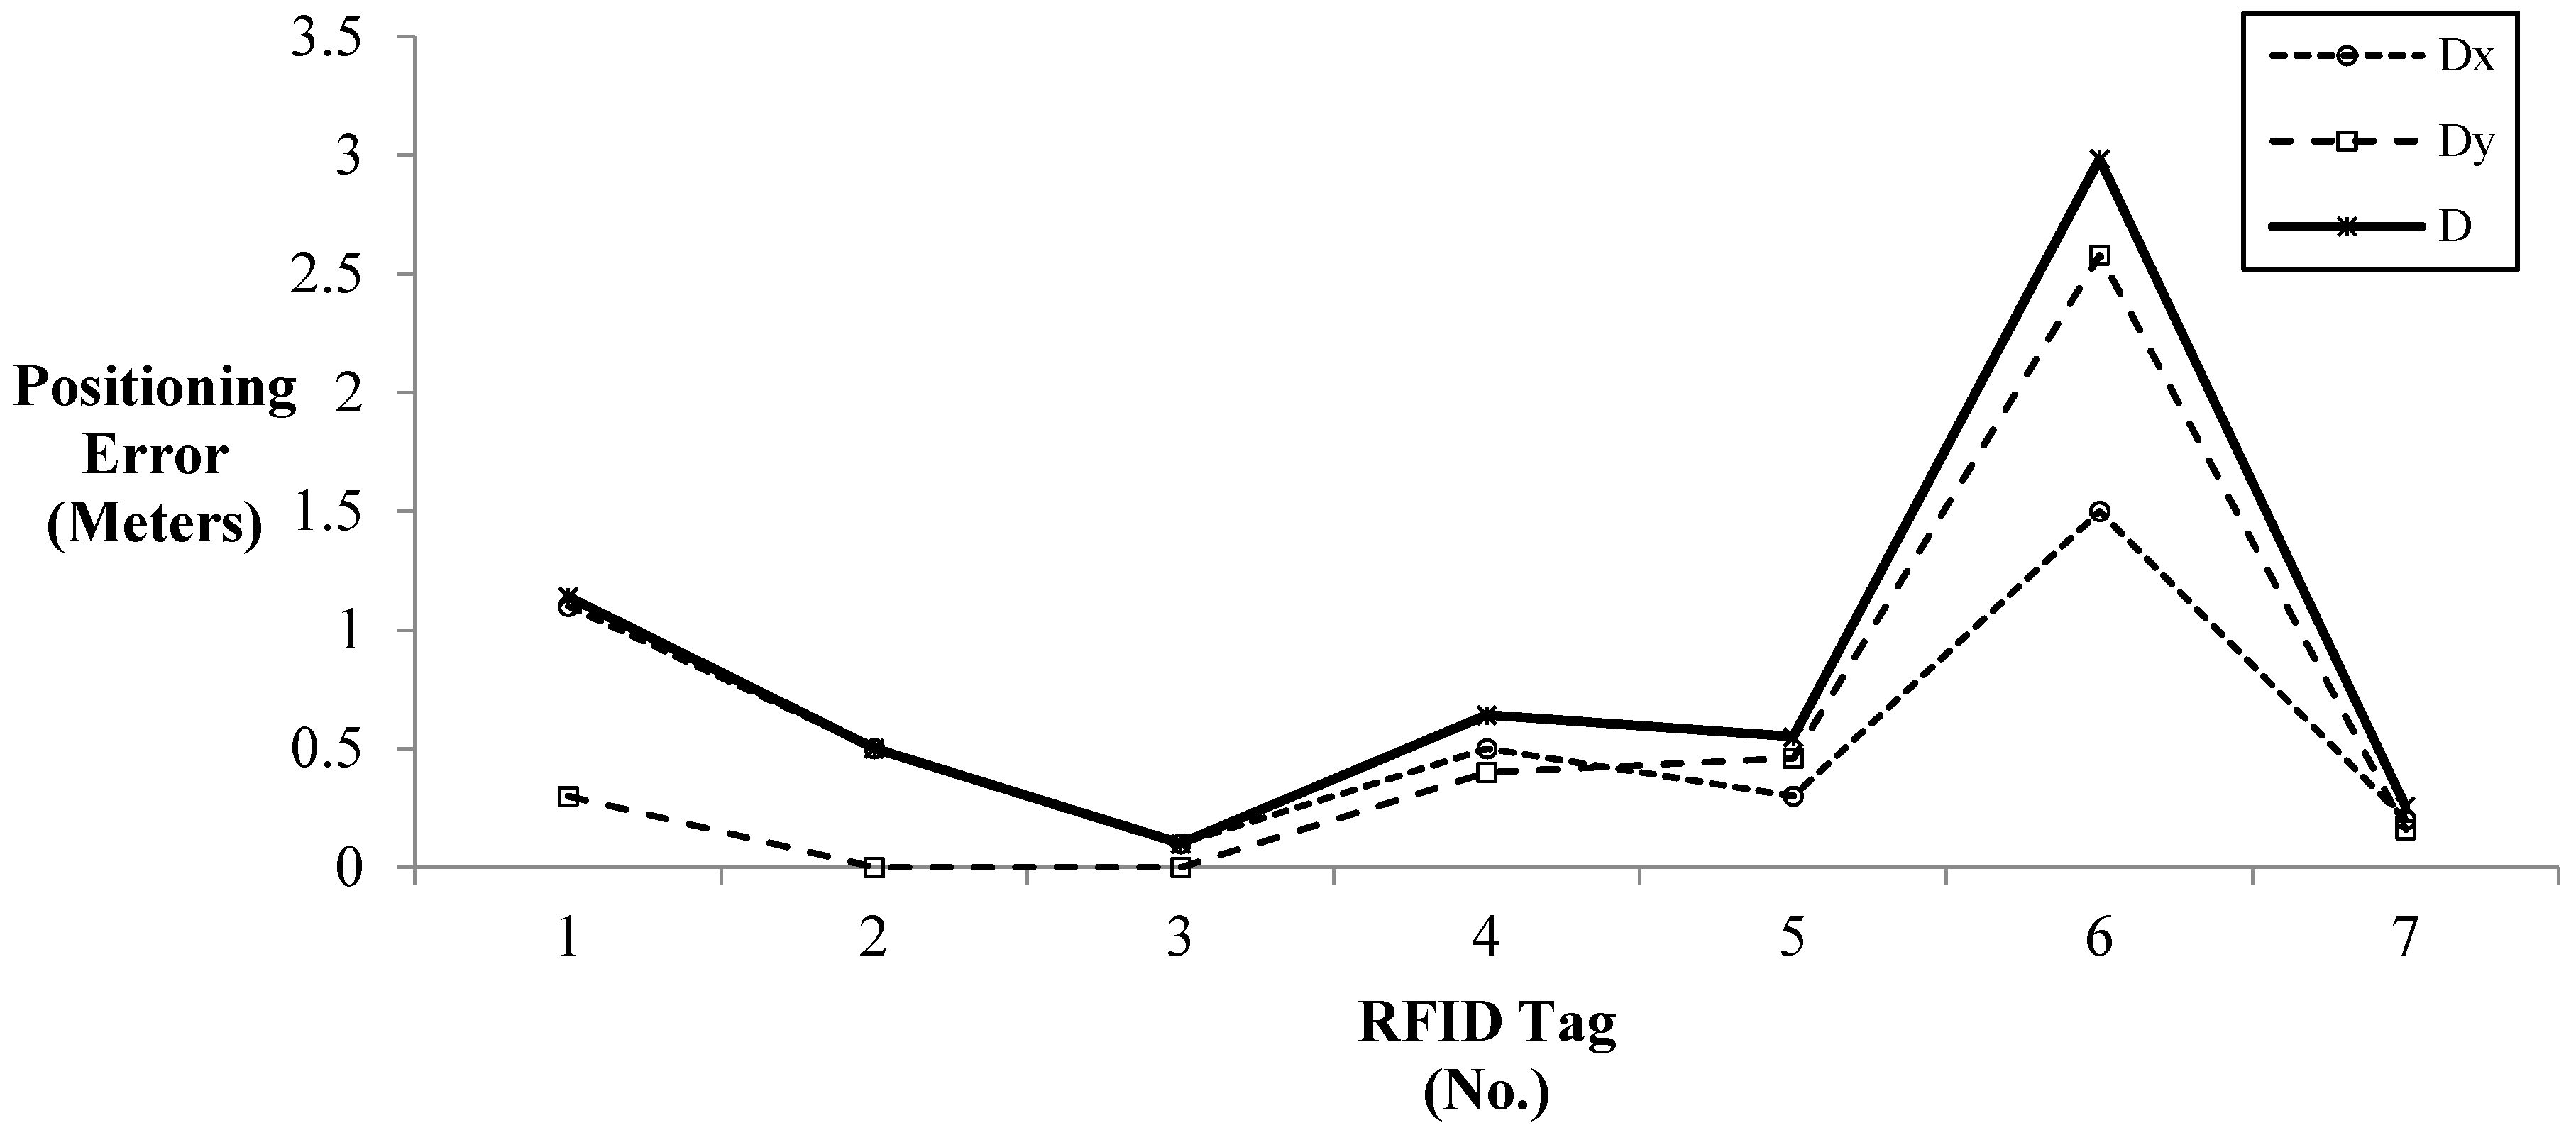
A summarized table for all the tests done for site logistic tracking is provided as Table 5. The researchers collected the RSSI data of each RFID tag on the module. The sampling rate was 3 s–8 s per RSSI record. The data leased 40 min and 16 tags with known locations were treated as reference tags for calibration. Similar calibration research has been conducted by Razavi and Haas (2011). Compared to the true positions identified through survey technologies, the positioning errors of static RFID tags through RSSI data with reference tags’ calibration are illustrated in Figure 12. Among these seven tags attached to the module, the errors could be controlled within 3 m, which suggested that the active RFID system is capable of tracking non-line-of-sight activities, such as knowing where the multiple construction resources are in a relativity large-scale LNG plant construction site. In addition, site managers can easily discover the objects of interest and request field workers to locate it in a short duration. This is because the search range was narrowed down to a 3-m radius circle. In cooperation with scanners through the passive RFID technologies, field workers were easily able to identify the necessary targets instead of following rough directions to search and potentially wasting time. It also helped conduct deviation analysis at a short duration so that the delay of logistic can be found at the early stage for further decision making.
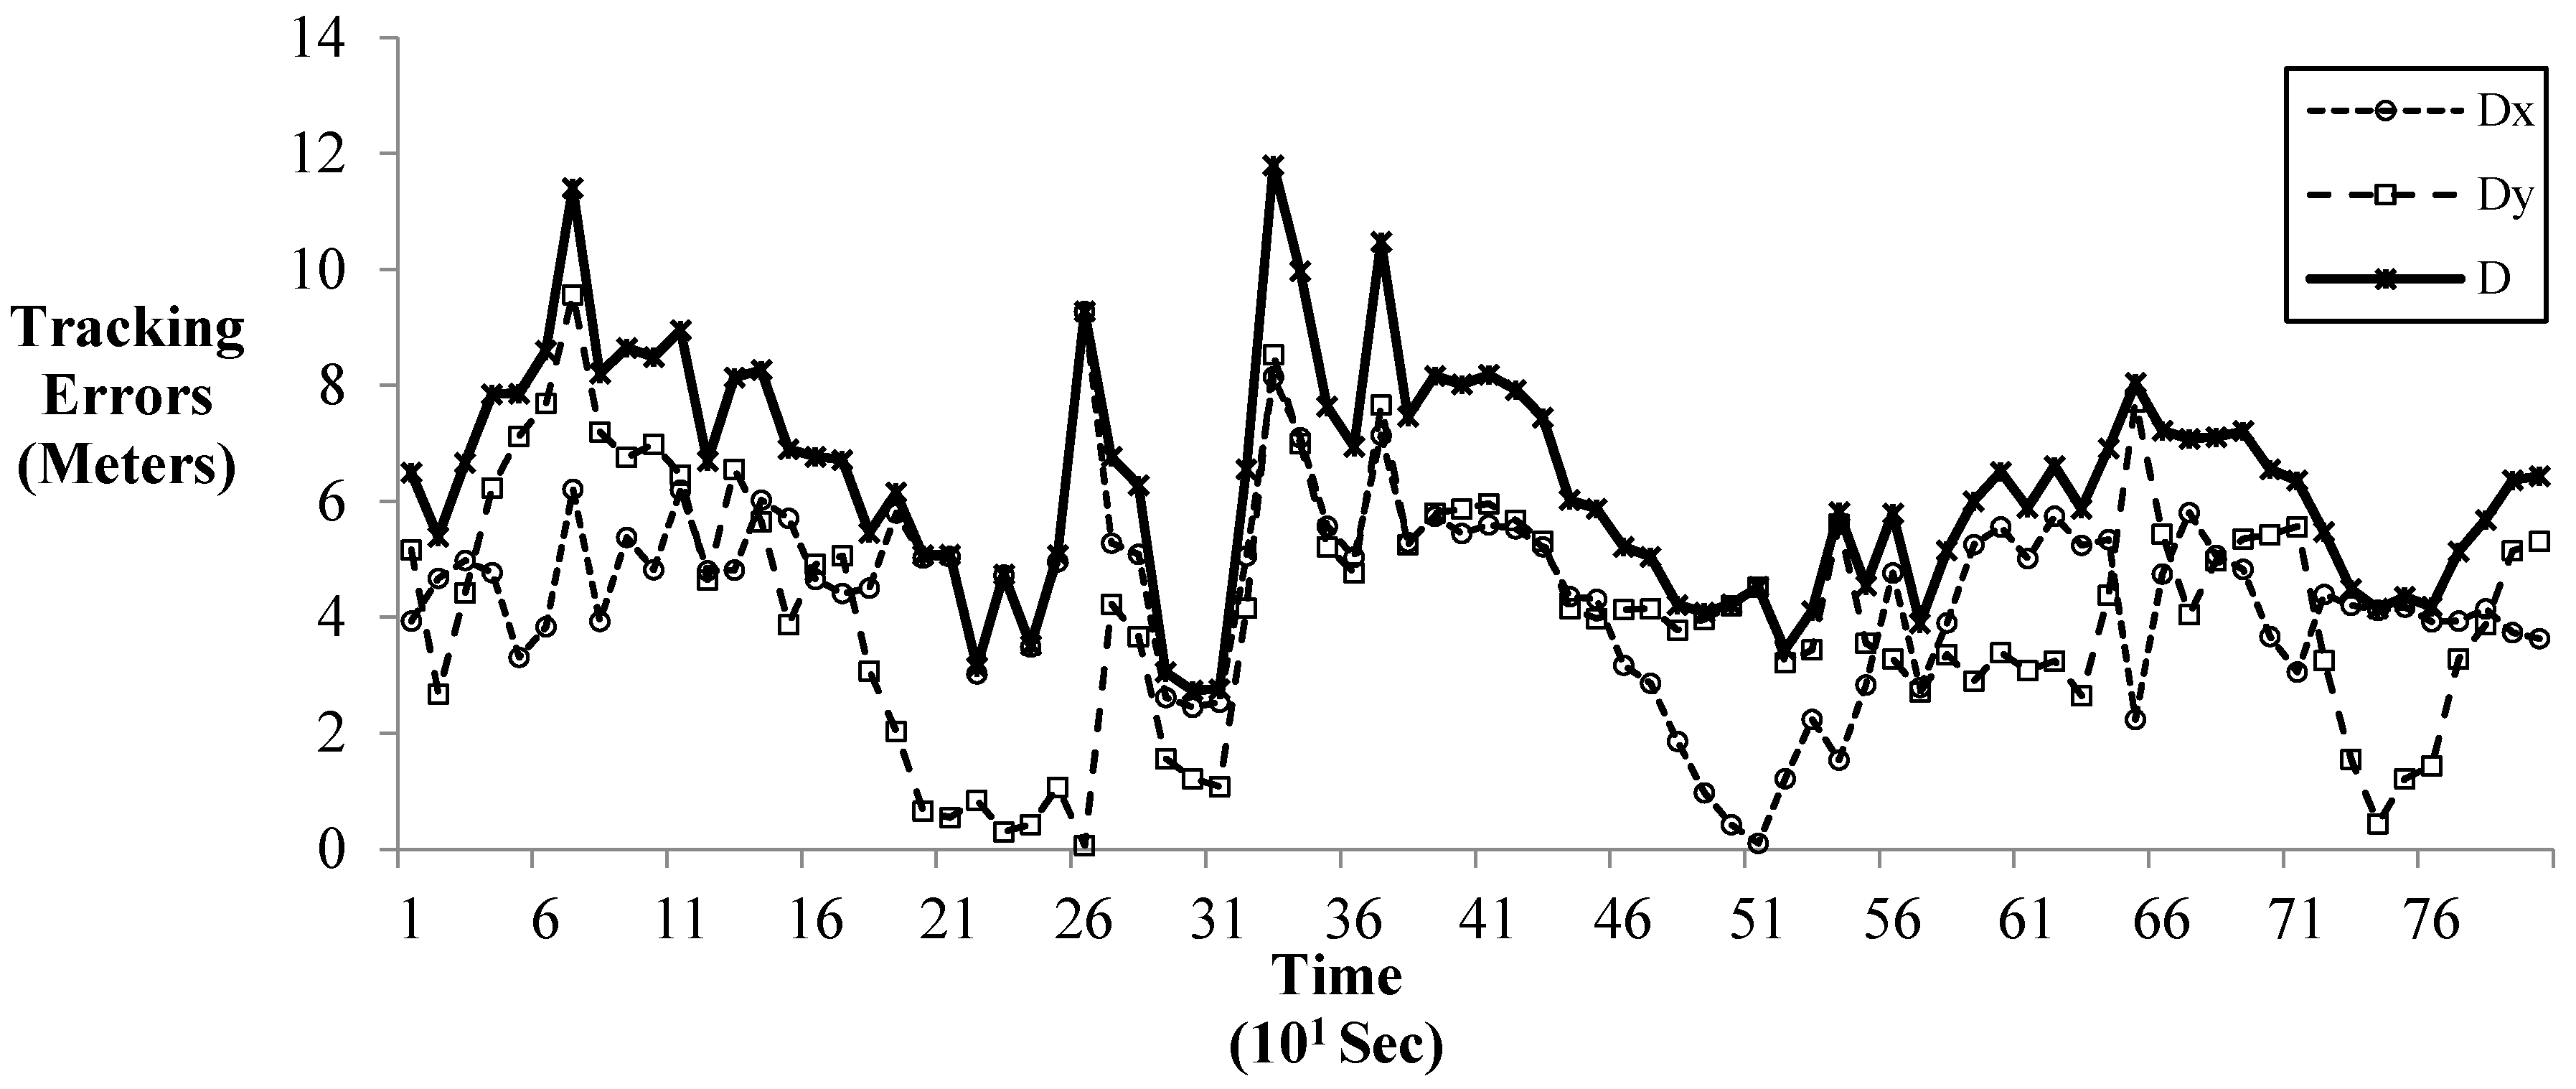
Regarding the monitoring of dynamic objects on the site, the targeted RFID tag was put on the trolley and moved around the dehydration module. The sampling rate of RSSI was the same as the static case and the total record time was around 13 min. Figure 13 shows the tracking errors with time. The range of average errors distribution was from 2 m to 12 m and the change pattern of the error was unpredictable. It showed that the RSSI of a moving RFID tag was seriously affected by the surrounding environmental factors with the time and the location, such as metal, liquid, and other electromagnetic interferences. The results indicated that the active RFID system required improvement to be able to be utilized for certain tracking tasks, such as equipment movement monitoring or personnel tracking for safety purposes. However, depending on accuracy requirements, it was still applicable for non-line-of-sight tracking activities, which only require rough positions of the target resource, such as work permit monitoring, and materials tracking at a large-scale LNG construction site. It is also worthy to note that improving the localization performance of dynamic materials could be a future research direction for optimizing the accuracy of the active RFID with reasonable cost and time.
Compared with conventional approaches in searching necessary materials on site, an RFID system with both active and passive modes was proven to be feasible, more efficient, and effective. The researchers obtained the preliminary outcomes based on the search time distribution of specific material during the material delivery simulation. In this evaluation, participants were assigned different tasks in allocating specific items in a simulated 6 m by 36 m laydown area with more than 50 plant components (valves, pipes, and gauges) laid on. The conventional approaches that were compared in this evaluation were those using passive RFID with paper-based instructions and those using only paper-based instructions. The paper-based instructions represented the rough position estimations made by site managers according to the existing drawings or layout plans. They were estimated without prior actions in “manually” recording accurate laydown positions when the materials arrived in the area. Based on the feedbacks from field crews and managers, the accuracy of instructions significantly relied on how much experience the site managers had regarding the arrangement of the laydown area.
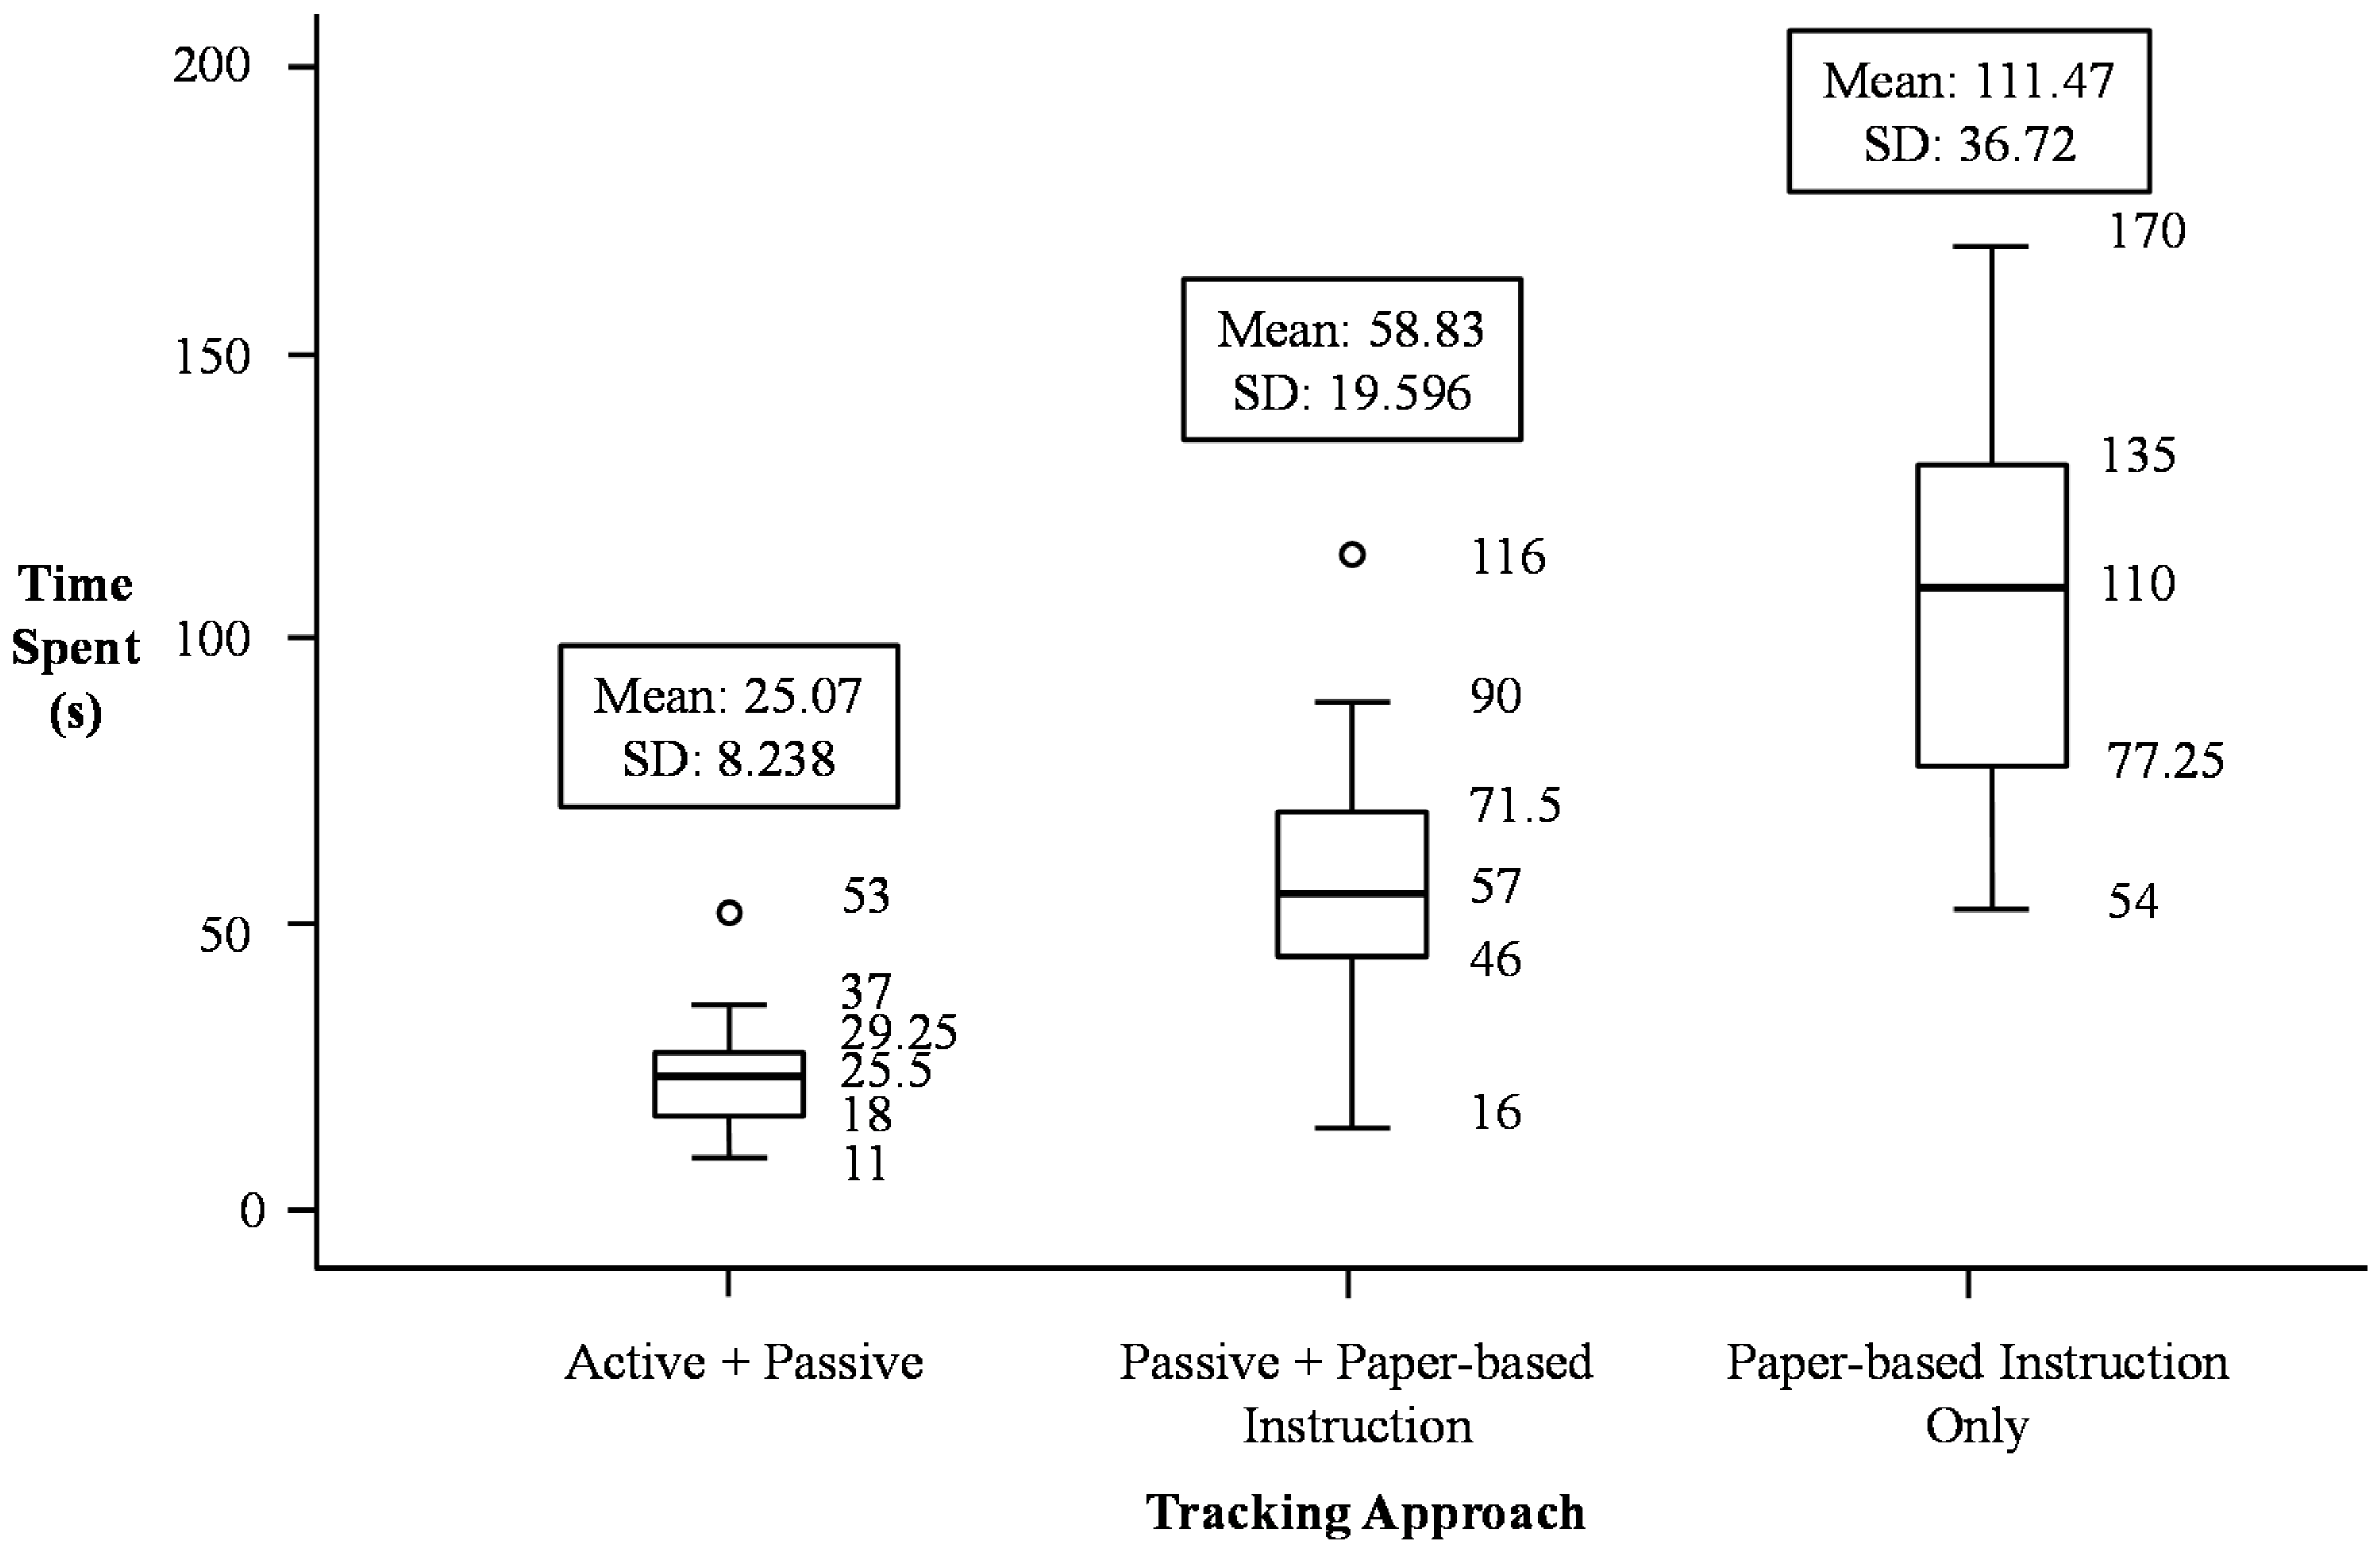
30 items were identified within the material laydown yard and used as the targets for participants to search using the three approaches, respectively. Detailed experiment data was collected and analyzed. Figure 14 shows that the average time spent on searching materials using both the active and passive modes of RFID in the simulated lay down area (mean: 25.07 s, standard deviation: 8.238 s) was generally faster than those of using passive RFID with paper-based instructions (mean: 58.83 s, standard deviation: 19.596 s), and those of using only instructions (mean: 111.47 s, standard deviation: 36.72 s). The average time savings were 33.76 s and 86.4 s, respectively. It is due to the accurate information that the active RFID can provide for non-light-of-sight tracking activities, like material storage decisions and monitoring, which narrowed the search area down to 3 m instead of rough search instructions. Using only passive RFID or paper-based instructions may achieve the same efficiency, but requires extra human and arrangement effort in recording the statuses of materials when materials arrive in positions, while active RFID can acquire such information generally and automatically. It further reduces the preparation time of search tasks and helps improve management from the global perspectives.
5.2.5. Discussions for Experiment Two
By identifying the accuracy concerns of the active RFID system and going through the materials delivery simulation by using the proposed tracking approach at the simulated LNG construction site, the following discoveries compared with the conventional approaches (paper-based instruction or the used of single tracking technology) were raised and discussed as below:
- The GPS and passive RFID system are conventional yet reliable approaches for tracking long-range transportation and assisting field personnel in searching and identifying objects of interest during the entire site logistics processes. The experiment showed promising results in tracing the goods flow and speeding up the materials search times. However, the performance of the tracking varied depending on different human involvement and familiarity of the technologies adopted;
- The active RFID system can be implemented as an efficient tracking approach for certain non-line-of-sight activities at the site, such as having a global view of whether the demanded certain resources or personnel are in position at the correct place and correct time. Considering the scale of the LNG plant construction, the error tolerance in acquiring such positioning information is acceptable for the discontinuous positions’ checking and management purposes. The positioning accuracy can even be improved by the reference tag approach and controlled within 3 m. However, for the detailed movements’ monitoring of resources and helping search for the demanded resource at the site, the tracking approaches still need further investigations, as long as the further efforts in improving tracking results of the dynamic objects can be engaged to control the localization errors within reasonable ranges. Further studies regarding accuracy improvement of the active RFID system in the simulated LNG construction site can be referenced in [52];
- these results conducted in the material search test may present a certain degree of bias attributable to a number of reasons. Firstly, the scale of the laydown area in practice is much higher than the tested one, which could amplify the uncertainties of searching target items. Secondly, there are biases among participants’ skills in searching materials. Although participants were randomly selected, there is a chance of uneven prior knowledge or learning ability. Finally, the accuracy of the paper-based instructions, as the conventional approach, has also a significant impact on the material search. Poor-quality instructions will result in a longer time. In general, the authors argue that some biases may be presented, however, the results still can validate the benefits of the proposed approach in the comparison with the conventional one. The generality of the tests exists given that the simulated site is exactly “a real process plant” following all the operation and intrinsically-safe regulations for training purposes. The arrangements and layouts of all components follow the designs in practice, however, they would be more complex when the plant construction is in processing with more dynamic interference taking place; and
- the integration of the proposed tracking approaches is feasible to establish a total site logistics management mechanism of a technical perspective. However, supply-chain experts also raised concerns as to whether there are further demands in identifying the adoptions impacts, working processes’ changes, human error influences, or cost-effective integrations. Essentially, the cultural changes and standardization in the LNG industry need further engagement as well to provide an appropriate opportunity for its adoption.
6. Conclusions
The main contribution of this paper is to provide a coordinated approach for total supply-chain tracking in LNG construction. The feasibility of the proposed approach for the project-specific material management was validated by the two field experiments: (1) Real steel column and beam components tracking in a fabrication facility, and (2) material tracking and searching events in a complete LNG plant replica for training purposes. Although not all alternative tracking solutions within the framework were tested, this research has indeed validated the usage of barcode for fabrication tracking. Besides, the capabilities of GPS and active RFID were also tested and validated in tracking non-line-of-sight tracking tasks at a simulated LNG plant construction site. Both GPS and active RFID can cooperate with passive RFID, and allow site managers to get a global view of the materials’ flow and identify relatively close search ranges for field workers to find out the materials of interest efficiently.
To sum up the outcomes of this study, the benefits and implications identified from the two field experiments are listed as follows:
- The proposed coordinated approach has been validated as a feasible solution and suggestion for decision makers in tracking various tasks in LNG modular construction. It further helps to increase the visibility of the total supply chain for complicated and large-scale projects, allowing transparency to be gained for government and community supervisions as well;
- the two field experiments demonstrated the feasibility of the combination of the barcode, RFID, and GPS for total supply chain tracking in the LNG industry. Despite the increase of the cost to purchase and install the tracking infrastructure, it is relativity insensitive in affecting overall cost, but saving more wastes according to the feedback from industrial partners;
- the experiment conducted in the off-site factory suggests several tangible benefits: $42,000 would be saved for lost/missing piece-mark reconciliation in the pilot project; $60,000 would be saved annually due to the reduction of a clerk position; and time spent in welding progress tracking could be reduced from 3 h to an average of 20 min. Further benefits are expected for a wide range of adoptions in different off-site factory scenarios; and
- based on the observations of the site logistic experiment, the search range of material has been narrowed down through active RFID used in cooperation with scanners through to passive RFID. Compared with conventional approaches in material searching, the proposed tracking solution was two times faster than those using passive RFID with paper-based instructions, and four times faster than those using instructions only. The benefit can be amplified with the increasing scale of the material searching area in practical LNG projects.
Although the observed improvement is clear, further validations should be conducted which include: (1) Validating the feasibility of the proposed framework for the general material management in the LNG industry; (2) evaluating the capabilities of other suggested tracking solutions, such as utilization of passive RFID with a handheld reader for fabrication tracking. Compared with barcode technology, passive RFID has all the advantages except its higher implementation cost. The first two limitations of barcodes found in this paper can be easily addressed by using passive RFID; (3) applying the proposed framework in a real LNG construction project and measuring its performance; and (4) extending the application of the proposed framework to other industries, such as mining, infrastructure, and building.
Author Contributions
J.W.: conceptualization, methodology, formal analysis, software, validation, writing-original draft. H.-L.C.: conceptualization, formal analysis, project administration, validation, writing-original draft. W.S.: methodology, data curation, formal analysis, writing-original draft. H.-Y.C.: resources, writing-review&editing. X.W.: supervision, funding acquisition, resource.
Funding
This research was funded by Australian Research Council, grant number DP170104612.
Acknowledgments
The researchers would like to acknowledge companies of Track’em, Geoforce, RAMP, VSA and Omni-ID for their contribution in providing tracking expertise and software, and Fremantle Steel Group and Challenger Institute of Technology for their contribution in providing test beds, experts, and related assistances for the two experiment.
Conflicts of Interest
The authors declare no conflict of interest.
References
- KPMG. Unlocking the Supply Chain for LNG Project Success; KPMG Global Energy Institute: Basel, Switzerland, 2015. [Google Scholar]
- Australia Pacific LNG. Environmental and Social Management Plans; Australia Pacific LNG Ltd.: Queensland, Australia, 2018; Available online: www.aplng.com.au/content/origin-aplng/en/index/about-us/compliance/environmental-and-social-management-plans.html (accessed on 8 September 2018).
- Schmidt, M.; Thoroe, L.; Schumann, M. RFID and barcode in manufacturing logistics: Interface concept for concurrent operation. Inf. Syst. Manag. 2013, 30, 100–115. [Google Scholar] [CrossRef]
- Igarashi, M.; de Boer, L.; Fet, A.M. What is required for greener supplier selection? A literature review and conceptual model development. J. Purch. Supply Manag. 2013, 19, 247–263. [Google Scholar] [CrossRef]
- Brandenburg, M.; Govindan, K.; Sarkis, J.; Seuring, S. Quantitative models for sustainable supply chain management: Developments and directions. Eur. J. Oper. Res. 2014, 233, 299–312. [Google Scholar] [CrossRef]
- Taticchi, P.; Tonelli, F.; Pasqualino, R. Performance measurement of sustainable supply chains: A literature review and a research agenda. Int. J. Product. Perform. Manag. 2013, 62, 782–804. [Google Scholar] [CrossRef]
- Galve, J.E.; Elduque, D.; Pina, C.; Javierre, C. Sustainable Supply Chain Management: The Influence of Disposal Scenarios on the Environmental Impact of a 2400 L Waste Container. Sustainability 2016, 8, 564. [Google Scholar] [CrossRef]
- Wang, X.; Chong, H.-Y. Setting new trends of integrated Building Information Modelling (BIM) for construction industry. Constr. Innov. 2015, 15, 2–6. [Google Scholar] [CrossRef]
- Van der Vaart, T.; van Donk, D.P. A critical review of survey-based research in supply chain integration. Int. J. Prod. Econ. 2008, 111, 42–55. [Google Scholar] [CrossRef]
- Lin, Y.-C.; Cheung, W.-F.; Siao, F.-C. Developing mobile 2D barcode/RFID-based maintenance management system. Autom. Constr. 2014, 37, 110–121. [Google Scholar] [CrossRef]
- Ko, C.-H. RFID-based building maintenance system. Autom. Constr. 2009, 18, 275–284. [Google Scholar] [CrossRef]
- Ju, Y.; Kim, C.; Kim, H. RFID and CCTV-based material delivery monitoring for cable-stayed bridge construction. J. Comput. Civ. Eng. 2011, 26, 183–190. [Google Scholar] [CrossRef]
- Ikonen, J.; Knutas, A.; Hämäläinen, H.; Ihonen, M.; Porras, J.; Kallonen, T. Use of embedded RFID tags in concrete element supply chains. J. Inf. Technol. Constr. (ITcon) 2013, 18, 119–147. [Google Scholar]
- Caldas, C.H.; Torrent, D.G.; Haas, C.T. Using global positioning system to improve materials-locating processes on industrial projects. J. Constr. Eng. Manag. 2006, 132, 741–749. [Google Scholar] [CrossRef]
- Kaplan, E.; Hegarty, C. Understanding GPS: Principles and Applications; Artech House: Norwood, MA, USA, 2005. [Google Scholar]
- Kasim, N.B. Improving Materials Management on Construction Projects. PhD Thesis, Loughborough University, Loughborough, UK, 2008. [Google Scholar]
- Liu, H.; Darabi, H.; Banerjee, P.; Liu, J. Survey of wireless indoor positioning techniques and systems. IEEE Trans. Syst. Man Cybern. Part C (Appl. Rev.) 2007, 37, 1067–1080. [Google Scholar] [CrossRef]
- Zhang, C.; Hammad, A.; Bahnassi, H. Collaborative multi-agent systems for construction equipment based on real-time field data capturing. J. Inf. Technol. Constr. (ITcon) 2009, 14, 204–228. [Google Scholar]
- Cheng, T.; Venugopal, M.; Teizer, J.; Vela, P. Performance evaluation of ultra wideband technology for construction resource location tracking in harsh environments. Autom. Constr. 2011, 20, 1173–1184. [Google Scholar] [CrossRef]
- Shin, T.-H.; Chin, S.; Yoon, S.-W.; Kwon, S.-W. A service-oriented integrated information framework for RFID/WSN-based intelligent construction supply chain management. Autom. Constr. 2011, 20, 706–715. [Google Scholar] [CrossRef]
- Woo, S.; Jeong, S.; Mok, E.; Xia, L.; Choi, C.; Pyeon, M.; Heo, J. Application of WiFi-based indoor positioning system for labor tracking at construction sites: A case study in Guangzhou MTR. Autom. Constr. 2011, 20, 3–13. [Google Scholar] [CrossRef]
- Song, L.; Liang, D. Lean construction implementation and its implication on sustainability: A contractor’s case study. Can. J. Civ. Eng. 2011, 38, 350–359. [Google Scholar] [CrossRef]
- Ergen, E.; Akinci, B.; Sacks, R. Tracking and locating components in a precast storage yard utilizing radio frequency identification technology and GPS. Autom. Constr. 2007, 16, 354–367. [Google Scholar] [CrossRef]
- Liu, X.; Shannon, J.; Voun, H.; Truijens, M.; Chi, H.-L.; Wang, X. Spatial and temporal analysis on the distribution of active radio-frequency identification (RFID) tracking accuracy with the kriging method. Sensors 2014, 14, 20451–20467. [Google Scholar] [CrossRef] [PubMed]
- Ellis, S.C.; Goldsby, T.J.; Bailey, A.M.; Oh, J.Y. Teaching lean six sigma within a supply chain context: The airplane supply chain simulation. Decis. Sci. 2014, 12, 287–319. [Google Scholar] [CrossRef]
- Andersson, H.; Christiansen, M.; Fagerholt, K. Transportation planning and inventory management in the LNG supply chain. In Energy, Natural Resources and Environmental Economics; Springer: Berlin, Germany, 2010; pp. 427–439. [Google Scholar]
- Thomas, D.J.; Griffin, P.M. Coordinated supply chain management. Eur. J. Oper. Res. 1996, 94, 1–15. [Google Scholar] [CrossRef]
- Aloini, D.; Dulmin, R.; Mininno, V.; Ponticelli, S. Key antecedents and practices for Supply Chain Management adoption in project contexts. Int. J. Proj. Manag. 2015, 33, 1301–1316. [Google Scholar] [CrossRef]
- Tan, K.C. A framework of supply chain management literature. Eur. J. Purch. Supply Manag. 2001, 7, 39–48. [Google Scholar] [CrossRef] [Green Version]
- Thomé, A.M.T.; Scavarda, L.F.; Scavarda, A.; de Souza Thomé, F.E.S. Similarities and contrasts of complexity, uncertainty, risks, and resilience in supply chains and temporary multi-organization projects. Int. J. Proj. Manag. 2016, 34, 1328–1346. [Google Scholar] [CrossRef]
- Xue, X.; Wang, Y.; Shen, Q.; Yu, X. Coordination mechanisms for construction supply chain management in the Internet environment. Int. J. Proj. Manag. 2007, 25, 150–157. [Google Scholar] [CrossRef]
- Min, J.U.; Bjornsson, H.C. Agent-based construction supply chain simulator (CS 2) for measuring the value of real-time information sharing in construction. J. Manag. Eng. 2008, 24, 245–254. [Google Scholar] [CrossRef]
- Isatto, E.L.; Azambuja, M.; Formoso, C.T. The role of commitments in the management of construction make-to-order supply chains. J. Manag. Eng. 2013, 31, 04014053. [Google Scholar] [CrossRef]
- Meng, X.; Sun, M.; Jones, M. Maturity model for supply chain relationships in construction. J. Manag. Eng. 2011, 27, 97–105. [Google Scholar] [CrossRef]
- Lu, Y.; Li, Y.; Skibniewski, M.; Wu, Z.; Wang, R.; Le, Y. Information and communication technology applications in architecture, engineering, and construction organizations: A 15-year review. J. Manag. Eng. 2014, 31, A4014010. [Google Scholar] [CrossRef]
- Erik Eriksson, P.; Pesämaa, O. Buyer-supplier integration in project-based industries. J. Bus. Ind. Mark. 2013, 28, 29–40. [Google Scholar] [CrossRef]
- Karthikeyan, L. Comparison of Barcodes and RFID in Supply Chain Management. Available online: http://indianmba.com/Faculty_Column/FC1562/fc1562.html (accessed on 11 December 2018).
- Kelm, A.; Laußat, L.; Meins-Becker, A.; Platz, D.; Khazaee, M.J.; Costin, A.M.; Helmus, M.; Teizer, J. Mobile passive Radio Frequency Identification (RFID) portal for automated and rapid control of Personal Protective Equipment (PPE) on construction sites. Autom. Constr. 2013, 36, 38–52. [Google Scholar] [CrossRef]
- Montaser, A.; Moselhi, O. RFID indoor location identification for construction projects. Autom. Constr. 2014, 39, 167–179. [Google Scholar] [CrossRef]
- Young, D.A.; Haas, C.T.; Goodrum, P.; Caldas, C. Improving construction supply network visibility by using automated materials locating and tracking technology. J. Constr. Eng. Manag. 2011, 137, 976–984. [Google Scholar] [CrossRef]
- Demiralp, G.; Guven, G.; Ergen, E. Analyzing the benefits of RFID technology for cost sharing in construction supply chains: A case study on prefabricated precast components. Autom. Constr. 2012, 24, 120–129. [Google Scholar] [CrossRef]
- Jeffery, S.R.; Garofalakis, M.; Franklin, M.J. Adaptive cleaning for RFID data streams. In Proceedings of the 32nd International Conference on Very Large Data Bases, Seoul, Korea, 12–15 September 2006; pp. 163–174. [Google Scholar]
- Sabesan, S.; Crisp, M.; Penty, R.V.; White, I.H. An error free passive uhf RFID system using a new form of wireless signal distribution. In Proceedings of the 2012 IEEE International Conference on RFID (RFID), Orlando, FL, USA, 3–5 April 2012; pp. 58–65. [Google Scholar]
- DiGiampaolo, E.; Martinelli, F. Mobile robot localization using the phase of passive UHF RFID signals. IEEE Trans. Ind. Electron. 2014, 61, 365–376. [Google Scholar] [CrossRef]
- Brewer, A.; Sloan, N.; Landers, T.L. Intelligent tracking in manufacturing. J. Intell. Manuf. 1999, 10, 245–250. [Google Scholar] [CrossRef]
- Li, H.; Chan, G.; Wong, J.K.W.; Skitmore, M. Real-time locating systems applications in construction. Autom. Constr. 2016, 63, 37–47. [Google Scholar] [CrossRef]
- Ingram, S.; Harmer, D.; Quinlan, M. Ultrawideband indoor positioning systems and their use in emergencies. In Proceedings of the Position Location and Navigation Symposium, Monterey, CA, USA, 26–29 April 2004; pp. 706–715. [Google Scholar]
- Khoury, H.M.; Kamat, V.R. Evaluation of position tracking technologies for user localization in indoor construction environments. Autom. Constr. 2009, 18, 444–457. [Google Scholar] [CrossRef]
- Chen, K.; Lu, W.; Peng, Y.; Rowlinson, S.; Huang, G.Q. Bridging BIM and building: From a literature review to an integrated conceptual framework. Int. J. Proj. Manag. 2015, 33, 1405–1416. [Google Scholar] [CrossRef]
- Morgan, D.L.; Krueger, R.A. Focus Group Kit: Volumes 1–6; Sage Publications: Thousand Oaks, CA, USA, 1997. [Google Scholar]
- Smithson, J. Using and analysing focus groups: Limitations and possibilities. Int. J. Soc. Res. Methodol. 2000, 3, 103–119. [Google Scholar] [CrossRef]
- Chai, J.; Wu, C.; Zhao, C.; Chi, H.L.; Wang, X. Reference Tag Supported RFID Tracking using Robust Support Vector Regression and Kalman Filter. Adv. Eng. Inform. 2017, 32, 1–10. [Google Scholar] [CrossRef]
Figure 1.
Framework of a coordinated approach for supply-chain tracking in Liquefied Natural Gas construction.
Figure 1.
Framework of a coordinated approach for supply-chain tracking in Liquefied Natural Gas construction.

Figure 2.
Architecture of the proposed supply-chain control platform.

Figure 3.
Location definition for fabrication tracking.

Figure 4.
Field implementation map for barcoding technology.

Figure 5.
Two locating methods for fabrication tracking.

Figure 6.
Progress for each individual component and the overall project.

Figure 7.
The simulated scenario of the construction site logistics in the oil and gas training facility.
Figure 7.
The simulated scenario of the construction site logistics in the oil and gas training facility.

Figure 8.
The system architecture of the installed Radio Frequency Identification reader.

Figure 9.
Four fixed RFID readers around the dehydration module.

Figure 10.
The attachment of RFID tags on the dehydration module.

Figure 11.
The relationship of RSSI distribution between two different RFID tags at the same place.

Figure 12.
Positioning errors of RFID tags with reference tags calibration (Static case).

Figure 13.
Tracking errors of RFID tags with reference tags calibration (dynamic case).

Figure 14.
Time spent on searching materials in the simulated lay down area.


Table 1.
Tracking technology selection for each process (items with * are explained in detail in Section 3.2: Second Focus Group Study).
Table 1.
Tracking technology selection for each process (items with * are explained in detail in Section 3.2: Second Focus Group Study).
| Stages | Detailed Processes | Factors | Feasibility of the Alternative Tracking Solutions | Suggested Tracking Solutions * | ||||||||
|---|---|---|---|---|---|---|---|---|---|---|---|---|
| No. | Name | (1) Types of the Objects to be Tracked * | (2) Indoor or Outdoor | (3) Line of Sight Required | (4) Location Required | (5) Tags Removal * | (a) Barcode | (b) Passive RFID | (c) Active RFID | (d) GPS | ||
| Offsite fabrication | 1 | Shop Detailing | Drawings | Indoor | Yes | No | No | √ | √ | × | × | (a) |
| 2 | Programming & Processing | Drawings * | Indoor | Yes | No | No | √ | √ | × | × | (a) | |
| 3 | Cutting & Drilling | Drawings * | Indoor | Yes | Yes | No | √ | √ | × | × | (a) | |
| 4 | Welding | Drawings * | Indoor | Yes | Yes | No | √ | √ | × | × | (a) | |
| 5 | Surface Treatment | Components after welding | Indoor | Yes | Yes | Yes/No * | √ | √ | √ | × | (a) or (b) | |
| 6 | Pre-assembly | Components after treatment | Indoor | Yes | Yes | Yes/No * | √ | √ | √ | × | (a) or (b) | |
| 7 | Ready for Delivery | Final goods | Outdoor | No | Yes | No | √ | √ | √ | √ | (b), (c) or (d) | |
| Shipping & delivery | 8 | Alongside Ship | Trucks | Outdoor | No | Yes | No | × | × | × | √ | (d) |
| 9 | On Board | Ships | Outdoor | No | Yes | No | × | × | × | √ | (d) | |
| 10 | Ship’s Arrive | Ships | Outdoor | No | Yes | Yes/No * | × | × | × | √ | (d) | |
| 11 | Goods Unloaded | Trucks | Outdoor | No | Yes | No | × | × | × | √ | (d) | |
| 12 | Arrival Onsite | Trucks | Outdoor | No | Yes | No | × | × | × | √ | (d) | |
| Construction site logistics | 13 | Warehouse | Goods | Indoor | No | Yes | No | √ | √ | √ | × | (a), (b) or (c) |
| 14 | Laydown Yard | Goods | Outdoor | No | Yes | No | √ | √ | √ | √ | (c) or (d) | |
| 15 | Installation | Goods | Outdoor | No | Yes | Yes/No * | √ | √ | √ | √ | (c) or (d) | |
Table 2.
Comparison of the barcode, passive Radio Frequency Identification (RFID), active RFID, and Global Position System tags.
Table 2.
Comparison of the barcode, passive Radio Frequency Identification (RFID), active RFID, and Global Position System tags.
| Barcode | Passive RFID | Active RFID | GPS | |
|---|---|---|---|---|
| Ruggedness | low | medium | high | high |
| Reliability | Wrinkled or smeared labels will not be read | Nearly flawless read rate | flawless read rate | flawless read rate |
| Tag size | Small | Medium | Medium (varies depending on application) | Large |
| Tag battery | No | No | Yes | Yes |
| Orientation dependence | Yes | No | No | No |
| Communication range | Very short, must be line of sight | Short (3 m or less) | Long (100 m or more) | Very long |
| Data collection | Manually scan | Passive (via portals and smart shelves to request the data from passive tags) # | Active (via portals to receive the data signals emitted from active tags) # | Active (via cellular or satellite) |
| Read speed | Slow | Medium | Fast | Fast |
| Data storage | <20 characters with linear | Small read/write data (e.g., 128 bytes) | Medium read/write data (e.g., 128 KB) with sophisticated data search and access capabilities | Large read/write data with either a memory card slot, or internal flash memory card and a USB port. |
| Updateable | No | Yes | Yes | Yes |
| Simultaneous scanning of multiple codes/tags | No | Yes | Yes | Yes |
| Cost per tag ($) | 0.01 | 0.05–1.00 | 5–30 | 100 or more |
| Fixed infrastructure cost | No | low | high | No |
| Tag/sensor capability | Ability to read and transfer tag values only when tag is scanned by reader; no date/time stamp | Ability to read and transfer sensor values only when tag is “powered” by reader #; no date/time stamp | Ability to continuously monitor and record sensor input #; date/time stamp for sensor events | Ability to continuously monitor and record sensor input; date/time stamp for sensor events |
| Best area of use | Tracking small objects and low value assets | Tracking within a building or a facility | Tracking within a large area (i.e., construction site) | Tracking within a geographical area or tracking transoceanic shipments and very high value assets |
# as been described in Section 2.2 Tracking Technologies section.
Table 3.
Activities during fabrication and their corresponding locations and weights for progress calculation.
Table 3.
Activities during fabrication and their corresponding locations and weights for progress calculation.
| Activities | Locations | Progress |
|---|---|---|
| Cutting and Drilling | Zone 1 | 20% |
| Assembly | Zone 2 | 24% |
| Welding | Zone 2 | 24% |
| Surface Treatment | Zone 3 | 15% |
| Pre-assembly | Zone 4 | 15% |
| Ready for Delivery | Zone 5 | 2% |
Table 4.
Location change for the three components during fabrication.
| 9 Nov | 10 Nov | 11 Nov | 12 Nov | 13 Nov | 14 Nov | 15 Nov | 16 Nov | |
|---|---|---|---|---|---|---|---|---|
| Column 1 | Zone 1 | Zone 2 | Zone 2 | Zone 3 | Zone 3 | Zone 4 | Zone 4 | Zone 5 |
| Column 2 | Zone 1 | Zone 1 | Zone 2 | Zone 2 | Zone 3 | Zone 3 | Zone 4 | Zone 5 |
| Beam 1 | Zone 1 | Zone 2 | Zone 3 | Zone 3 | Zone 4 | Zone 4 | Zone 4 | Zone 5 |
Table 5.
An overview of the tests done for site logistic tracking.
| Material Localization (Static Case) | Material Tracking (Dynamic Case) | Material Search | |
|---|---|---|---|
| Technology | Active RFID | Active RFID | Paper instruction, Passive and Active RFID |
| Subject | 7x RFID tags on the module | 1x RFID tag on the trolley | 50+ plant components in the lay down area |
| Frequency | 3–8 s/record (sampling rate) | 3–8 s/record (sampling rate) | 30 search cases/search methods |
| Area | Dehydration module | Area around dehydration module | 6 m × 36 m lay down area |
| Time duration | 40 min | Around 13 min (800 s) | Around 1.5 h |
© 2018 by the authors. Licensee MDPI, Basel, Switzerland. This article is an open access article distributed under the terms and conditions of the Creative Commons Attribution (CC BY) license (http://creativecommons.org/licenses/by/4.0/).
Share and Cite
MDPI and ACS Style
Wang, J.; Chi, H.-L.; Shou, W.; Chong, H.-Y.; Wang, X. A Coordinated Approach for Supply-Chain Tracking in the Liquefied Natural Gas Industry. Sustainability 2018, 10, 4822. https://doi.org/10.3390/su10124822
AMA Style
Wang J, Chi H-L, Shou W, Chong H-Y, Wang X. A Coordinated Approach for Supply-Chain Tracking in the Liquefied Natural Gas Industry. Sustainability. 2018; 10(12):4822. https://doi.org/10.3390/su10124822
Chicago/Turabian StyleWang, Jun, Hung-Lin Chi, Wenchi Shou, Heap-Yih Chong, and Xiangyu Wang. 2018. "A Coordinated Approach for Supply-Chain Tracking in the Liquefied Natural Gas Industry" Sustainability 10, no. 12: 4822. https://doi.org/10.3390/su10124822
Note that from the first issue of 2016, this journal uses article numbers instead of page numbers. See further details here.