Layout Optimization Model for the Production Planning of Precast Concrete Building Components
by
 , ,
, ,
Dong Wang
1, 
Guiwen Liu
1,*,
Kaijian Li
1,2,
Tongjing Wang
3,
Asheem Shrestha
4,
Igor Martek
4 and
Xiaobo Tao
5 1
School of Construction Management and Real Estate, Chongqing University, Chongqing 400044, China
2
Postdoctoral Station of Urban and Rural Planning, Chongqing University, Chongqing 400044, China
3
Key Laboratory of Road and Traffic Engineering of the Ministry of Education, Tongji University, Shanghai 20092, China
4
School of Architecture and Construction Management, Deakin University, Geelong, VIC 3220, Australia
5
School of Economics and Management, North China University of Technology, Beijing 100144, China
*
Author to whom correspondence should be addressed.
Sustainability 2018, 10(6), 1807; https://doi.org/10.3390/su10061807
Submission received: 4 May 2018
/
Revised: 25 May 2018
/
Accepted: 26 May 2018
/
Published: 30 May 2018
(This article belongs to the Special Issue Sustainable Construction and Building Materials)
Abstract
:Precast concrete comprises the basic components of modular buildings. The efficiency of precast concrete building component production directly impacts the construction time and cost. In the processes of precast component production, mold setting has a significant influence on the production efficiency and cost, as well as reducing the resource consumption. However, the development of mold setting plans is left to the experience of production staff, with outcomes dependent on the quality of human skill and experience available. This can result in sub-optimal production efficiencies and resource wastage. Accordingly, in order to improve the efficiency of precast component production, this paper proposes an optimization model able to maximize the average utilization rate of pallets used during the molding process. The constraints considered were the order demand, the size of the pallet, layout methods, and the positional relationship of components. A heuristic algorithm was used to identify optimization solutions provided by the model. Through empirical analysis, and as exemplified in the case study, this research is significant in offering a prefabrication production planning model which improves pallet utilization rates, shortens component production time, reduces production costs, and improves the resource utilization. The results clearly demonstrate that the proposed method can facilitate the precast production plan providing strong practical implications for production planners.
1. Introduction
Prefabrication is the practice of assembling the components of a structure in a factory, or other manufacturing locations, and then transporting complete assemblies or sub-assemblies to the construction site where the structure is to be erected. Whereas, traditional building construction takes place on site, prefabrication has gained much interest in recent years, particularly with regard to industrial buildings, for its potential energy saving benefits, as well as improved efficiencies in the construction process. Consequently, the efficiencies gained in the production process of precast components directly enhance the construction time and cost of buildings.
There are several methods to enhance the efficiency of precast components production and to reduce its cost. Generally, these methods involve various stages, including precast component design [1,2,3], material management/transshipment [4,5], precast component production planning, precast component inventory control [6,7,8,9], precast component transportation and site assembly [10,11]. It is well established that production planning is the key element in the precast production process and it is closely related to the production time and cost. Planning involves the allocation of resources over a period of time to perform a series of jobs that are subject to known constrains. However, the current practice of designing precast production plans depends primarily on the scheduler’s experience, which has generally proven to be problematic for planners and schedulers [12]. Inefficient resource utilization and high production cost are common in the precast industry due to unsuitable and inaccurate planning methods [13,14]. Therefore, optimizing the production plan is vital in the precast component production process.
Subsequently, this particular area has attracted the interest of many researchers who have proposed various computational techniques to manage planning issues. For example, Dawood developed a scheduling model for the precast industry using the heuristic job scheduling approach. The proposed model was regarded as a factory simulator to automate the planning process which comprised of scheduling rules and the factory’s attributes [13]. Chan and Hu developed their flow shop sequencing model for precast production scheduling by incorporating actual constraints. They adopted a genetic algorithm approach and compared the proposed method with some well-established heuristic rules [12]. Benjaoran et al. studied the impact of the quantity of molds on shop floor schedules of precast production and proposed a bespoke precast flow shop scheduling model by using a flow shop sequencing model [15]. Ko and Wang applied a multiple-objective genetic algorithm to search for optimum solutions with minimum makespan and tardiness penalties. In their model, buffer size between workstations in precast production scheduling was considered for the first time [14]. Tharmmaphornphilas and Sareinpithak developed a scheduling model to select concrete formulas and schedule jobs to minimize the total product cost and proposed a heuristic approach to solve the model [16]. Hong and Lee developed algorithms that could promptly establish a production layout plan by considering in situ production factors affecting composite precast concrete members [17]. Prata et al. proposed a model based on integer linear programming to schedule the production of the beams so as to minimize the losses in a minimal time by taking into account the constraints inherent in the forms and beams [18]. Yang et al. proposed a flow shop scheduling model of multiple production lines for precast production and developed an optimization approach to facilitate optimized scheduling by using genetic algorithm [19].
Examining the existing literature on precast production planning, two categories of research can generally be found. The first category focuses on optimizing the specific process for various distinct precast production methods, such as the roll-cutting process of the filigree wide-slab method [18] and the layout process of composite precast concrete members for precast concrete in situ production [17]. The second category focuses on traditional precast production methods for optimizing the production plan based on the job shop/flow shop scheduling problem [12,13,14,15,16,19], which mainly emphasize the flow variability between processes under special constrains such as limited labor and mold [14]. However, strategies for improving the specific production processes for traditional precast production methods are generally neglected in current literature.
This paper evaluates the molding process, a critical process closely related to precast production efficiency and proposes a layout optimization schedule of the components on pallets during the molding process, that (1) improves the utilization rate of the pallets, (2) shortens the manufacturing time, (3) reduces the component manufacturing cost, and (4) saves the resource consumption during the precast production.
2. Problem Description
There are two basic types of precast component production systems in a precast plant, namely, the fixed location production/stationary system and the flow shop production/traveling system [19,20,21]. For fixed location production, all the activities are performed in a particular workstation either by the same team or different teams. In the flow shop production system, pallets are moved on a rolling line from one station to another, with different activities being performed at different stations by a particular team. The two production systems involve the same six main processes: (1) pretreatment, (2) molding, (3) placing of rebars and embedded parts, (4) casting, (5) curing, and, (6) stripping.
It is worth noting that two of the processes, mold setting and curing, have a significant impact on the component production efficiency and cost. In regards to the flow shop production, several pallets are cured in a kiln during the curing process, where the concrete mix undergoes an accelerated but expensive process. For the curing of the precast concrete, water is consumed by the curing kiln, which is driven by electricity. The curing kiln is limited by a fixed pallet capacity and it takes some hours to cure the precast components loaded on the pallets. Therefore, if more components can be accommodated in the kiln during the curing process, the average curing cost and resource (electricity and resource) consumption for each component are lowered and an increased efficiency of component production can be achieved. In the mold setting process, molds are placed onto the pallets according to the component production layout plan, which determines the number of components on each pallet. The pallet is generally made of steel and can be used a few hundred times. Obviously, the more components loaded on a pallet, the higher utilization rate of pallet, the lower the average curing cost for each component, and the larger the efficiency of component production. Thus, cost and efficiency of component production is directly responsive to the configuration of the mold setting process. Furthermore, from the perspective of the environment, an intensive molding layout could enable lower energy and material consumption (e.g., electricity, water and steel pallet consumption) during the curing process. Similarly, for fixed location production, which normally uses a steam curing method in its curing process, a much more efficient layout plan also helps to reduce the number of pallet cycles. Accordingly, production efficiency can be improved and the resource consumption, production time and curing cost can be reduced as well.
In contrast to the manufacturing industry, such as in car, electronics or machine production where automated scheduling decision systems are used, precast concrete component production generally relies on subjective decision systems. While the knowledge and experience of managers may be sufficient to handle normal workloads, there is limited emphasis on optimizing the use of the pallet. This leaves the production facility unable to maximize output in peak periods. Indeed, it leaves the production facility unable to gauge what its maximum production capacity is.
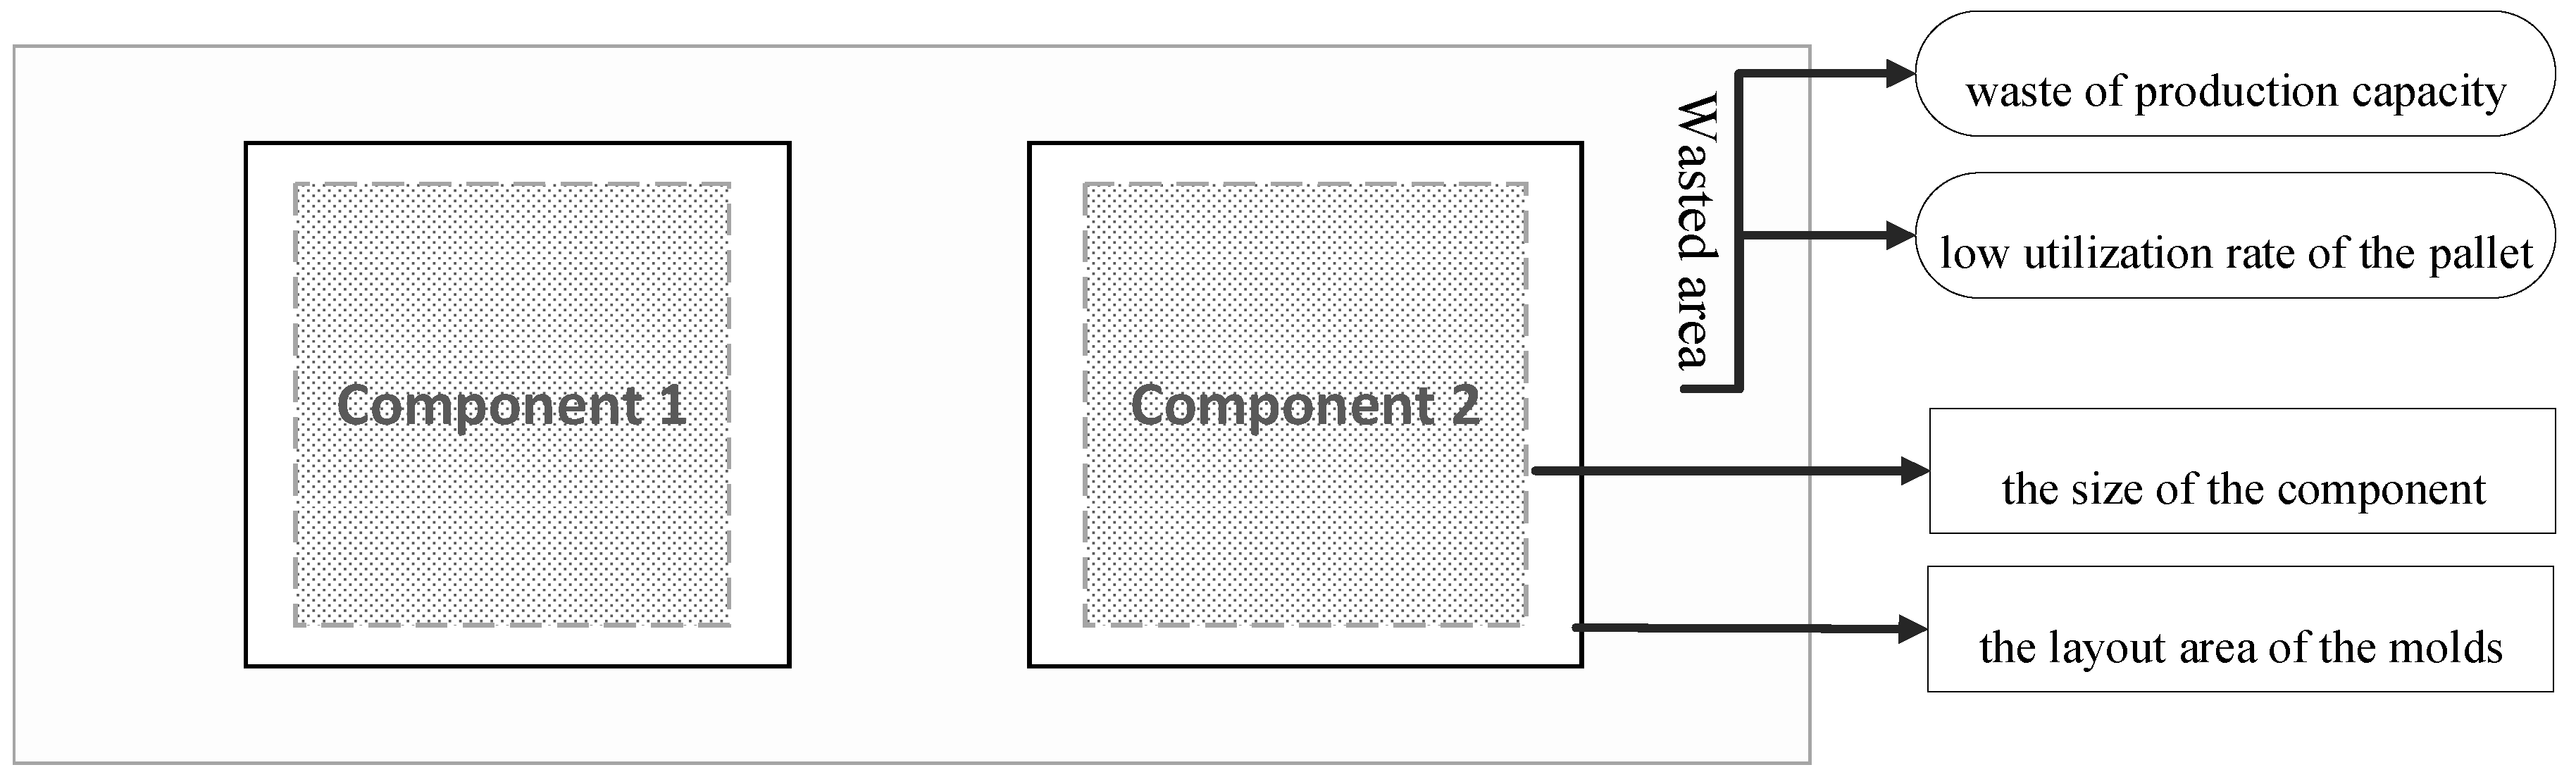
Figure 1 shows an example of a typical production layout plan of precast components. It includes a large area inside an unused pallet. Not only does this reduce the pallet utilization rate, but this also causes a waste of production capacity. Consequently, this results in extended production cycles and increased curing costs.
In summary, concrete components are laid out on pallets based on existing practices and the judgment of the manager, which can be sub-optimal. This leads to a lower utilization rate of the pallets and curing kiln, and consequently imposes higher costs and resource consumption and reduces production rates. If production efficiency is to be improved, a structured, scientific approach to the laying-out of the precast molds needs to be adopted. The aim of this study is to propose such a structured approach.
3. Proposed Model
Precast components are usually rectangular and workers normally arrange the molds in a regular way (horizontal or vertical). These assumptions will be incorporated and inform the model developed here. There are three such assumptions: (1) the shape of the production component is to be contained within an envelope rectangle of the smallest possible size, (2) the edge of the component is to be arranged parallel or perpendicular to the edge of the mold, regardless of the diagonal layout, and, (3) the amount of mold available is unlimited. The relevant notions used in developing the model, along with their corresponding definitions, are shown in Table 1.
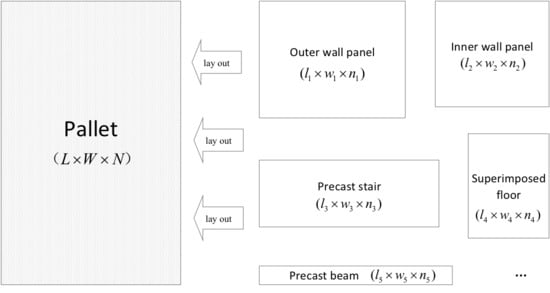
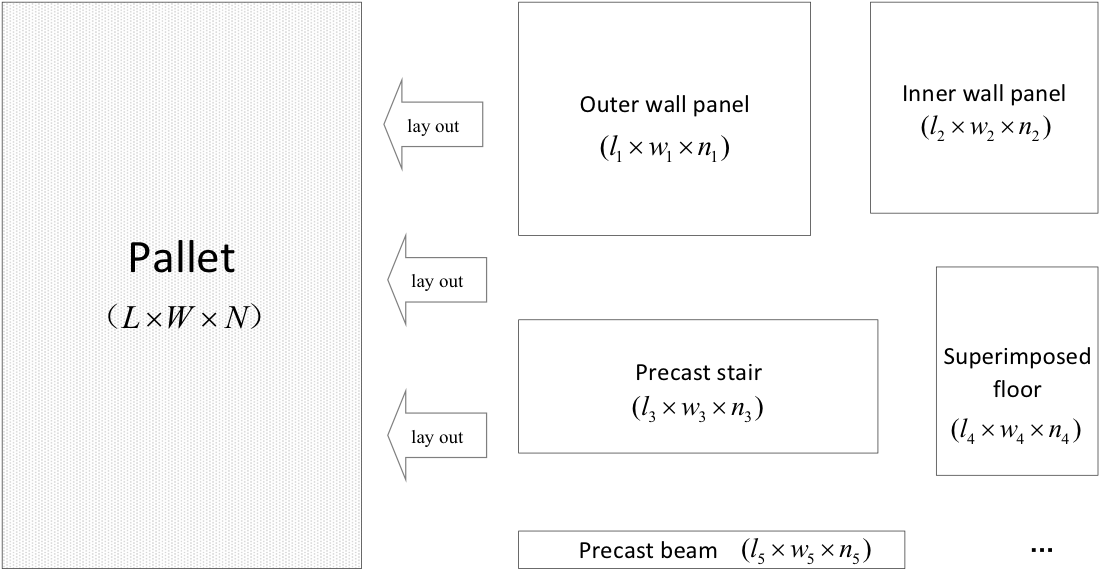
Figure 2 shows an example of a general order. Here, the production plan is determined by the order contract to be delivered within a certain amount of time. Moreover, there are various sizes of components needed to be produced, with the demand for the components designated as d1, d2, d3, ..., di, respectively. All these will be laid out on the pallets. N describes the number of pallet cycles required. As layout plans vary, N will vary as well. The aim is to minimize N (all else being equal), and in doing so, to reduce the component production cost and time.
The layout optimization model is formulated using the following mathematical equations
s.t.
In the model, the objective function in Equation (1) represents the average utilization of the pallets. By computing this equation for the highest value, the highest utilization rate can be determined, with the number of pallet cycles consequently minimized. In turn, reduction of the pallet cycles will increase the production capacity, shorten the production time, and reduce the number of the pallets that need curing, thereby reducing overall production cost.
The constraint introduced in Equation (2) ensures that the number of components required to meet the order agreement are achieved. As shown in Table 1, in a production plan, there are j layout schemes in total. Where xj stands for the number of pallets using the jth layout scheme, and, aij is the number of the ith component on a pallet using the jth layout scheme. So, the product of aij and xj needs to meet the ith component’s demand di.
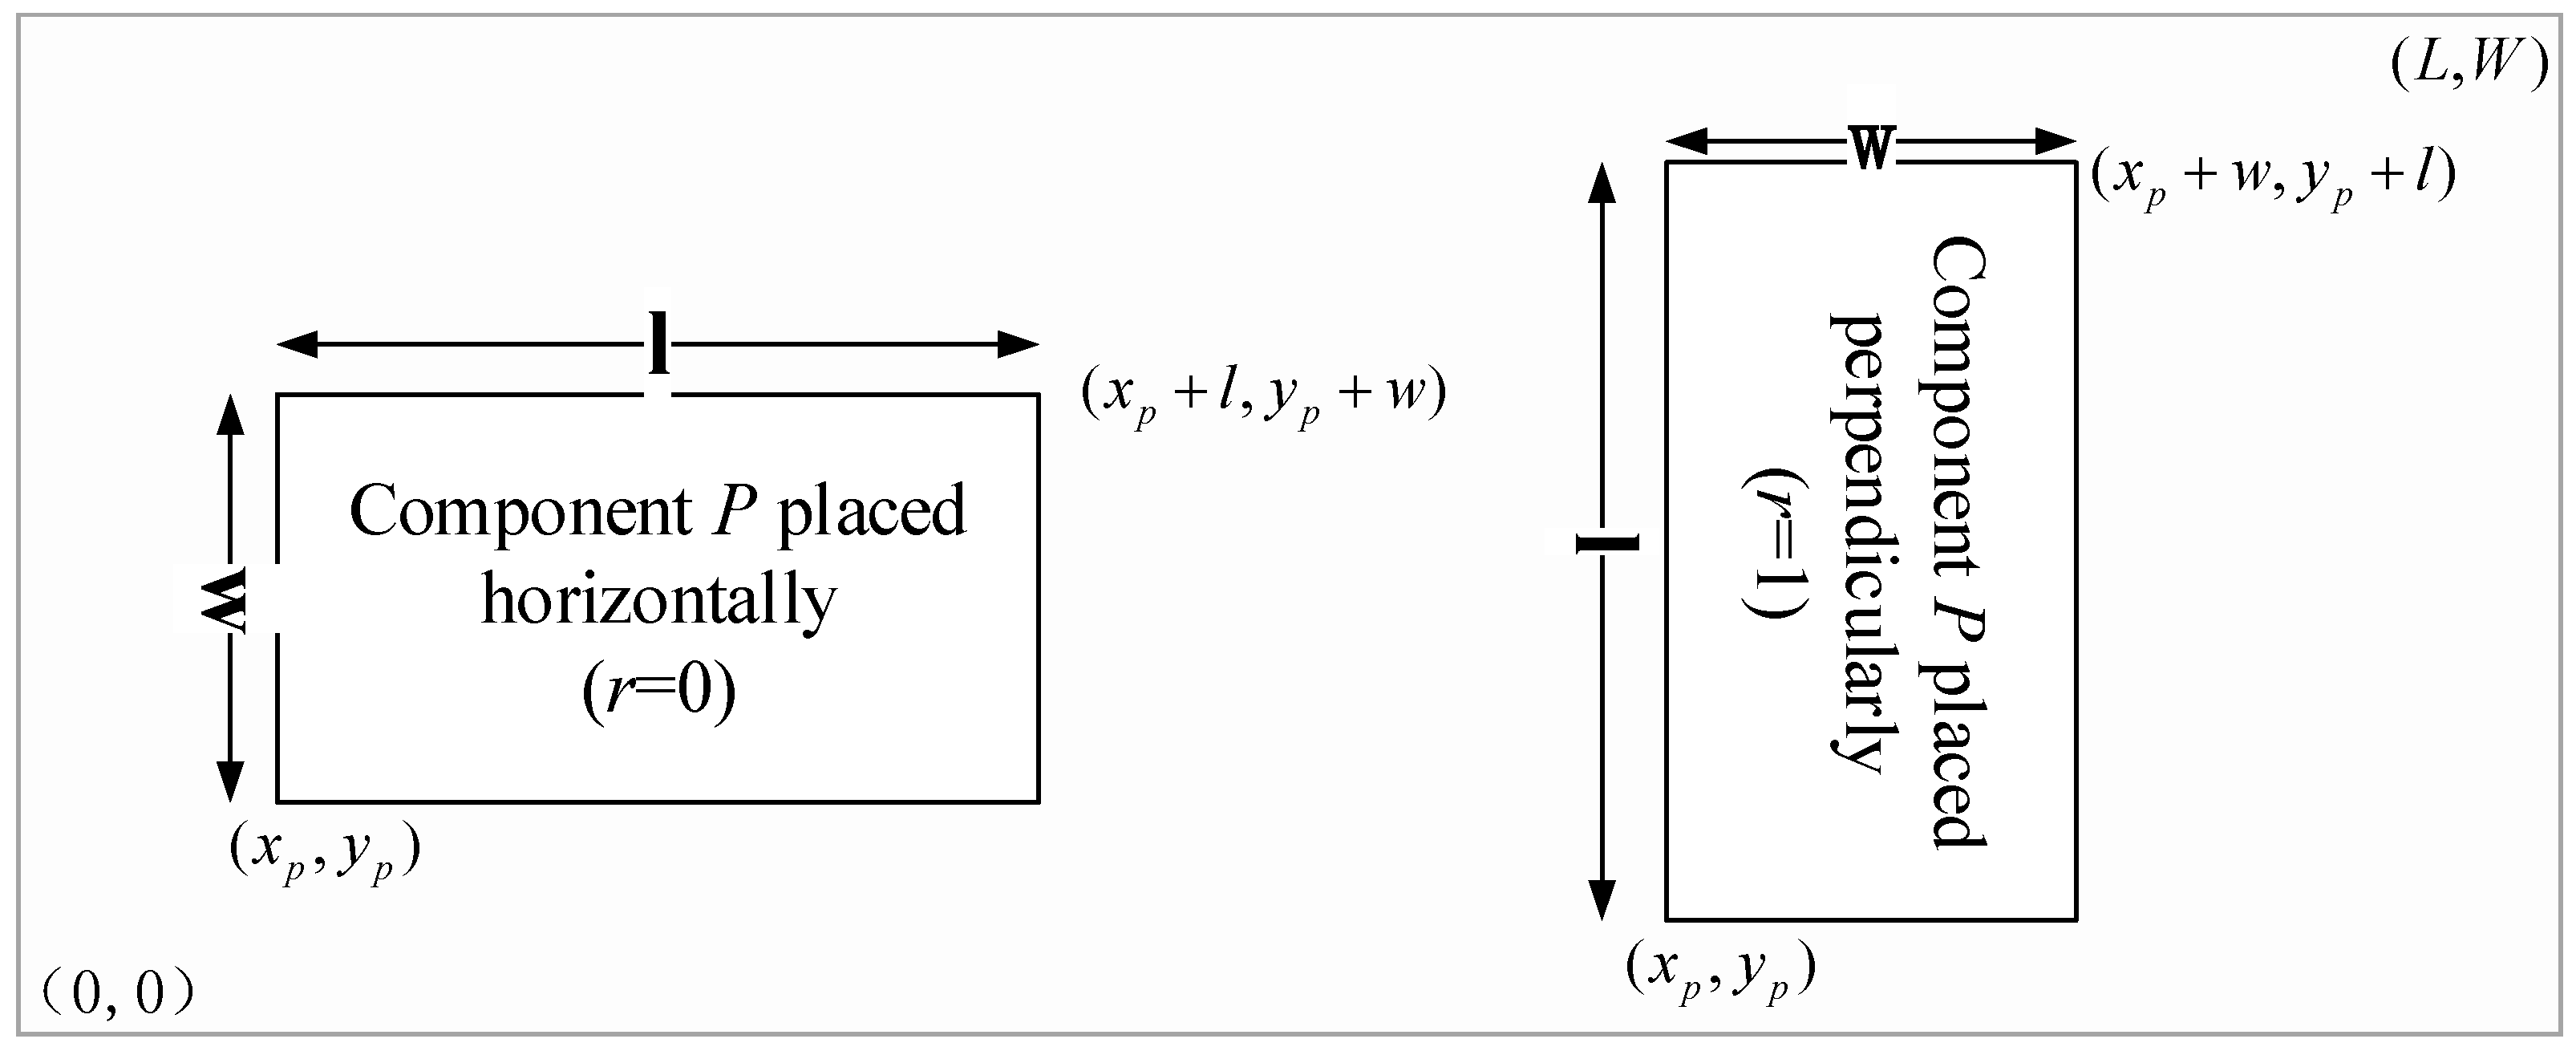
The constraint in Equations (3) and (4) ensures that the component layout will be limited within the pallet size. As shown in Figure 3, components could be placed either horizontal or perpendicular to meet the parallel requirement. As shown in Table 2, we adopt a coordinate constraint to achieve this condition, considering the convert of component placement. In order for the components to be arranged within the pallet dimensions, the formulas in the table will need to be satisfied.
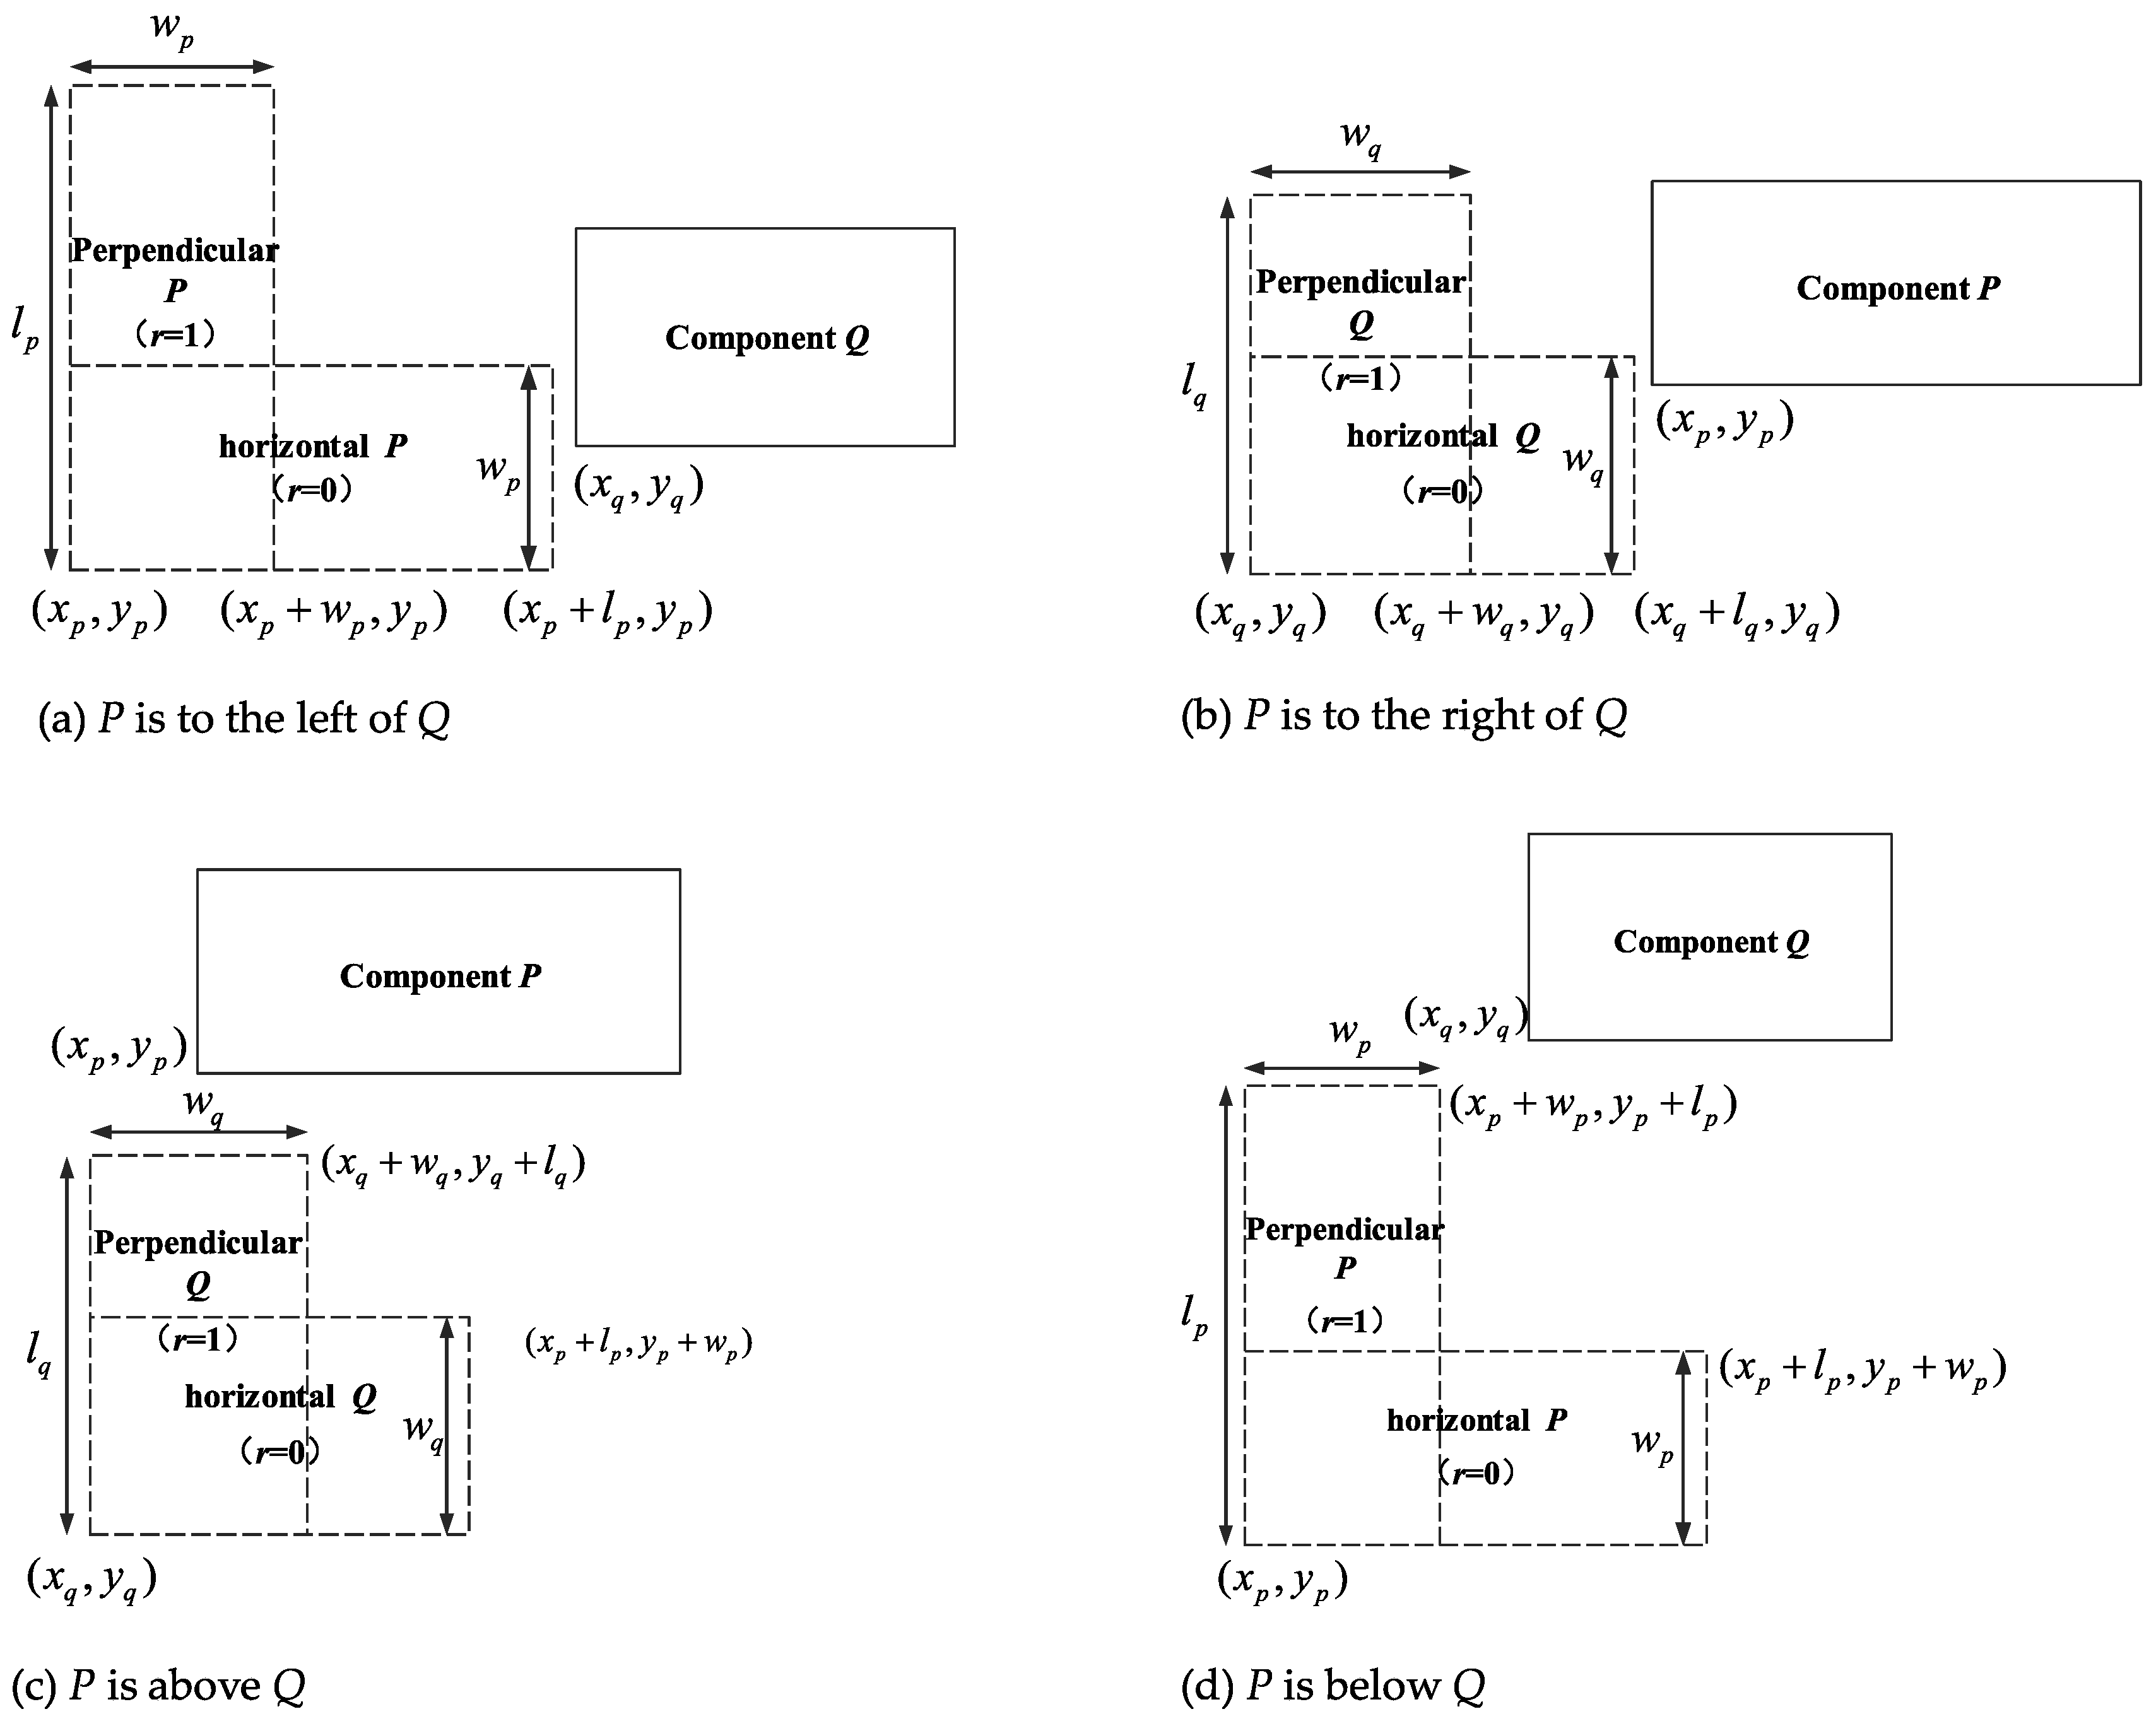
The constraint in Equation (5) assures that the component layouts do not overlap. There are four non-overlap situations in total, as shown in Figure 4. Each formula in (5) represents a non-overlap situation of the P, Q components, and the corresponding coordinate constraints were given, which are presented in Table 3. Therefore, if the component layouts do not overlap with each other, at least one of the formulas in (5) will be satisfied. Constraints in Equation (6) indicate the placement method for components, where r = 0 means that the components are laid in a transverse direction, and r = 1 means that the members are placed in a longitudinal direction. Constraints in equations (7) are constraints of decision variables.
4. Algorithm
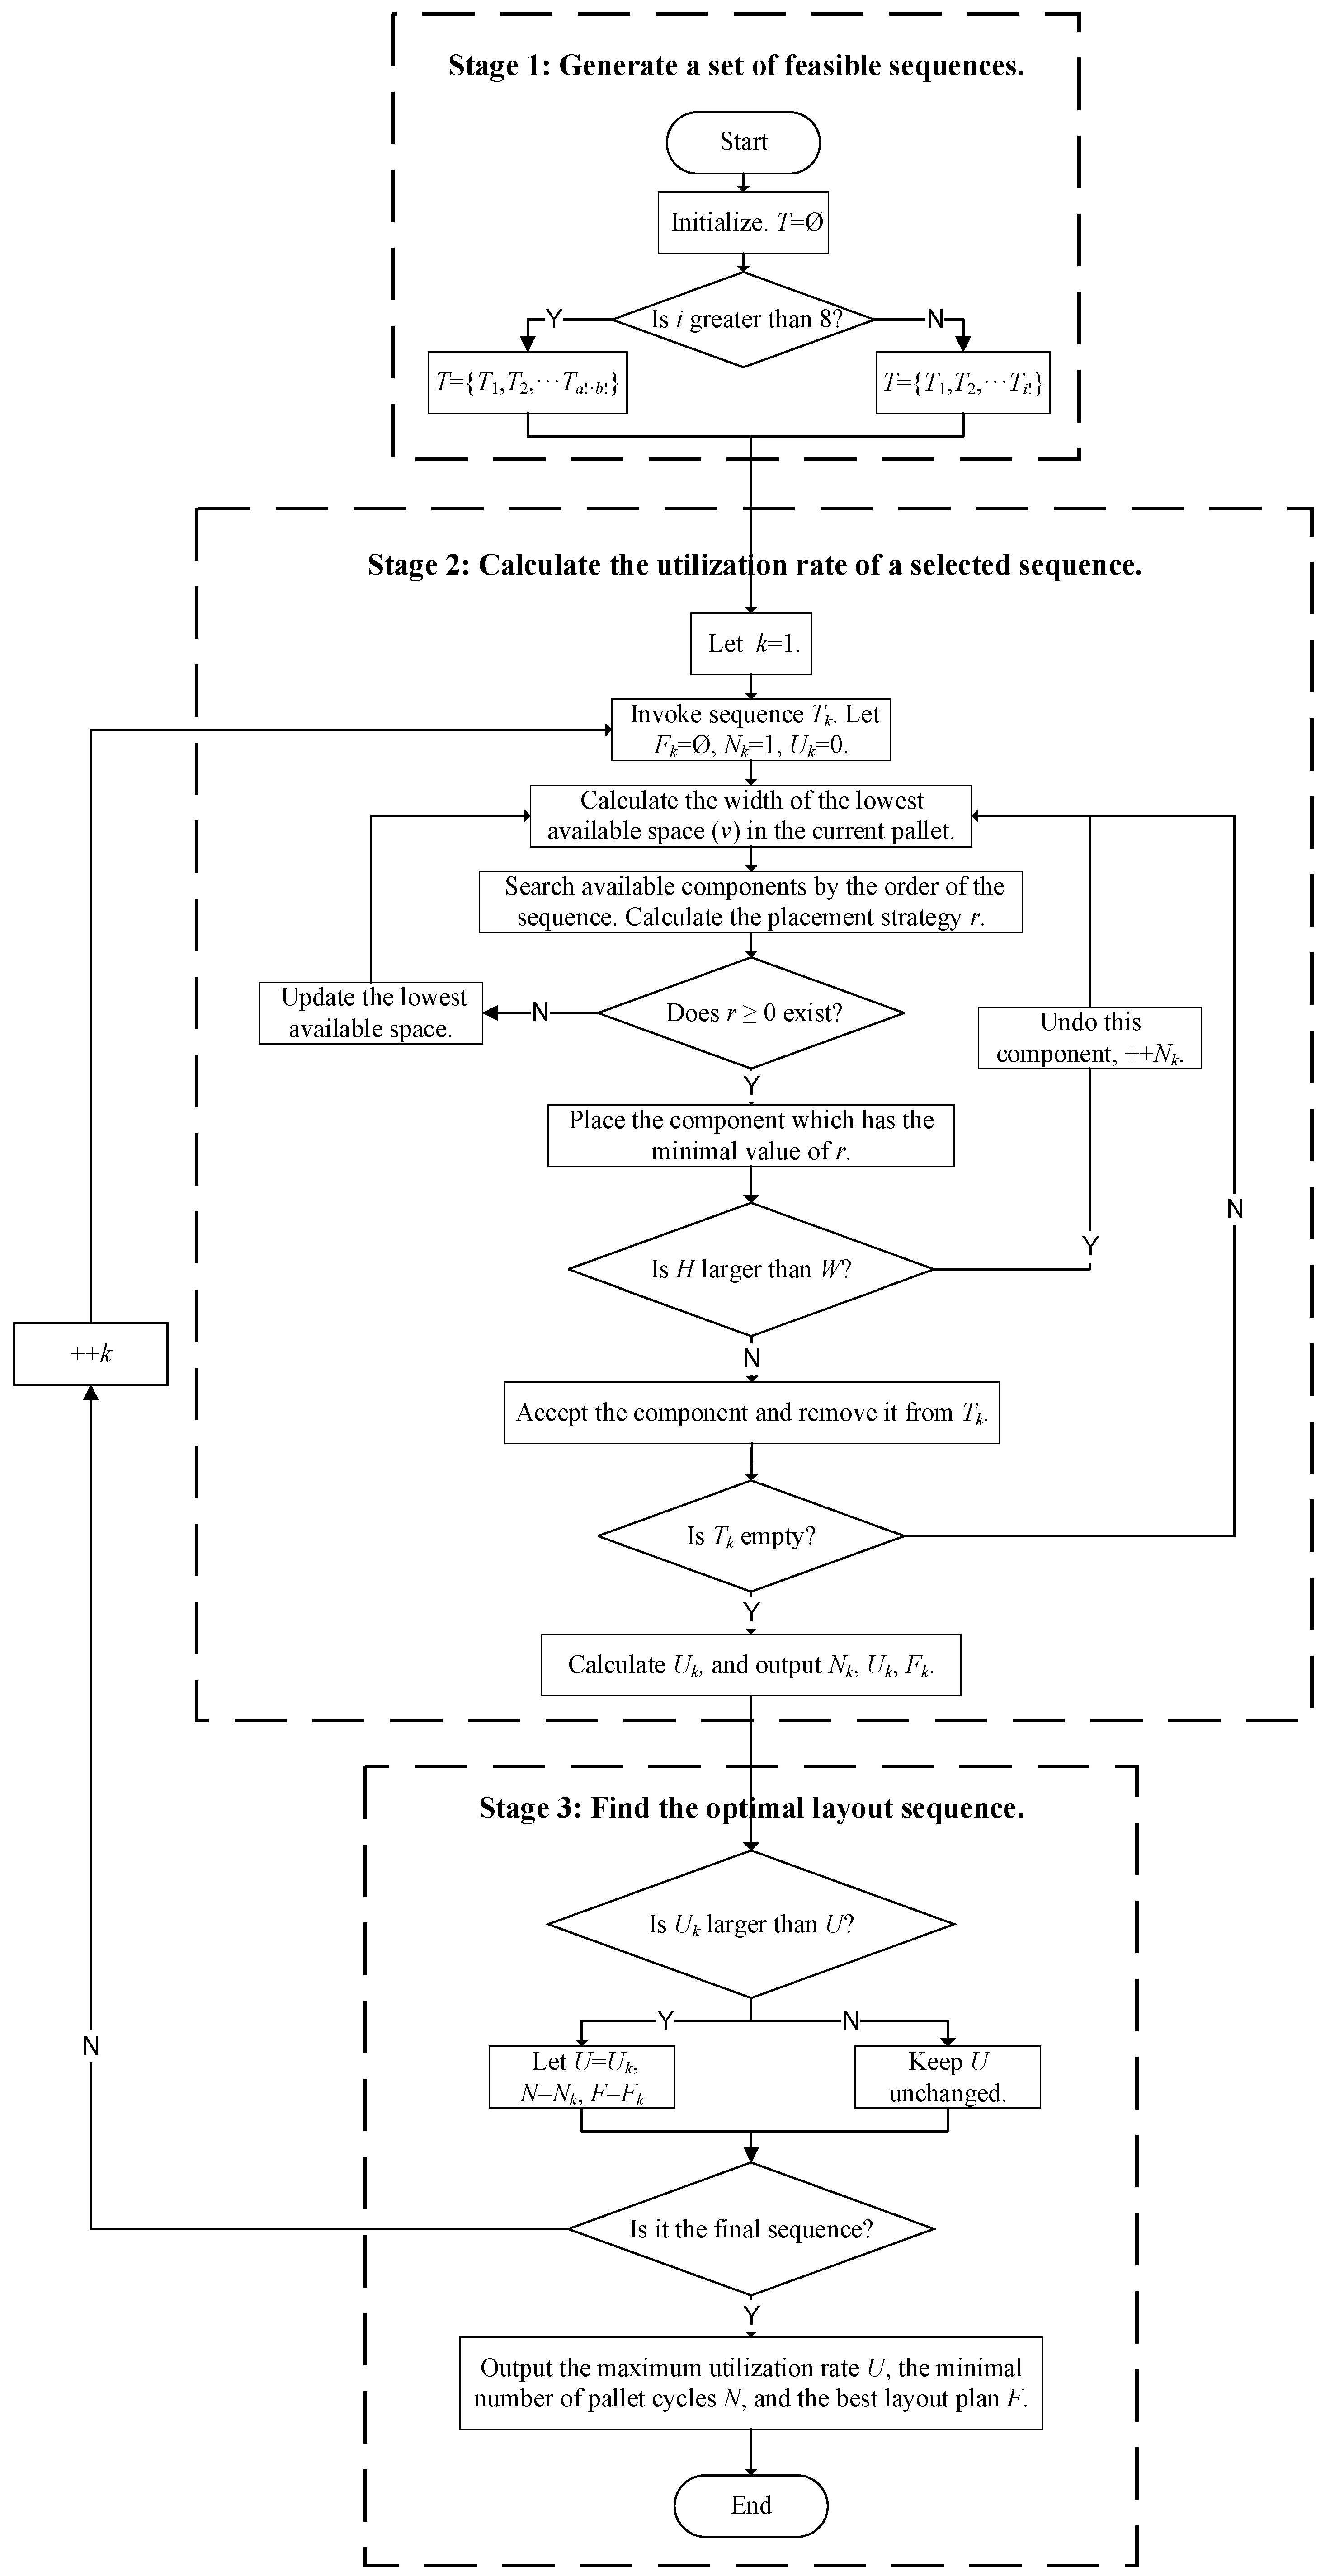
This paper develops an optimization approach to maximizing the average utilization rate of pallets with extra constraints, such as the size of molds and the order demand. A heuristic algorithm is developed to solve the proposed problem. In this algorithm, components needed to be placed to compromise the elements of production sequences, with the position of the elements corresponding to the order of component placement (the earlier the component is located in the sequence, the earlier it is placed). Additionally, different component production sequences represent different production schedules, which can lead to different layout schemes of the pallets. Therefore, the algorithm aims to identify the best layout sequence with the maximum utilization of pallets among numerous feasible sequences, thus identifying the optimal schedule. As shown in Figure 5, the algorithm can be described according to the following three interrelated stages: (1) generate a set of feasible sequences, (2) calculate the utilization of an extracted sequence, (3) identify the optimal layout sequence. The following section describes the three stages in detail. Table 4 shows the notions used in the heuristic algorithm.
Stage 1: Generate a set of feasible sequences.
Stage 1 is used to generate a set of feasible sequences. If the number of the component types is i, the maximum number of production sequences is i!. Assume there are three component types (A, B, C), thus a total of 3! = 6 feasible sequences can be generated as follows: ABC, ACB, BAC, BCA, CAB, CBA. However, if the number of the component types becomes large (being greater than eight in this case), an enormous number of sequences would be created, which would result in a high computational cost. In order to reduce the unnecessary computation time of this algorithm, a classification method is presented. Notably, as shown in Figure 6, a small component is more capable of being be placed into the remaining positions than a large one, which can improve the utilization of the pallet. Therefore, sequences where small components are at the back can generally achieve better solutions. According to this, we equally divide all the components into two groups: small and large, with the large group always being in the front of the sequence. The number of these two groups’ component types are a = int(i/2) and b = i-int(i/2), respectively. For each group, the sequences are generated via random permutations. For example, nine kinds of components in total need to be produced. We firstly divide them into two groups, where the large group contains a = int(9/2) = 4 kinds of components while the small group contains b = 9-int(9/2) = 5, then 4! = 24 permutations for the large group and 5! = 120 for the small group can be generated. Thus a total number of 4! × 5! = 2880 sequences are finally created, which has declined exponentially in comparison to the result of 9! = 362,880 for the ungrouped method. In short, in this stage, the feasible sequences are generated by the following rules: if the number of the component types i is greater than eight, then , where a(b) is the large(small) group’s component type, and a + b = i; otherwise .
Stage 2: Calculate the utilization rate of an extracted sequence.
Stage 2 is used to calculate the utilization rate of the selected sequence from Stage 1. This algorithm establishes an updating principle to place the components in the sequence (see Step 3). Also, the two placement strategies (horizontally and vertically) of components are considered. The specific procedural steps are outlined below.
Input: The kth sequence Tk.
Output: The number of pallet cycles according to kth sequence Nk, the average utilization rate according to kth sequence Uk, and the kth layout plan Fk.
Step 1: Initialize. Let Fk = Ø, Nk = 1, Uk = 0; k = 1.
Step 2: Calculate v.
Step 3: Search available components by the order of the sequence. Define the placement strategy of components as r. r = 0 means that the component is arranged horizontally, r = 1 means that the component is arranged vertically.
If v is longer than the long side of the component then r = 0;
If v is longer than the short side, but shorter than the long side then r = 1;
If v is shorter than the short side then r = −1.
Step 4: Search for the value of r in sequence Tk. Check whether there r ≥ 0 exists.
If true, then place the component with the first minimal value of r to the left side, go to Step 5; otherwise update the lowest available space, go to Step 2 (the updating principle for the lowest available space is to raise its height to the penultimate lowest space when it is compared to the current one).
Step 5: Compare H with W;
If H<W then accept the component, add the component into Fk; and remove it from Tk, go to Step 6; otherwise, Nk = Nk + 1; go to Step 2;
Step 6: Check whether Tk = Ø.
If true, save Nk and calculate Uk, go to Step 6; otherwise, go to Step 2.
Step 7: Return Fk, Nk, Uk.
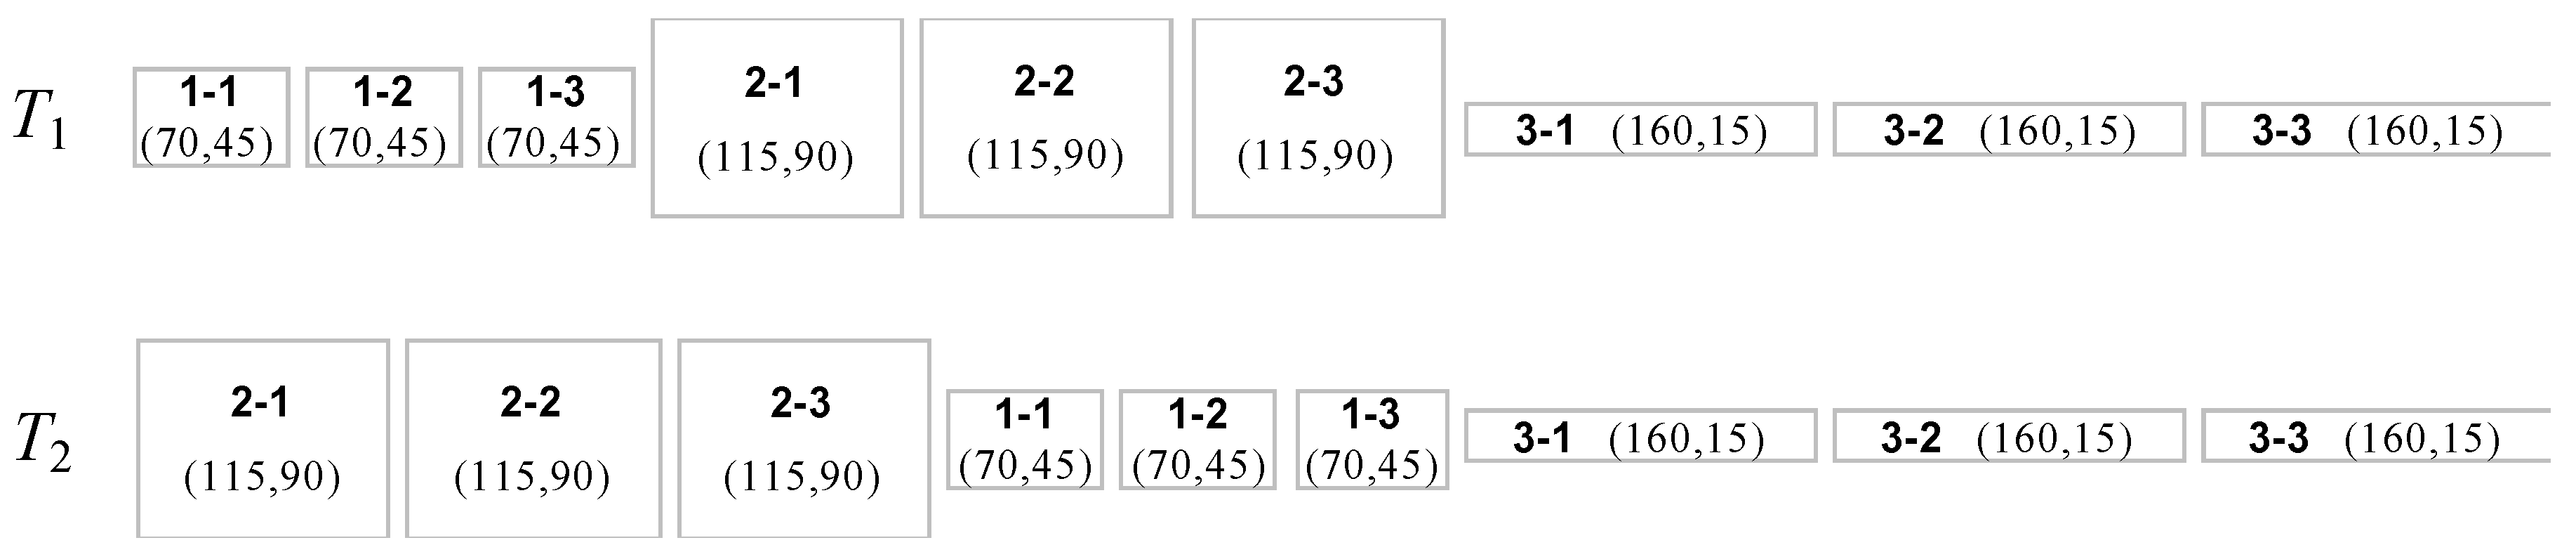
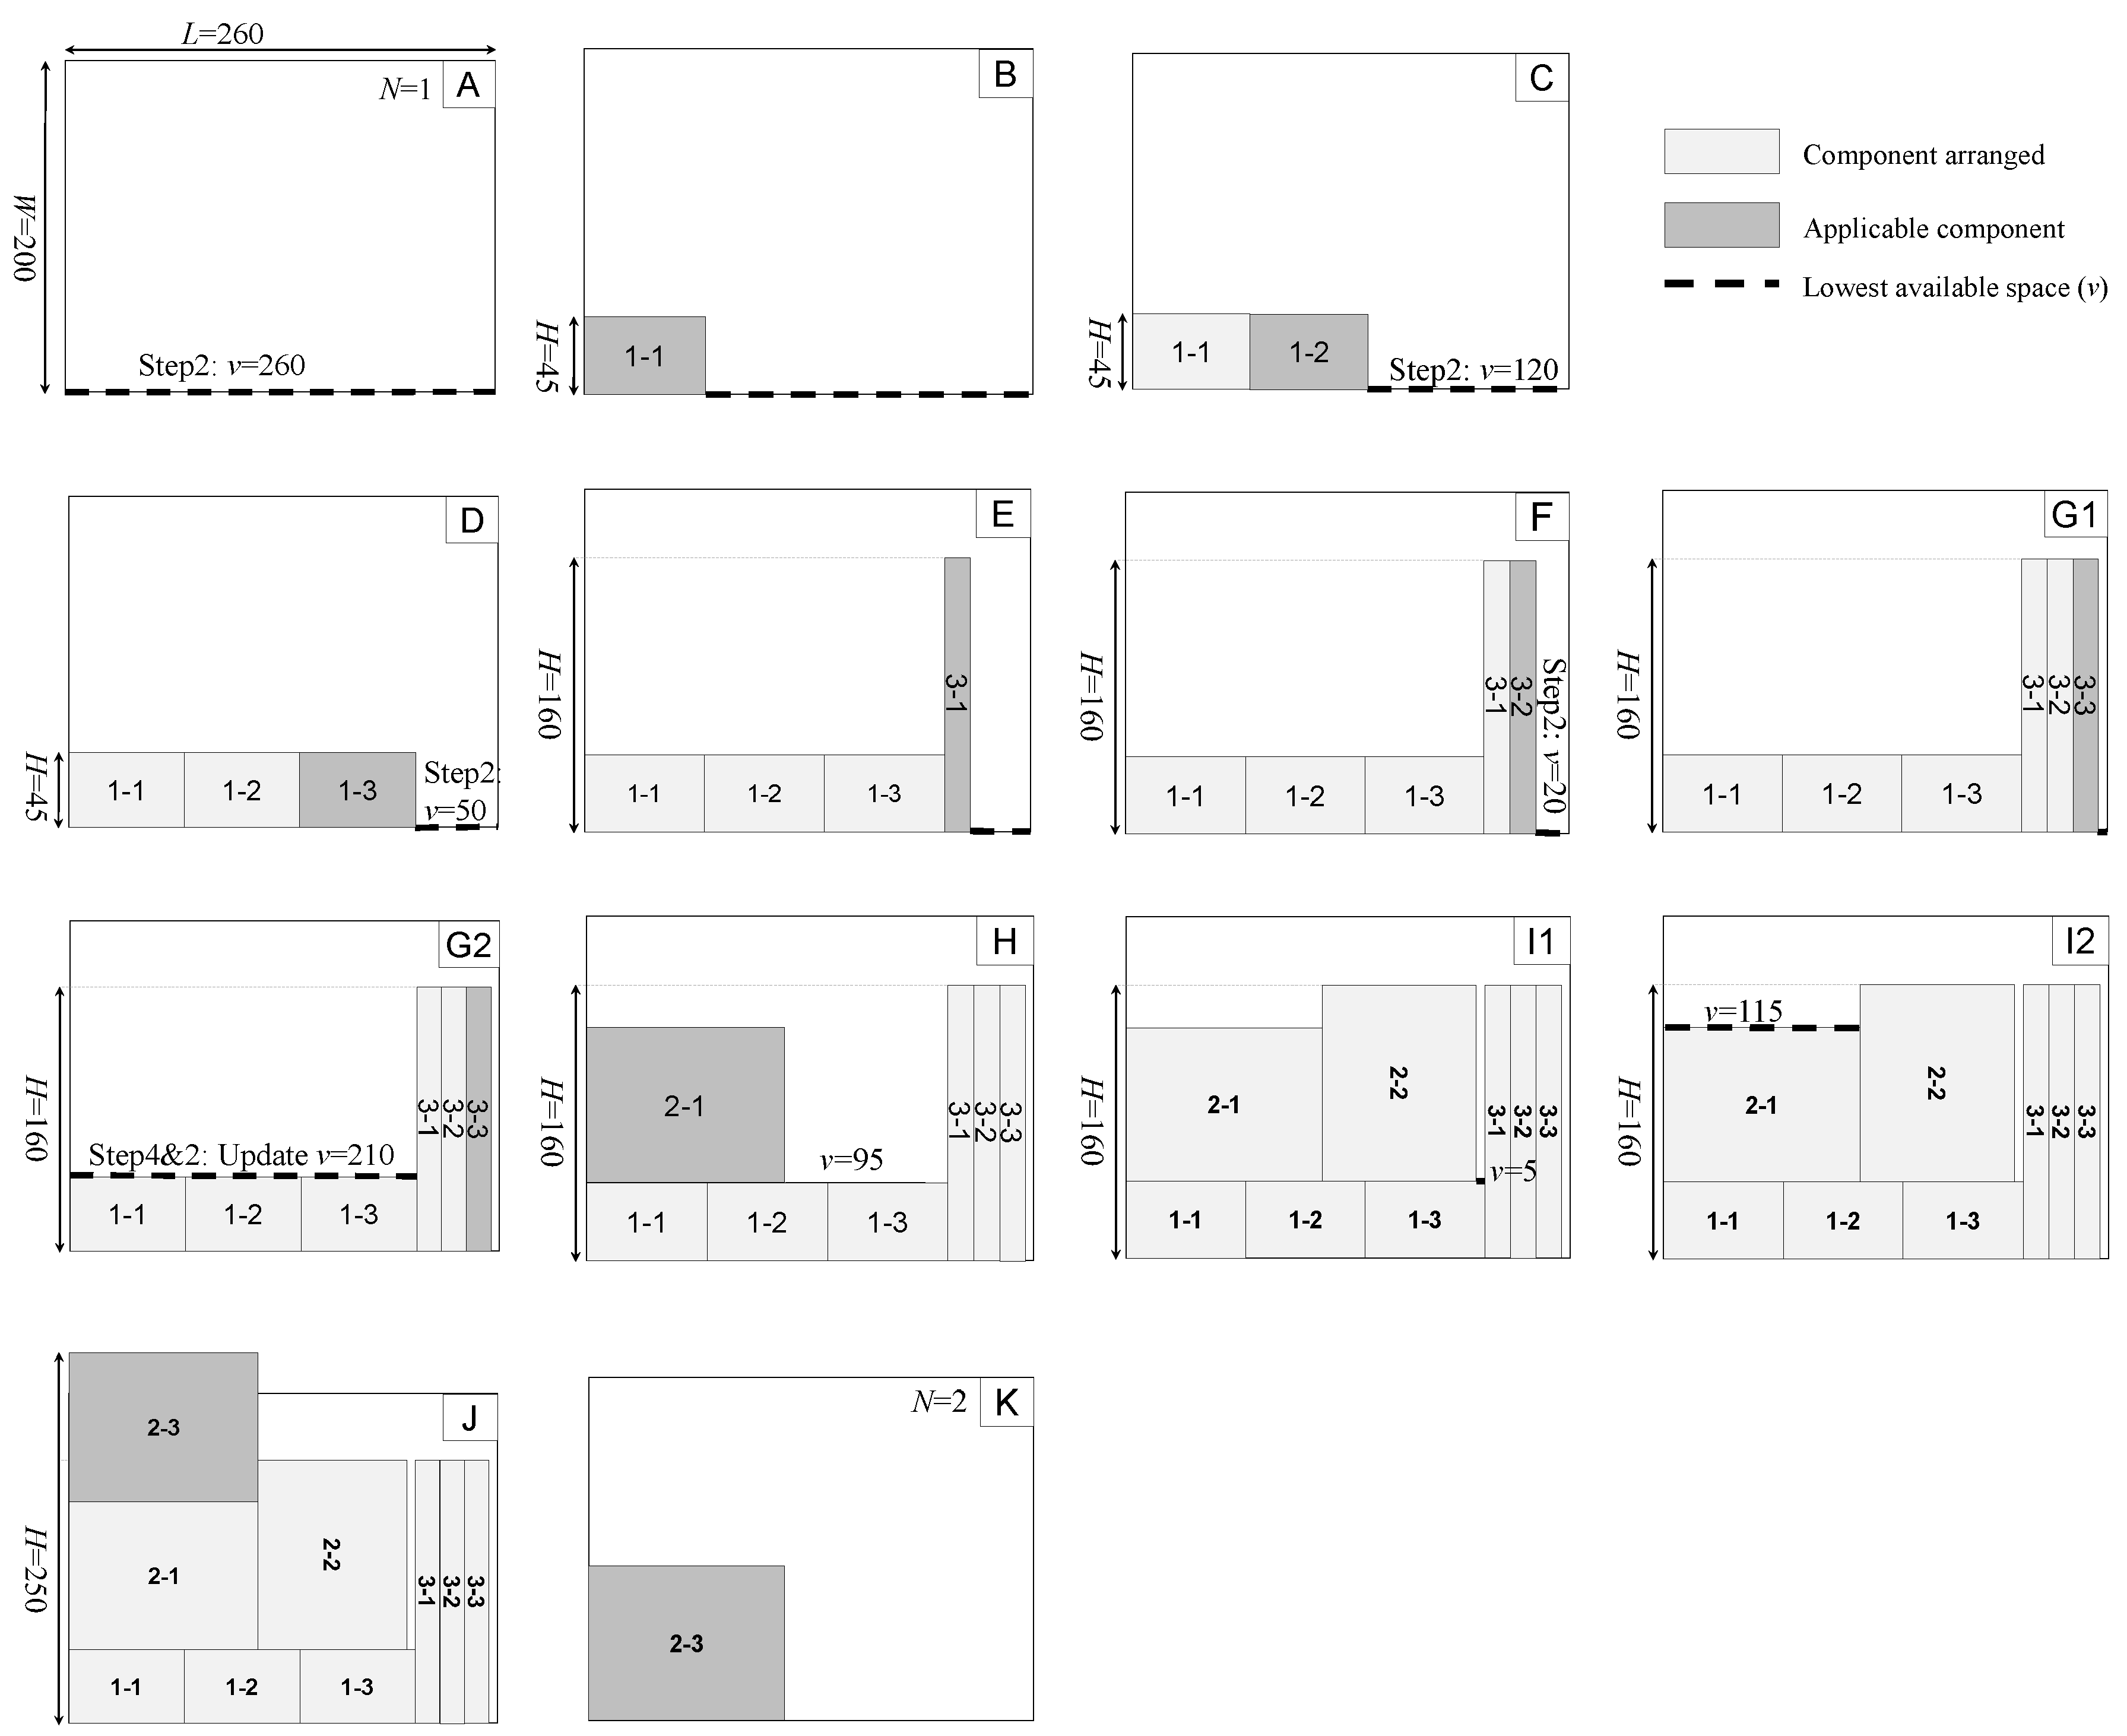
For understanding how Stage 2 runs and how the updating principle works, a demo sequence (sequence T1) is proposed to test it. Nine components in total are needed for arrangement, and the size and order of components in T1 are given in Figure 7. Figure 8(G1) and Figure 8(G2) show the updating principle for the lowest available space (Step 4). The width of the lowest available space (v) in Figure 8(G1) is equal to 5, which is not enough to accommodate any components, so v is updated. The updating principle for the lowest available space is to raise its height to the penultimate lowest space when it’s compared to the current one. Thus, the height of the lowest available space (hv) is raised from 0 (see Figure 8(G1)) to 45 (see Figure 8(G2)). The principle can also be illustrated in Figure 8(I1) and Figure 8(I2), where the hv is raised from 45 to 115. Figure 8J shows component 2–3 placed in a temporary position before Step 5 runs. However, due to H = 250 > W = 200, component 2–3 has to be canceled. Then, another pallet to place component 2–3 is required. Figure 8K shows the last placed component in a second pallet (N1 = 2). When it is finished, all components in sequence T1 have been arranged, then the average utilization rate is calculated (U1 = 45.87%).
Stage 3: Identify the optimal layout sequence.
Stage 3 is used to identify the best precast component layout sequence. The specific approach is to compare the average utilization rates according to Stage 2 and find the optimal one with the highest utilization rate. The specific procedural steps are outlined below.
Input: Pallet size (L, W), component demand (di) and component size (li, wi).
Output: The minimal cycles of pallets N, the maximum average utilization rate U, and the best layout plan F.
Step 1: Initialize. Let F = Ø, U = 0, N = 0, k = 1.
Step 2: k = k + 1. Run sub-process, save Nk and Fk, calculate Uk.
Step 3: Compare Uk with U.
If Uk > U, then U = Uk, N = Nk, F = Fk; otherwise, keep U, N, F unchanged.
Step 4: Check if all the sequences are already arranged.
If T = Ø, then go to step 5; otherwise, go to step 2.
Step 5: Output U, N, F.
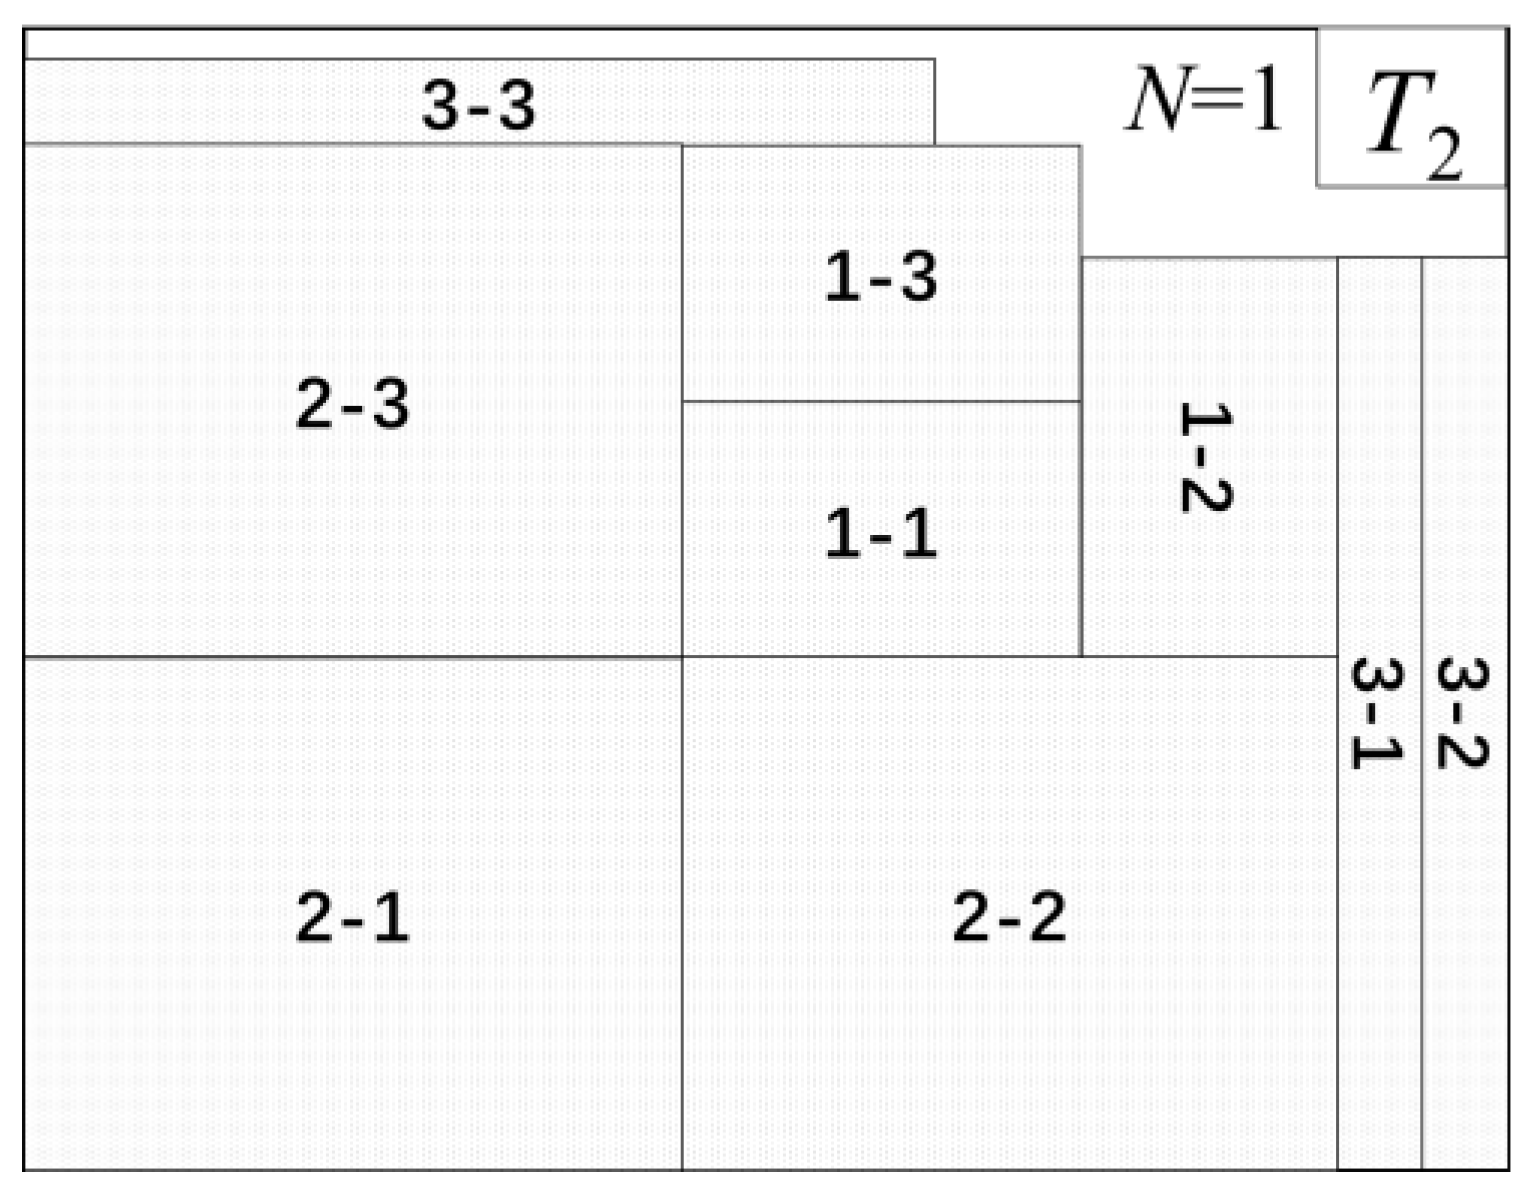
Here, Figure 9 demonstrates the layout result of the second demo sequence T2 (see Figure 7), which contains the same components as T1 does. Although T2 and T1 contain the same components, these two layout plans are different due to the different order of the components in the two sequences. In Figure 9 it can be seen that only one pallet (N2 = 1) is required and the average utilization rate is 91.73% (U2 = 91.73%). Therefore, the layout result shown in Figure 9 is significantly better than that in Figure 8. Hence, in this case, T2 is the optimal sequence according to Stage 3.
5. Case Study
As shown in Table 5, this study collected actual production data from a precast component plant (Plant A) in Chongqing, and the method described here was used successfully to solve the component pallet layout. The optimization problem presented in this paper has general applicability, such that various sizes of precast components, as well as models with different indicators may be used.
As per an order received, the plant management set a certain amount of time for the production quantity, which included eight different types of precast components, such as outer wall panels, inner wall panels and superimposed floors, etc. According to the specification of the precast production line, the length and width of the pallets were 9 m and 4 m, respectively. The curing kiln could simultaneously cure 21 pallets, the curing time required for the components is 8 h, the running cost was 600 RMB per hour, and the power of the machine is 36 kWh. In the original plan, the total number of cycles of the pallets was predicted to be 261, using the curing kiln 13 times, for a total of 104 h.
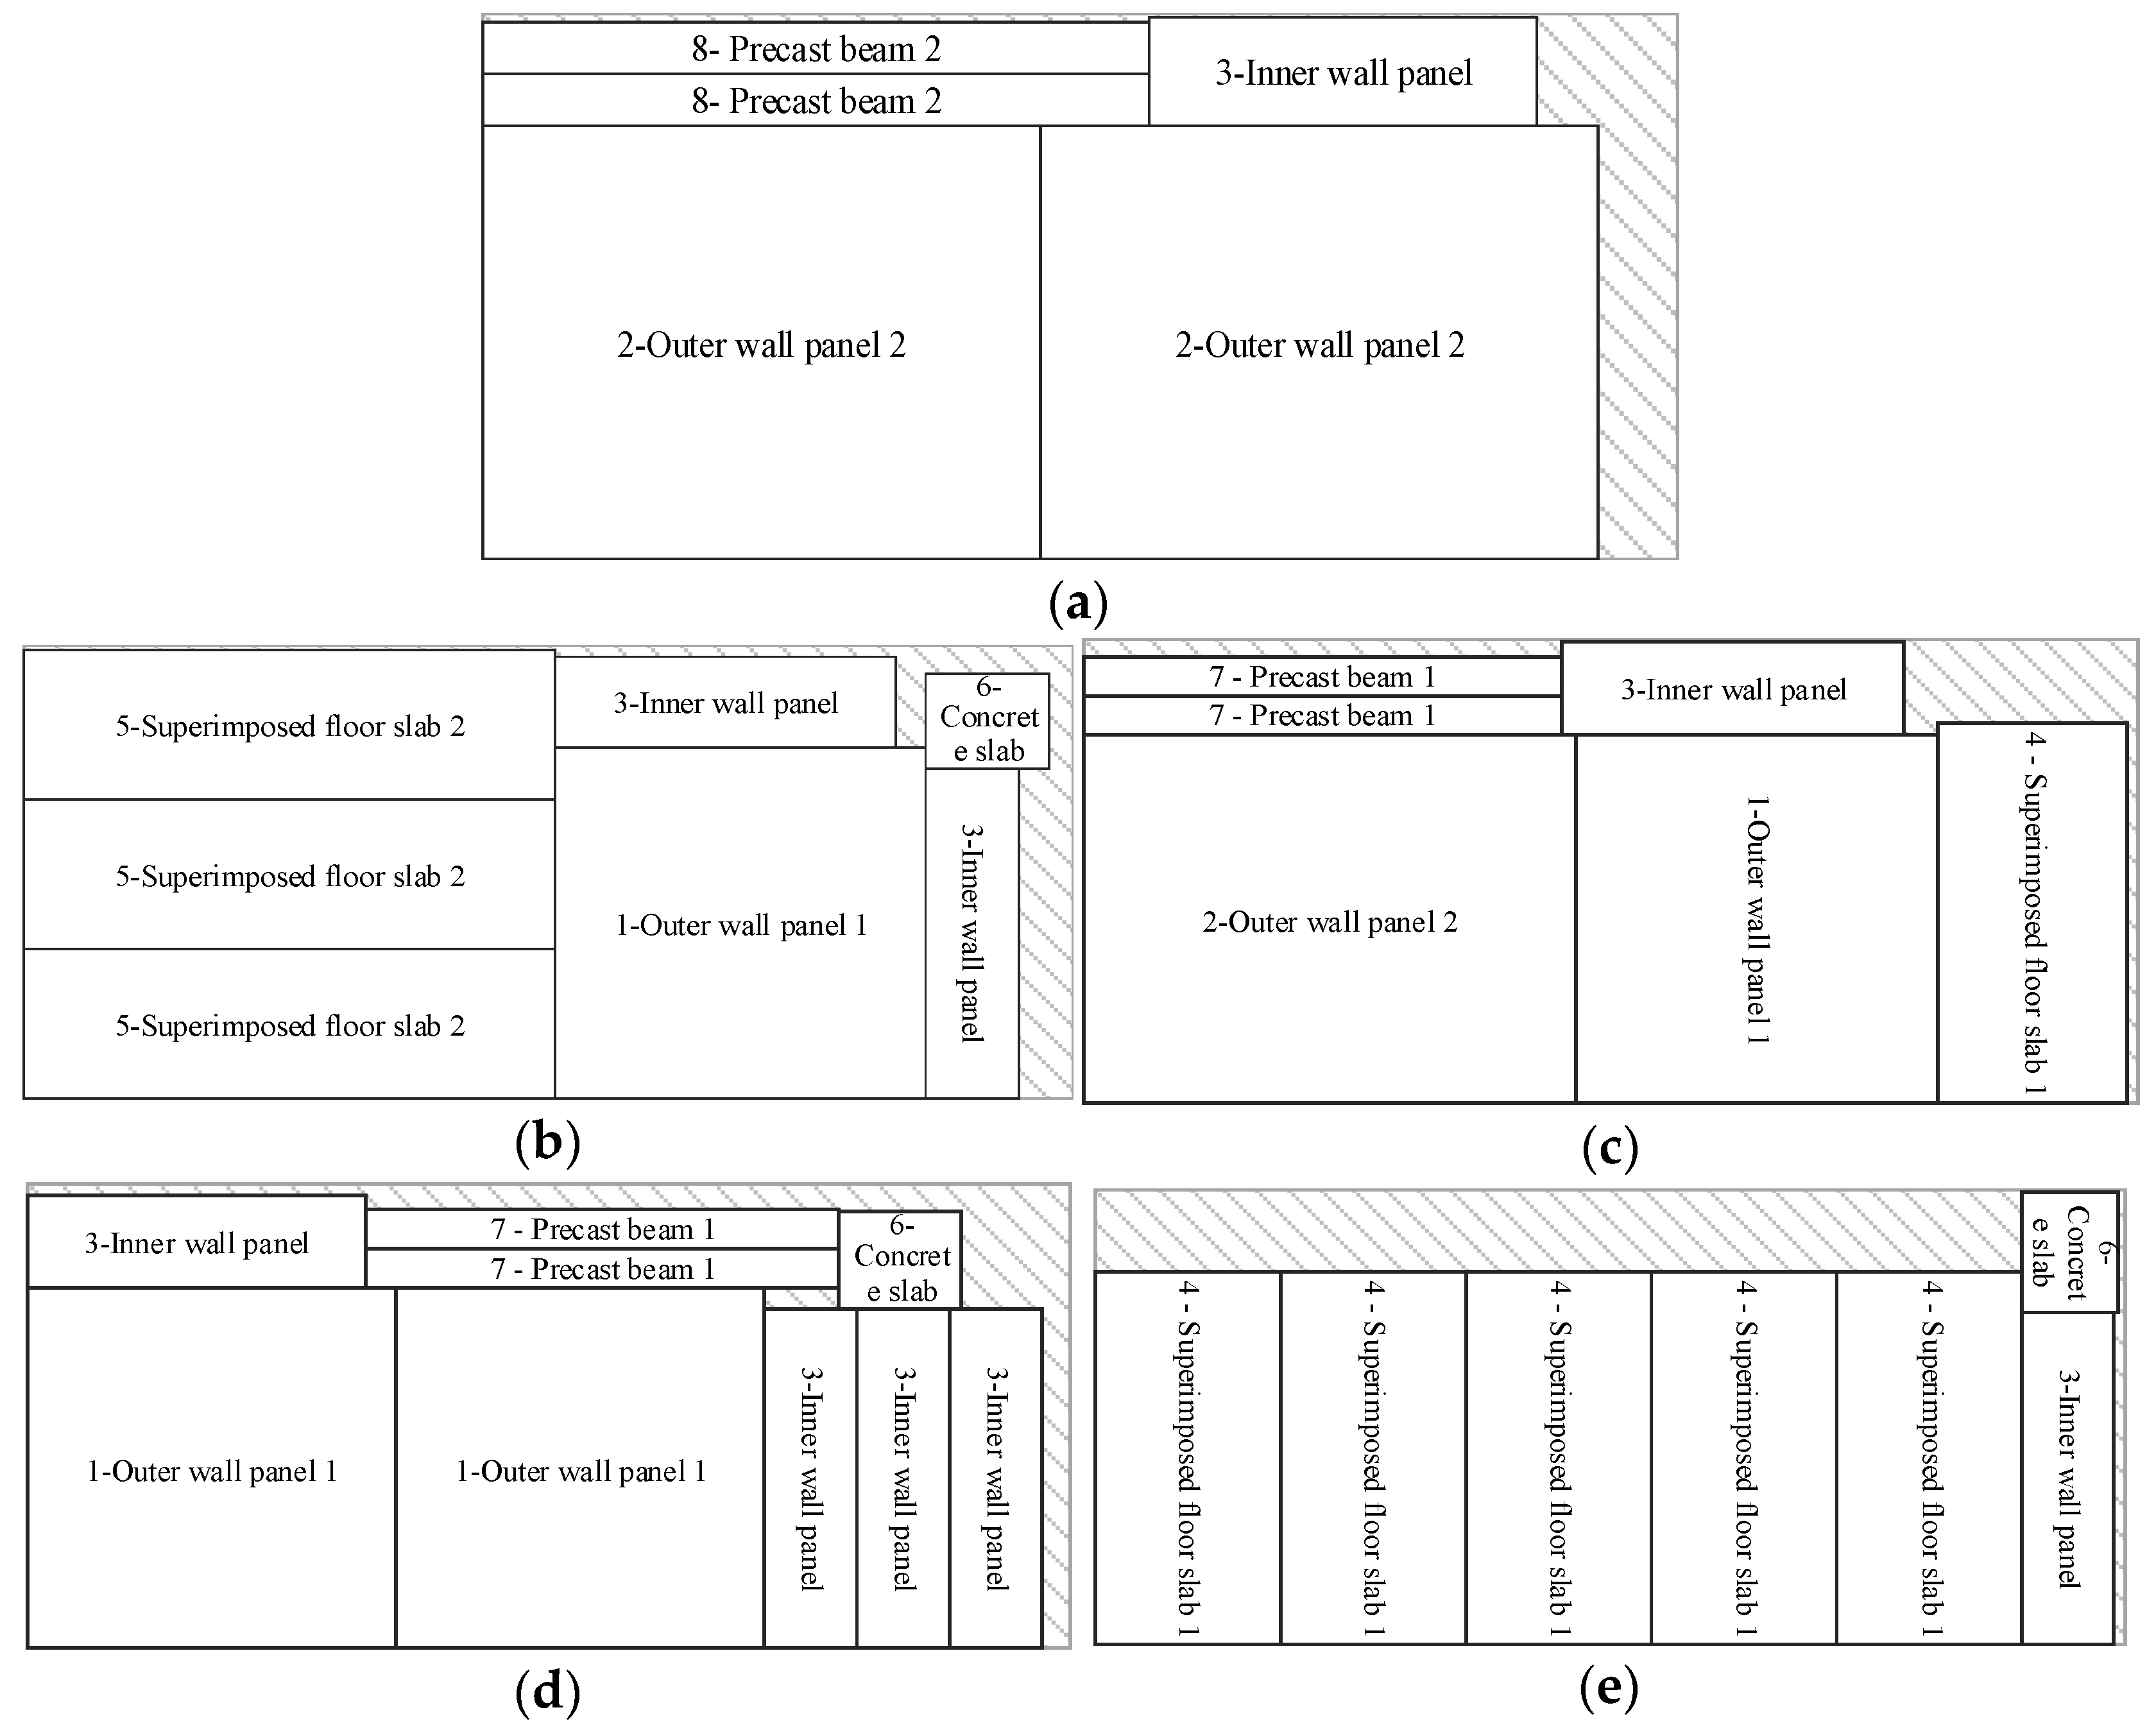
In this case, Visual C++, on a Windows 7 platform, was used for programming the heuristic algorithm. The final result showed that only 203 cycles were needed to finish the production task, and five different layout schemes were needed. Figure 10 shows the five layout patterns for the given case. Table 6 shows the number and types of components of each layout scheme. Table 7 shows the number of the pallet cycles and the utilization rate of each layout scheme. According to Table 7, the best layout plan needs five configurations, the average utilization rate is 90.6%. These five configurations reduce the original number of pallet cycles used from 261 to 203, saving 58 pallet cycles and improving efficiency and shortening manufacturing time by 22.2%. Furthermore, the improved plan only uses the curing kiln 10 times, instead of the 13 actually used, which saves (13–10) × 8 × 600 = 14,400 RMB, which represents a 23.1% curing cost saving. Additionally, the improved plan could also enhance the pallet utilization efficiency and lower the energy consumption. There would be a decrease of 3 × 36 × 8 = 864 kWh in the electricity consumption, and the water consumption could be reduced as well.
Additionally, in order to prove the reliability of the method, another six cases were tested. The data for these cases are listed in Table 8. Table 9 shows the specific layout schemes for these cases. Table 10 compares the proposed method with the original method, which reveals that the proposed method cost fewer pallet cycles to arrange all the components. All these cases show at least 20% reduction in the pallet cycles, thus, the resource consumption, production cost and time could be reduced as well.
In summary, these case studies, where experienced managers have been operating ‘Factory A’ over a number of years, utilizing their experience in combination with current best practice, show that this proposed model has genuine applicability to real-world scenarios. The proposed model provides a scientific approach to generating optimized component schedules that are relatively simple to use, while offering significant gains in production efficiency, time saving, resource consumption, and overall cost reduction.
6. Conclusions
This paper establishes a layout optimization model for scheduling precast components on pallets during the mold setting process. The objective function of this model is to maximize the average utilization of the pallets, considering the constrains inherent to the pallets (capacity/size), to the precast components (demand and size) and to the layout rules (layout methods and positional relationship of components). To the best of the authors’ knowledge, there is no other formulation in the literature for optimizing the mold layout plans of precast components production. The proposed model is solved using a heuristic algorithm. The empirical analysis illustrates that the model and the algorithm proposed in this paper are highly operable and can effectively improve the utilization rate of pallets. The approach provides strong practical benefits for component manufacturers seeking to optimize their production plans, shorten production time, and reduce production costs. In turn, the approach may be expected to enhance competitiveness in the industrial buildings sector. Furthermore, the approach brings significant environmental benefits, such as reducing the water and electricity consumption and enhancing the utilization rate of steel pallets.
However, this model has some limitations. Notably, the proposed plan requires various types of components to be loaded onto any single pallet, which may add complexity to the transport and storage of the various finished precast concrete components. Certainly, it is expected that the gains will far outweigh the costs, but that remains to be evaluated. In future studies, the cost fluctuations arising from the above-mentioned problem should be explored. Beyond that, the model should be extended to consider mold quantity constraints and time constraints related to the customers. Finally, a propriety ‘user-friendly’ software should be developed to assist factories achieve the promised efficiency gains, as well as reduce their production costs.
Author Contributions
Conceptualization, D.W.; Methodology, D.W. and G.L.; Investigation, D.W. and K.L.; Funding Acquisition, G.L., K.L. and X.T.; Software, D.W. and T.W.; Data analysis, D.W., K.L and T.W.; Writing-Original Draft Preparation, D.W. and T.W.; Writing-Review & Editing, A.S. and I.M.
Funding
This research was funded by the National Key Research and Development Program of China: Key Technologies of Inspection and Assessment of Industrialized Buildings [grant number 2016YFSF05012607], the China Postdoctoral Science Foundation [grant number 2017M620416] and the Science Foundation of Beijing [grant number 9182003].
Conflicts of Interest
The authors declare no conflict of interest.
References
- Sacks, R.; Eastman C, M.; Lee, G. Parametric 3D modeling in building construction with examples from precast concrete. Autom. Constr. 2004, 13, 291–312. [Google Scholar] [CrossRef]
- Augusto, T.; Mounir, K.; Melo, A.M. A cost optimization-based design of precast concrete floors using genetic algorithms. Autom. Constr. 2012, 22, 348–356. [Google Scholar]
- Castilho, V.C.; Lima, M.C.V. Comparative costs of the production, transport and assembly stages of prestressed precast slabs using genetic algorithms. Int. J. Optim. Civ. Eng. 2012, 2, 407–422. [Google Scholar]
- Polat, G.; Arditi, D.; Mungen, U. Simulation-based decision support system for economical supply chain management of rebar. J. Constr. Eng. Manag. 2007, 133, 29–39. [Google Scholar] [CrossRef]
- Ko, C.H. Material transshipment for precast fabrication. J. Civ. Eng. Manag. 2013, 19, 335–347. [Google Scholar] [CrossRef]
- Ergen, E.; Akinci, B.; Sacks, R. Tracking and locating components in a precast storage yard utilizing radio frequency identification technology and GPS. Autom. Constr. 2007, 16, 354–367. [Google Scholar] [CrossRef]
- Yin, S.Y.; Tserng, H.P.; Wang, J.C.; Tsai, S.C. Developing a precast production management system using RFID technology. Autom. Constr. 2009, 18, 677–691. [Google Scholar] [CrossRef]
- Ko, C.H. An integrated framework for reducing precast fabrication inventory. J. Civ. Eng. Manag. 2010, 16, 418–427. [Google Scholar] [CrossRef]
- Demiralp, G.; Guven, G.; Ergen, E. Analyzing the benefits of RFID technology for cost sharing in construction supply chains: A case study on prefabricated precast components. Autom. Constr. 2012, 24, 120–129. [Google Scholar] [CrossRef]
- De Castilho, V.C.; El Debs, M.K.; do Carmo Nicoletti, M. Using a modified genetic algorithm to minimize the production costs for slabs of precast prestressed concrete joists. Eng. Appl. Artif. Intell. 2007, 20, 519–530. [Google Scholar] [CrossRef]
- Anvari, B.; Angeloudis, P.; Ochieng, W.Y. A multi-objective GA-based optimisation for holistic Manufacturing, transportation and Assembly of precast construction. Autom. Constr. 2016, 71, 226–241. [Google Scholar] [CrossRef]
- Chan, W.T.; Hu, H. Production scheduling for precast plants using a flow shop sequencing model. J. Comput. Civ. Eng. 2002, 16, 165–174. [Google Scholar] [CrossRef]
- Dawood, N.N. Scheduling in the precast concrete industry using the simulation modelling approach. Build. Environ. 1995, 30, 197–207. [Google Scholar] [CrossRef]
- Ko, C.H.; Wang, S.F. Precast production scheduling using multi-objective genetic algorithms. Expert Syst. Appl. 2011, 38, 8293–8302. [Google Scholar] [CrossRef]
- Benjaoran, V.; Dawood, N.; Hobbs, B. Flowshop scheduling model for bespoke precast concrete production planning. Constr. Manag. Econ. 2005, 23, 93–105. [Google Scholar] [CrossRef]
- Tharmmaphornphilas, W.; Sareinpithak, N. Formula selection and scheduling for precast concrete production. Int. J. Prod. Res. 2013, 51, 5195–5209. [Google Scholar] [CrossRef]
- Hong, W.K.; Lee, G.; Lee, S.; Kim, S. Algorithms for in-situ production layout of composite precast concrete members. Autom. Constr. 2014, 41, 50–59. [Google Scholar] [CrossRef]
- Prata, B.D.A.; Pitombeira-Neto, A.R.; de Moraes Sales, C.J. An integer linear programming model for the multiperiod production planning of precast concrete beams. J. Constr. Eng. Manag. 2015, 141, 04015029. [Google Scholar] [CrossRef]
- Yang, Z.; Ma, Z.; Wu, S. Optimized flowshop scheduling of multiple production lines for precast production. Autom. Constr. 2016, 72, 321–329. [Google Scholar] [CrossRef]
- Warszawski, A. Industrialization and Robotics in Building: A Managerial Approach; Harper Row: New York, NY, USA, 1990. [Google Scholar]
- Chen, J.H.; Yang, L.R.; Tai, H.W. Process reengineering and improvement for building precast production. Autom. Constr. 2016, 68, 249–258. [Google Scholar] [CrossRef]
Figure 1.
An example of a typical precast production layout, showing sources of wastage.

Figure 2.
Various components to be loaded onto pallets, demonstrating the problem of how best to arrange the elements.
Figure 2.
Various components to be loaded onto pallets, demonstrating the problem of how best to arrange the elements.

Figure 3.
An example of two kinds of arrangements for precast components.

Figure 4.
The four non-overlap situations.

Figure 5.
Flow chart of the heuristic algorithm.

Figure 6.
An example to illustrate the capability of the remaining positions.

Figure 7.
The size and order of components in T1 and T2.

Figure 8.
A layout example that demonstrates the running steps of stage two.

Figure 9.
The layout result of T2.

Figure 10.
The five layout patterns. (a) Scheme 1; (b) Scheme 2; (c) Scheme 3; (d) Scheme 4; (e) Scheme 5.
Figure 10.
The five layout patterns. (a) Scheme 1; (b) Scheme 2; (c) Scheme 3; (d) Scheme 4; (e) Scheme 5.


Table 1.
The notions used in the model.
| N | the number of pallet cycles |
| L | the length of pallet |
| W | the width of pallet |
| i | the type of components |
| j | the jth layout of precast production on the pallet |
| di | the demand of component type i |
| xj | the number of the jth layout |
| aij | the number of the ith component used in the jth layout |
| lp,lq | the length of component P and Q |
| wp,wq | the width of the component P and Q |
| (xp,yp),(xq,yq) | the lower-left coordinates of the component P and Q |
P and Q are two arbitrary components on a pallet.
Table 2.
Constraints of layouts.
| Horizontal Constraint | Vertical Constraint | |||
|---|---|---|---|---|
| Placement conditions | horizontal (r = 0) | perpendicular (r = 1) | horizontal (r = 0) | perpendicular (r = 1) |
| Coordinate constraints | ||||
| Results | ||||
Table 3.
Constraint conditions for non-overlaps.
| P is to the Left of Q | P is to the Right of Q | P is Above Q | P is Below Q | |||||
|---|---|---|---|---|---|---|---|---|
| Illustration | Figure 4a | Figure 4b | Figure 4c | Figure 4d | ||||
| Placement conditions | r = 0 | r = 1 | r = 0 | r = 1 | r = 0 | r = 1 | r = 0 | r = 1 |
| Coordinate constraint | ||||||||
| Results | ||||||||
Table 4.
The notions used in the heuristic algorithm.
| T | The sequence set of precast components to be arranged. , where Tk is the kth sequence consisting of Z1 to Zi |
| Zi | The sequence of a ith type of component. , where zi is a matrix that contains the size information of ith component, and di is the demand |
| v | The width of the lowest available space |
| hv | The height of the lowest available space |
| Uk | The utilization rate of the layout patterns according to kth sequence |
| Nk | The number of pallet cycles according to kth sequence |
| Fk | The the kth layout plan |
| H | The component layout height |
Table 5.
Case study of ‘Plant A’. Size and demand of precast elements according to their types.
| Type | Components | Length (cm) | Width (cm) | Demand |
|---|---|---|---|---|
| 1 | Outer wall panel 1 | 318 | 310 | 150 |
| 2 | Outer wall panel 2 | 318 | 420 | 126 |
| 3 | Inner wall panel | 292 | 80 | 339 |
| 4 | Superimposed floor slab 1 | 328 | 162 | 220 |
| 5 | Superimposed floor slab 2 | 456 | 132 | 174 |
| 6 | Concrete slab | 106 | 84 | 120 |
| 7 | Precast beam 1 | 408 | 34 | 132 |
| 8 | Precast beam 2 | 502 | 38 | 86 |
Table 6.
The five layout schemes of precast production.
| Scheme 1 | Scheme 2 | Scheme 3 | Scheme 4 | Scheme 5 | |
|---|---|---|---|---|---|
| 1—Outer wall panel 1 | 1 | 1 | 2 | ||
| 2—Outer wall panel 2 | 2 | 1 | |||
| 3—Inner wall panel | 1 | 2 | 1 | 4 | 1 |
| 4—Superimposed floor slab 1 | 1 | 5 | |||
| 5—Superimposed floor slab 2 | 3 | ||||
| 6—Concrete slab | 1 | 1 | 1 | ||
| 7—Precast beam 1 | 2 | 2 | |||
| 8—Precast beam 2 | 2 |
Table 7.
Utilization analysis of various layout schemes.
| Layout Schemes | The Number of Schemes | Pallet Area (m2) | The Area Used (m2) | Utilization |
|---|---|---|---|---|
| Scheme 1 | 43 | 36 | 32.86 | 91.3% |
| Scheme 2 | 58 | 36 | 33.48 | 93.4% |
| Scheme 3 | 40 | 36 | 32.64 | 90.6% |
| Scheme 4 | 26 | 36 | 32.72 | 90.9% |
| Scheme 5 | 36 | 36 | 29.79 | 82.8% |
Table 8.
The data for another six cases study of ‘Plant A’.
| Component Type | Case 1 | Case 2 | Case 3 | Case 4 | Case 5 | Case 6 | ||||||
|---|---|---|---|---|---|---|---|---|---|---|---|---|
| Size | Demand | Size | Demand | Size | Demand | Size | Demand | Size | Demand | Size | Demand | |
| 1 | (428,350) | 150 | (326,435) | 124 | (450,345) | 86 | (410,370) | 124 | (320,310) | 302 | (325,445) | 164 |
| 2 | (475,360) | 114 | (326,316) | 128 | (425,310) | 90 | (344,325) | 72 | (292,80) | 180 | (325,360) | 118 |
| 3 | (360,320) | 180 | (326,420) | 124 | (344,385) | 126 | (344,385) | 242 | (328,162) | 143 | (325,380) | 82 |
| 4 | (96,84) | 246 | (106,86) | 315 | (114,100) | 320 | (106,85) | 316 | (448,132) | 534 | (448,38) | 102 |
| 5 | (110,90) | 306 | (115,100) | 174 | (100,80) | 160 | (95,80) | 231 | (136,106) | 232 | (398,34) | 313 |
| 6 | (425,36) | 204 | (355,34) | 169 | (355,32) | 162 | (375,36) | 169 | (440,36) | 136 | (440,36) | 157 |
| 7 | (480,40) | 153 | (320,32) | 241 | (380,34) | 103 | (420,40) | 296 | (390,42) | 276 | (376,36) | 217 |
| 8 | (420,36) | 210 | (415,38) | 184 | (94,75) | 428 | (530,40) | 127 | ||||
| 9 | (338,300) | 117 | (110,90) | 215 | ||||||||
| 10 | (338,364) | 80 | (106,78) | 105 | ||||||||
Table 9.
The layout schemes of the six cases.
| Component Type | Case 1 | Case 2 | Case 3 | ||||||||||||||||
| Scheme 1 | Scheme 2 | Scheme 3 | Scheme 4 | Scheme 1 | Scheme 2 | Scheme 3 | Scheme 4 | Scheme 5 | Scheme 6 | Scheme 7 | Scheme 1 | Scheme 2 | Scheme 3 | Scheme 4 | Scheme 5 | Scheme 6 | Scheme 7 | Scheme 8 | |
| 1 | 2 | 1 | 1 | 1 | 1 | 1 | 2 | ||||||||||||
| 2 | 1 | 1 | 2 | 2 | 2 | 2 | 2 | ||||||||||||
| 3 | 1 | 1 | 2 | 1 | 1 | 1 | 1 | 1 | 2 | 2 | |||||||||
| 4 | 4 | 6 | 8 | 4 | 4 | ||||||||||||||
| 5 | 3 | 6 | 4 | ||||||||||||||||
| 6 | 2 | 2 | 4 | 3 | 1 | 6 | |||||||||||||
| 7 | 1 | 1 | 2 | 1 | 1 | 1 | 2 | 5 | 3 | 5 | |||||||||
| 8 | 4 | 2 | 2 | 4 | 2 | ||||||||||||||
| 9 | 3 | ||||||||||||||||||
| 10 | 2 | ||||||||||||||||||
| Number of schemes | 102 | 12 | 75 | 33 | 52 | 1 | 41 | 1 | 29 | 29 | 35 | 43 | 24 | 1 | 20 | 23 | 40 | 40 | 39 |
| Utilization | 96.3% | 93.8% | 88.6% | 88.1% | 97.1% | 95.4% | 93.7% | 93.2% | 91.6% | 76.4% | 77.5% | 95.0% | 93.9% | 92.7% | 91.1% | 92.5% | 95.1% | 81.0% | 84.5% |
| Average utilization | 92.3% | 88.6% | 90.1% | ||||||||||||||||
| Component Type | Case 4 | Case 5 | Case 6 | ||||||||||||||||
| Scheme 1 | Scheme 2 | Scheme 3 | Scheme 4 | Scheme 5 | Scheme 1 | Scheme 2 | Scheme 3 | Scheme 4 | Scheme 5 | Scheme 6 | Scheme 1 | Scheme 2 | Scheme 3 | Scheme 4 | Scheme 5 | Scheme 6 | Scheme 7 | Scheme 8 | |
| 1 | 2 | 2 | 2 | 2 | 2 | 2 | 2 | ||||||||||||
| 2 | 2 | 5 | 1 | 2 | 2 | 2 | |||||||||||||
| 3 | 2 | 2 | 2 | 1 | 5 | 2 | 2 | ||||||||||||
| 4 | 4 | 6 | 2 | 2 | |||||||||||||||
| 5 | 7 | 2 | 4 | 3 | 7 | 2 | 2 | 2 | |||||||||||
| 6 | 2 | 5 | 4 | 4 | 4 | 1 | |||||||||||||
| 7 | 2 | 2 | 2 | 4 | 2 | 7 | |||||||||||||
| 8 | 2 | 6 | 9 | 1 | |||||||||||||||
| 9 | 5 | 7 | |||||||||||||||||
| 10 | 5 | ||||||||||||||||||
| Number of schemes | 62 | 79 | 9 | 33 | 36 | 36 | 40 | 58 | 89 | 17 | 17 | 25 | 57 | 31 | 10 | 14 | 1 | 30 | 21 |
| Utilization | 91.8% | 92.9% | 92.3% | 97.7% | 71.4% | 95.6% | 93.2% | 90.7% | 98.6% | 72.7% | 91.4% | 97.9% | 96.0% | 94.9% | 94.9% | 93.0% | 92.2% | 93.7% | 93.5% |
| Average utilization | 89.8% | 93.4% | 94.4% | ||||||||||||||||
Table 10.
Comparison between the proposed method and the original method.
| Case | The Number of Pallet Cycles | The Number of Curing Kiln Used | |||||||
|---|---|---|---|---|---|---|---|---|---|
| Original Method | Proposed Method | Saved Quantity | Saved Time (%) | Original Method | Proposed Method | Saved Quantity | Saved Money (RMB) | Saved Ratio (%) | |
| 1 | 341 | 257 | 84 | 24.6% | 17 | 13 | 4 | 19200 | 23.5% |
| 2 | 251 | 189 | 62 | 24.7% | 12 | 10 | 2 | 9600 | 16.7% |
| 3 | 282 | 222 | 60 | 21.3% | 14 | 11 | 3 | 14400 | 21.4% |
| 4 | 235 | 188 | 47 | 20.0% | 12 | 9 | 3 | 14400 | 25.0% |
| 5 | 274 | 219 | 55 | 20.1% | 14 | 11 | 3 | 14400 | 21.4% |
| 6 | 294 | 230 | 64 | 21.8% | 15 | 11 | 4 | 19200 | 26.7% |
© 2018 by the authors. Licensee MDPI, Basel, Switzerland. This article is an open access article distributed under the terms and conditions of the Creative Commons Attribution (CC BY) license (http://creativecommons.org/licenses/by/4.0/).
Share and Cite
MDPI and ACS Style
Wang, D.; Liu, G.; Li, K.; Wang, T.; Shrestha, A.; Martek, I.; Tao, X. Layout Optimization Model for the Production Planning of Precast Concrete Building Components. Sustainability 2018, 10, 1807. https://doi.org/10.3390/su10061807
AMA Style
Wang D, Liu G, Li K, Wang T, Shrestha A, Martek I, Tao X. Layout Optimization Model for the Production Planning of Precast Concrete Building Components. Sustainability. 2018; 10(6):1807. https://doi.org/10.3390/su10061807
Chicago/Turabian StyleWang, Dong, Guiwen Liu, Kaijian Li, Tongjing Wang, Asheem Shrestha, Igor Martek, and Xiaobo Tao. 2018. "Layout Optimization Model for the Production Planning of Precast Concrete Building Components" Sustainability 10, no. 6: 1807. https://doi.org/10.3390/su10061807
Note that from the first issue of 2016, this journal uses article numbers instead of page numbers. See further details here.