1. Introduction
Athletic apparel is a core piece of equipment when exercising, as it has the most direct contact with the body and can influence how we feel and perform. Many athletic garments have a surface treatment or fiber construction that can influence the movement of sweat away from the body and also influence comfort levels.
There is significant work on the effect of moving sweat and temperature away from the body during active periods [
1,
2], but there is minimal knowledge in the cool-down, or transitional stages post-exercise concerning comfort levels of garments. These phases of activity need to be studied because active wear has become an almost standard alternative to other forms of everyday fashion and technology, with design cues from an athletic apparel now being found in more traditional clothing [
3]. This study while looking at aspects to do with comfort, the construction, fibre selection and surface treatments have a technology or engineering parameters that are quantified. However, a consumer does not have the equipment to test the fibre, fabric or surface treatment performance. The consumer will compare qualitatively between what they know (their self-selected garment) and what they perceive in the new control garment and make a direct comparison between the two.
Thus, the need to understand performance post exercise and how the consumer responds to the garment takes two lines of questioning:
First, the qualitative performance of the garment, i.e., how the consumer responds based on their feelings and level of exertion;
Second, a quantitative performance of the consumer, using sensor-based measurements.
Ultimately, we are trying to answer three questions within this study concerning athletic apparel and transitional comfort:
Does user-perception of temperature during physical exertion correlate with objective physiological data;
Is there a relationship between perceived exertion, temperature and sweat and comfort;
Finally, does the perceived and measured performance of the garment affect the user experience?
2. Materials and Methods
Eleven female participants (height 167.9 cm ± 6.7 cm; weight 60.1 kg ± 5.6 kg and age 28 years ± 2.9 years) were recruited for this study. Participants were eligible if they were female, aged between 23–36 years, exercising three to four times per week and free from injury. Deakin University Human Research Ethics Committee approved all tests and procedures, and written consent obtained from all participants before commencing testing.
Each participant attended the Biomechanics Lab at Deakin University on at least two occasions. Their first session involved testing with their garment of preference; the second trial was the same except they wore the control.
Table 1 summarizes participants and control garments.
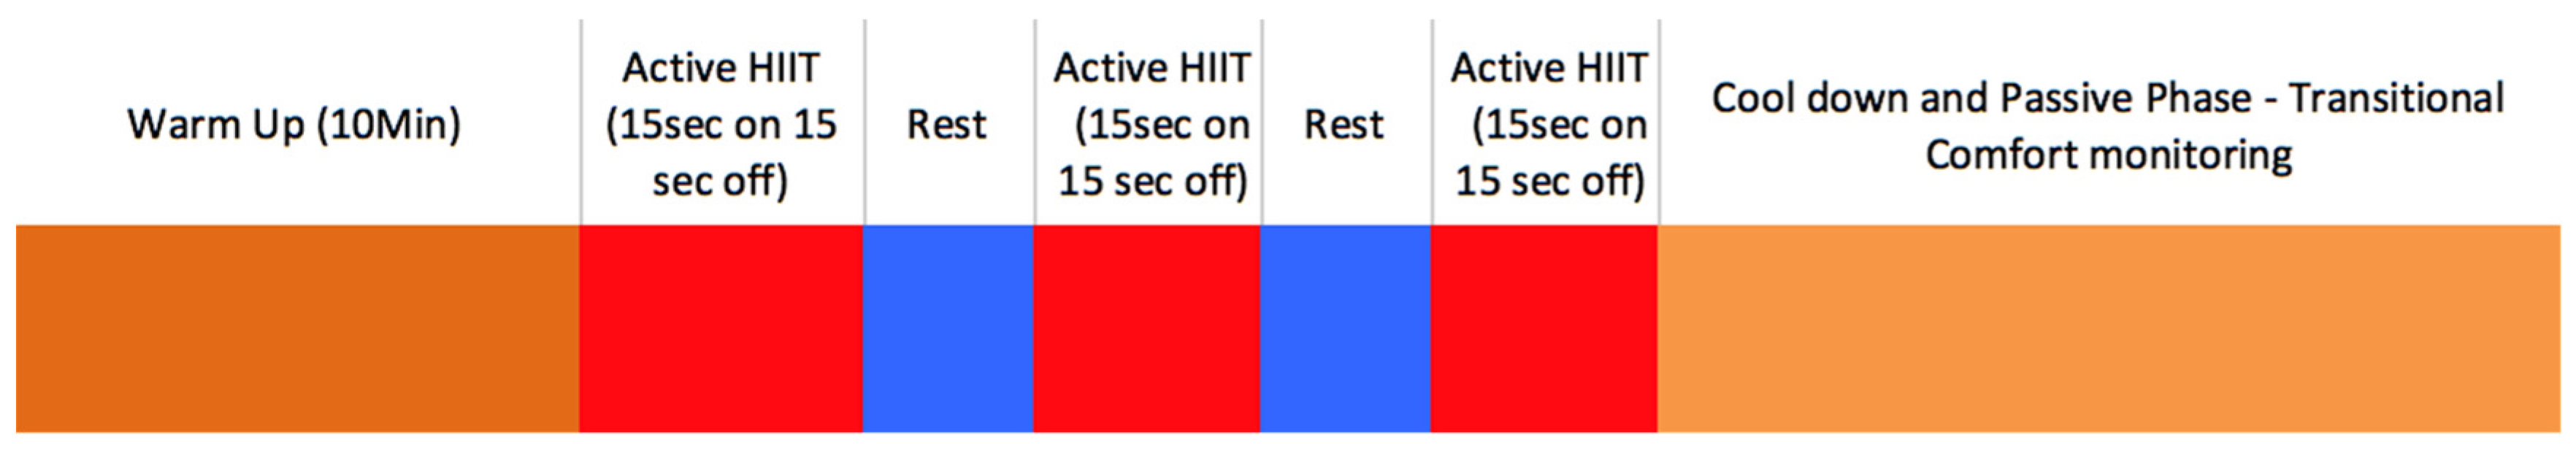
Each testing session comprised a warm-up (10 min), a High-Intensity Interval (HIIT) protocol (20 min), a passive transition period (20 min), and a set of questions, which the participants were required to answer at specific stages of the session. The warm-up performed at a self-selected progressive speed until their perceived maximum effort. Once in the active phase, a 10% increase in treadmill speed was applied to ensure participants reached RPE of above 17.
The HIIT protocol [
4,
5] consisted of three five-minute blocks, which were separated by 2.5 min rest. Each five-minute block was broken down into 15 s of running followed by 15 s of rest (
Figure 1).
Across the session, the participants answered series of questions regarding thermal and garment comfort. Two types of questionnaires conducted, the first set focused on the participant’s perception of temperature and humidity and was asked every 2 min 30 s during the HIIT activity phase. The second focused on garment comfort with a range of perceptible garment qualities asked at 5 min intervals during the active phase and for 20 min after the exercise period. (
Appendix A).
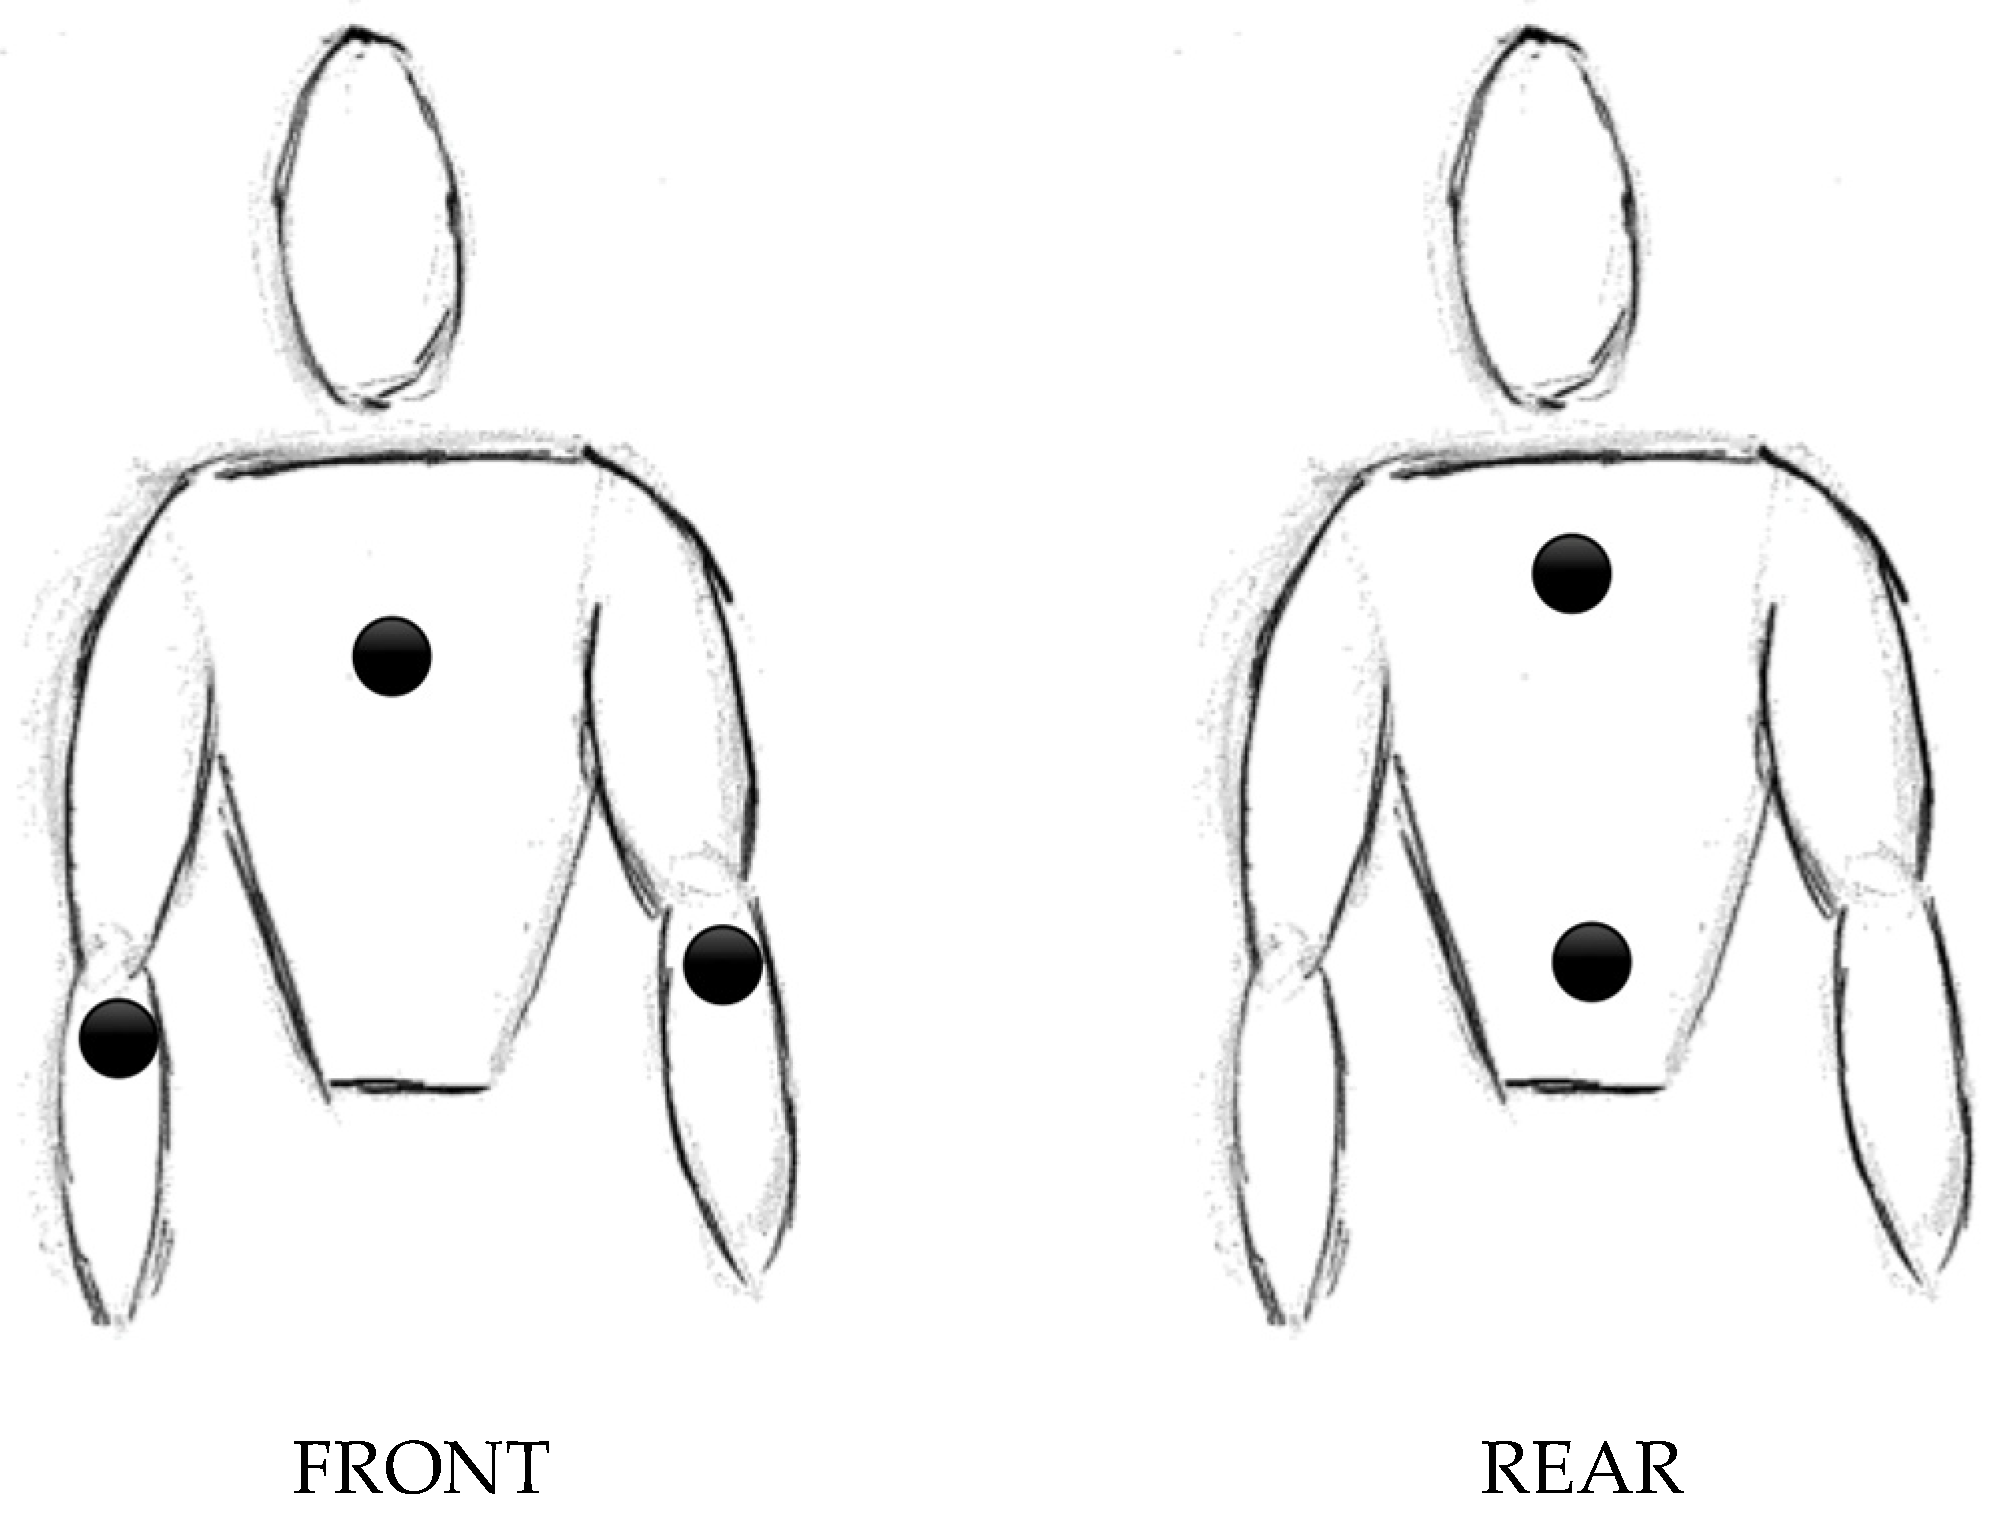
The weight of participants measured before testing, after the completion of the HIIT protocol and at the conclusion of the 20 min of passive rest. External skin temperature was measured using 5 TC Thermacon temperature and data logging systems (Thermacon, Baulkham Hills, Australia). These were placed centrally on both the forearm in a supinated position, one on the body of the sternum, two on the spine placed on the vertebrae T1 and L7. The position of the forearms was chosen as a control measure as for all participants this area would always be uncovered. (
Figure 2). Heart rate was monitored using a T31 Transmitter Polar Heart Rate Monitor. Sweat rate and skin temperature were also measured using an Equivital monitoring system, worn atop the heart rate strap and Thermacon thermistor, but below the bra and outer garments. Participants completed the testing protocol two or three times depending on randomization of the test sequence and completed running in two garment conditions. Initial testing completed wearing a garment provided by participants, and the materials and style recorded. In the second trial, participants were given a garment to complete the above-described testing protocol. All labels and identifying tags from the provided garment were removed to limit the participant’s preconceptions.
3. Results
Only three qualitative questions from the protocol yielded any statistically significant differences, and the quantitative data showed no statistical variation in garments.
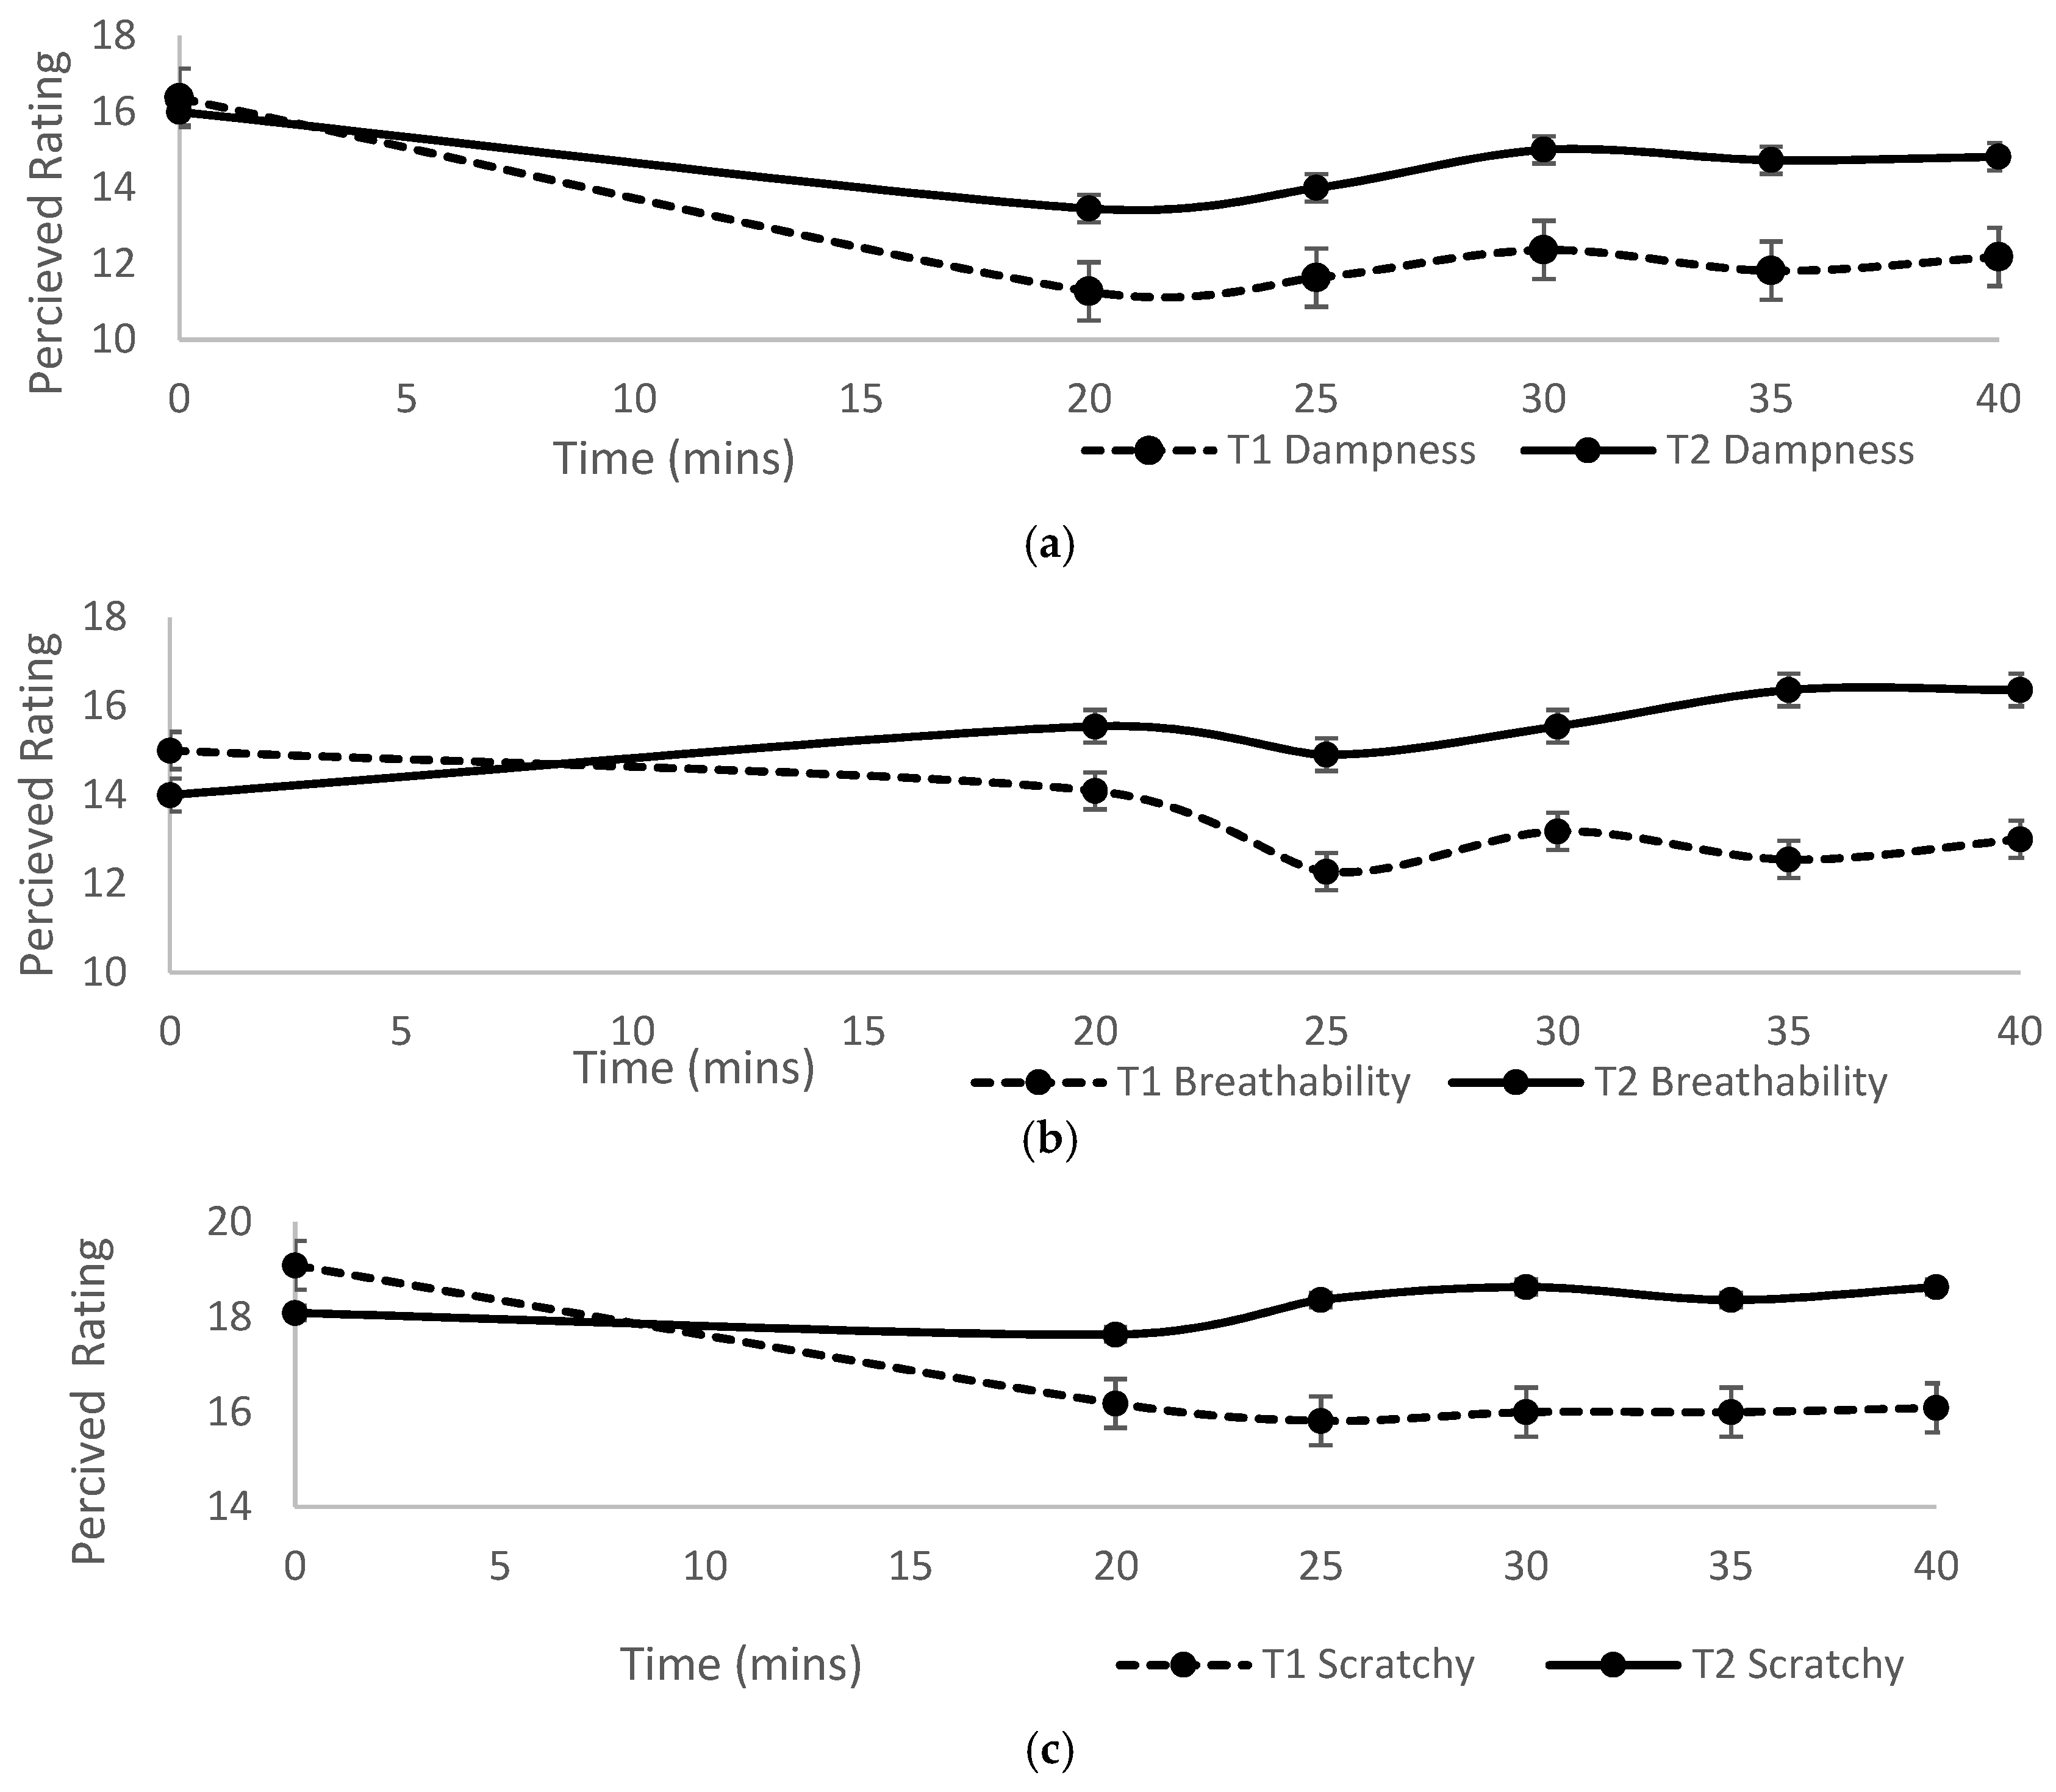
Figure 3a–c outlines the averaged ratings that each participant gave while in the HIIT activity as well as the passive (cool down) phase; for reference, the passive phase starts at 22 min and 30 s. In
Figure 3a there is no crossover in responses that is evident with the
Figure 3b,c. The results indicate that during high-intensity exercise in temperate conditions that it makes little difference in the composition and style of the garment concerning questions of breathability and itchiness of the garment.
Further data analysis between the differences of participants wearing a tank top as opposed to a short sleeve t-shirt. Both qualitative and quantitative results show there are no statistically significant differences between the two garments in both the active and passive phases of the study. One participant wore the “swiftly” tech top for both trials (self-selected and provided), their responses and physiological data is near identical for both sessions.
4. Discussion
While there was limited significant difference across all of the subjective questions and quantitative data, there are some interesting insights in looking at the active phase of the exercise and that of the cooldown or transitional phase in comfort levels of clothing. For example several of the self-selected garments were constructed of natural fibers; there is previous research to suggest that natural fibers should elicit [
6] a higher response concerning the question around itchiness and also the uptake of moisture in the natural fiber based garments will limit the breathability. The movement of moisture in a garment is supported by the data collected,
Figure 3b,c both show that in the passive phase the provided garment was both more breathable and softer in the minds of the participants. A hypothesis is that if the passive phase increased in duration, i.e., 60–80 min we might continue to see a divergence of the responses.
The participant’s responses to how damp/sweaty do you feel showed that the provided garment felt “dryer” or “less damp” at all instances in the active and passive phases. This feeling or sensation could be due to several reasons such as many of the self-selected garment were constructed of natural fibers or that any textile surface treatment that may have been present in the “new” condition degraded through age and cleaning.
Coming back to the original aims of the study was to explore the post-exercise comfort of athletic apparel in transitional or post-exercise phases: Does user perception of temperature correlate to physiological data; Is there a relationship between temperature, sweat and exertion and does the performance of the garment affect user experience. Concerning the three objectives, the results show that there was limited perceived difference of temperature to the physiological data, and it was determined not to be statistically significant. There were no statistically significant differences between the rate of exertion and the relationship to temperature and sweat during the active phase however in the passive phase some differences were emerging. Lastly, there is a relationship between the user experience and the measured performance especially in the passive/transitional phase, and for the damp/sweaty feeling, this was evident throughout the whole trial.
5. Conclusions
In this study, it seems that while performing the high-intensity activity the quality of the garment made little difference on performance and that only in the cooldown or transitional phase were participants able to distinguish features of garment performance against the body. Measured data of heart rate and skin temperature showed no statistically significant differences between the self-selected and the provided garment. The trials conducted at a nominal temp of 18 degrees Celsius with constant humidity; further work would be to perform the same experiment at elevated temperature and humidity to further elicit physiological responses through higher levels of body stress. The conclusion from this study is that during high-intensity exercise garment construction and fiber type is not a dominant feature for the participant. However, when transitioning into post high-intensity sessions, comfort can be determined by the participant. The critical insight from this study gives an opportunity for garment designers to develop solution/s to optimize the transitional or post-exercise phase to increase comfort, which traditionally has been not an area of concern.


