Investigation of Crystallization and Salt Formation of Poorly Water-Soluble Telmisartan for Enhanced Solubility

 ,
,
Abstract
:1. Introduction
2. Experimental
2.1. Materials
2.2. Methods
2.2.1. Preparation of Powdered Mixtures of TEL
Preparation without Heat (Method I)
Preparation with Heat (Method II)
Salt Formation (Method III)
2.2.2. Solubility Determination
2.2.3. Stability Study
2.2.4. DSC Study
2.2.5. PXRD Study
2.2.6. FTIR Study
2.2.7. SEM Analysis
2.2.8. 1H-NMR Analysis
2.2.9. LC–MS Analysis
2.2.10. HPLC Analysis of TEL and Its Related Products
3. Results and Discussion
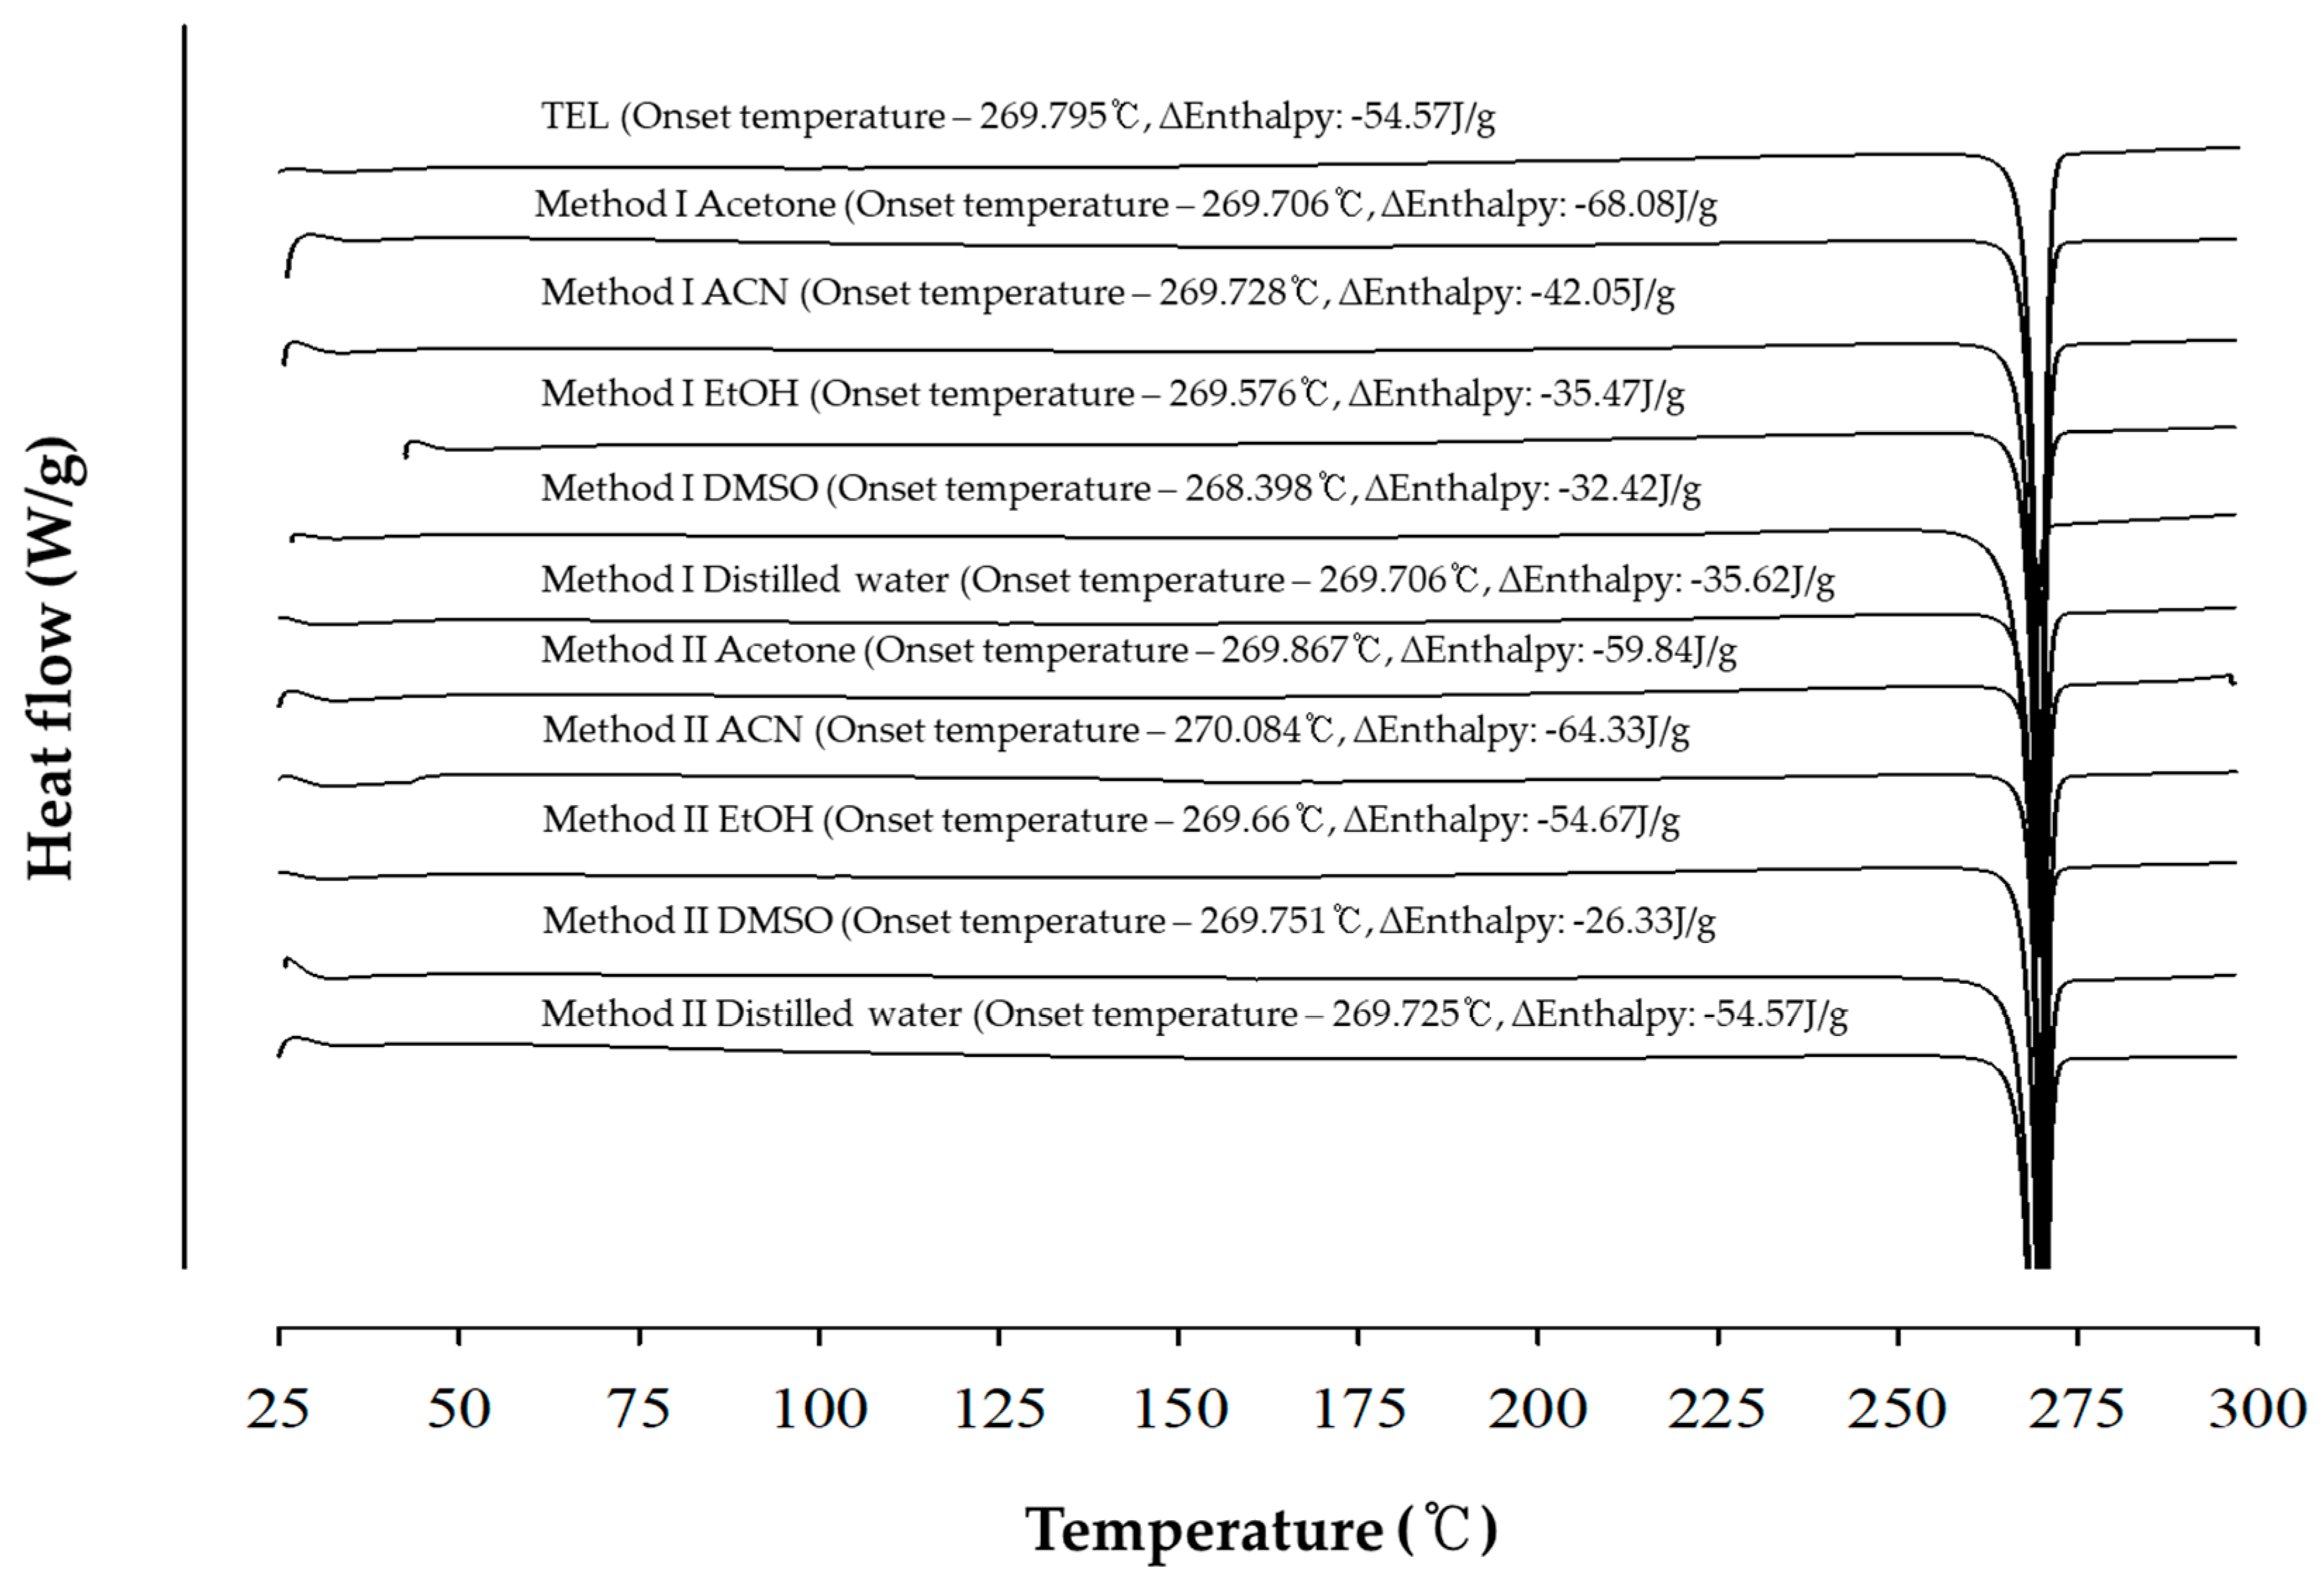
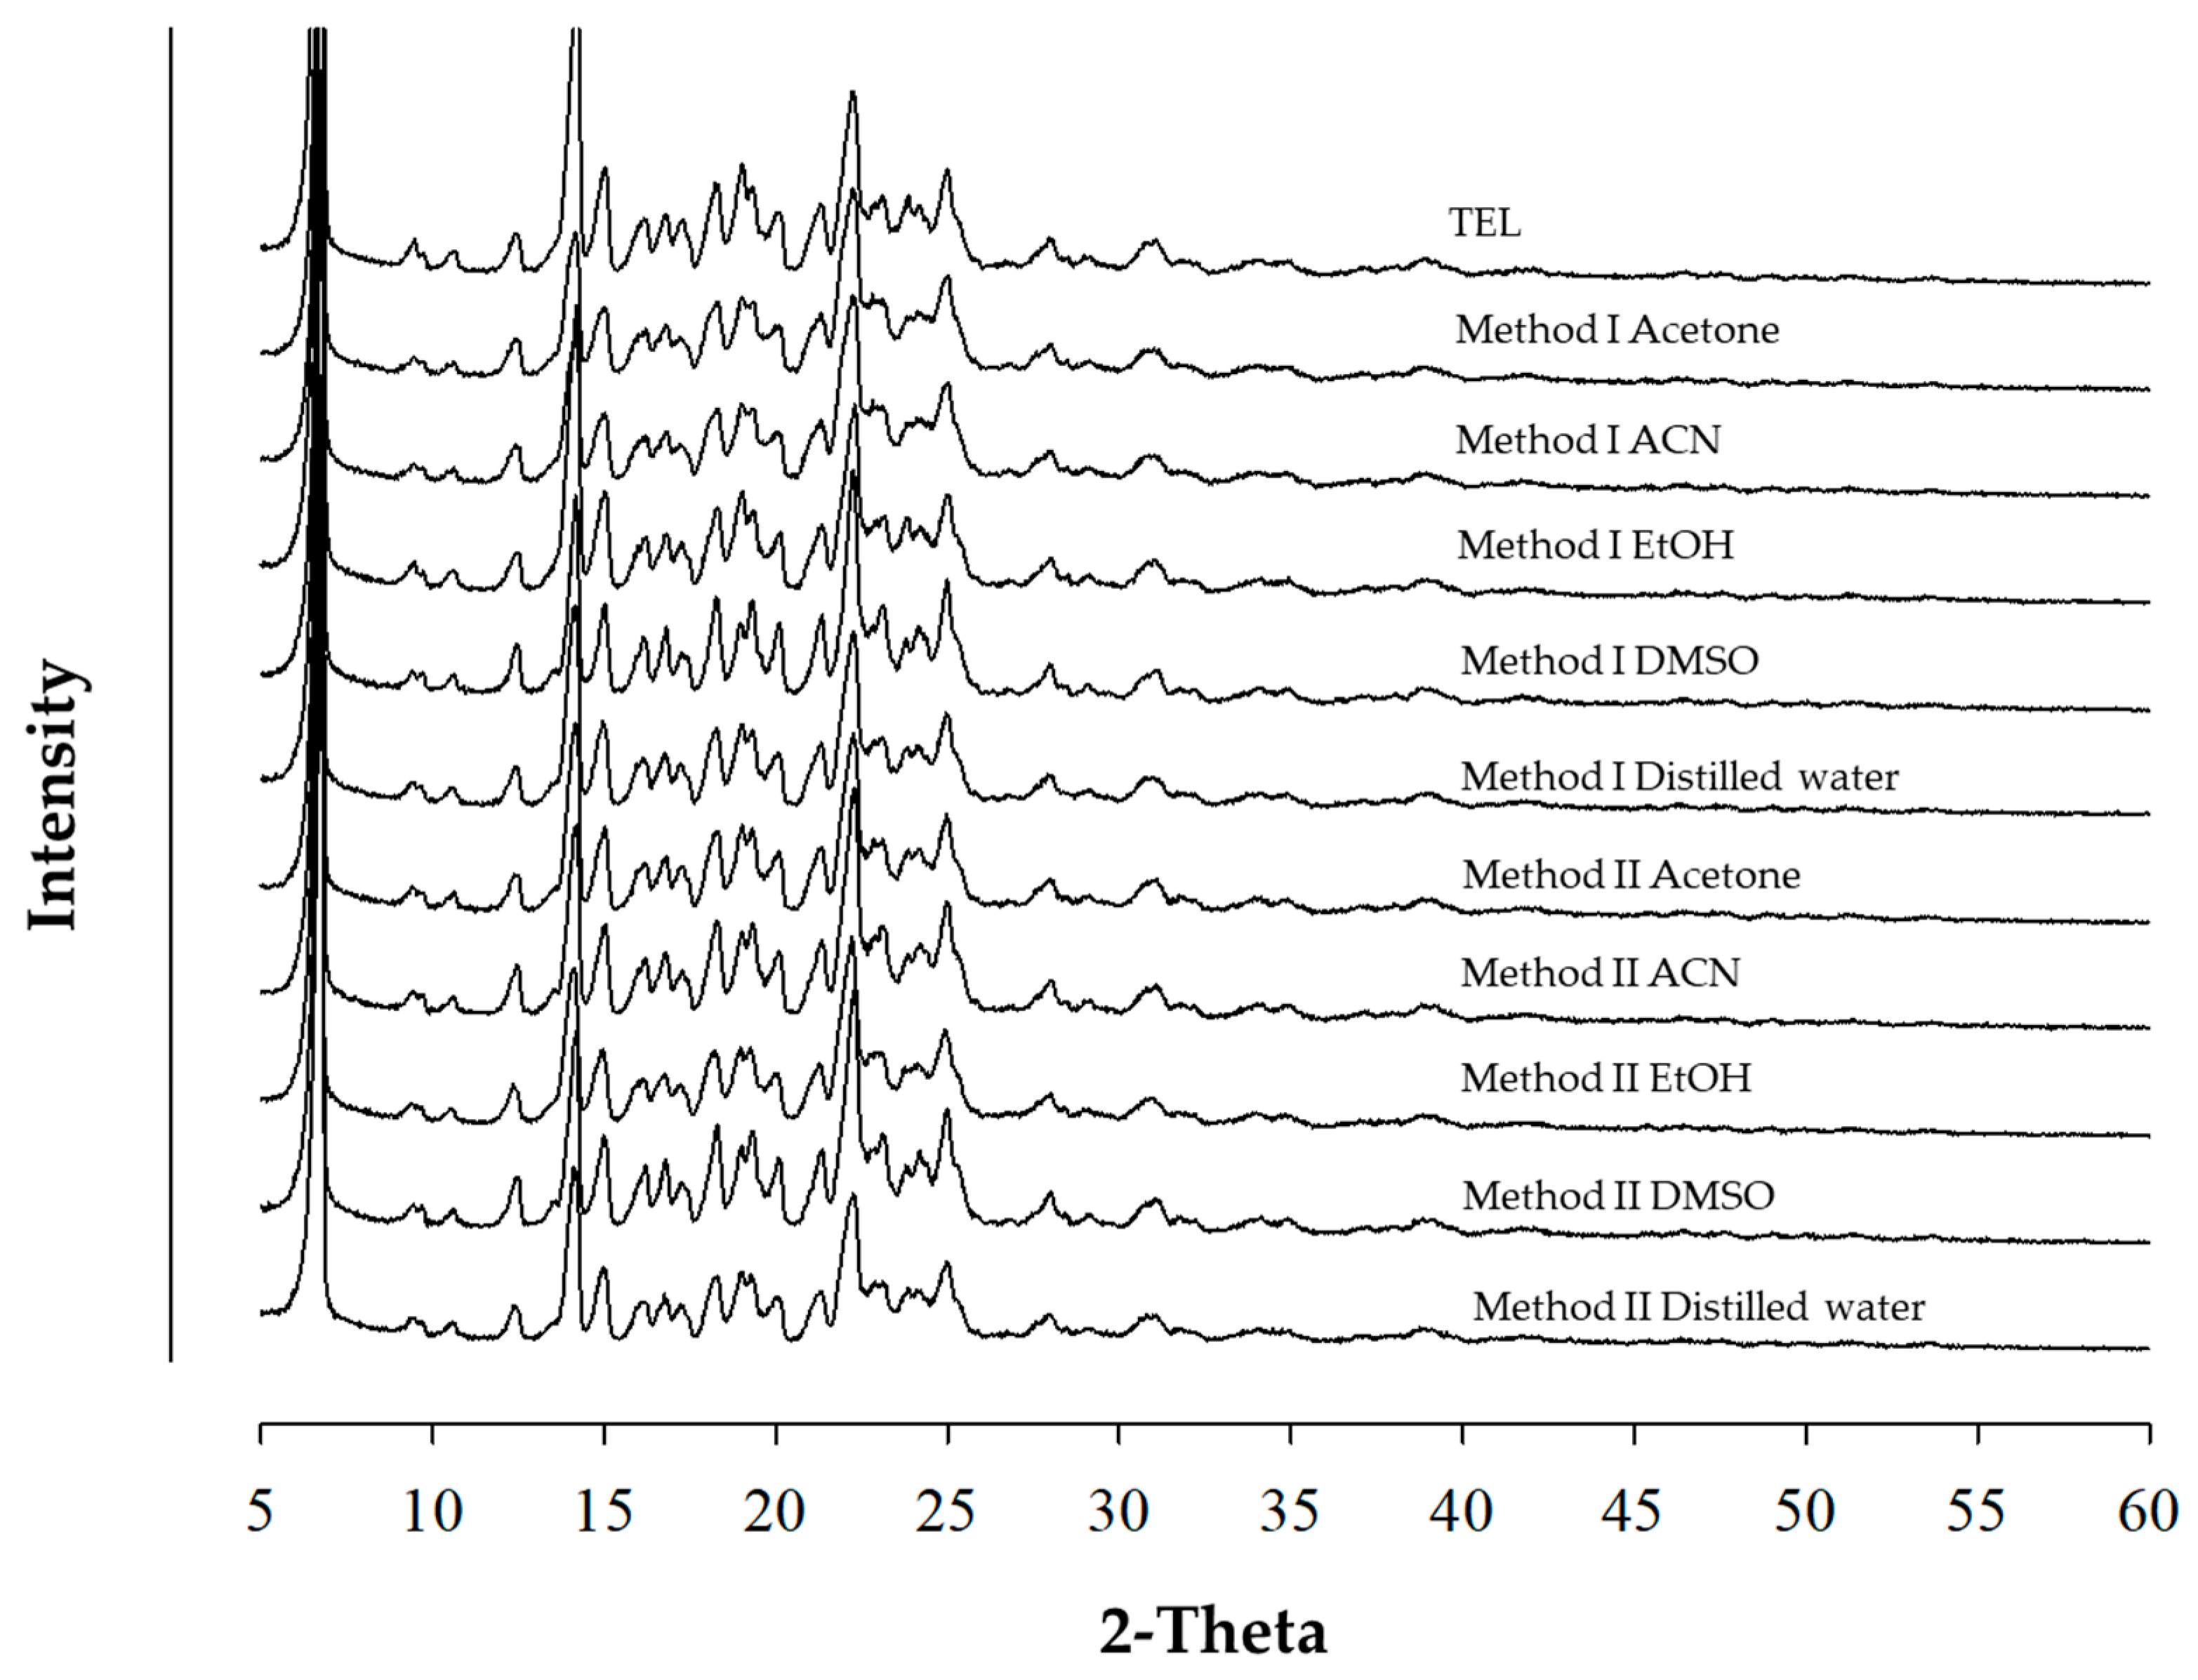
3.1. Characterization of Powdered Mixtures by Method I and II (Polymorphic Behaviors)
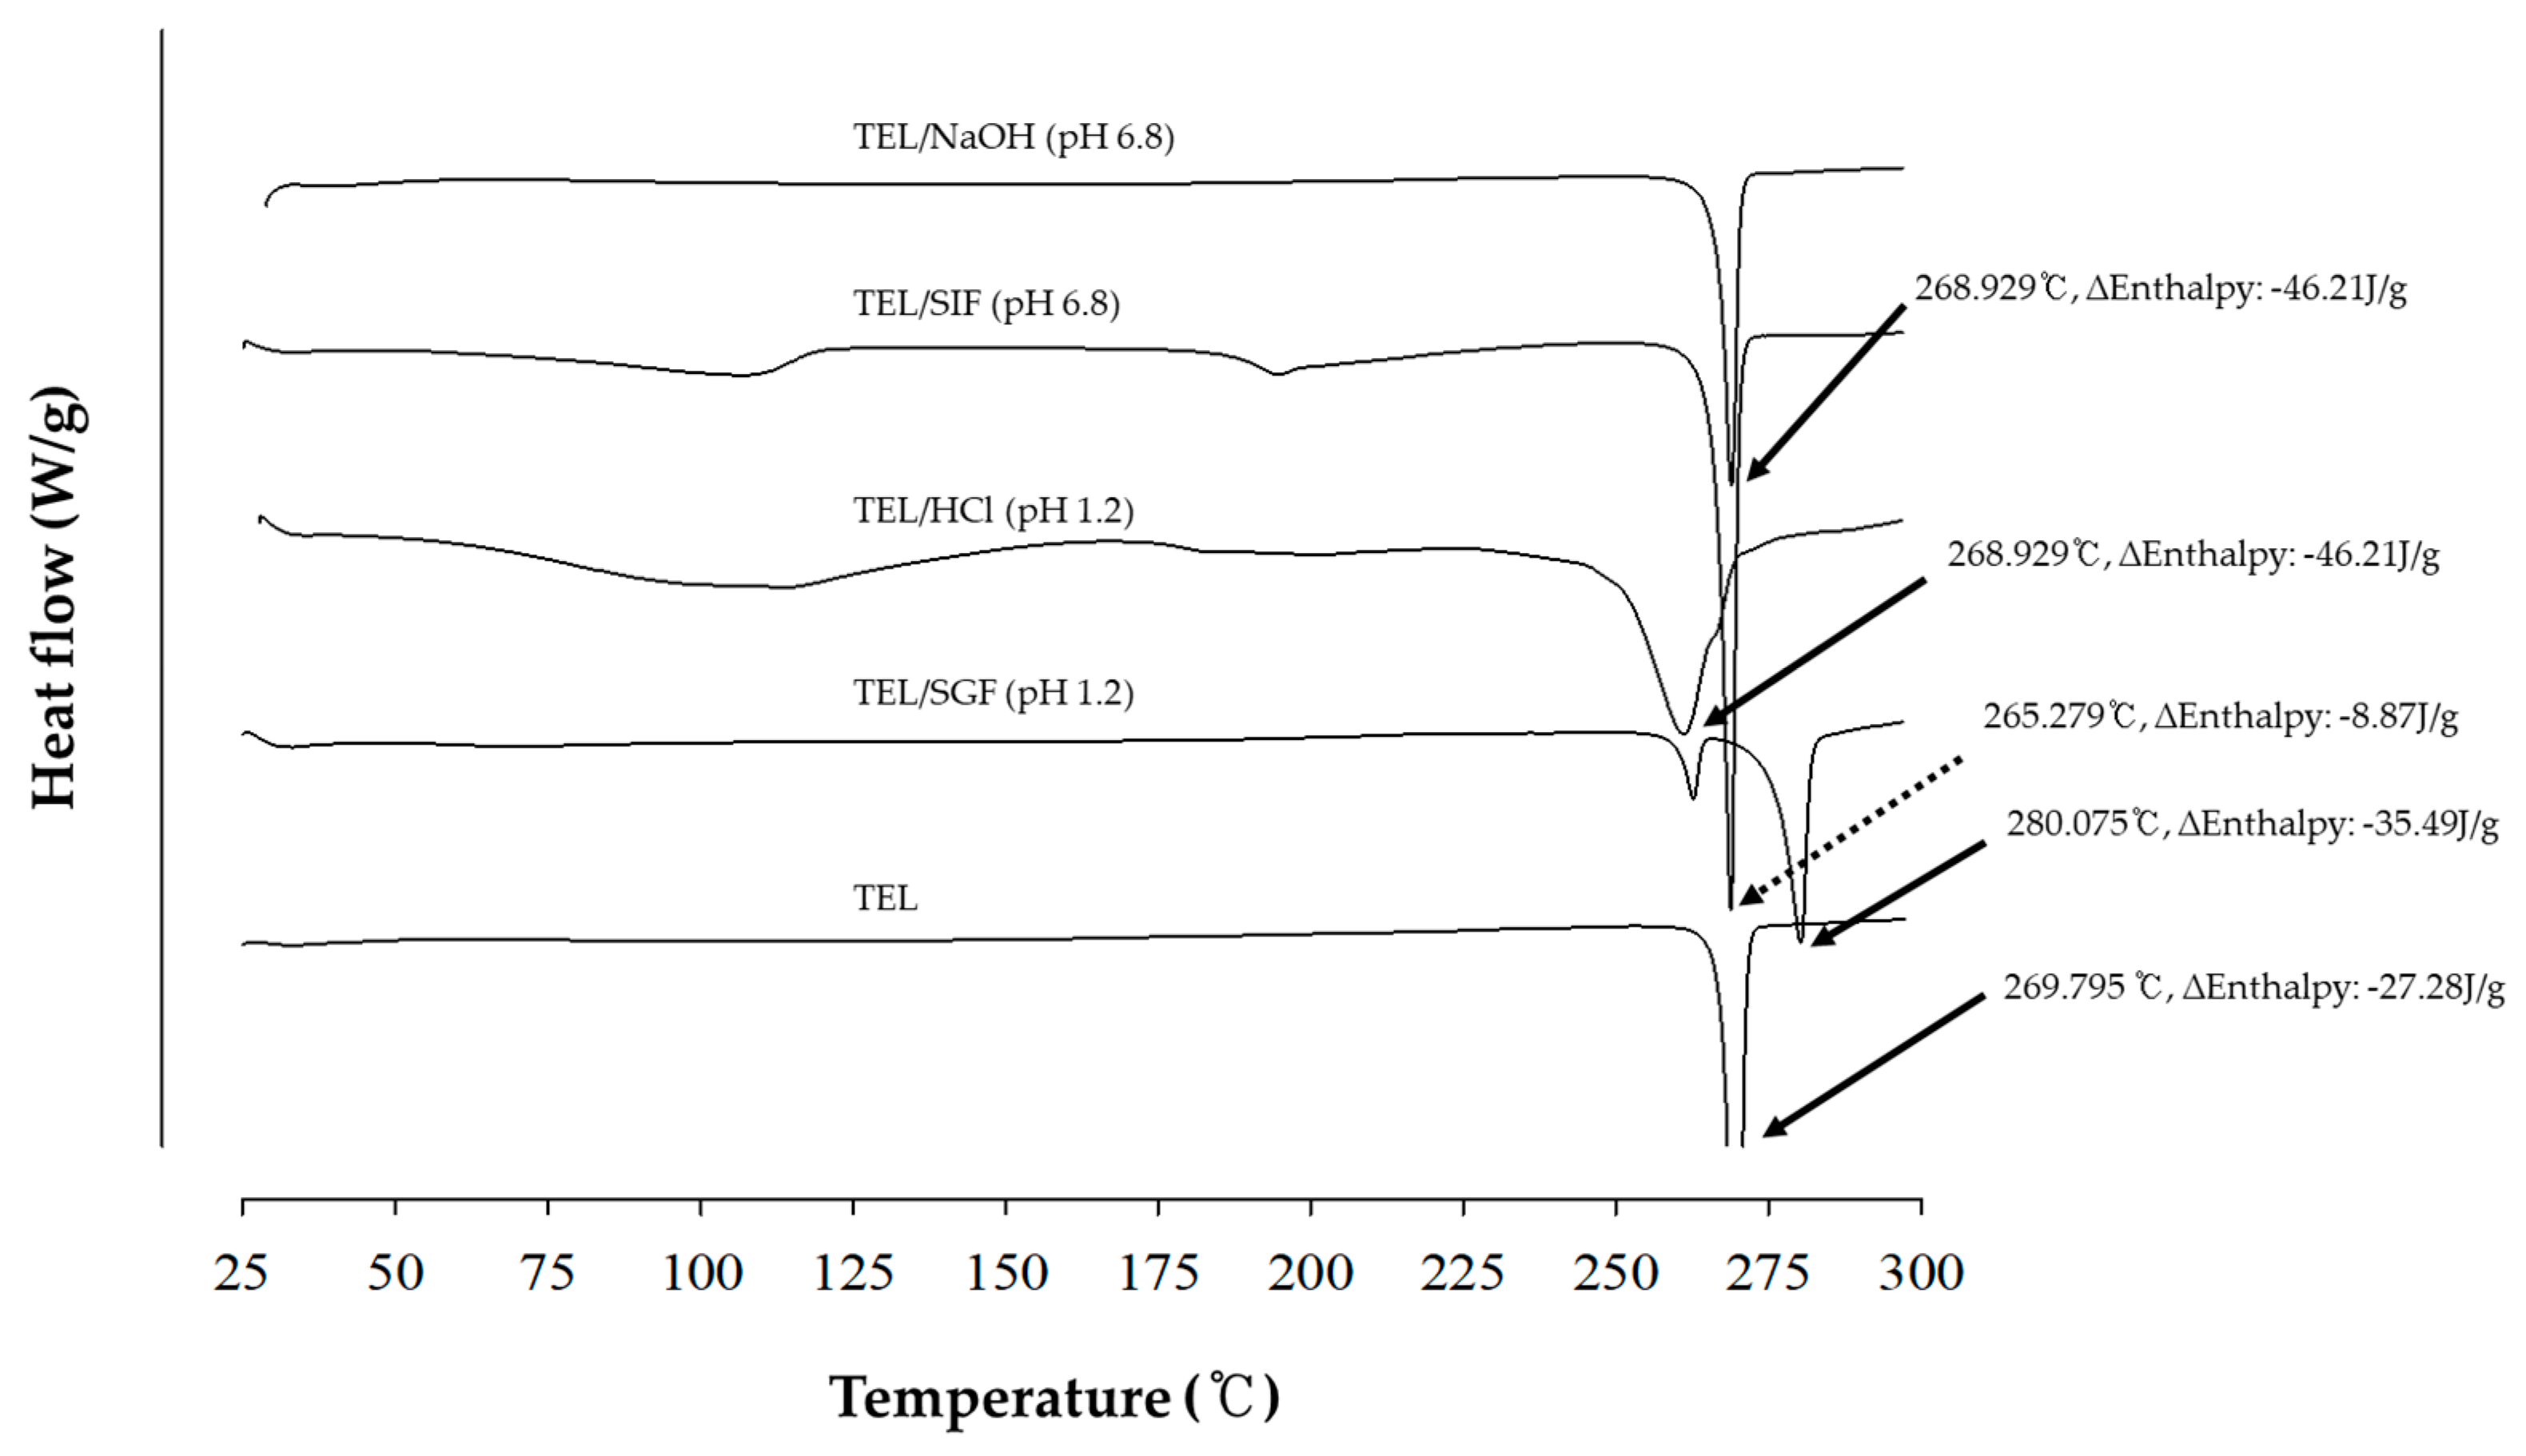
3.2. Characterization of Powdered Mixtures by Method III (Salt Formation)
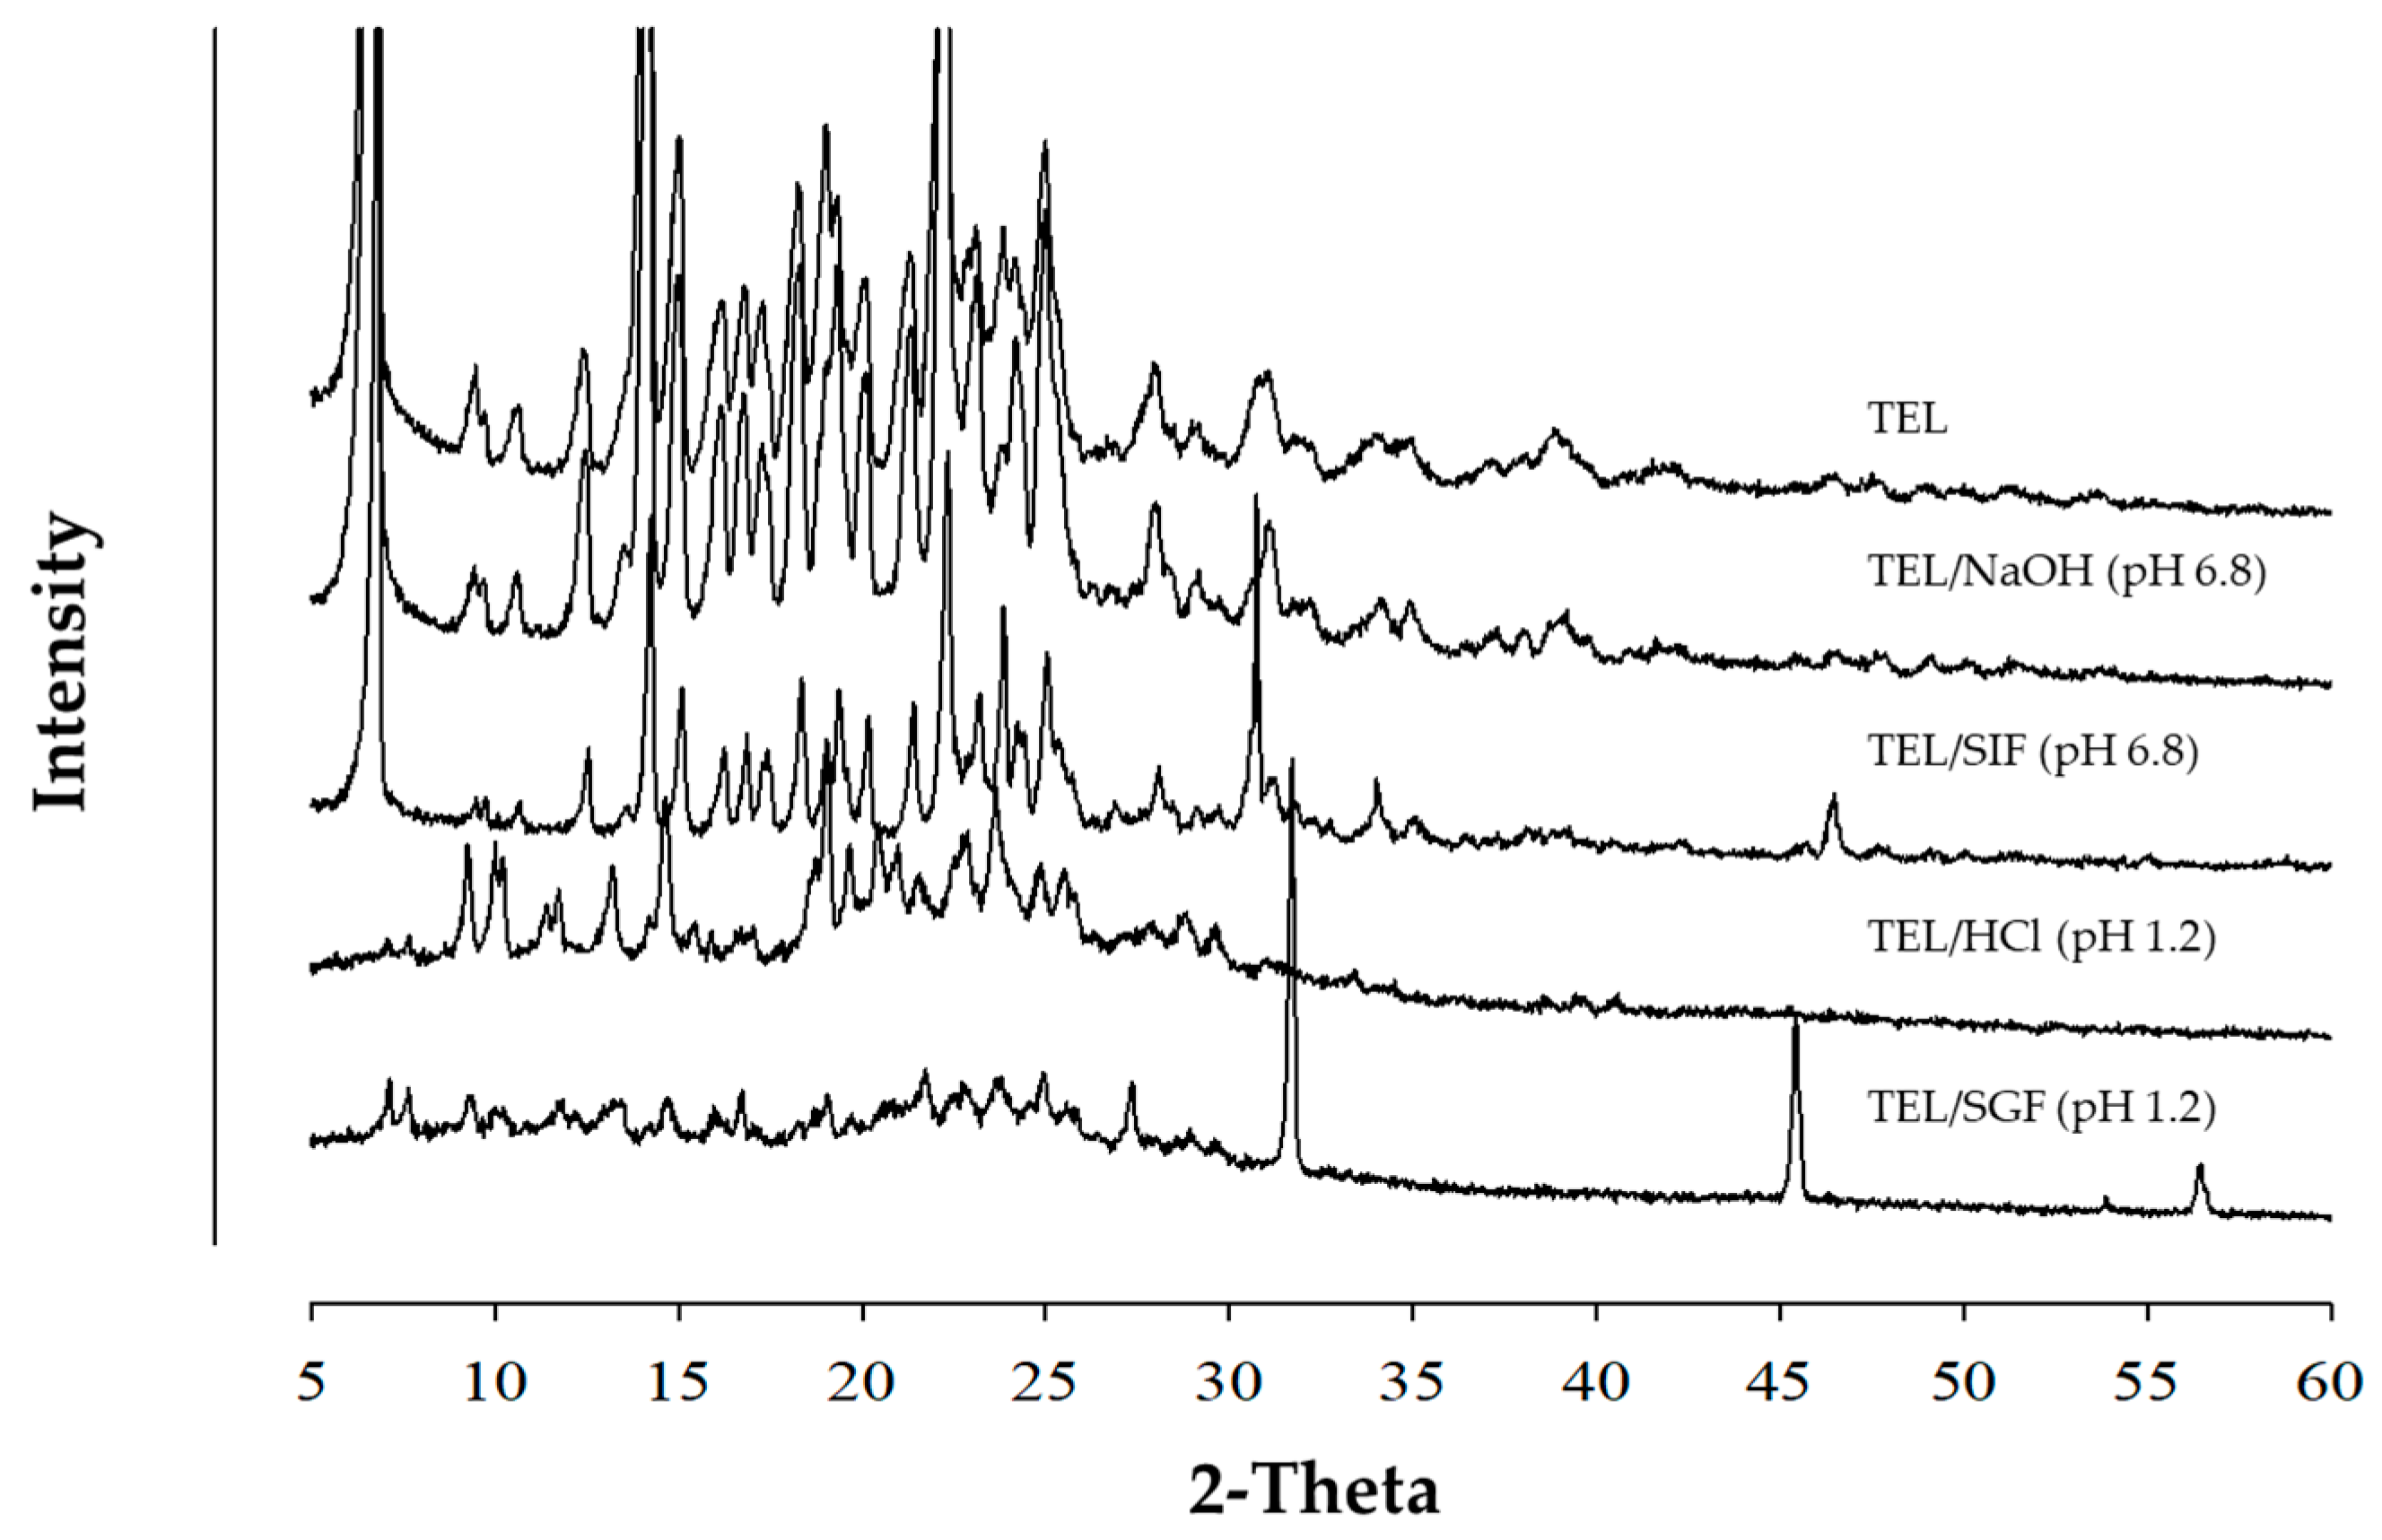
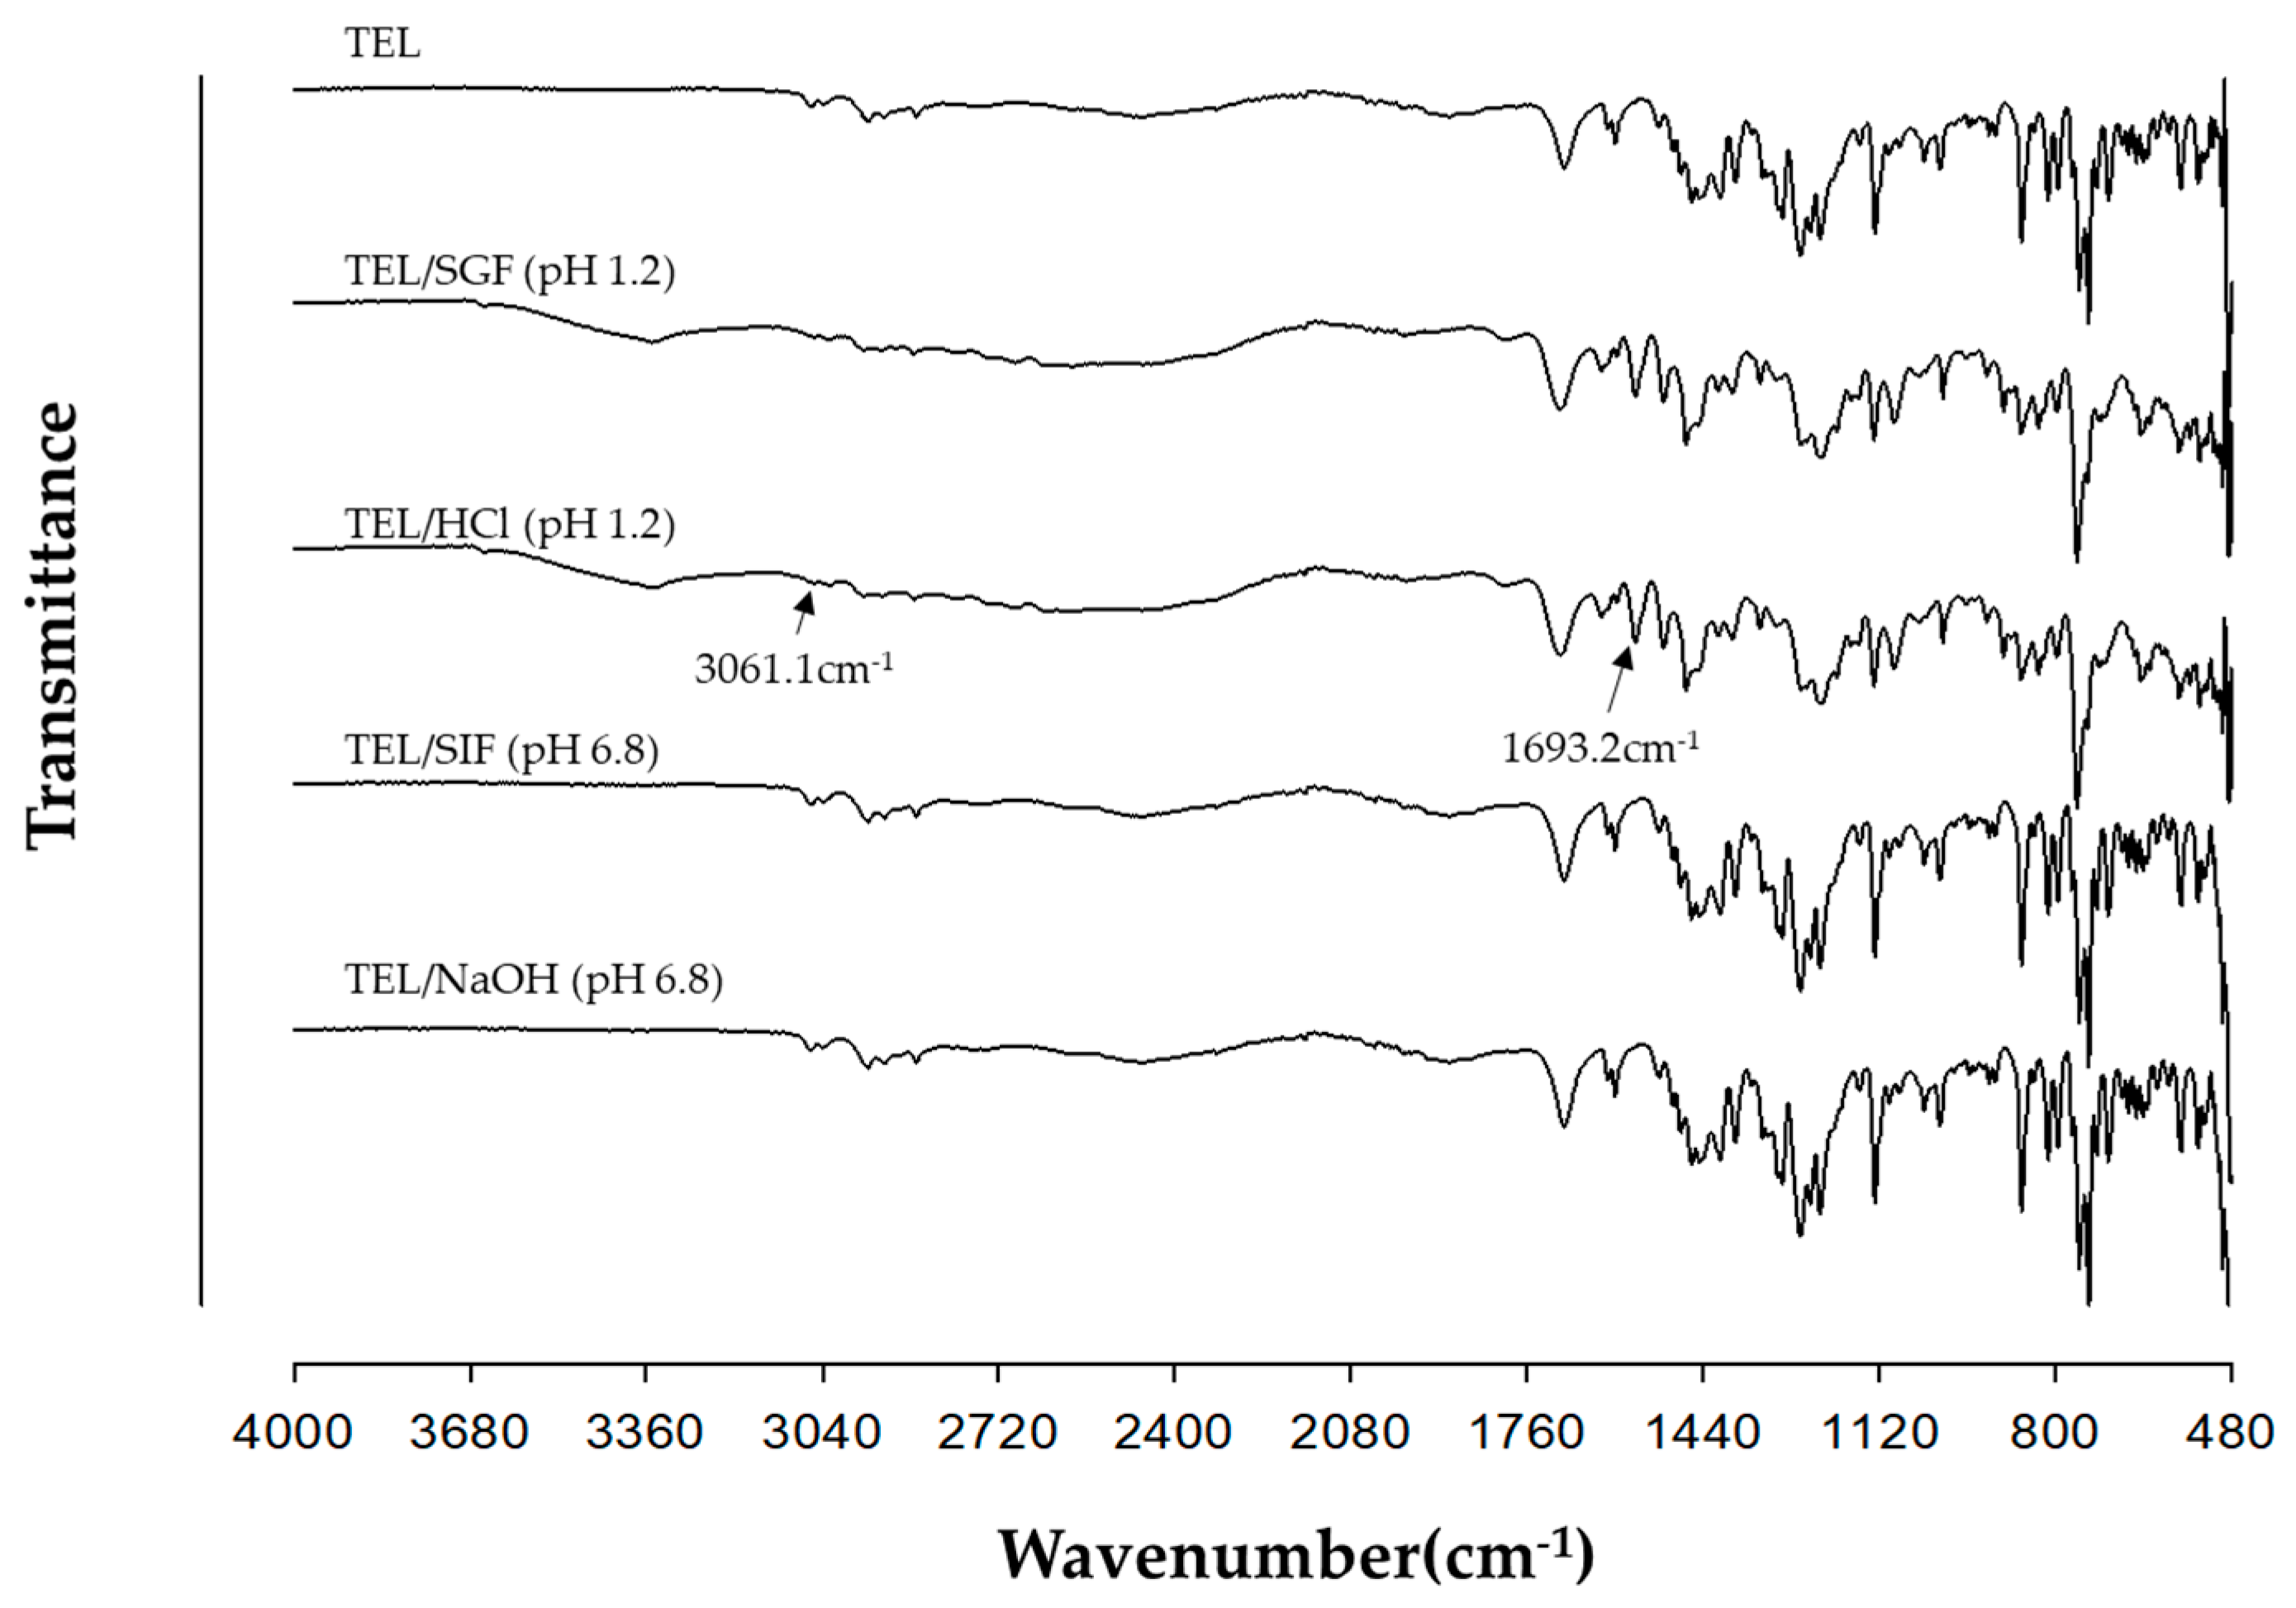
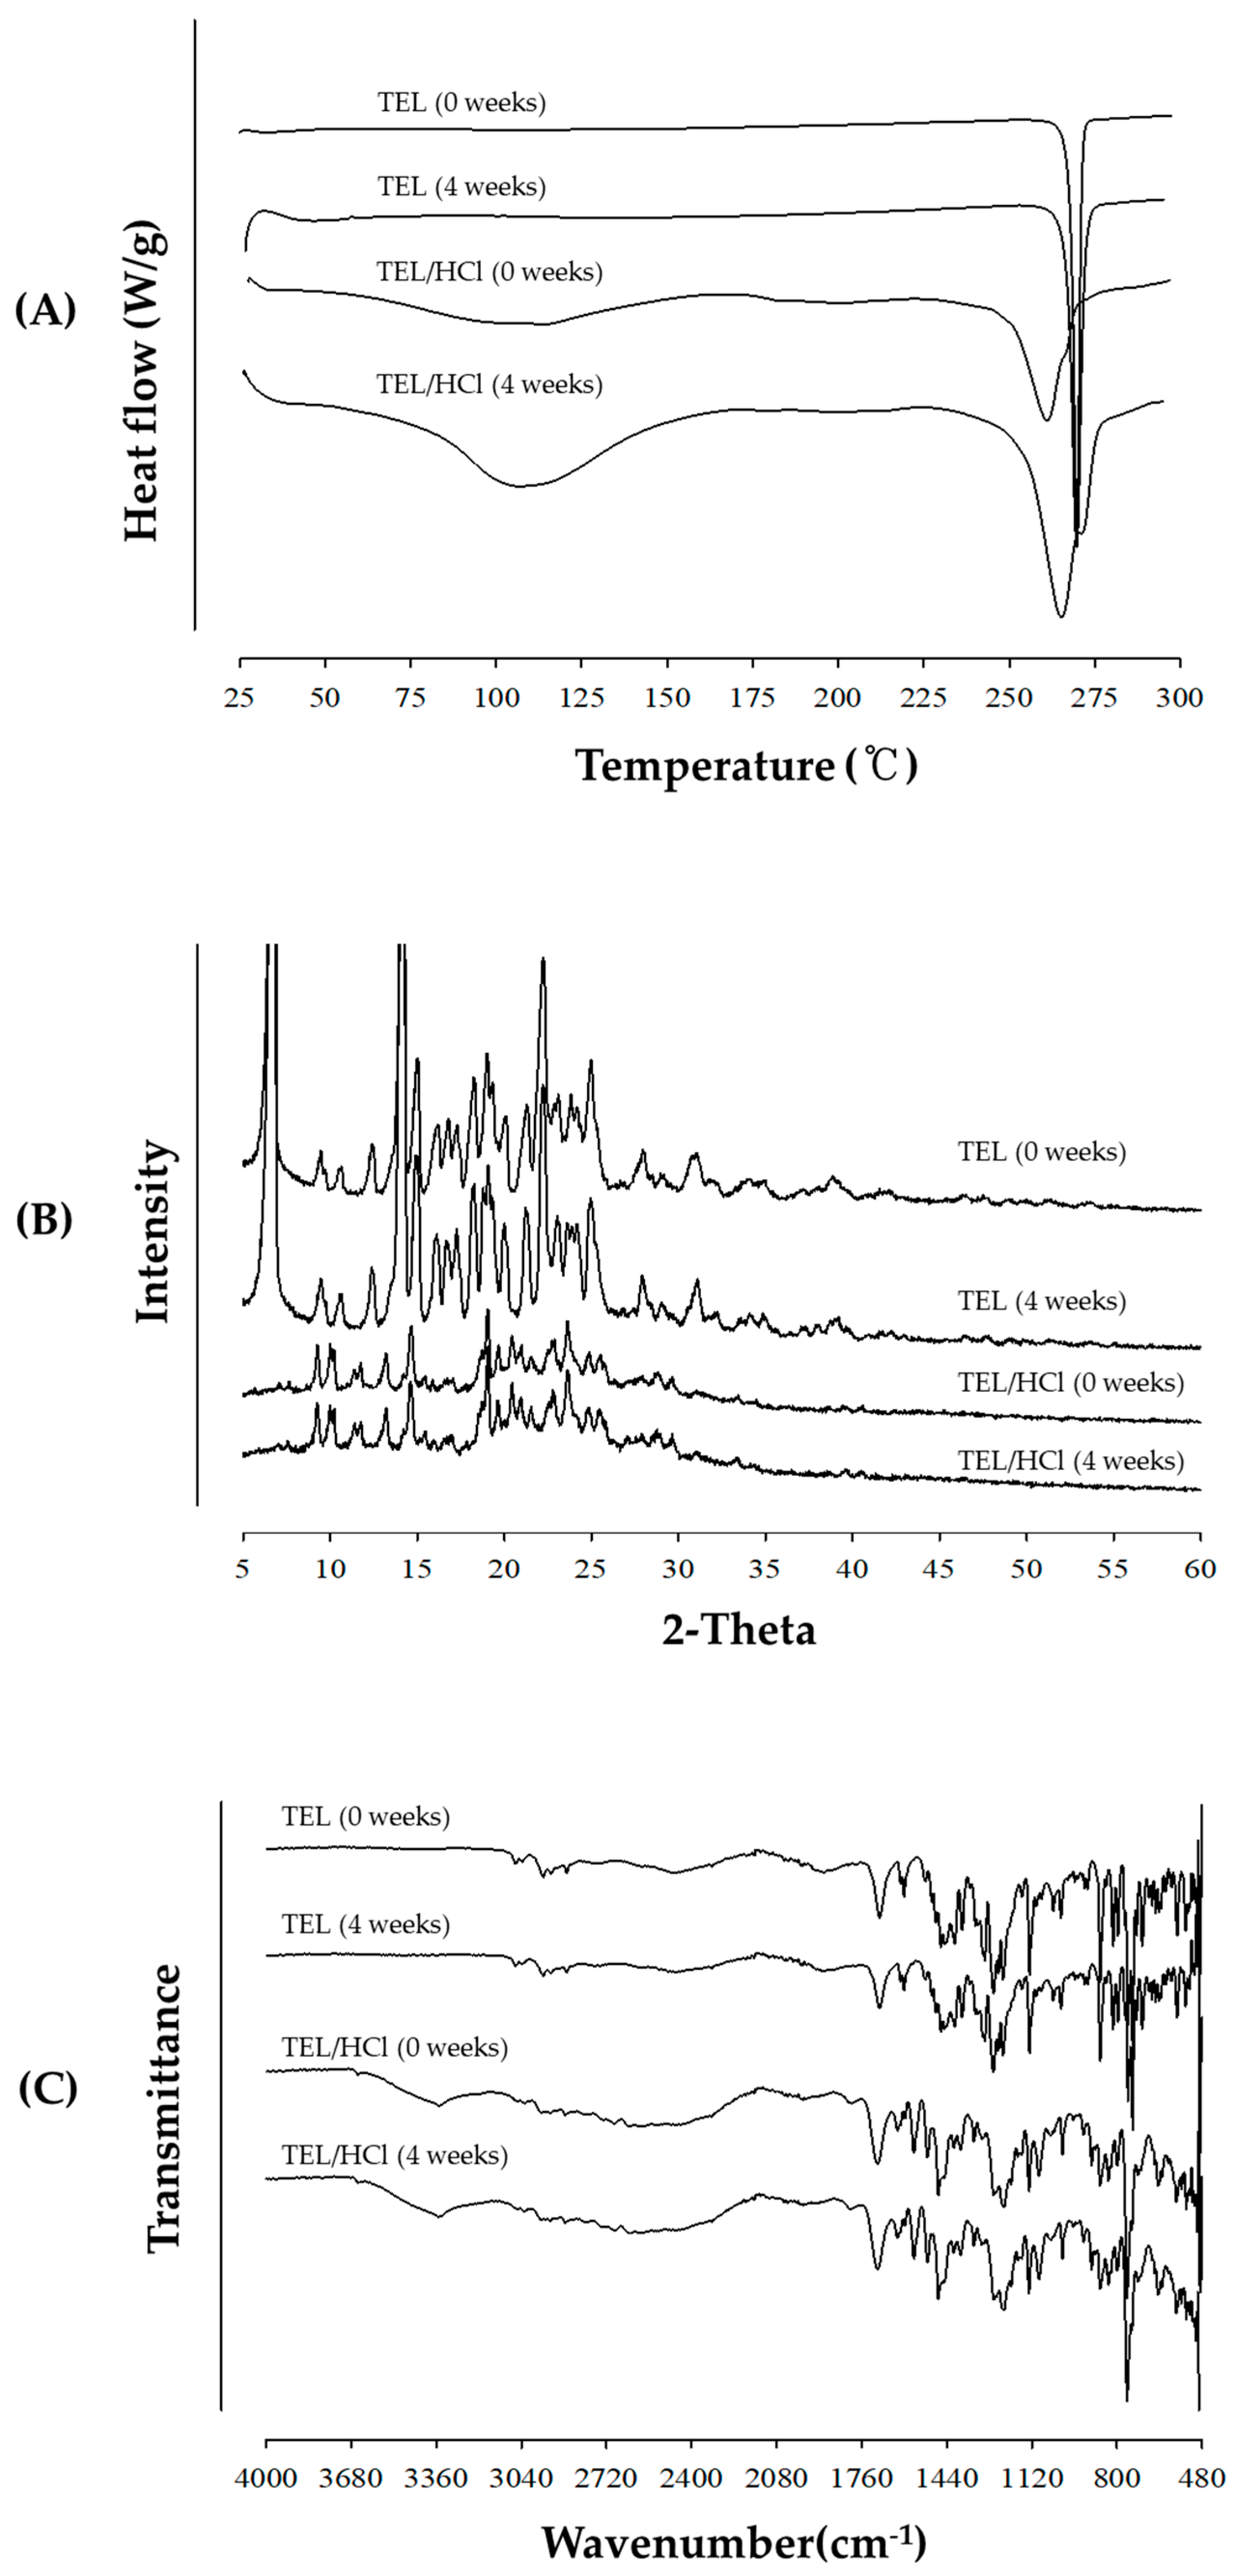
3.2.1. Instrumental Analysis
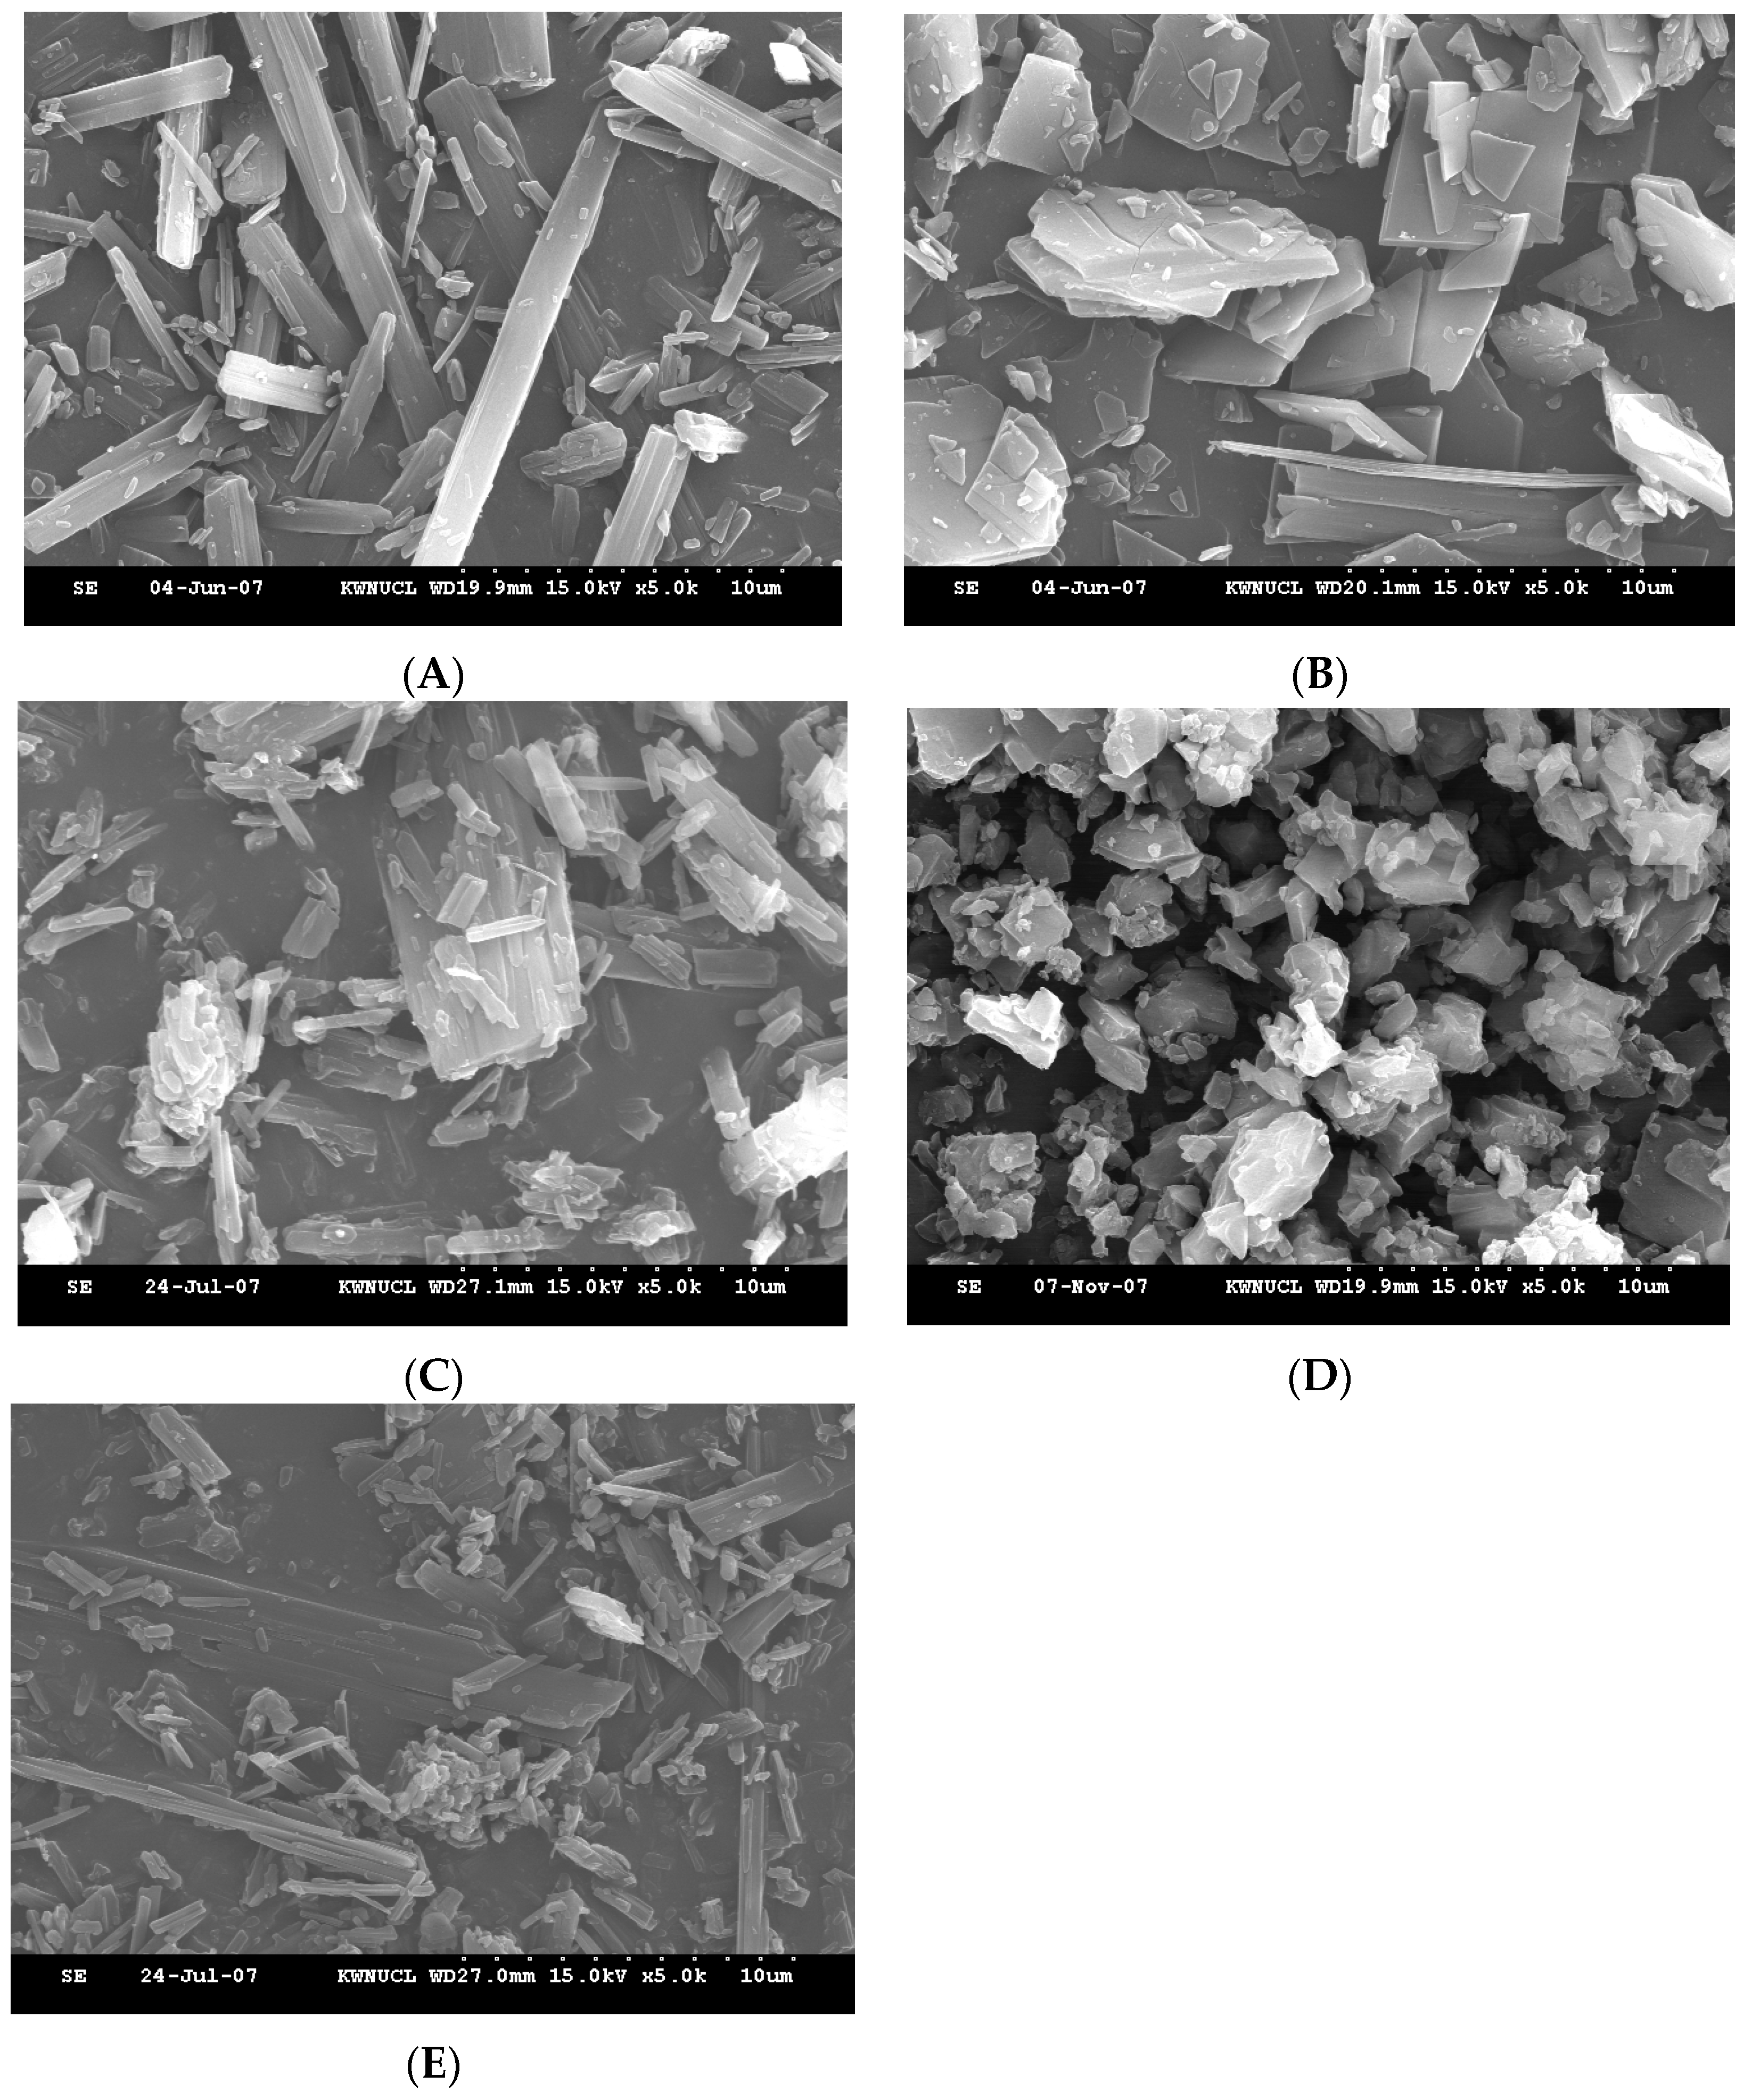
3.2.2. Surface Morphologies of Powdered Mixtures by FESEM
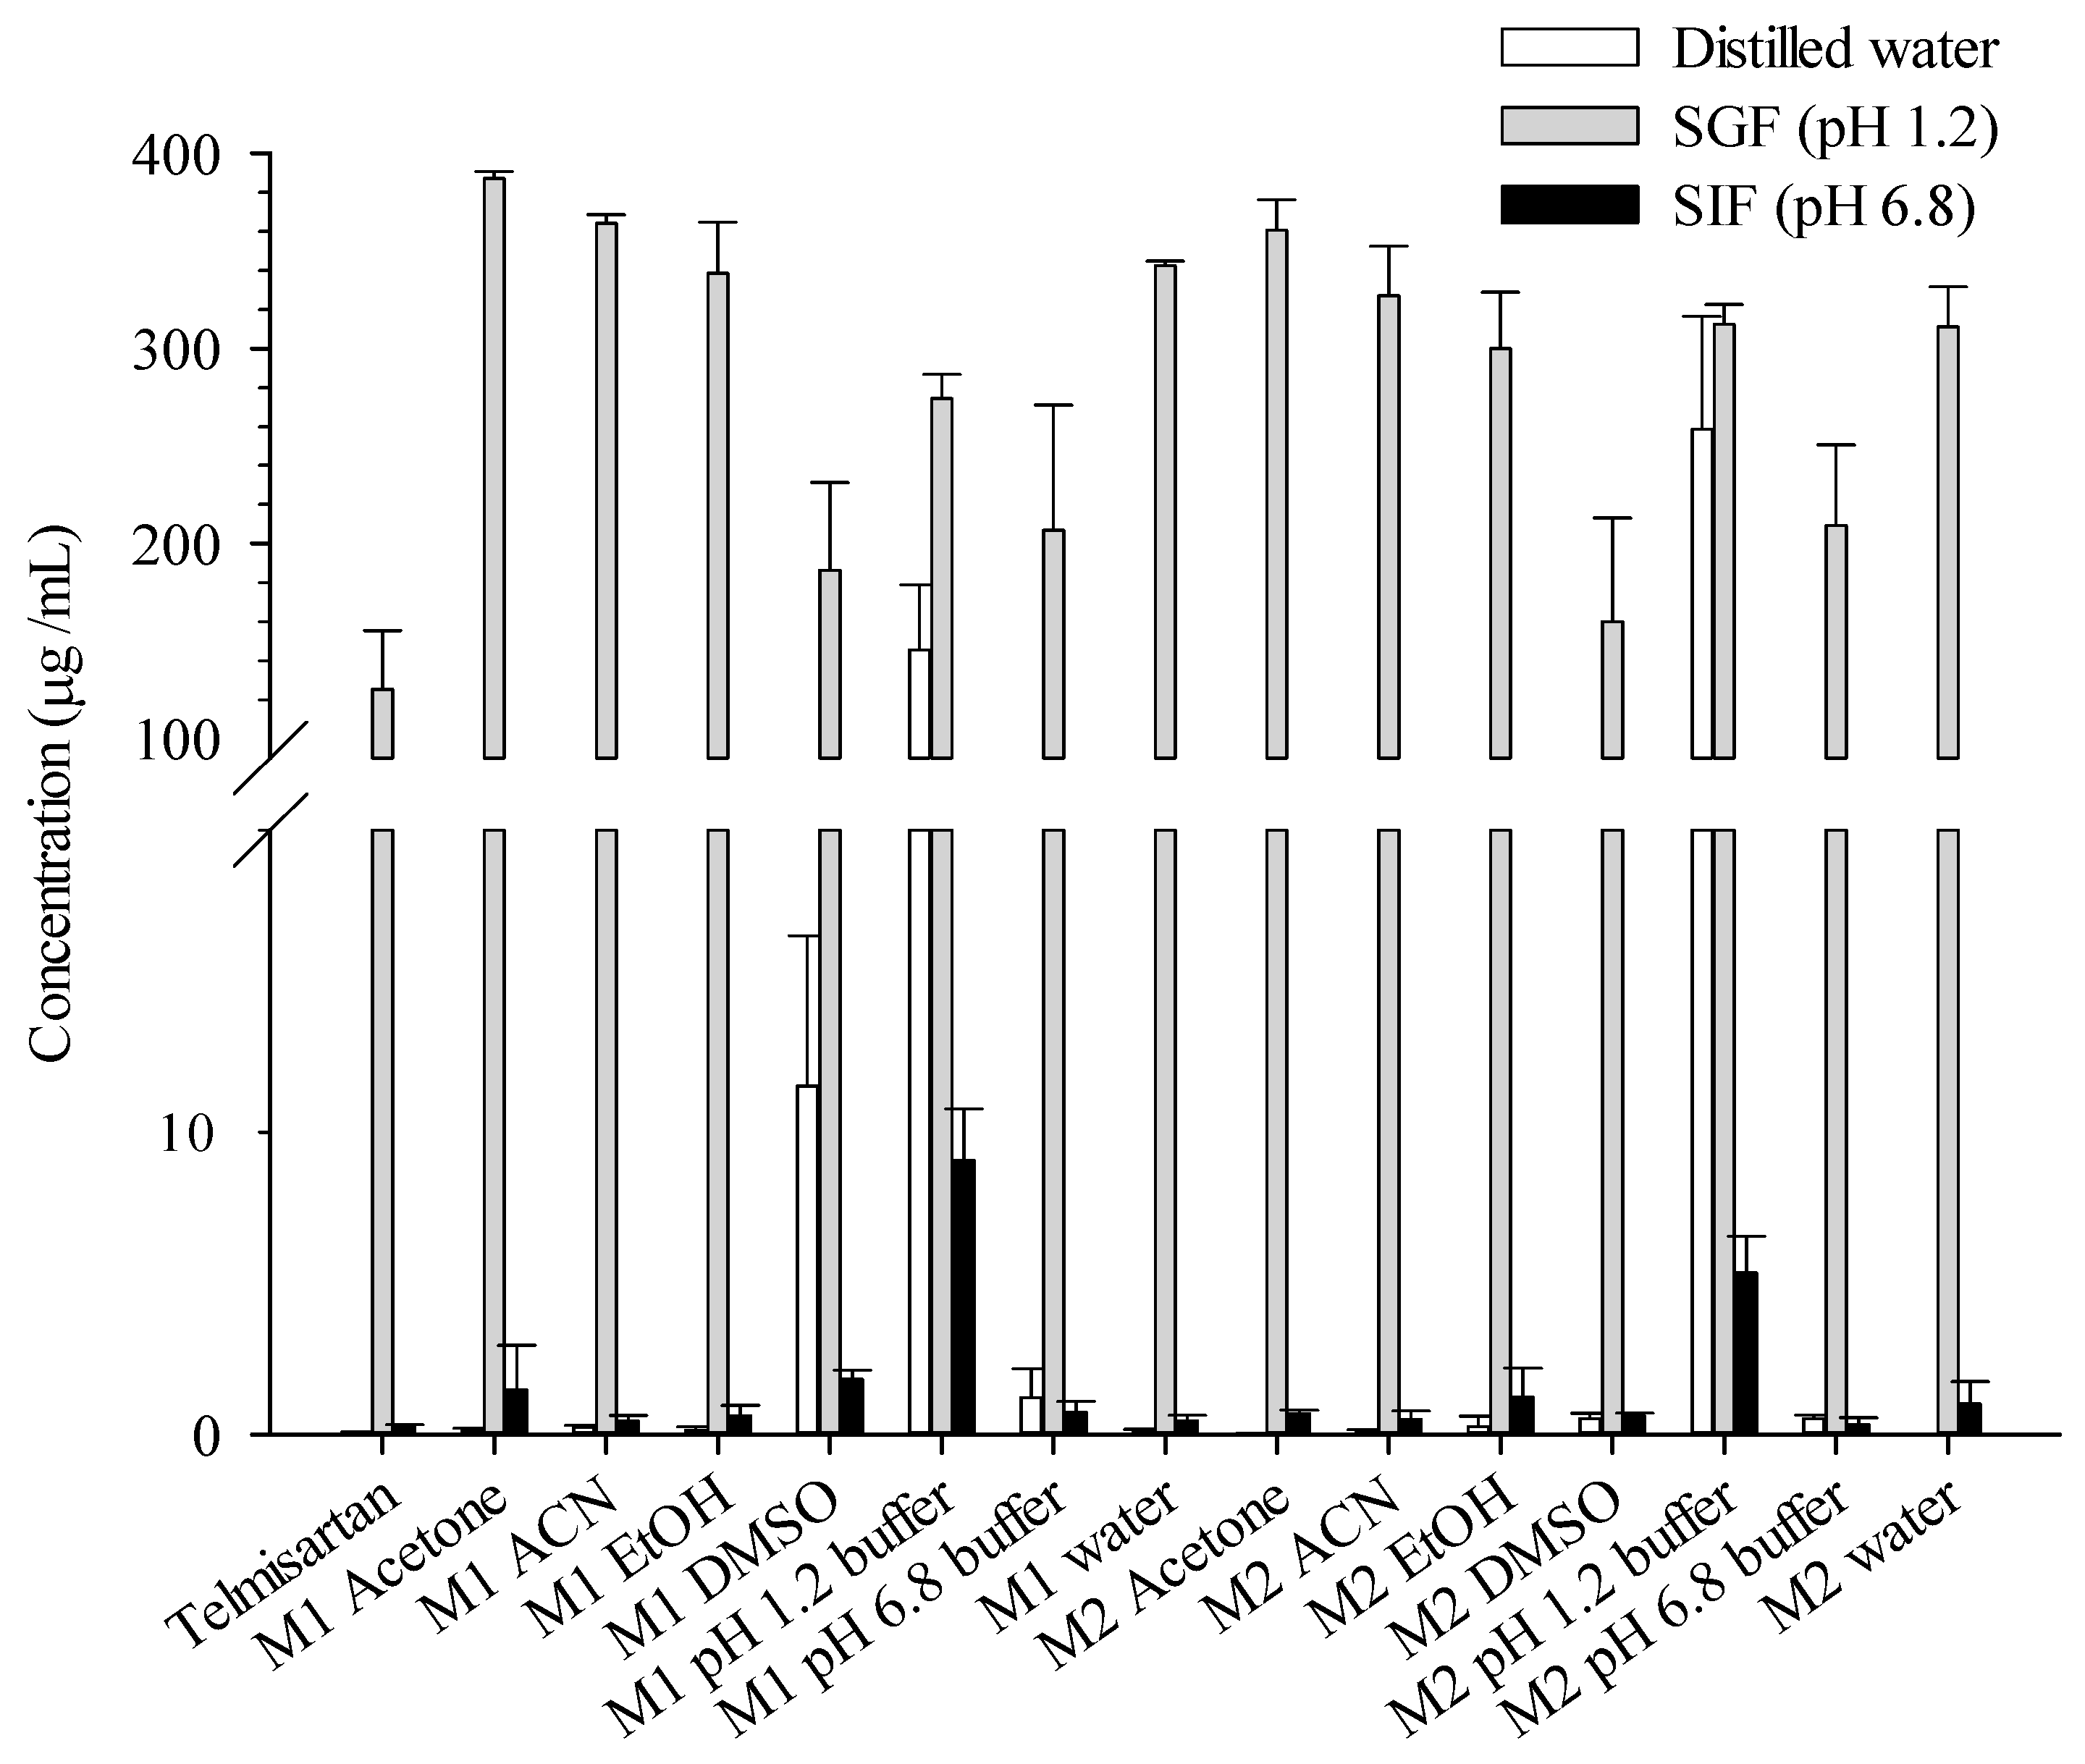
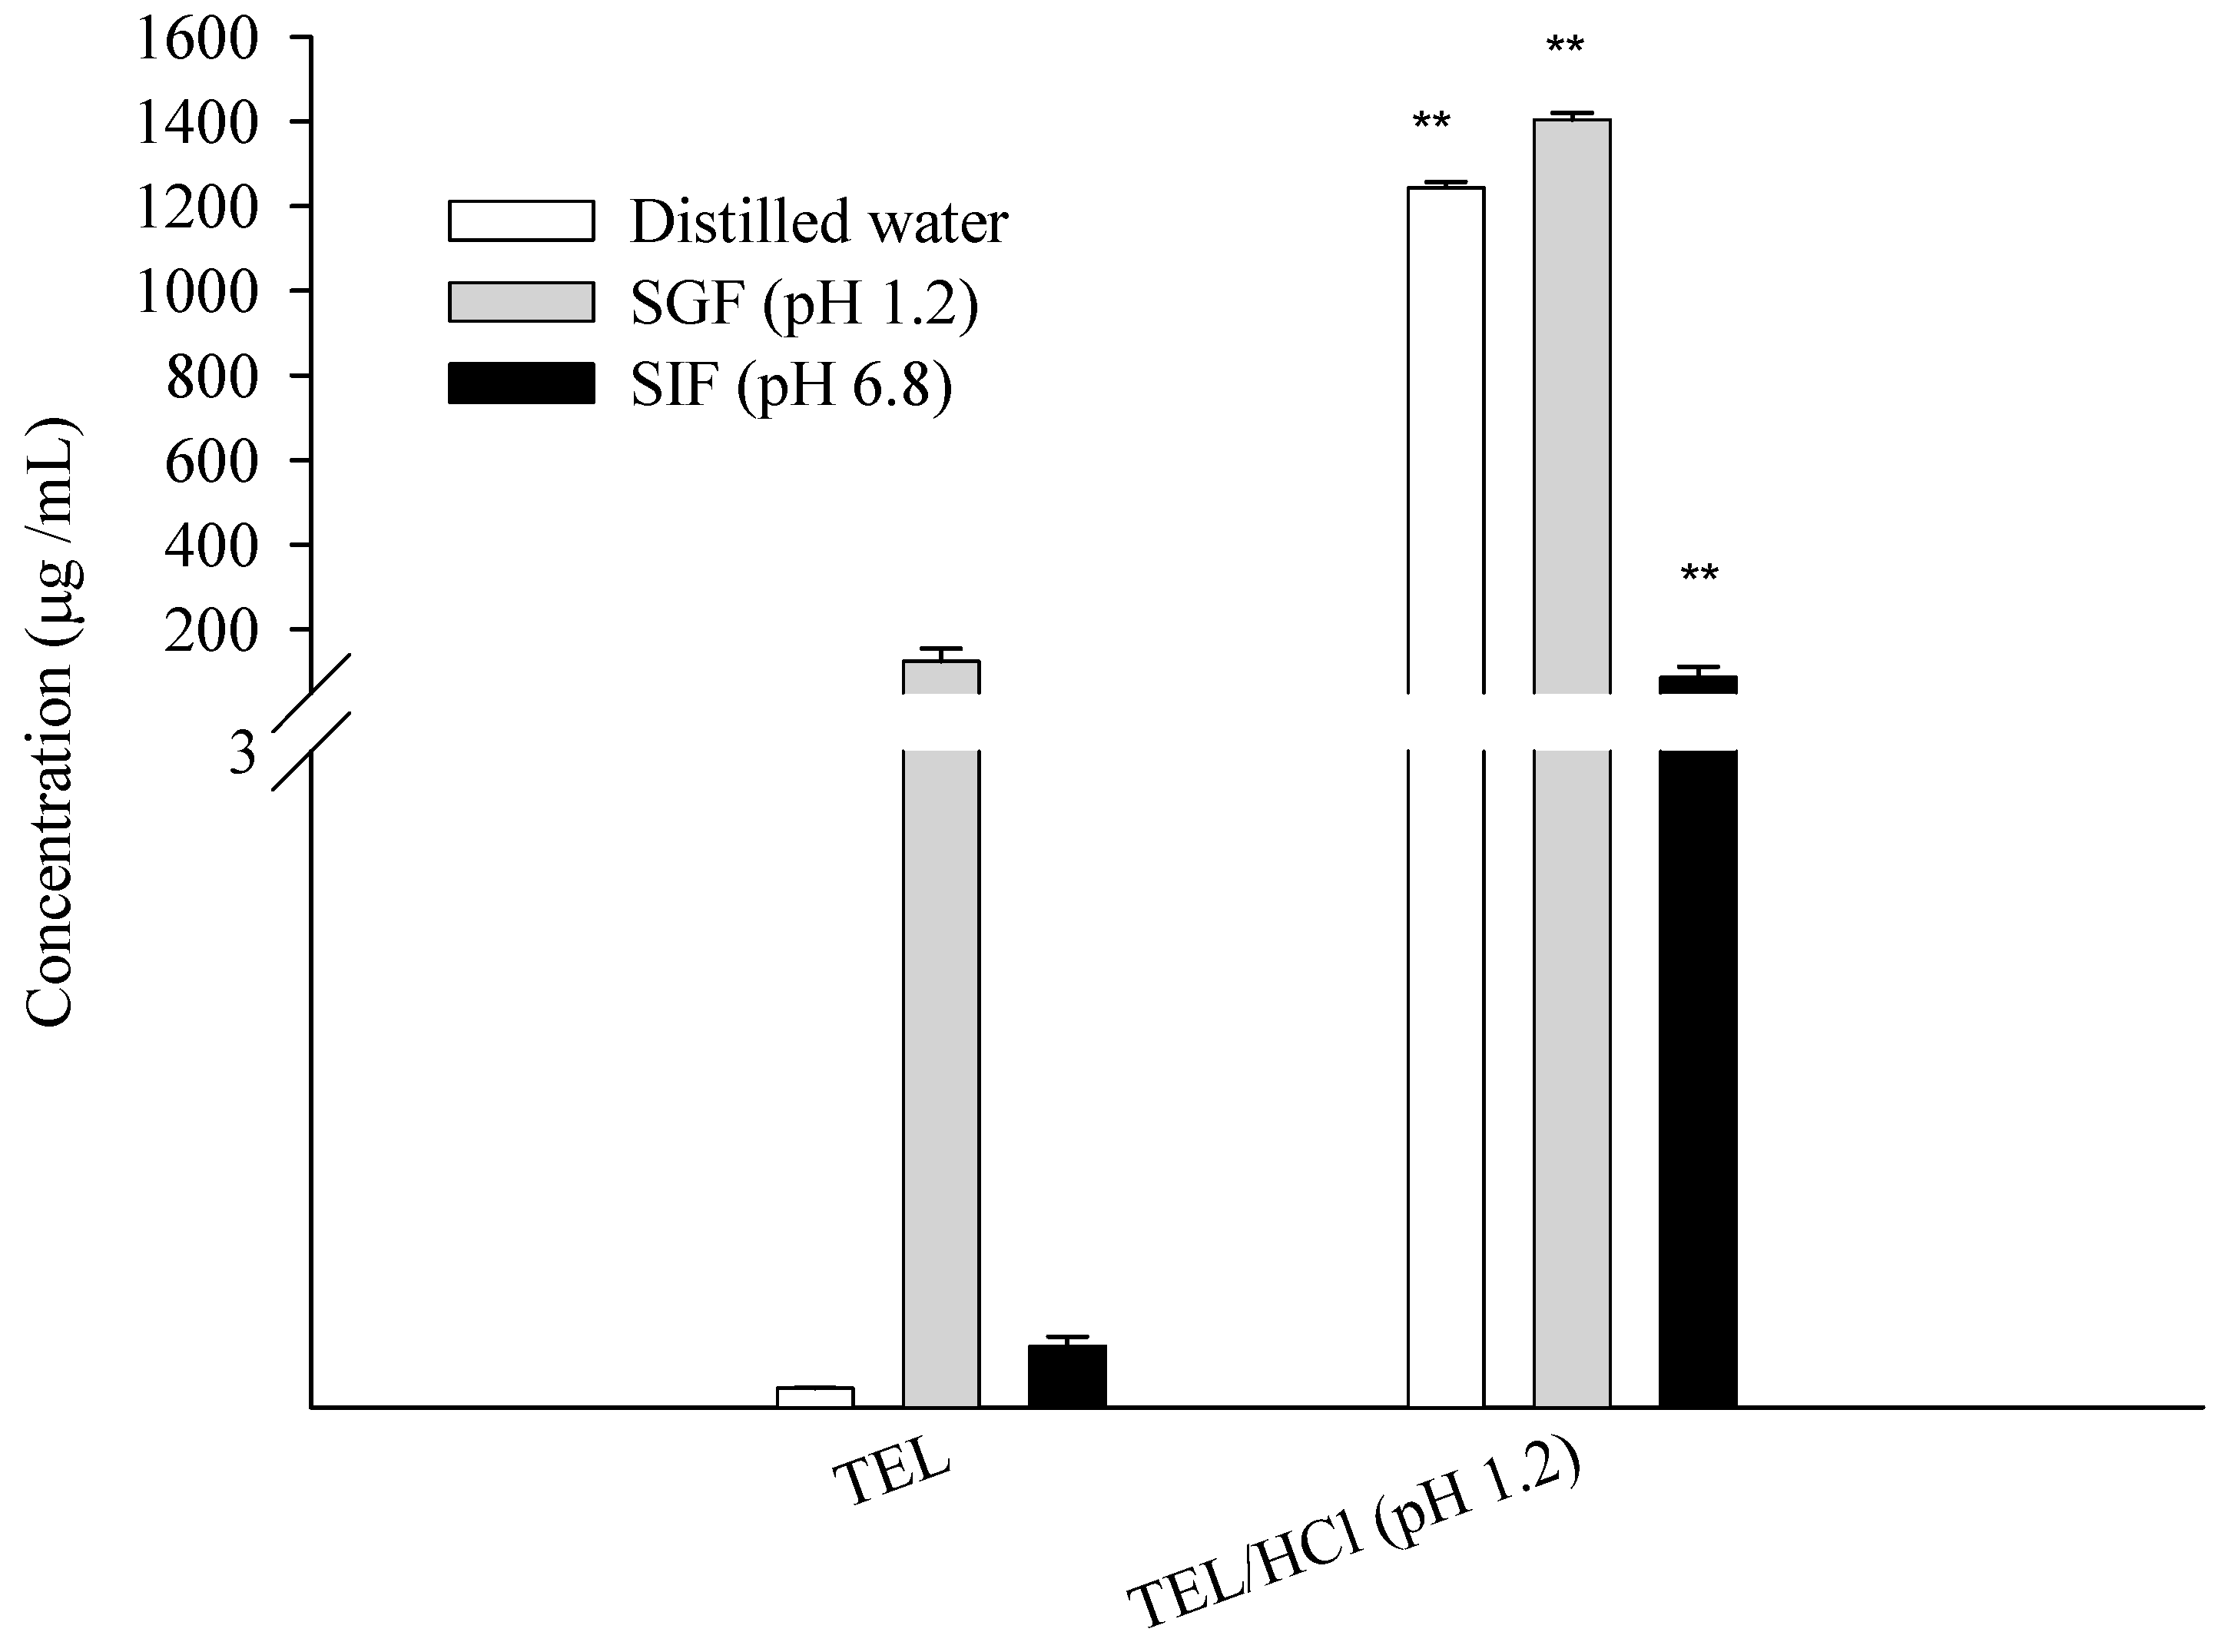
3.2.3. Solubility Study
3.2.4. Mechanistic Characterization of Salt Form (TEL/HCl)
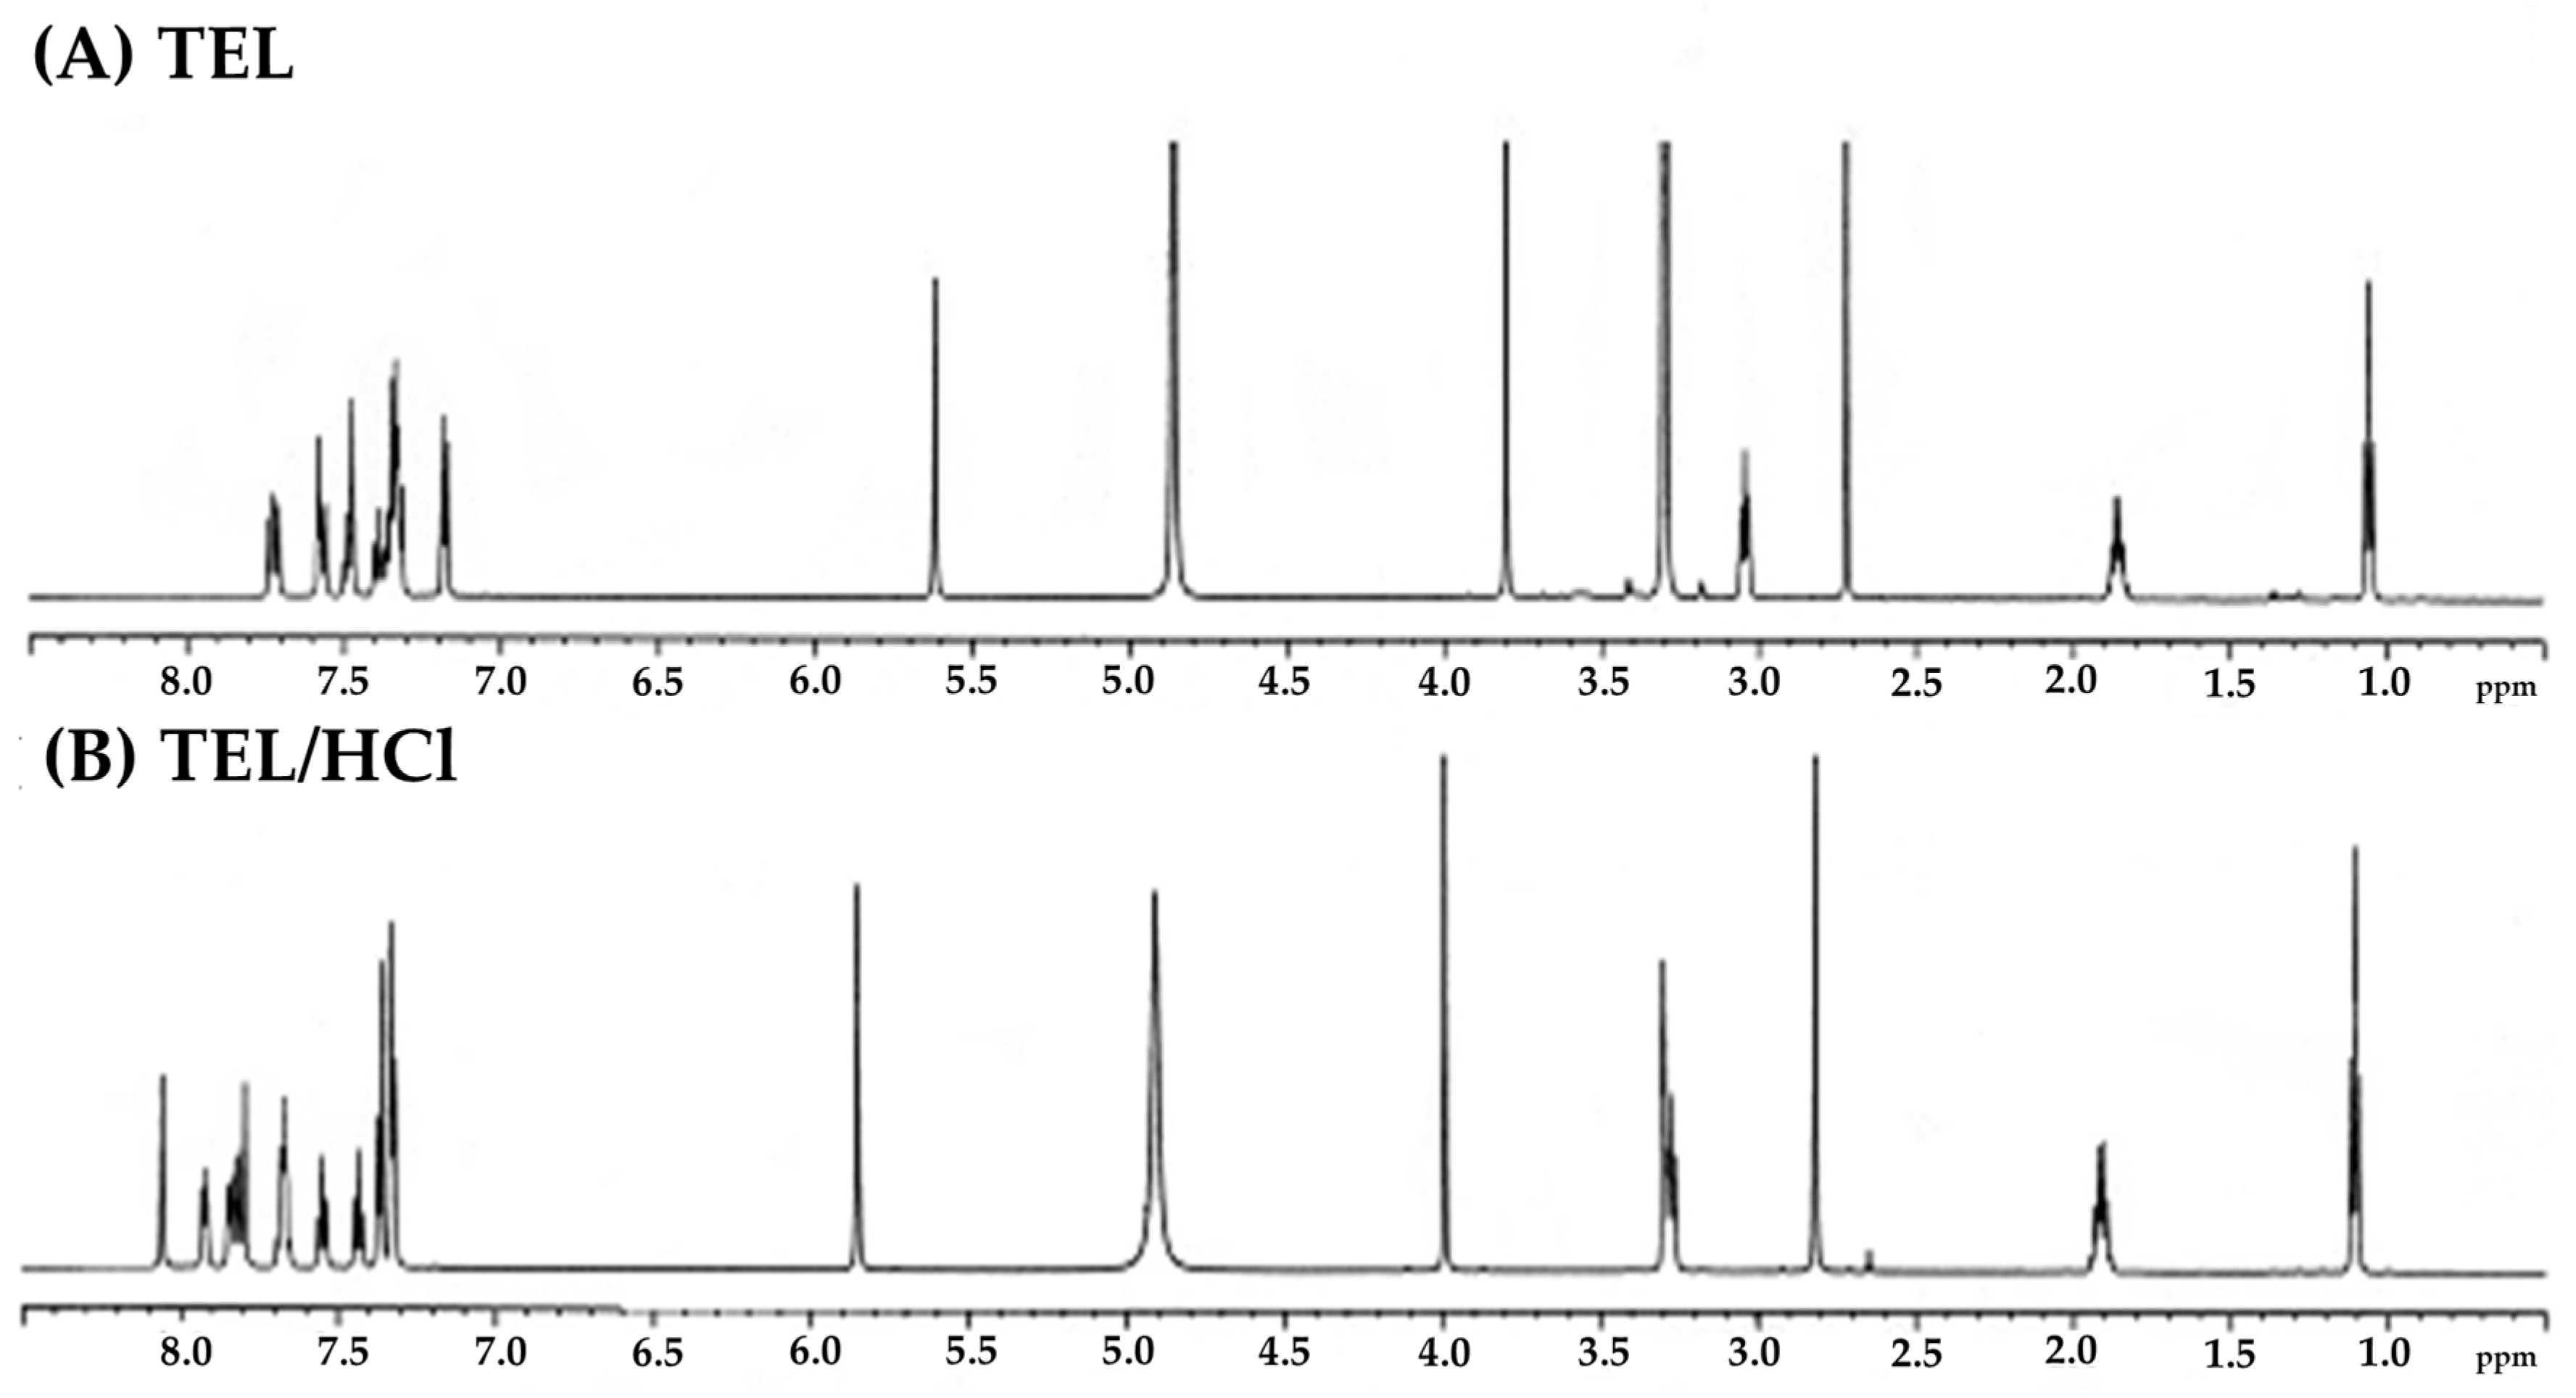
1H-NMR Analysis
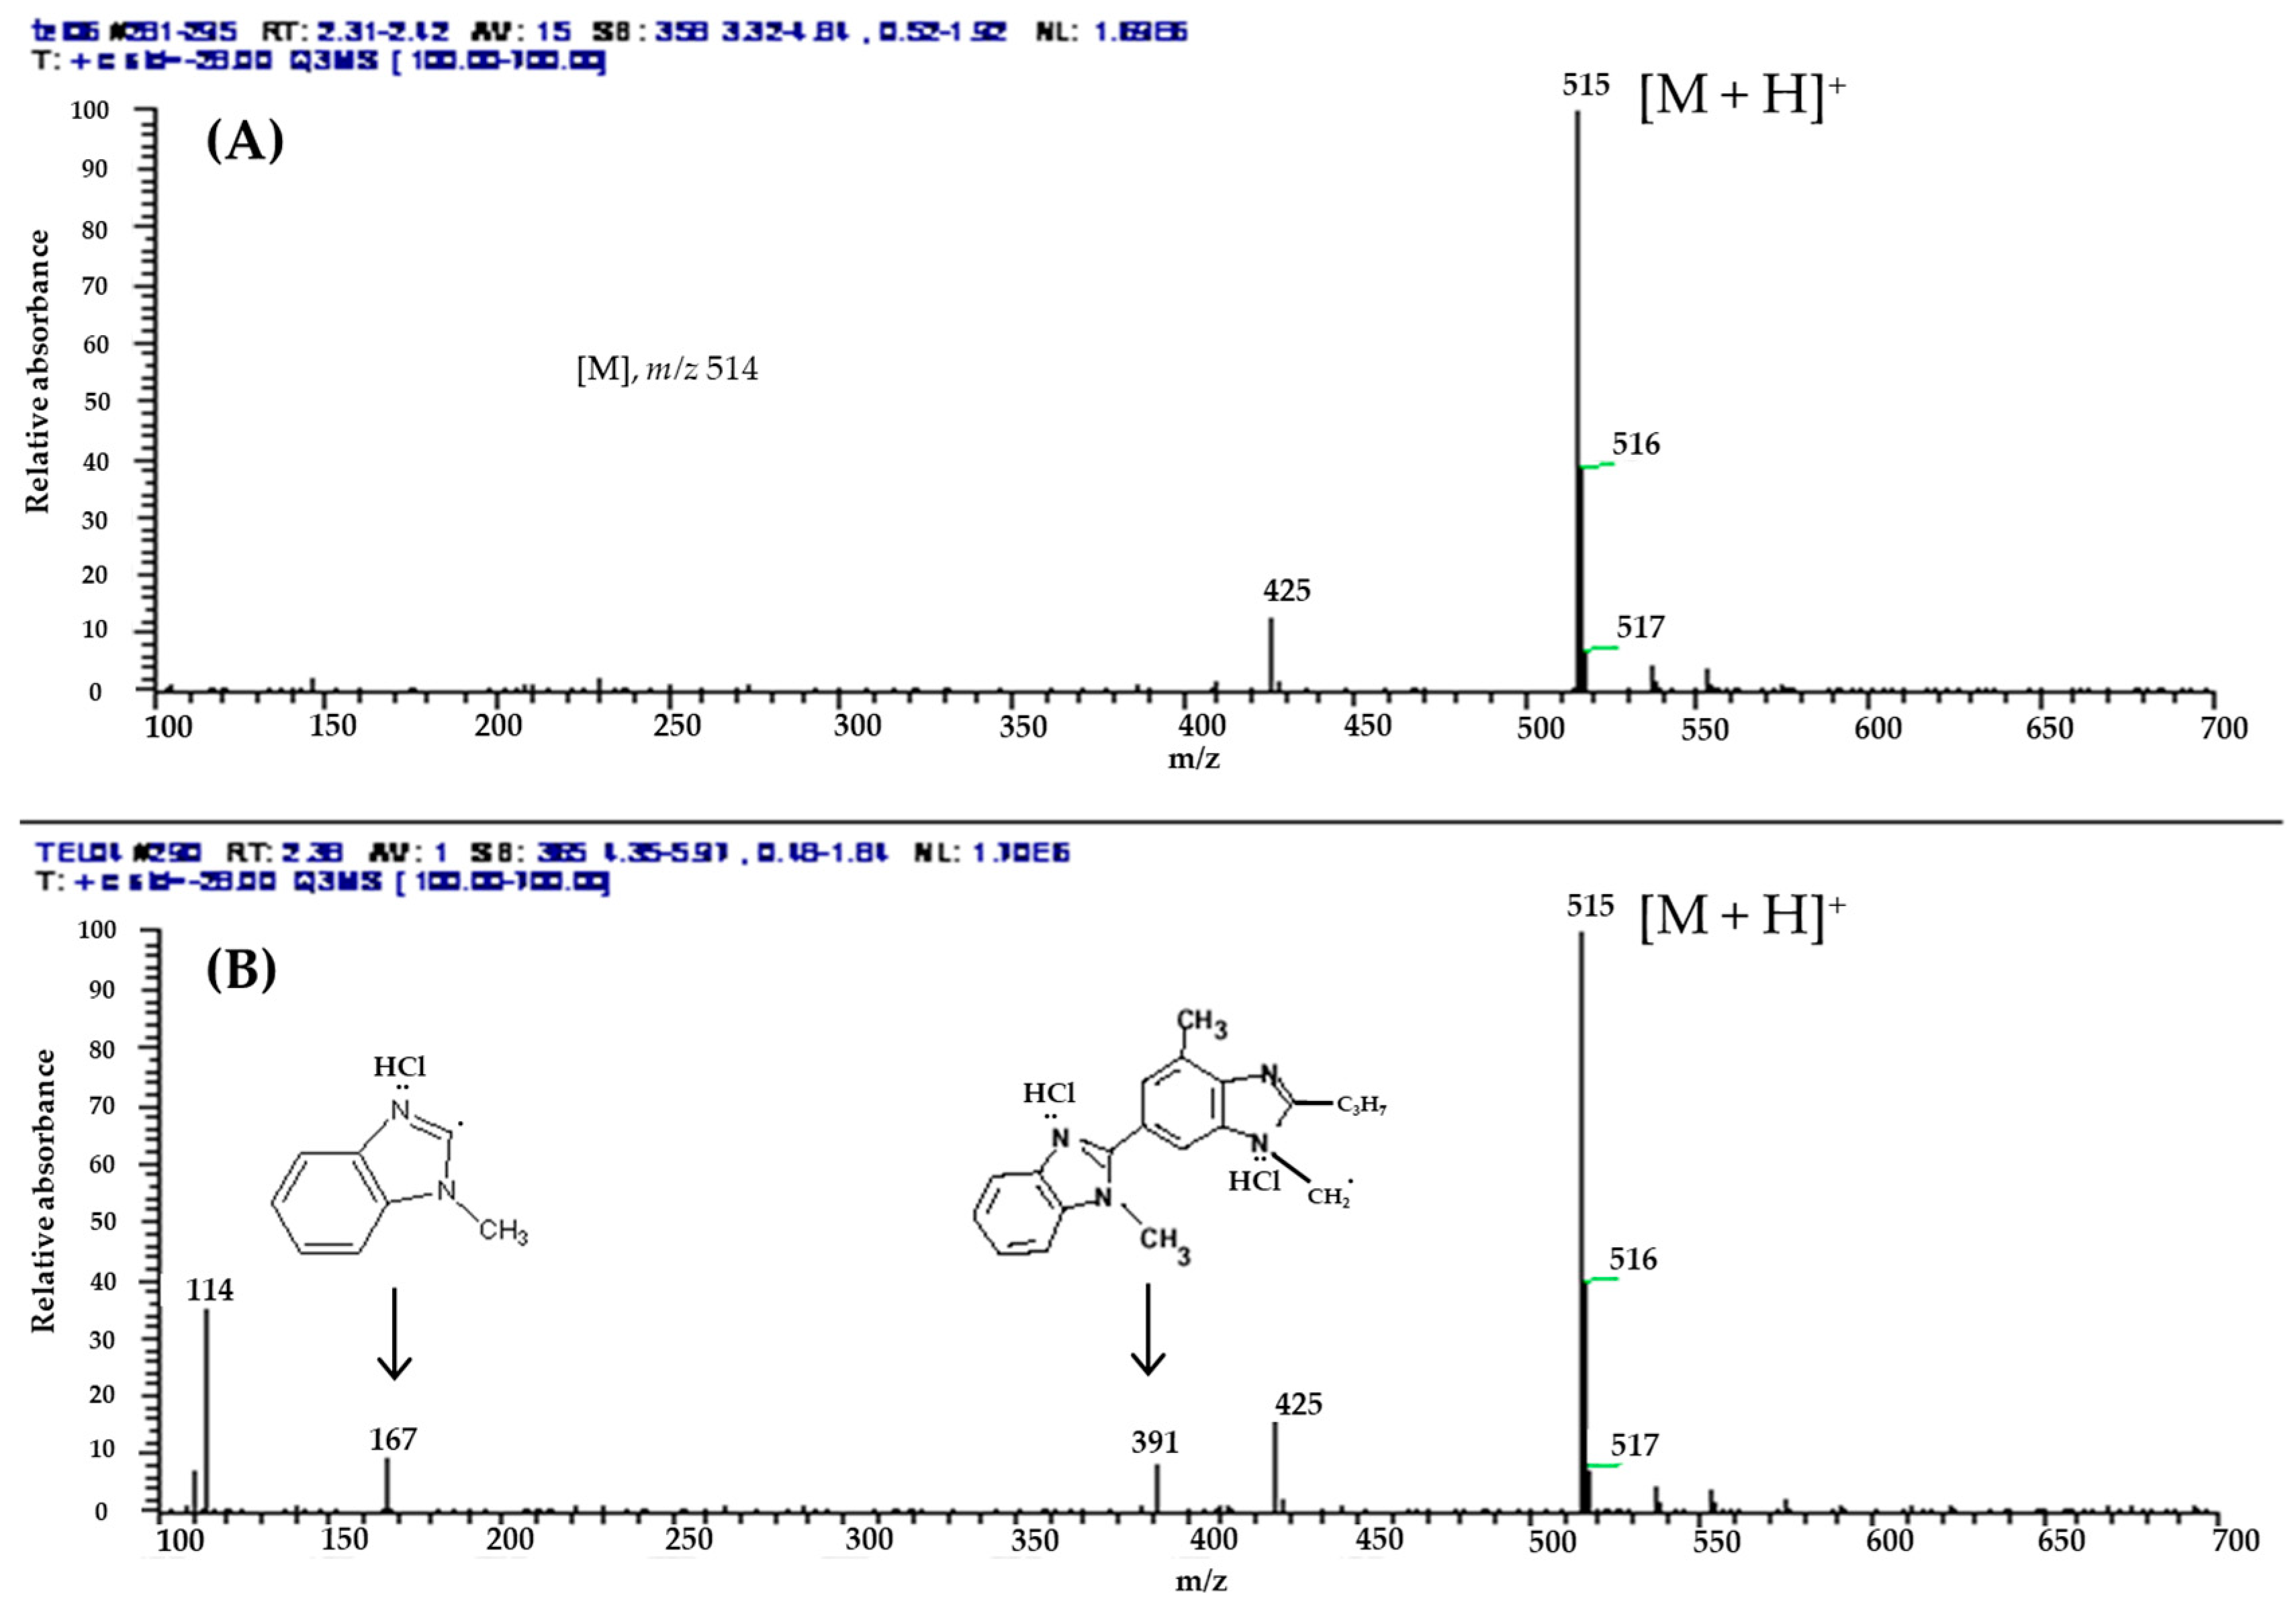
LC–MS Analysis
3.2.5. Stability Study
4. Conclusions
Author Contributions
Funding
Conflicts of Interest
References
- Gibson, M. Pharmaceutical Preformulation and Formulation: A Practical Guide from Candidate Drug Selection to Commercial Dosage Form; CRC Press: Boca Raton, FL, USA, 2016. [Google Scholar]
- Kato, F.; Otsuka, M.; Matsuda, Y. Kinetic study of the transformation of mefenamic acid polymorphs in various solvents and under high humidity conditions. Int. J. Pharm. 2006, 321, 18–26. [Google Scholar] [CrossRef] [PubMed]
- O’Connor, K.M.; Corrigan, O.I. Comparison of the physicochemical properties of the n-(2-hydroxyethyl) pyrrolidine, diethylamine and sodium salt forms of diclofenac. Int. J. Pharm. 2001, 222, 281–293. [Google Scholar] [CrossRef]
- Paulekuhn, G.S.; Dressman, J.B.; Saal, C. Trends in active pharmaceutical ingredient salt selection based on analysis of the orange book database. J. Med. Chem. 2007, 50, 6665–6672. [Google Scholar] [CrossRef] [PubMed]
- Al-Maaieh, A.; Flanagan, D.R. New drug salt formation in biodegradable microspheres. Int. J. Pharm. 2005, 303, 153–159. [Google Scholar] [CrossRef] [PubMed]
- Bandari, S.; Dronam, V.R.; Eedara, B.B. Development and preliminary characterization of levofloxacin pharmaceutical cocrystals for dissolution rate enhancement. J. Pharm. Investig. 2017, 47, 583–591. [Google Scholar] [CrossRef]
- Chadha, R.; Bhandari, S.; Haneef, J.; Khullar, S.; Mandal, S. Cocrystals of telmisartan: Characterization, structure elucidation, in vivo and toxicity studies. CrystEngComm 2014, 16, 8375–8389. [Google Scholar] [CrossRef]
- Duggirala, N.K.; Smith, A.J.; Wojtas, Ł.; Shytle, R.D.; Zaworotko, M.J. Physical stability enhancement and pharmacokinetics of a lithium ionic cocrystal with glucose. Cryst. Growth & Des. 2014, 14, 6135–6142. [Google Scholar]
- Baertschi, S.W.; Alsante, K.M.; Reed, R.A. Solid-state pharmaceutical development: Ensuring stability through salt and polymorph screening. In Pharmaceutical Stress Testing; CRC Press: Boca Raton, FL, USA, 2016. [Google Scholar]
- Elder, D.P.; Holm, R.; de Diego, H.L. Use of pharmaceutical salts and cocrystals to address the issue of poor solubility. Int. J. Pharm. 2013, 453, 88–100. [Google Scholar] [CrossRef] [PubMed]
- Park, J.-B.; Park, Y.-J.; Kang, C.-Y.; Lee, B.-J. Modulation of microenvironmental ph and utilization of alkalizers in crystalline solid dispersion for enhanced solubility and stability of clarithromicin. Arch. Pharm. Res. 2015, 38, 839–848. [Google Scholar] [CrossRef] [PubMed]
- Kirk, J.K. Angiotensin-ii receptor antagonists: Their place in therapy. Am. Family Physician 1999, 59, 3140–3148. [Google Scholar]
- Cagigal, E.; Gonzalez, L.; Alonso, R.M.; Jimenez, R.M. Pk(a) determination of angiotensin ii receptor antagonists (ara ii) by spectrofluorimetry. J. Pharm. Biomed. Anal. 2001, 26, 477–486. [Google Scholar] [CrossRef]
- Benson, S.C.; Pershadsingh, H.A.; Ho, C.I.; Chittiboyina, A.; Desai, P.; Pravenec, M.; Qi, N.; Wang, J.; Avery, M.A.; Kurtz, T.W. Identification of telmisartan as a unique angiotensin ii receptor antagonist with selective pparγ–modulating activity. Hypertension 2004, 43, 993–1002. [Google Scholar] [CrossRef] [PubMed]
- Luo, D.; Kim, J.H.; Park, C.; Oh, E.; Park, J.-B.; Cui, J.-H.; Cao, Q.-R.; Lee, B.-J. Design of fixed dose combination and physicochemical characterization of enteric-coated bilayer tablet with circadian rhythmic variations containing telmisartan and pravastatin sodium. Int. J. Pharm. 2017, 523, 343–356. [Google Scholar] [CrossRef] [PubMed]
- Deppe, S.; Boger, R.H.; Weiss, J.; Benndorf, R.A. Telmisartan: A review of its pharmacodynamic and pharmacokinetic properties. Expert Opin. Drug Metab. Toxicol. 2010, 6, 863–871. [Google Scholar] [CrossRef] [PubMed]
- Thapa, R.K.; Choi, H.-G.; Kim, J.O.; Yong, C.S. Analysis and optimization of drug solubility to improve pharmacokinetics. J. Pharm. Investig. 2017, 2, 95–110. [Google Scholar] [CrossRef]
- Park, C.; Meghani, N.M.; Amin, H.H.; Nguyen, V.H.; Lee, B.-J. Patient-centered drug delivery and its potential applications for unmet medical needs. Ther. Deliv. 2017, 8, 775–790. [Google Scholar] [CrossRef] [PubMed]
- Phuong, H.-L.T.; Tran, T.T.-D.; Lee, S.A.; Nho, V.H.; Chi, S.-C.; Lee, B.-J. Roles of mgo release from polyethylene glycol 6000-based solid dispersions on microenvironmental pH, enhanced dissolution and reduced gastrointestinal damage of telmisartan. Arch. Pharm. Res. 2011, 34, 747. [Google Scholar] [CrossRef] [PubMed]
- Tran, P.H.L.; Tran, H.T.T.; Lee, B.-J. Modulation of microenvironmental ph and crystallinity of ionizable telmisartan using alkalizers in solid dispersions for controlled release. J. Control. Release 2008, 129, 59–65. [Google Scholar] [CrossRef] [PubMed]
- Censi, R.; Di Martino, P. Polymorph impact on the bioavailability and stability of poorly soluble drugs. Molecules 2015, 20, 18759–18776. [Google Scholar] [CrossRef] [PubMed]
- Dinnebier, R.E.; Sieger, P.; Nar, H.; Shankland, K.; David, W.I. Structural characterization of three crystalline modifications of telmisartan by single crystal and high-resolution X-ray powder diffraction. J. Pharm. Sci. 2000, 89, 1465–1479. [Google Scholar] [CrossRef]
- Chae, J.S.; Chae, B.R.; Shin, D.J.; Goo, Y.T.; Lee, E.S.; Yoon, H.Y.; Kim, C.H.; Choi, Y.W. Tablet formulation of a polymeric solid dispersion containing amorphous alkalinized telmisartan. AAPS PharmSciTech 2018, 19, 2990–2999. [Google Scholar] [CrossRef] [PubMed]
- Toda, A. Heating rate dependence of melting peak temperature examined by dsc of heat flux type. J. Therm. Anal. Calorim. 2016, 123. [Google Scholar] [CrossRef]
- McCulley, C.; Vyazovkin, S. Crystallization of ionic salts for calibration of differential scanning calorimeters. Thermochim. Acta 2016, 640, 62–65. [Google Scholar] [CrossRef]
- Pubchem Open Chemistry Database, Compound Summary for Cid 11956638. Available online: https://pubchem.ncbi.nlm.nih.gov/compound/11956638 (accessed on 12 February 2019).
- Yu, W.; Zhou, Z.; Zhu, H.; He, L. Synthesis of telmisartan and its derivatives and evaluation of their biological activities. Chin. J. Org. Chem. 2006, 26, 318–323. [Google Scholar]
- Florence, A.T.; Attwood, D. Physicochemical Principles Of Pharmacy: In Manufacture, Formulation and Clinical Use; Pharmaceutical Press: London, UK, 2015. [Google Scholar]


| Parameters | Telmisartan |
| Chemical structure |  |
| Formula | C33H30N4O2 |
| Solubility | Practically insoluble in water high solubility at high/low pH and poor solubility in pH 3–9 |
| Log P | 3.2 |
| pKa | 3.5, 4.1, 6.0 (weakly acidic) |
| Sample | 1H-NMR (methanol-d4) δ |
|---|---|
| TEL | 1.05 (t, 3H), 1.79~1.86 (t, 3H), 2.63 (s, 3H), 2.93 (t, 2H), 3.30 (s, 2H), 3.82 (s, 3H), 4.85 (s, 2H), 5.63 (s, 2H), 7.17~7.19 (d, 2H), 7.30~7.37 (dd, 5H), 7.37~7.41 (t, 1H), 7.48 (s, 1H), 7.56 (td, 1H), 7.57~7.59 (d, 1H), 7.70~7.75 (t, 3H) |
| TEL/HCl (pH 1.2) | 1.10 (t, 3H), 1.79~1.86 (t, 3H), 2.81 (s, 3H), 3.20~3.33 (t, 2H), 4.0 (s, 3H), 4.9 (s, 2H), 5.87 (s, 2H), 7.30~7.35 (d, 2H), 7.35~7.38 (d, 2H), 7.41~7.45 (t, 1H), 7.53~7.57 (t, 1H), 7.64~7.70 (td, 1H), 7.77~7.86 (td, 3H), 7.90~7.94 (d, 1H), 8.06 (s, 1H) |
| Types of Sample | % Assay (Mean ± SD) | ||
|---|---|---|---|
| Day 1 | Week 4 | Package condition | |
| TEL | 100.00 ± 1.41 | 98.99 ± 2.30 | Open |
| TEL/HCl (pH 1.2) | 99.95 ± 0.41 | 90.90 ± 2.60 | Open |
| TEL/HCl (pH 1.2) | 99.99 ± 0.37 | 99.90 ± 2.23 | Closed |
© 2019 by the authors. Licensee MDPI, Basel, Switzerland. This article is an open access article distributed under the terms and conditions of the Creative Commons Attribution (CC BY) license (http://creativecommons.org/licenses/by/4.0/).
Share and Cite
Park, C.; Meghani, N.M.; Shin, Y.; Oh, E.; Park, J.-B.; Cui, J.-H.; Cao, Q.-R.; Tran, T.T.-D.; Tran, P.H.-L.; Lee, B.-J. Investigation of Crystallization and Salt Formation of Poorly Water-Soluble Telmisartan for Enhanced Solubility. Pharmaceutics 2019, 11, 102. https://doi.org/10.3390/pharmaceutics11030102
Park C, Meghani NM, Shin Y, Oh E, Park J-B, Cui J-H, Cao Q-R, Tran TT-D, Tran PH-L, Lee B-J. Investigation of Crystallization and Salt Formation of Poorly Water-Soluble Telmisartan for Enhanced Solubility. Pharmaceutics. 2019; 11(3):102. https://doi.org/10.3390/pharmaceutics11030102
Chicago/Turabian StylePark, Chulhun, Nileshkumar M. Meghani, Yongkwan Shin, Euichaul Oh, Jun-Bom Park, Jing-Hao Cui, Qing-Ri Cao, Thao Truong-Dinh Tran, Phuong Ha-Lien Tran, and Beom-Jin Lee. 2019. "Investigation of Crystallization and Salt Formation of Poorly Water-Soluble Telmisartan for Enhanced Solubility" Pharmaceutics 11, no. 3: 102. https://doi.org/10.3390/pharmaceutics11030102