Article

Overconsumption of Energy and Excessive Discretionary Food Intake Inflates Dietary Greenhouse Gas Emissions in Australia

1
CSIRO Health and Biosecurity, P.O. Box 10041, Adelaide 5000, South Australia, Australia
2
CSIRO Agriculture, Private Bag 10, Clayton South 3169, Victoria, Australia
3
Sustainability Assessment Program (SAP), School of Civil and Environmental Engineering, UNSW Australia, Sydney 2052, NSW, Australia
*
Author to whom correspondence should be addressed.
Nutrients 2016, 8(11), 690; https://doi.org/10.3390/nu8110690
Submission received: 2 June 2016 / Revised: 4 October 2016 / Accepted: 25 October 2016 / Published: 31 October 2016

Abstract

:
Population dietary guidelines have started to include information about the environmental impacts of food choices, but more quantifiable evidence is needed, particularly about the impacts associated with discretionary foods. This paper utilised the 2011–2012 Australian Health Survey food intake data along with a highly disaggregated input–output model to estimate the greenhouse gas emissions (GHGe) of Australians’ dietary intake, and compare current patterns of eating which vary in diet quality and GHGe to the recommended diet. The average dietary GHGe were 18.72 ± 12.06 and 13.73 ± 8.72 kg CO2e/day for male and female adults, respectively. The correlation between total energy and GHGe was r = 0.54 (p < 0.001). Core foods contributed 68.4% and discretionary foods 29.4%. Within core foods, fresh meat and alternatives (33.9%) was the greatest contributor. The modelling of current dietary patterns showed the contribution of discretionary foods to GHGe was 121% greater in the average diet and 307% greater in the “lower quality, higher GHGe” diet compared to the recommended diet. Reducing discretionary food intake would allow for small increases in emissions from core foods (in particular vegetables, dairy and grains), thereby providing a nutritional benefit at little environmental expense. Public health messages that promote healthy eating, eating to one’s energy needs and improved diet quality will also contribute to lowering GHGe.

1. Introduction

Dietary guidelines issued by governments are mainly focussed on nutrition and health issues related to nutrient adequacy, overconsumption and lifestyle diseases. However, increasingly, consumers and government agencies are interested in the environmental impacts of the food supply, how it is consumed and how to minimise food wastage. This interest has resulted in health and sustainability being integrated into dietary recommendations [1,2,3,4]. The Food and Agriculture Organization of the United Nations has defined sustainable diets as “those with low environmental impacts which contribute to food and nutrition security and to healthy life for present and future generations. Sustainable diets are protective and respectful of biodiversity and ecosystems, culturally acceptable, accessible, economically fair and affordable; nutritionally adequate, safe and healthy; while optimizing natural and human resources” [5].
Internationally, there is the rapid growth in the topic of sustainable diets, mostly focussed on the greenhouse gas emissions (GHGe) associated with dietary intake [6,7,8,9,10,11]. A feature of this literature is the emphasis on the environmental side of the discussion, leading to the exploration of diets with fewer livestock products as these usually feature prominently in the GHGe profile of most diets [10,12,13,14]. However, there are many factors which need to be considered in defining and promoting sustainable diets, foremost the trade-off between environmental responsibility and nutritional adequacy [8]. Approaches which solely target changes in consumption of single food products, such as red meat, have limited use given that populations consume a range of food in differing quantities in a given dietary pattern. In addition, focusing on the environmental benefits of more specialised diets such as vegetarian or vegan patterns of eating is worthwhile on the global scale but may have limited use when trying to develop a science base for population dietary guidelines [15]. Excluding whole food groups can be problematic. For example, animal products are a key source of several micronutrients in the Western diet, which can be challenging to replace when all animal products are excluded.
More recent work examining whole dietary patterns has shown synergies between what is nutritionally and environmentally healthy [1,16,17]. In previous research undertaken in Australia, using intake data from 1995, we found that consuming a diet consistent with the Australian Dietary Guidelines would lower greenhouse gas emissions by 25% relative to the average diet at that time, and also result in fewer discretionary food choices meaning a healthier, and more environmentally friendly, diet overall. Research conducted in the United Kingdom has also shown that changing population food choices to meet their government dietary requirements could help towards mitigating climate change [18], while other European studies have shown the Mediterranean diet is a healthy and sustainable approach to promote [1,19]. However, these findings may be country specific depending on how their population’s current diet compares to guidelines in terms of both diet quality and quantity of food consumed. Another European study has shown changes towards a healthier diet results in minimal environmental benefits [20], or even in the French context, diets which were highest in nutritional quality were not lowest in greenhouse gas emissions [21,22,23]. A recent review of studies linking the nutritional composition of dietary patterns to their greenhouse gas emissions, concluded that some diets that are lower in greenhouse gas emissions are actually higher in sugar and lower in micronutrients [6].
Overconsumption of energy, regardless of the food source of this energy, also relates to the greenhouse gas emission of dietary intake. Vieux et al. (2012) showed a significant and positive relationship between diet-related greenhouse gas emissions and energy intake in a representative sample of French adults [24]. Eating beyond one’s needs contributes to avoidable environmental impacts, and promoting a reduction in energy intake is consistent with messages of healthy eating, healthy weight and obesity prevention.
In Australia, the national dietary guidelines include a brief appendix which addresses environmental issues, highlighting the detrimental impacts of overconsumption, some food production systems and food wastage, as well as the benefits of eating according to the guidelines, choosing seasonal and local products and products with lower environmental impacts [25]. Increasingly countries are also considering the sustainability and implications of their guidelines for healthy diets [1,26,27,28]. While nutritional guidelines are starting to incorporate this environmental perspective, there is still a real need to provide consumers with more scientifically accurate, product and country specific information on the environmental impacts of their food choices and dietary patterns. This involves quantifying the differential impacts between broad core or “healthy” food groups such as meat, dairy, vegetables and grains, as well as considering the environmental impacts of individual food products, including those associated with surplus consumption such as discretionary foods.
The release of the 2011–2013 Australian Health Survey and the recent availability of highly disaggregated greenhouse gas emissions factors for Australia have provided an opportunity to re-examine the greenhouse gas emissions from the contemporary Australian diet. The aim of this paper is to utilise this rich dataset on Australians’ food consumption along with the updated estimates of food sector greenhouse gas emissions to quantify the greenhouse gas emissions of the current Australian daily diet and compare current patterns of eating, which vary in the diet quality and greenhouse gas emissions, to the diet recommended in the population dietary guidelines.

2. Materials and Methods

The general approach and principal methodological challenge involved integrating the latest Australian Health Survey data on food consumption of Australian adults with a highly disaggregated input–output model (see Section 2.2) to estimate the greenhouse gas emissions of the Australian populations’ dietary intake. The integrated model was then used to explore the relationship between GHGe and diet quality.

2.1. Dietary Intake Data

The 2011–2013 Australian Health Survey (AHS) is the most recent and most comprehensive population health survey conducted in Australian by the Australian Bureau of Statistics (ABS). The National Nutrition and Physical Activity Survey formed part of the AHS and involved collecting detailed dietary intake information from over 12,000 participants (adults and children) across Australia [29]. Dietary intake data were collected using a 24-h recall process, whereby participants recall all foods and beverages consumed on the day prior to the interview. We used one day of dietary recall available from 9341 Australian adults. To ensure the resulting sample was representative of the Australian population, the survey was conducted using a stratified multistage area sample of private dwellings, which means that all sections of the population were represented by the sample. Detailed sampling and demographic information of the sample is available from the Australian Bureau of Statistics [30].
To allow food and nutrient intakes to be estimated from the dietary intake data, the Australian Bureau of Statistics uses a classification system to be able to group similar foods together. This classification system is based on a three-tiered structure. Each unique food item has an 8-digit survey ID assigned. The first two digits of this ID refer to the major food group the food belongs to, based on its key ingredient. There are 24 major food groups, which are then broken down into 132 sub-major food groups, which are further broken down into 500 minor groups [29].
Using this classification system, each individual food (approximately 5500 items including miscellaneous foods and supplements) was assigned an environmental sector code, predominately at the 8 digit level. Single component foods such as chicken was assigned as 100% to the corresponding environmental code, whereas multicomponent foods or mixed dishes, such as chicken and vegetable casserole, were assigned as a proportion of their ingredients up to a maximum of five ingredients. The proportion for these dishes was based on the recipe files provided by the ABS that accompanying the Australian Health Survey [31]. Some foods or dishes for which this detailed disaggregation procedure was carried out include: tea and coffee with varying amount of milk/water; porridge; sandwiches, wraps and hamburgers; mixed dishes where meat was the main ingredient and mixed dishes where a cereal grain was the main ingredient. Table 1 provides some examples of this disaggregation into ingredients. The meat and alternatives (such as beef, lamb, chicken, and egg) and cereal grains (such as bread, pasta, rice, and noodles) source was assigned accordingly for each food.

2.2. Greenhouse Gas Emissions Data

The GHGe associated with different food products were estimated using environmentally extended input–output (EEIO) analysis. EEIO is a commonly used method for estimating the full supply chain environmental impacts of food consumption on the basis of household expenditure data, which act as the final demand vector in an environmentally extended Leontief model [20,27,32,33]. The greenhouse gas emissions factors include the total CO2 equivalents from all sources encompassing the entire life cycle (including the full life cycle impacts of all upstream inputs) from the point of production to the point of purchase. In this study we employ a highly disaggregated multi-regional supply-use table (SUT) for the Australian economy for 2009 sourced from the Industrial Ecology Virtual Laboratory [34] with greenhouse gas extensions supplied by the National Greenhouse Gas Inventory [35]. The custom-made national SUT extracted for the purposes of this study has 200 economic sectors, including 192 agri-food sectors. The table is based on the official input–output tables published by the Australian Bureau of Statistics (ABS) for 2009/10 [36] which have been disaggregated from 111 sectors into 1284 products based on detailed industry–product relationships [37] and subsequently rebalanced using a constrained optimisation balancing algorithm [34].
Each food or ingredient item in the dietary data classification system was matched as closely as possible to one of the 192 agri-food sector categories. The level of food product disaggregation employed in this study is thus considerably higher compared to previous EEIO studies related to food consumption. Whilst process-based life cycle assessment can offer comparable levels of product detail, it lacks the upstream process completeness of EEIO due to truncation errors arising from the need to define a system boundary. The original carbon dioxide equivalents (CO2e) GHGe factors [35] were disaggregated from around 80 sectors to now 200 sectors (192 of which were food-related), on the basis of economic output weights. This has allowed for a more refined matching of raw agricultural or processed food products to the individual foods within the classification system, thereby avoiding the common pitfall of aggregating product data to match the input–output classification which can give rise to errors in the form of aggregation bias [38]. Additional considerations were necessary to calculate the carbon intensity of different fresh meat sectors in order to adequately distinguish between different meat products, following the procedure previously described in Hendrie, Ridoutt, Wiedmann and Noakes [39]. The GHGe intensities per dollar (A$) in basic prices (not including margins) were finally converted to purchasers prices using the latest purchaser to basic price relationships from the ABS input–output tables [36] to ensure compatibility with consumer food expenditure data. Greenhouse gas emissions intensities per dollar are available as Table A1.

2.3. Estimation of Dietary Greenhouse Gas Emissions

To integrate the consumption data (in grams) with the greenhouse gas emissions factors (in dollars), grams of food needed to be expressed in dollars using current market price. The input–output tables are in basic prices whereas consumer expenditure and market prices are in purchaser prices (all transportation margins and taxes are included). A conversion is necessary to ensure compatibility. The ABS publishes the ratios necessary to carry out this conversion for each product as part of the input–output table datasets [40]. To convert grams of food consumed to dollars of food consumed (as purchase price) market price per gram for each food item was assigned using a contemporary Australian supermarket pricing database [41]. The median price for a food category was calculated and assigned to food items using a similar approach to the ingredients described above. Single food items were assigned a 100% of the price of that ingredient, whereas multicomponent foods or mixed dishes were assigned a total price in the same proportion as the ingredients.
To convert between raw and cooked products in the input–output model and food consumption data, adjustment factors were applied. Cooked meat to raw meat was multiplied by a factor of 1.4 and cooked rice and pasta back to the raw ingredient by dividing by a factor of 3. A total greenhouse gas emission factor per food item as consumed was calculated as the adjusted grams consumed × price per gram × greenhouse gas emissions per dollar.

2.4. Statistical Analysis

Intake of individual foods and components from mixed dishes were aggregated up for the day and total food group intake (serves), energy (kilojoules) and associated greenhouse gas emissions for each individual on the day they were surveyed were estimated. Population means and standard deviations were estimated and all data weighted using the person weighting factor provided by the ABS. The food groups of interest were the five core food groups and discretionary foods as described in the Australian Dietary Guidelines. Core food groups include fruit, vegetables, dairy and alternatives, meat and alternatives, breads cereal and grain foods, as well as unsaturated fats and oils. Within meat and alternatives, we examined red meat (beef, lamb and pork), poultry, fish, vegetarian alternatives (tofu, eggs, and nuts) and other native meats and offal. Sub groups within discretionary foods were also examined including processed meat and meat dishes, alcoholic beverages, sugar sweetened beverages, dairy desserts, savoury and sweet biscuits, sweet and savoury pies, muesli bars and confectionary, and fried potatoes.
To examine the relationship between overconsumption of energy and dietary greenhouse gas emissions, individuals’ minimum energy requirement calculated as their basal metabolic rate (based on their age, gender and weight) was compared to their reported energy intake (as a proportion, i.e., intake divided by BMR), where the higher the number the greater the likelihood of overconsumption of energy relative to requirement.

2.5. Modelling of Dietary Pattern Scenarios

Individuals were sorted into four quadrants, ranking them as either higher or lower diet quality, and higher or lower dietary GHGe in comparison to the mean (and removed those individuals who were within 0.25 standard deviations of the mean for both diet quality and GHGe). Here, diet quality was estimated using the Dietary Guideline Index which reflects overall compliance with the Australian Dietary Guidelines in terms of the amount and quality of food consumed from the core food groups, discretionary foods and beverages, as well as diet variety [42]. The index is comprised of 11 components and individuals receive a diet quality score out of 100, where a higher score reflects greater compliance with the Guidelines.
In this analysis, we have modelled the greenhouse gas emissions from three current eating patterns and compared these to the recommended dietary intake pattern from the Australian Guide to Healthy Eating (AGHE). In summary:
(1)
Current pattern 1: Best of existing Australian adults’ intake “higher quality, lower GHGe”. This group as a whole had an average daily diet quality score of 59 out of 100, and average GHGe of 8.5 kg CO2e/day.
(2)
Current pattern 2: Worst of the existing Australian adults’ intake “lower quality, higher GHGe”. This group as a whole had an average daily diet quality score of 27 out of 100, and average GHGe of 26.3 kg CO2e/day.
(3)
Current pattern 3: The average existing Australian adults’ intake. This group as a whole had an average daily diet quality score of 43 out of 100, and average GHGe of 15.3 kg CO2e/day.
(4)
Recommended pattern: The recommended dietary intake pattern as per AGHE. This dietary pattern would receive a diet quality score of 100 out of 100. The AGHE recommends number of serves of each core food group and emphasises choosing a variety of foods, but does not prescribe specific foods. For example, in the case of vegetables, it is recommended to eat a variety of types and colours. Greenhouse gas emissions will vary for different age and gender groups depending of serves of food recommended (see Table 3 for recommended serves and GHGe for males and females 19–50 years).

3. Results

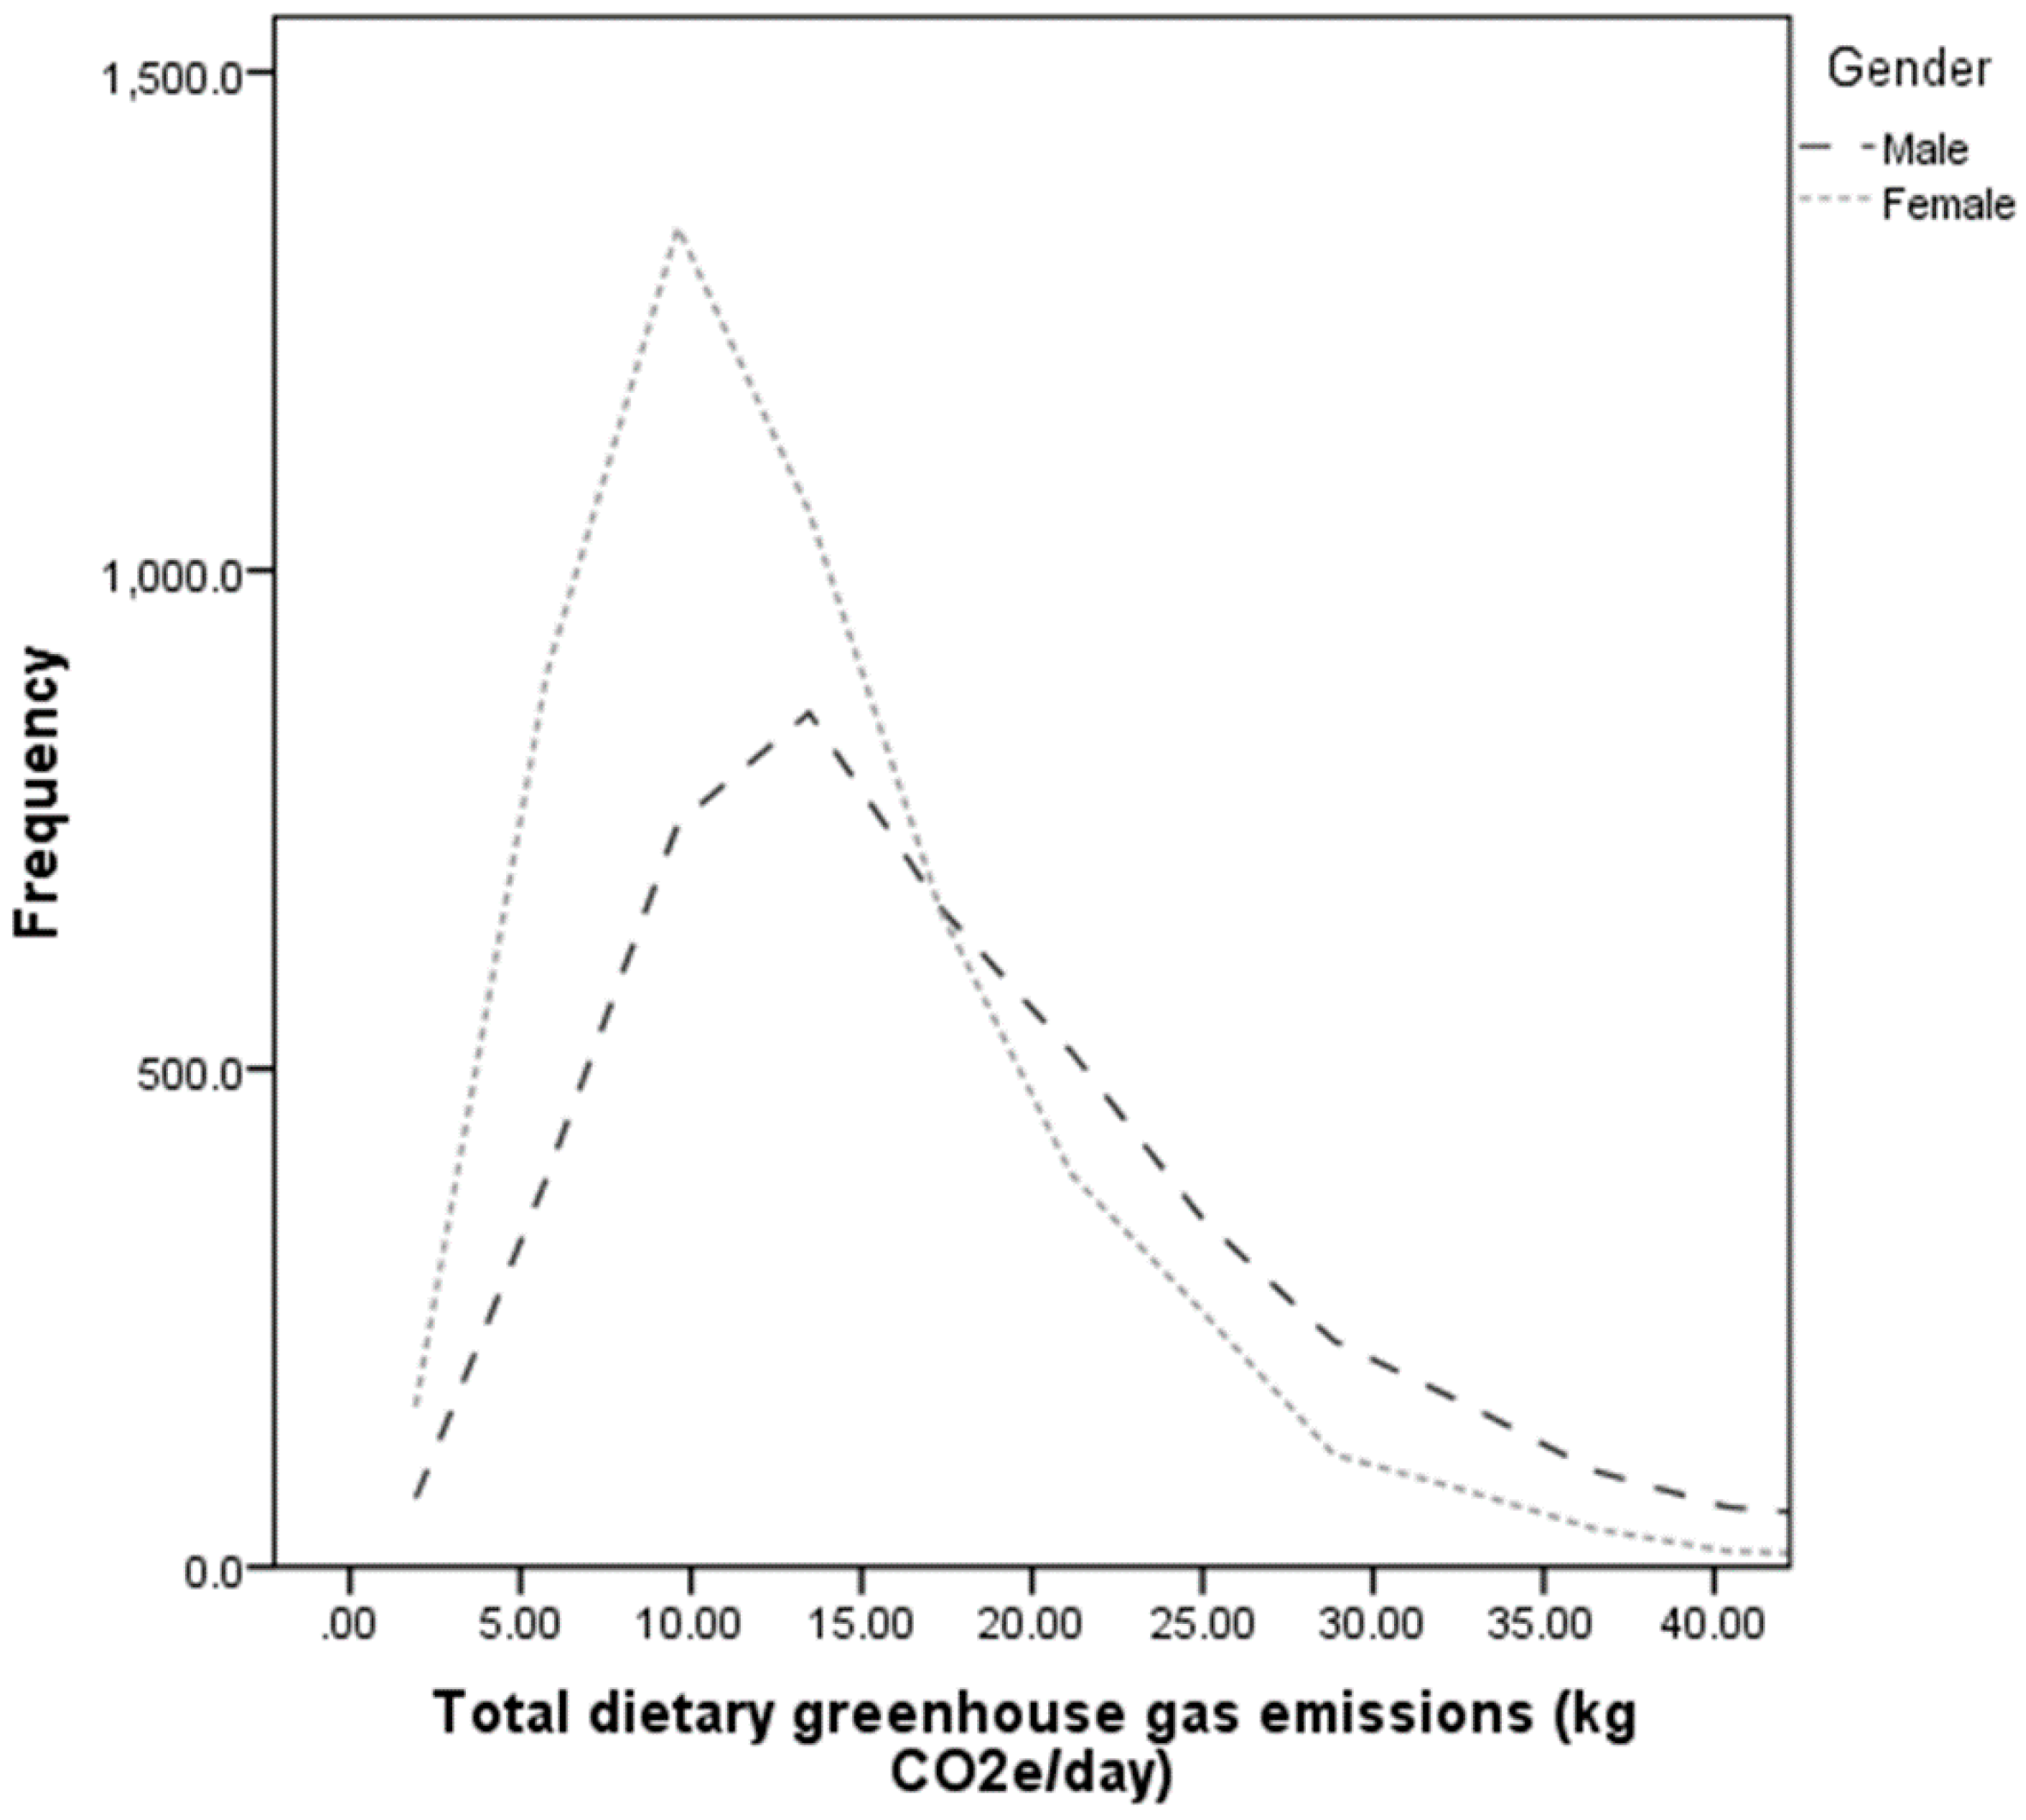
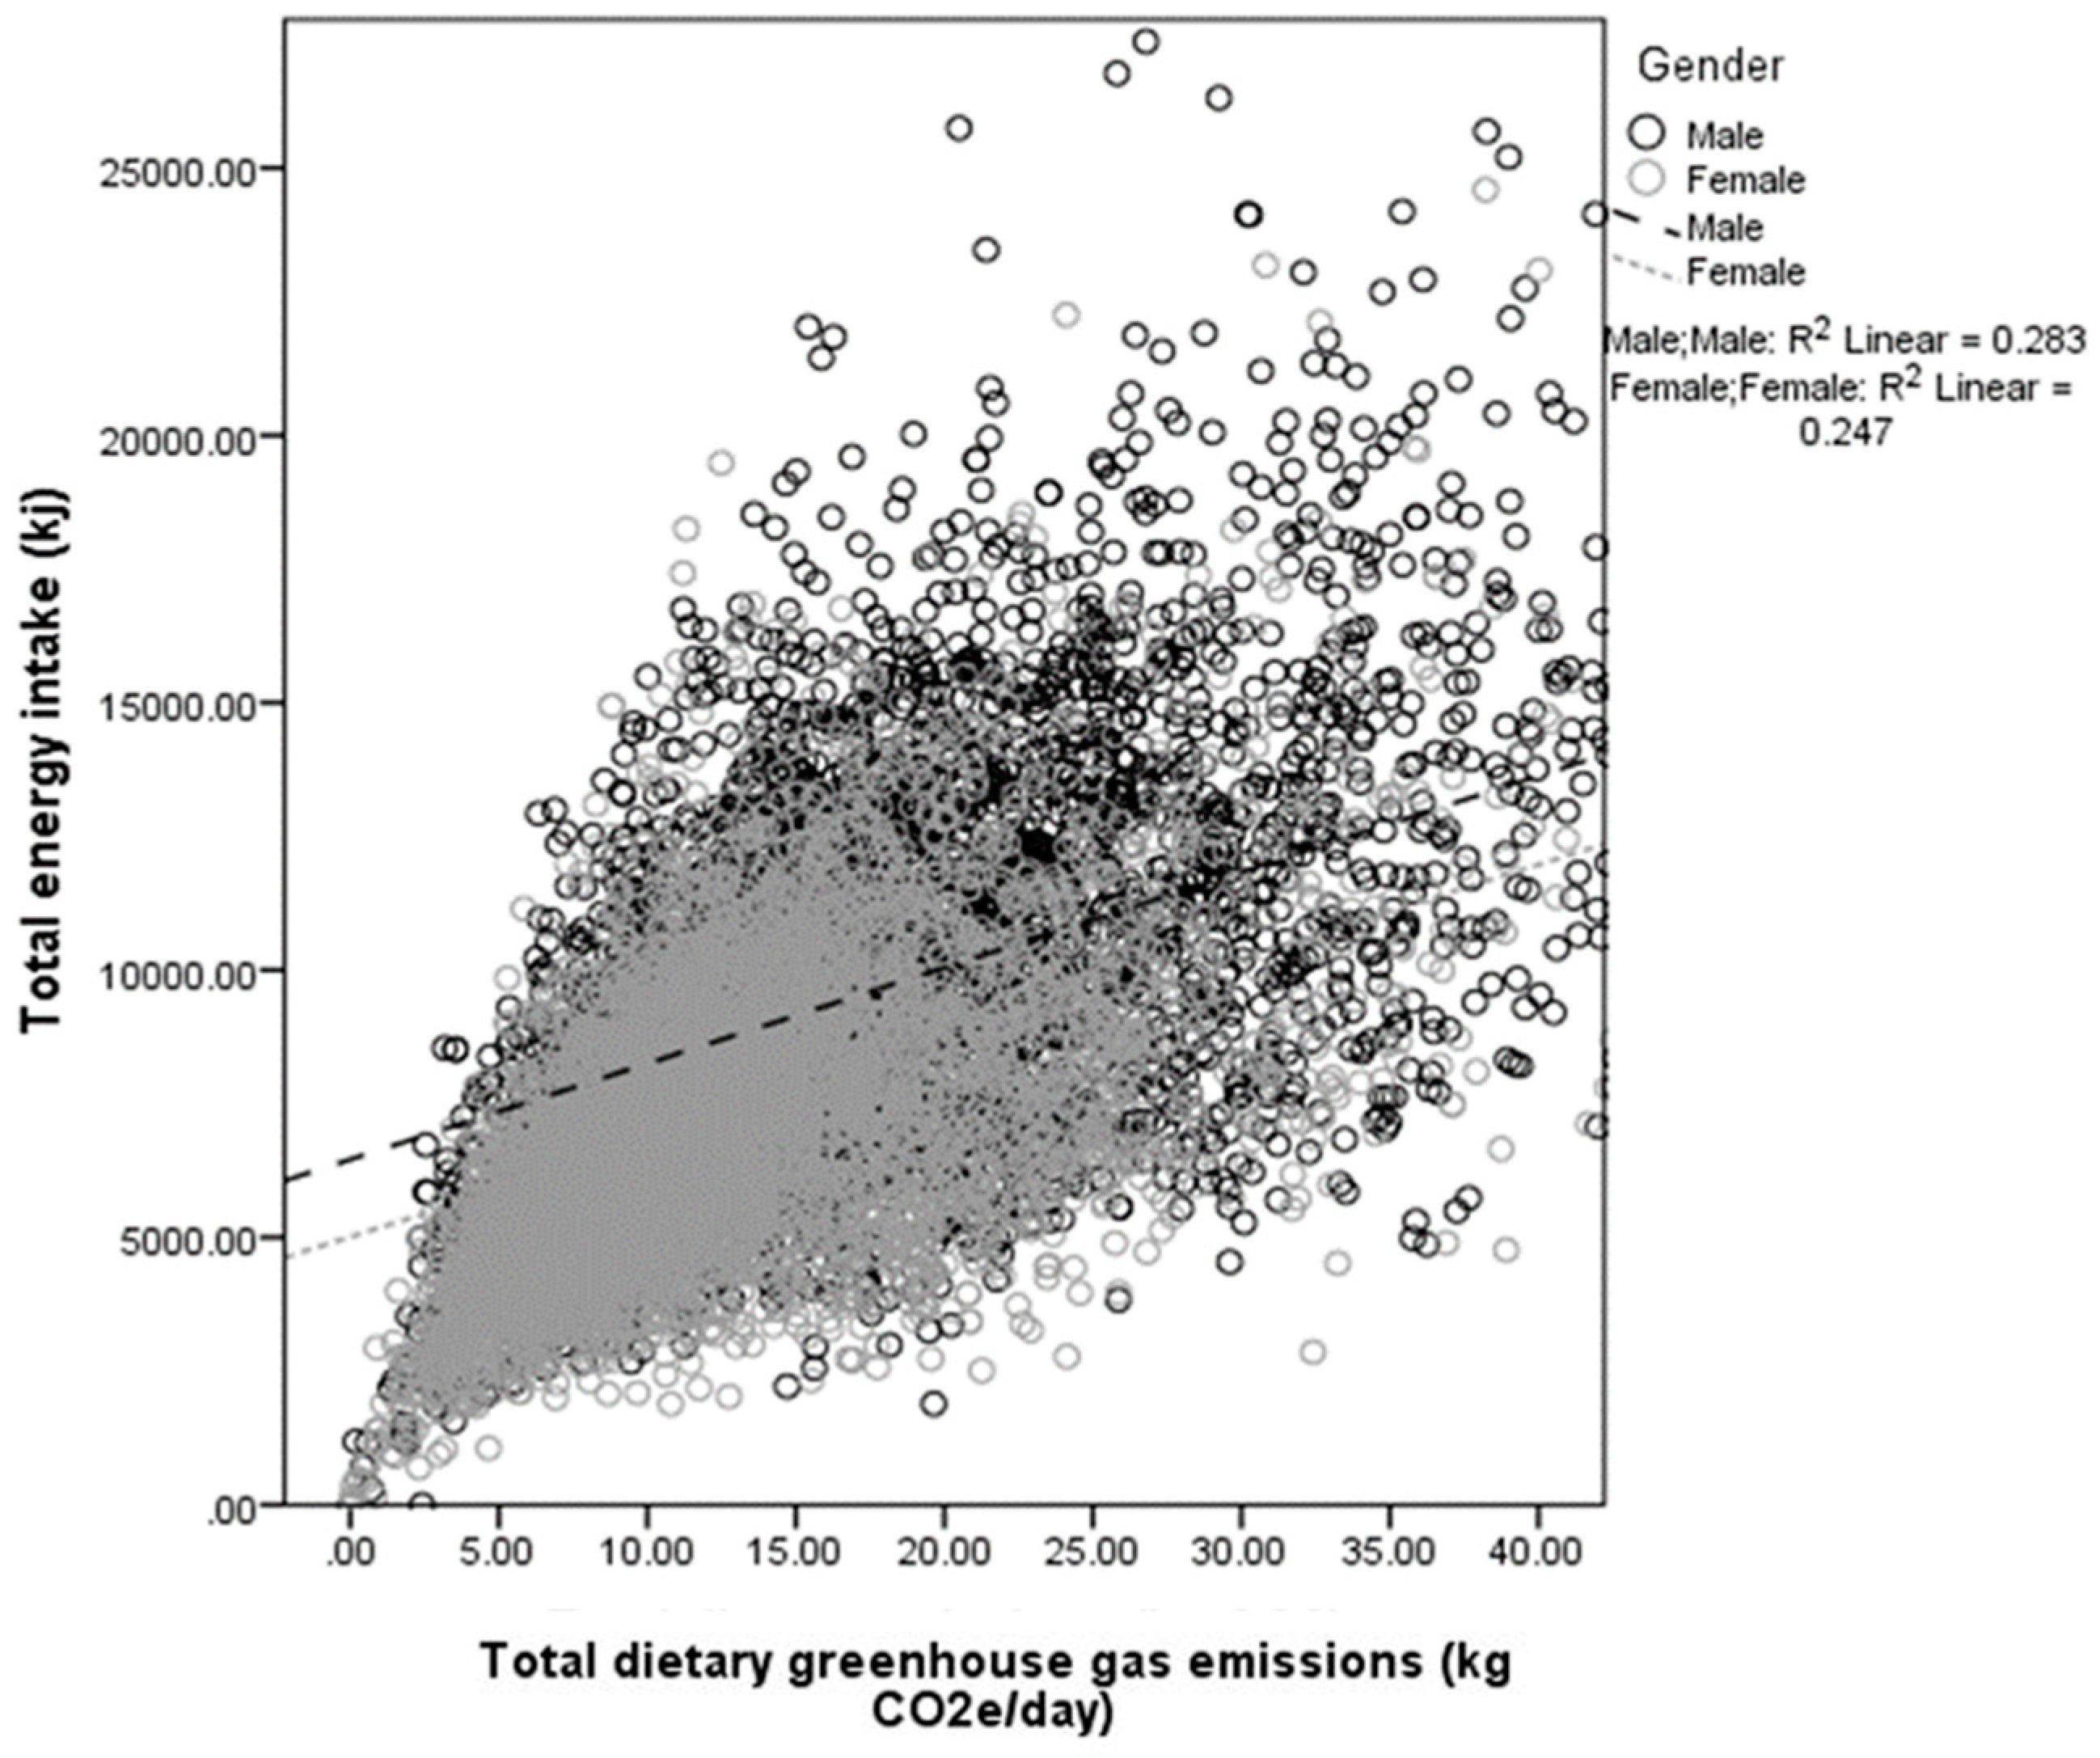
3.1. Total Dietary Greenhouse Gas Emissions and Energy Intake

Figure 1 shows the distribution of total dietary GHGe for adult males and females. The average ± standard deviation GHGe and energy intake for males was 18.72 ± 12.06 kg CO2e/day and 9954 ± 3912 kJ, and for females 13.73 ± 8.72 kg CO2e/day and 7420 ± 2940 kJ. There was a significant positive correlation between total energy consumed and total dietary GHGe (Figure 2). The Pearson correlation coefficient was r = 0.54 (p < 0.001) for adults overall (males r = 0.52, females r = 0.47, p < 0.001). The correlation between amount of food consumed (total food in grams) and dietary GHGe was weaker but significant (males r = 0.36, females r = 0.30, overall r = 0.37, all p < 0.001). The variation around the line of best fit (indicated by the R2 value) is also greater when total grams of food is plotted against GHGe (R2: Males = 0.133, Females 0.093), than for energy against GHGe (Males R2 = 0.283, Females R2 = 0.247, Figure 2). There was also a significant and positive relationship between total dietary GHGe and overconsumption of energy in the sample as a whole sample (r = 0.48, p < 0.001), as well as in males and females separately (males r = 0.48, females r = 0.46, p < 0.001).

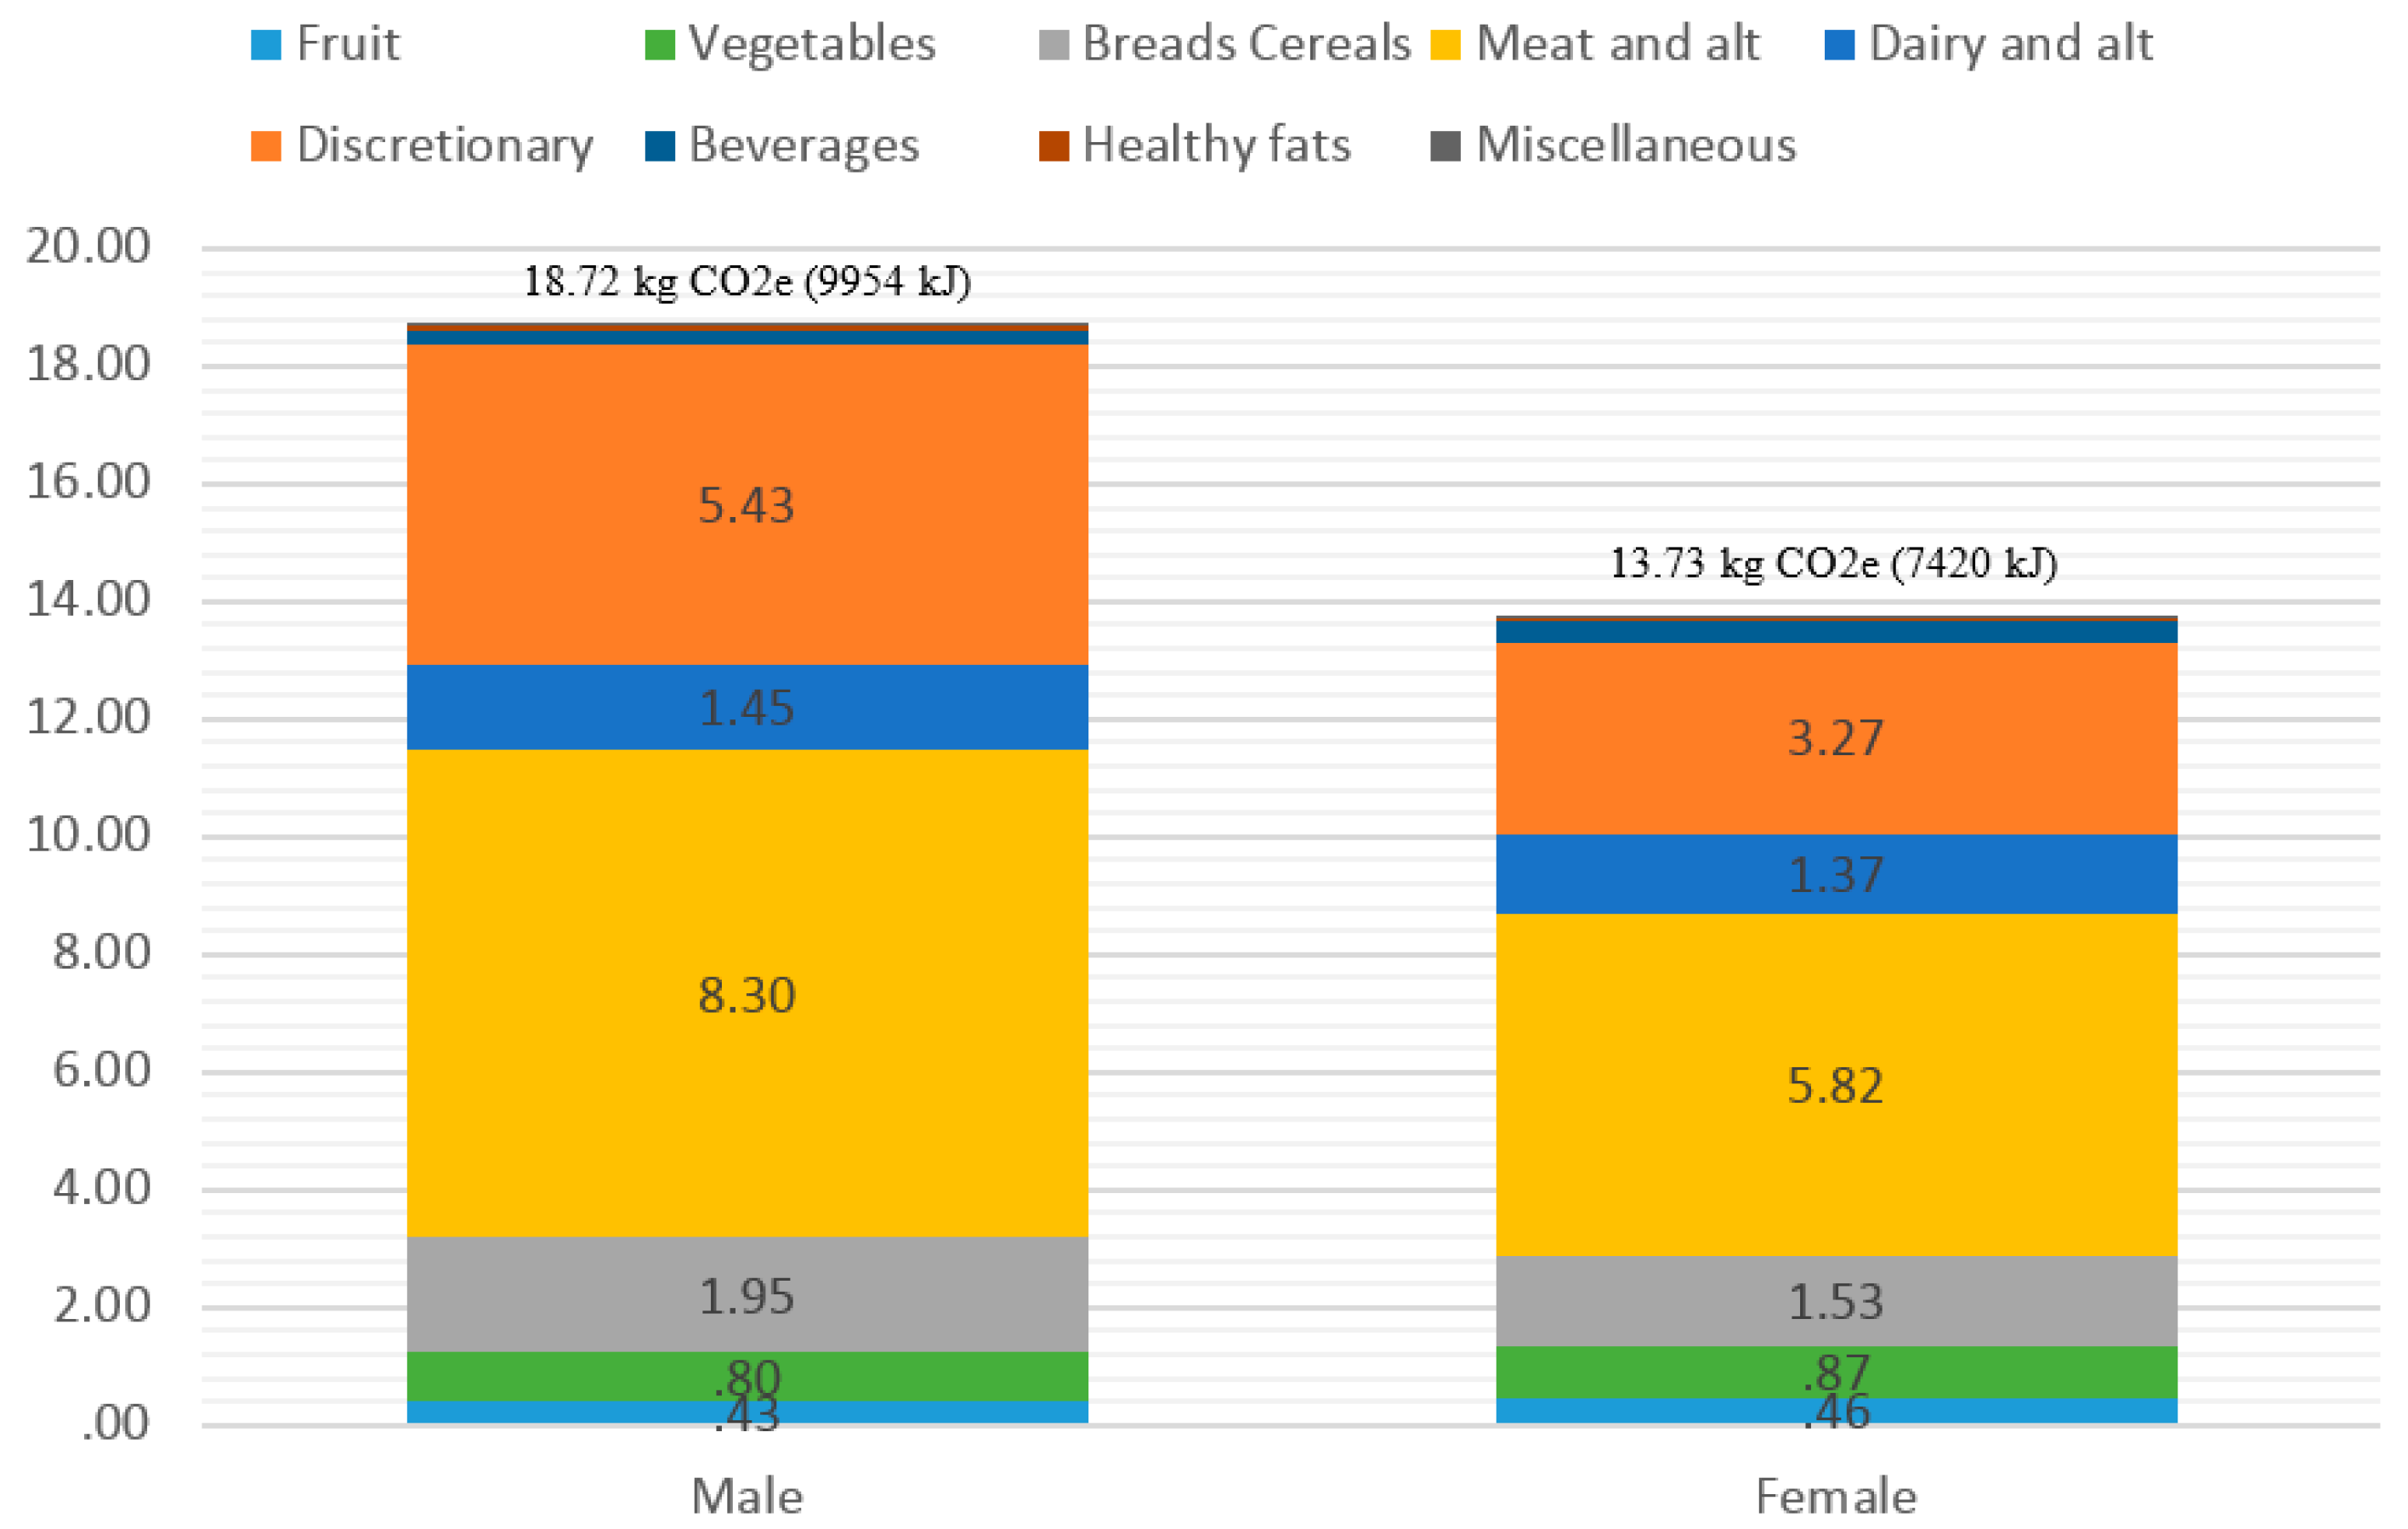
3.2. Contributions of Food Groups to Total Dietary Greenhouse Gas Emissions

Figure 3 shows the cumulative contribution of each food group to total dietary GHGe for males and females and Table 2 shows each food group’s contribution as a percentage of total dietary GHGe. The standard deviation is also shown in Table 2 to highlight the large variability in GHGe between individual diets. Despite females having a lower dietary GHGe, the relative distribution of food groups to total GHGe is similar between males and females. Core foods contributed 68.4% to total GHGe and discretionary foods 29.4%. Of the core food groups, fruit (3.5%) and vegetables (6.5%) were the two smallest contributors to total dietary GHGe, and fresh meat and alternatives (33.9%) and discretionary foods (29.4%) the two highest contributors. Within the fresh meat and alternatives food group, red meat contributed 4.86 kg CO2e/day (18.8% of total GHGe) and poultry 2.24 kg CO2e/day (10.9%) to a total of 18.72 kg CO2e/day for males and for females the contributions were 3.20 kg CO2e/day (16.5%) and 1.61 kg CO2e/day (11.0%) from a total of 13.73 kg CO2e/day, respectively. From the subcategories within discretionary foods, processed meats (including dishes containing meat such as burgers, tacos and pizza) and alcoholic beverages were the two highest contributors, contributing 11.3% and 5.7% to total GHGe, respectively (Table 2).

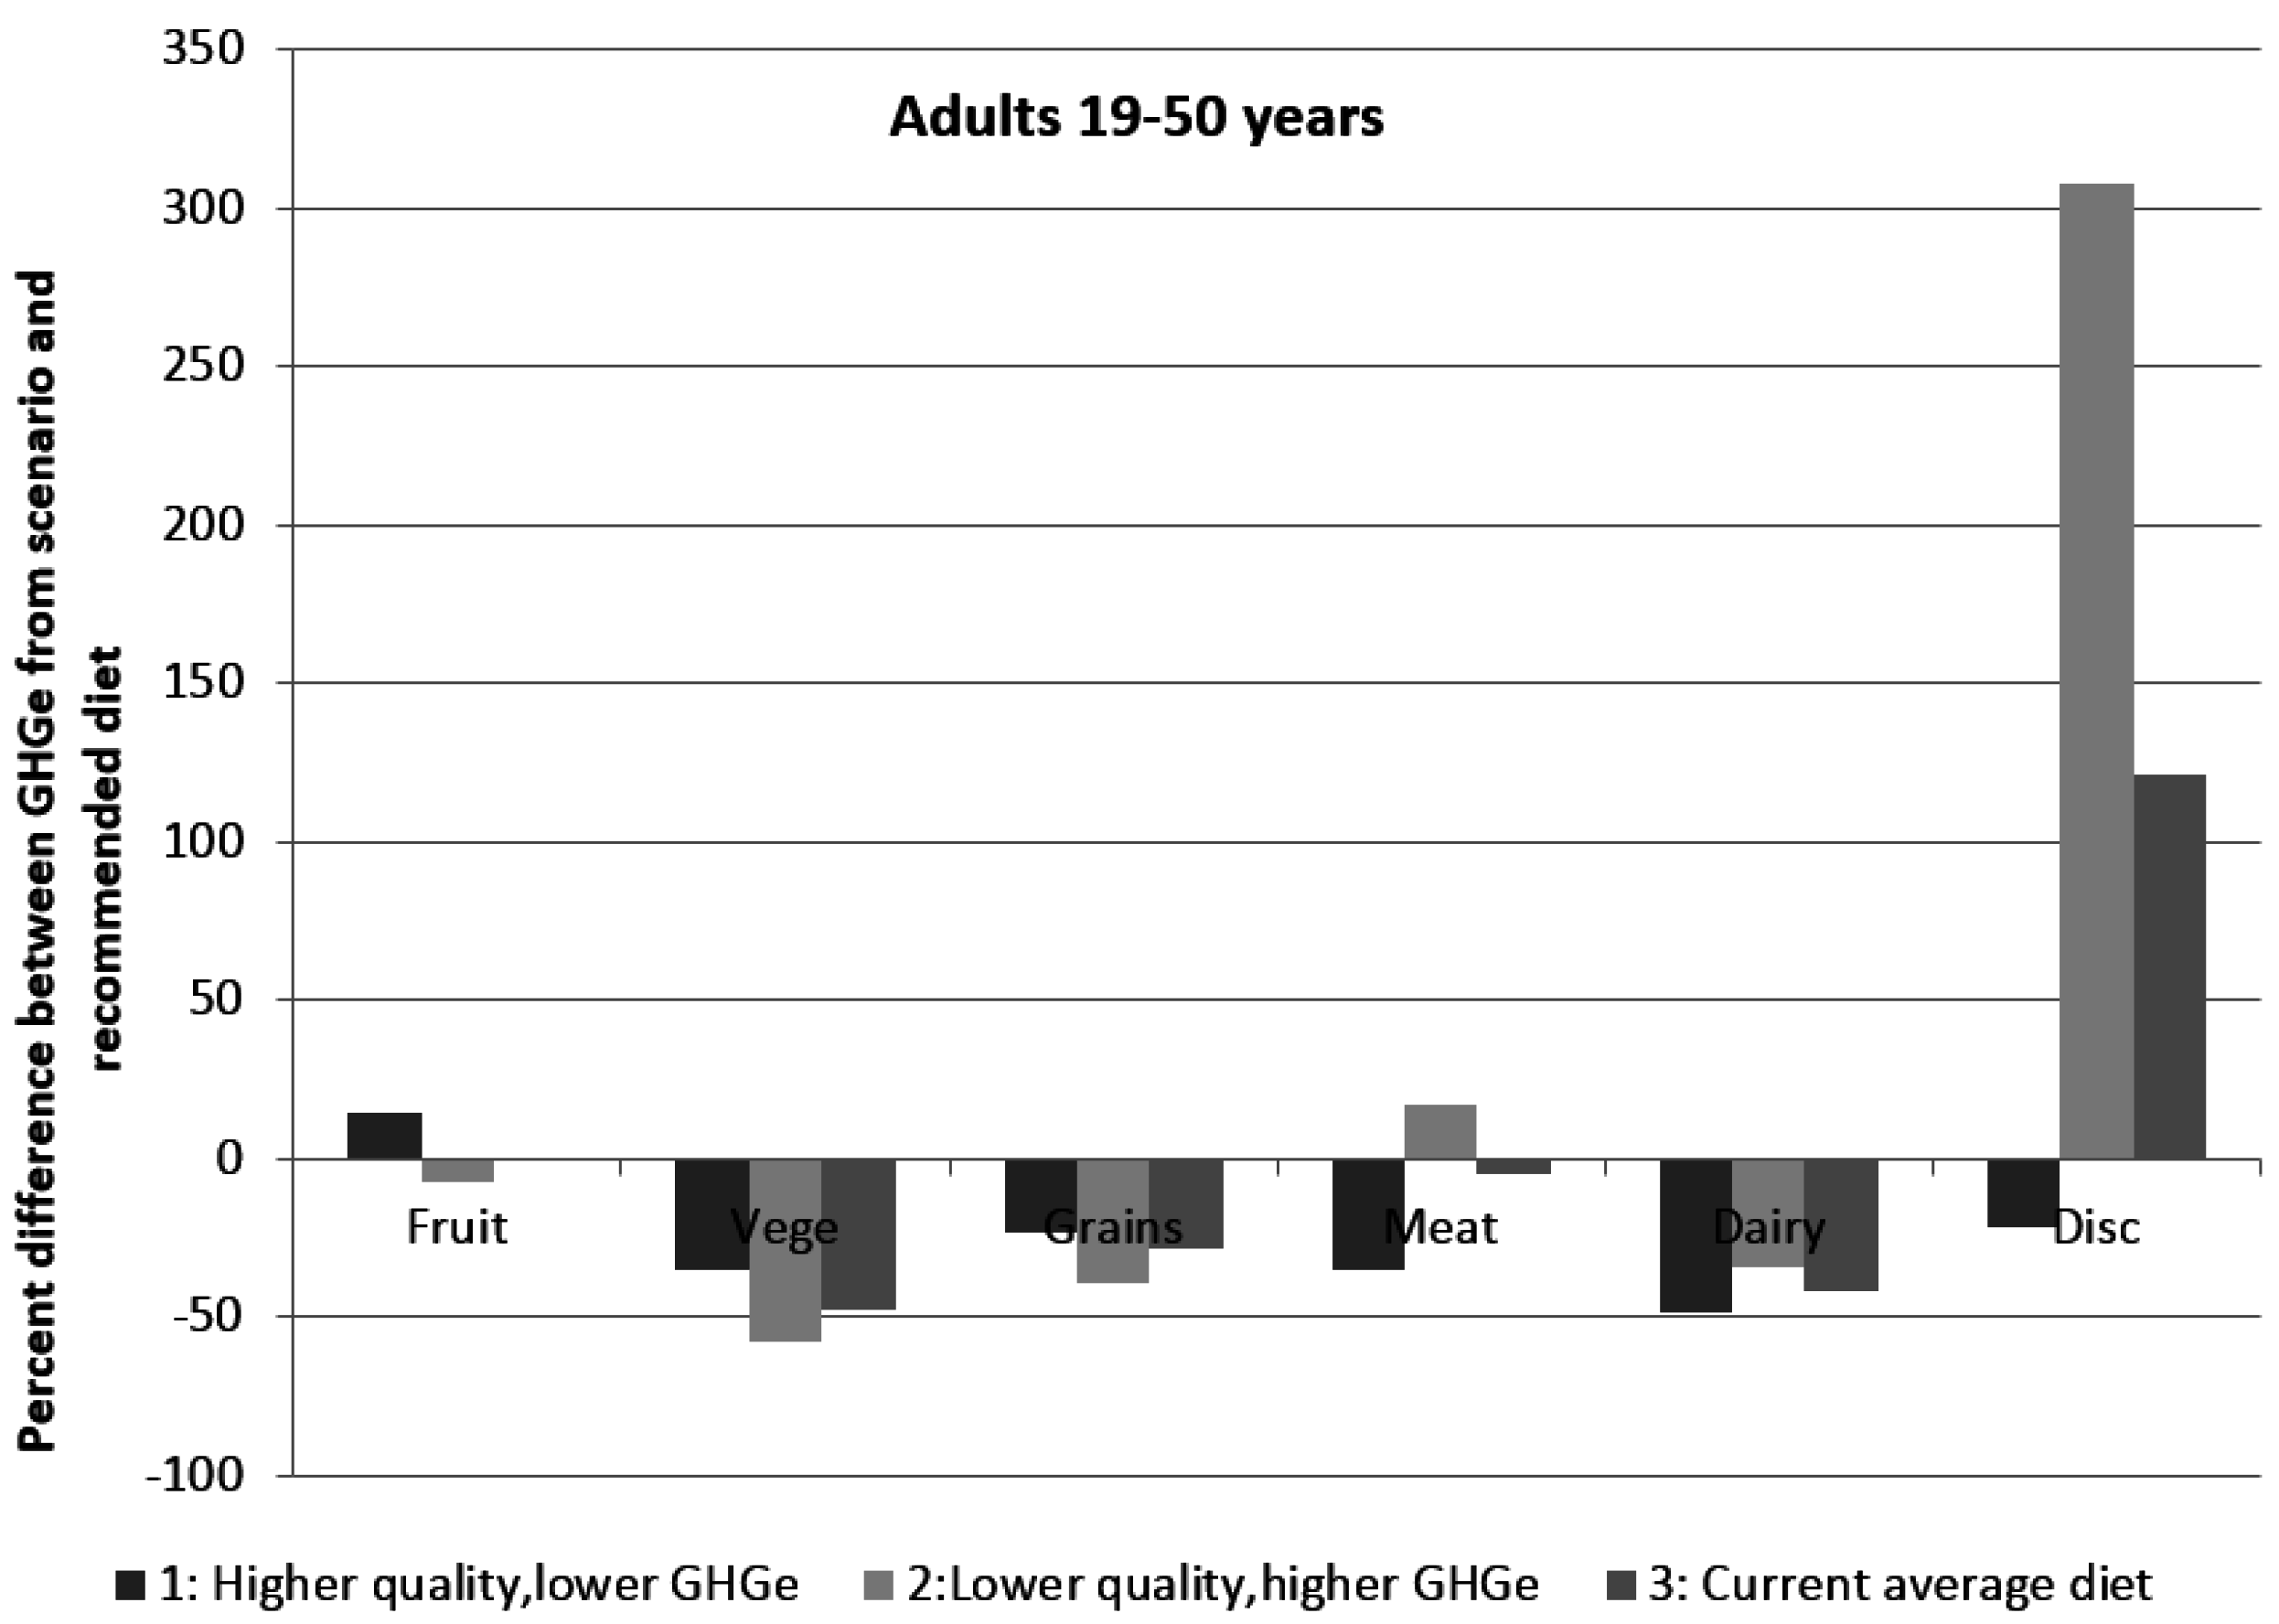
3.3. Comparing the Food Intake Adequacy and Greenhouse Gas Emissions from Three Current Eating Patterns to the Recommended Eating Pattern for Adults Aged 19–50 Years

Table 3 shows the average intake (in serves) of each of the core food groups and discretionary foods and GHGe from the four dietary patterns modelled, as an average of males and females aged 19–50 years. The intake of vegetables, grains and dairy foods were below the recommended intakes for all three patterns, and intake of discretionary foods exceeded the recommendation by double for the current average pattern and by four times for the lower quality, high GHGe dietary pattern. Current intakes of meat and alternatives were similar to recommendations (+0.1 serves), but 1.0 serve less than the recommendation in the higher quality, lower GHGe dietary patterns (Table 3).
The total dietary GHGe were highest in the lower quality, higher GHGe diet (25.2 kg CO2e/day), followed by the recommended (20.4 kg CO2e/day) and current average (19.7 kg CO2e/day), and then the higher quality, lower GHGe (13.9 kg CO2e/day) dietary pattern.
Figure 4 shows the difference in GHGe between the three current dietary patterns and the recommended dietary pattern as a percentage difference of the recommended intake. The contribution of core food groups to total dietary GHGe was generally lower in the current dietary pattern scenario than the recommended diet, except for contribution from fruit, which was similar. This percentage difference was greatest for vegetables and dairy foods, but was still within 50% for all core food groups. This was overshadowed by the large difference in GHGe from discretionary foods in the current dietary pattern as well as the lower quality, higher GHGe pattern. The contribution of emissions from discretionary foods was 121% greater in the current dietary pattern compared to the recommended dietary pattern, and 307% greater in the lower quality, higher emissions dietary pattern compared to the recommended pattern (Figure 4). The estimated average energy intake from the current average dietary pattern was similar to the recommended dietary pattern, whereas the higher quality, lower GHGe dietary pattern contained approximately 29% fewer kilojoules, and the lower quality, higher GHGe dietary pattern 24% more kilojoules than the recommended diet. It should be noted that there was no adjustment for underreporting in the three current dietary patterns modelled, so true energy consumed is likely to be higher than estimated here (Table 3).

4. Discussion

This study has augmented the most recent data on the food intake of Australian adults with the updated environmentally extended input–output model to provide improved estimates of the greenhouse gas emissions of the Australian diet. The updated model provides more than twice as many agri-food sectors as previously published [39], thereby allowing greater sensitivity in the assignment of emission factors to individual foods consumed and deeper understanding of the percentage contribution of different discretionary food products. Our results provide quantitative evidence to support the current dietary guidelines as a way of achieving adequate nutrition and lower overall greenhouse gas emissions, with overconsumption of kilojoules and excessive consumption of discretionary foods being the key drivers of avoidable dietary related greenhouse gas emissions. Of the core foods, fresh meat made the greatest contribution to total dietary emissions, but with greater disaggregation of foods and food sectors, this contribution was found to be more moderate than previously estimated [39].
In shifting the average Australian’s diet towards a nutritionally complete dietary pattern based on the Australian Dietary Guidelines, the contributions from some core food groups would actually need to increase (e.g., vegetables, dairy and grains), some require little change (e.g., fruit and meat) and others would need to decrease (e.g., discretionary foods). The large potential saving in dietary emissions associated with significantly reducing discretionary food intake would allow for the small increases in emissions from core foods, thereby providing considerable nutritional benefit at little or no environmental expense. Similar results have been reported in the Netherlands, where the intake of meat products and extra sweets and snacks needed to decrease to allow for an increase in fruit and vegetables, and a move from the current Dutch diet to their recommended diet would provide an 11% reduction in overall dietary emissions [1].
In the Australian context, fresh meat contributed 34% to total dietary emissions, of which red meat contributed 17.6% and chicken 11%. Another Australian study examining the environmental impacts of the average weekly household food consumption also suggests meat is among the highest contributors to emissions, accounting for about 17% of emissions, however this study only considered CO2 and not the other greenhouse gases [33]. Similar results have also been reported internationally. For example, in a Dutch diet where meat products contributed 32% of total dietary CO2e [1], and in a French study where meat and deli meat contributed 27% of GHGe [24]. The contribution of meat to dietary emissions can vary internationally as a consequence of differences in intake, country specific differences in emissions from the beef sector, and the categorisation of fresh meat and processed meat. Some studies combine meat and processed meat, however due to the health implications of these different types of meat and the categorisation of processed meat as a discretionary food in the Australian dietary guidelines, we felt it was important to analyse these separately.
Vegetarian and vegan diets exclude meat and/or all animal products and have thereby been shown to have lower dietary emissions. A British study found that compared to the average UK diet, a vegetarian diet reduced greenhouse gas emissions by 22% and a vegan diet by 26%, based on supply data rather than consumption data [13]. However, a recent review article suggests this reduction could be as high as 35% for vegetarian and 55% for vegan diets [10]. There is no doubt vegetarian and vegan diets can achieve very low GHGe, however they need to be adopted with care as they may place individuals at risk of nutrient deficiency [1,43]. This risk extends beyond the example of red meat being a primary source of iron and zinc. In the vegan dietary pattern, the reduction in emissions is partly explained by a lower consumption of dairy products [1], but in Australia most adults are not consuming enough dairy so any advice which further decreases consumption could have implications on their calcium intake and bone health [29].
There were challenges in combining the food classification system used in the National Nutrition Survey with the input–output food sectors, however the addition of over 100 new food sectors has allowed for greater disaggregation of the food supply and composite dishes to produce more accurate greenhouse gas estimates. We have also used a more standardised approach to pricing foods than our previous approach [39] which is an additional strength of the current analysis, and will allow this method to be repeated should another National Nutrition survey be conducted, or even applied to data from other dietary assessment methods. The other strength of this study, and where it is different from some other studies, is that we have modelled three current, and hence credible, dietary scenarios and compared these to current recommendations. By modelling different ways Australians are actually consuming foods, we know any recommendations based on these will be achievable. Small changes may be more realistic for sub-groups of the population, for example encouraging those consuming the lower quality, higher emissions diet to move towards the average daily diet would reduce dietary emissions by between 15%–30% in males and females, and would reduce discretionary food intake by five serves, which provides a health benefit. When theoretical, low emission diets are modelled at the population level, they frequently present nutritional challenges for specific age and gender cohorts and may not be realistic and/or acceptable to many individuals, especially where these aim to reduce emissions by more than 30% [44]. In addition, most studies examining sustainable diets overlook the interrelated problems of excessive energy intake, excessive consumption of energy-dense, nutrient poor non-core foods, and overall nutrient deficiency which characterize many diets. The consistency in the messaging from a health and environmental perspective is encouraging for public health nutrition professionals who are often required to address such concerns from the public.
The greatest body of literature has focused on greenhouse gas emissions associated with dietary intake, and this study has further contributed to this scientific evidence base. However, there are other environmental impacts of the food system which should be considered including impacts related to land and water use, and indirect land use change. In addition, most previous studies are process-based, and have more restricted system boundaries, whereas the input–output life cycle approach used in this study captures all upstream processes, which implies that the numbers will be higher as the scope is more compete (to the point of purchase). This avoids the truncation errors associated with the application of a system boundary in process lifecycle assessment which can be as high as 50% [45,46,47]. Process LCA is commonly used for examining specific supply chains, and estimates of diet-related GHGe using this method tend to be lower [13]. For this reason, the absolute GHGe reported in this study may not be directly comparable to results from other studies where a process LCA approach has been used.
In addition, some assumptions were made which need to be considered. For example, we used a standard price database which assumes that the prices of food products used were representative for all people within the sample. Secondly, we did not adjust for underreporting, however we need to acknowledge that, as is commonly the case in self-reported dietary databases, some degree of misreporting is present in these data. It has been estimated that the average reported energy intake would need to increase by 17%–22% for males and females to achieve energy balance for an average person [29], therefore the estimates of energy intake reported here may be lower than true consumption. In addition, outside the scope of this study was performing a detailed analysis of greenhouse gas emissions within a food group. Emissions from varieties of food within a food group may vary, therefore there may be potential to lower emissions by favouring products with relatively lower emissions. This warrants further investigation. While consumer interest in “sustainable eating” gathers momentum, behaviour change to reduce diet related greenhouse gas emissions may be difficult to implement as consumers have little understanding of which products within a food group have lower emissions and carbon footprint labelling is almost non-existent in the Australian food system.
The calculation of carbon and other environmental footprints associated with dietary change and specific food products is still a work in progress with recent international studies highlighting the great diversity in results due to the use of different functional units and system boundaries [10,48]. According to a recent study of carbon footprints in Australian cities, the total per capita footprint for someone living in one of the main cities in Australia is around 15–25 t CO2e per capita [49]. This corresponds to 41–68 kg CO2ee/capita per day. This implies that our calculated average figure of 18.72 and 13.73 kg CO2e/day for male and female adults respectively accounts for a similar percentage of overall emissions as reported elsewhere [50]. Additionally, the food-specific per capita footprint results in this study are fully consistent with previously published values for Australia [33,39,51].

5. Conclusions

Some diets that are lower in greenhouse gas emissions are actually less healthy, namely higher in sugar and lower in micronutrients [6] but this study presents quantifiable evidence that eating towards the Australian Dietary Guidelines is healthier based on actual daily food consumption data from a large sample of individuals. This study demonstrates a considerable degree of overlap in the messages of healthy eating and lower GHGe, so a consistent public health message could be developed and promoted relatively easy. Food demand in Australia is steadily increasing with the rising population. Globally, it is expected that food demand will potentially double by 2050 [52]. There is, therefore, a sense of urgency to secure a healthy food supply for future generations, and the findings of this study suggest the most effective strategy to do this is to focus on diet quantity, in terms of eating to one’s energy needs, and diet quality, that is consuming adequate core foods and less discretionary foods. Building and constantly updating a solid scientific evidence base will inform the integration of health and environmental policies and guide behaviour change to reduce greenhouse gas emissions associated with population food choices and nutritional requirements.

Acknowledgments

This research was enabled by the Industrial Ecology Virtual Laboratory (IELab, www.ielab.info), originally funded under the Australian National eResearch Collaboration Tools and Resources project (NeCTAR, code VL201). IELab datafeeds and routines written by Manfred Lenzen, Arne Geschke, Joe Lane and Hazel Rowley were utilised. This study was funded, in part, by Meat and Livestock Australia (Project No. D.BHR.1601).

Author Contributions

G.A.H., B.R. and M.N. conceived and designed the study; G.A.H., D.B. and M.H. conducted the analysis; and G.A.H. and D.B. prepared the first draft of the manuscript. All authors contributed to the manuscript, provided critical review and approved the manuscript for publication.

Conflicts of Interest

The authors declare no conflict of interest. This study was funded, in part, by Meat and Livestock Australia. Veronique Droulez, Nutrition Manager, Meat and Livestock Australia read and had opportunity to comment on a draft manuscript.

Appendix

Table A1. Greenhouse gas emissions per purchase price (kg CO2eper Australian dollar (($A) for all food products used in this analysis, categorized into their respective food group).
Food GroupFood ProductsGHGe/Purchase Price (kg Co2e/$A)
Fruit (fresh and processed)Dried fruit (excl sun-dried)0.48338
Kiwi fruit0.47974
Fruit juices, single strength or concentrated0.44525
Preserved fruit and fruit products 0.43979
Berries nec—fresh and sun-dried0.40945
Grapes sun-dried or for drying0.39999
Pears and quinces—fresh and sun-dried0.39512
Olives—fresh and sun-dried0.38884
Grapes—table0.37619
Strawberries0.36613
Orchard fruit nec—fresh and sun-dried0.34844
Bananas—fresh and sun-dried0.34317
Stone fruit—fresh and sun-dried0.34280
Citrus fruit—fresh and sun-dried0.34152
Apples—fresh and sun-dried0.33794
Grapes—wine0.33149
Vegetables (fresh and processed)Lettuces grown undercover0.63478
Fresh vegetable salads, in plastic containers0.55611
Mushroom spawn0.53921
Vegetable juices (incl mixtures) (incl tomato); mixtures of vegetable and fruit juices0.53887
Farmed seaweed0.53246
Tomato pulp, puree and paste0.49218
Vegetables, prepared or preserved (incl dried or shelled)(excl frozen); pickles and chutney0.44630
Vegetables, frozen0.44326
Tomatoes grown undercover0.43371
Olives—fresh and sun-dried0.38884
Other vegetables, fresh or chilled, grown undercover0.38360
Beans, french and runner; peas, green or blue grown outdoors0.35533
Onions grown outdoors0.34963
Carrots grown outdoors0.33958
Lettuces grown outdoors0.33944
Cabbages, brussels sprouts, cauliflowers and broccoli grown outdoors0.33546
Tomatoes grown outdoors0.32920
Mushrooms, fresh or chilled0.32215
Potatoes, sweet potatoes and edible roots tubers grown outdoors0.30533
Other vegetables (incl. melons), fresh or chilled grown outdoors0.30334
Breads and cerealsCereal grains nec2.51001
Oilseeds2.33390
Lupins (white or yellow) for grain1.83608
Legumes for grain nec1.73941
Rice, in the husk1.59707
Cereal foods (incl breakfast foods)0.94889
Rice (husked, semi-milled or wholly milled)0.93857
Rice groats, meals and pellets; other worked cereal grains 0.93798
Malt (excl malt extract)0.92090
Pasta0.91909
Wheat and other cereal flours (incl self-raising)0.91385
Starch of wheat and corn0.90673
Mixes and doughs nec (incl custard powder) for preparation of bakers wares (excl frozen)0.88976
Flour mill products nec, for human consumption0.87563
Malt extract0.84356
Wheat bran for human consumption (excl for breakfast food)0.82789
Oats, unmilled0.67978
Bread and bread rolls0.67820
Grain, sorghum0.63955
Barley, unmilled0.61517
Wheat (incl spelt) and meslin, unmilled0.60383
Dried roots, tubers and vegetables; Flour and meal of vegetables0.50484
Fresh red meatBeef3.23960
Lamb3.07132
Pork1.45418
Kangaroo1.26580
PoultryPoultry and poultry products (incl canned)1.79654
Fish & seafoodRock lobster and crab0.97399
Crustaceans, molluscs & aquatic invertebrates nec (chilled, frozen, preserved or otherwise prepared)0.90976
Frozen whole fish, fish fillets and fish meat; fish loaf, cake, balls and paste; smoked fish; fish fingers; caviar0.89430
Oysters and other aquatic invertebrates nec, live, fresh or chilled0.88602
Rock lobster and crayfish (incl tails), chilled or frozen (incl boiled and frozen)0.88479
Inedible flours, meals, pellets & other products nec of fish, crustaceans & molluscs or other aquatic invertebrates0.84087
Fish, canned0.80886
Fish and squid (line fishing)0.80605
Coral and similar, shells of molluscs; natural animal sponges; algae, fresh or dried 0.74707
Freshwater fish and aquatic animals nec0.74366
Prawns0.70514
Fish (trawling or netting)0.68971
Farmed fish and fish hatchery products0.64590
Farmed prawns and crustaceans nec0.50414
Farmed oysters (including Pearl), paua and molluscs nec0.39522
Vegetarian AlternativesEggs0.82685
Peanut butter and other nut butters, pastes and purees; 0.60125
Nuts, roasted0.58439
Almonds and macadamias0.35695
Edible nuts (excluding Peanuts) nec; Other fruit nec—fresh and sun-dried0.34630
Other meatsEdible offals (excl poultry offals)1.82509
Meat (excl fresh) for human consumption1.73576
Other animal products nec1.72872
Deer0.65689
Mixed meat and vegetables, canned0.60675
Dairy productsCheese and curd1.30394
Flavoured whole milk drinks1.29049
Sour cream, yoghurt and other cultured milk products1.28294
Milk and cream, concentrated or sweetened; lactose and lactose syrup; products of natural milk constituents1.26744
Milk based food preparations (excluding malt extracts) and dried milk based mixes1.26283
Buttermilk1.26123
Processed liquid milk (incl whole milk and skim)1.19767
Processed meatBacon and ham and other dried, salted or smoked pigmeat (incl canned)1.84050
Smallgoods nec (incl crumbed lamb cutlets, cured meat (canned or uncanned), frankfurters, saveloys and salami)1.83591
AlcoholBeer0.46729
Wines (incl sparkling) of grapes and other fruit (excl vermouth)0.25090
Spirits and fortified wines0.23627
Other alcohol0.11501
Sugar sweetened beveragesMineral waters and aerated waters, sweetened or flavoured, bottled0.48782
Mineral waters and aerated waters, sweetened or flavoured, canned0.35982
Sweetened or flavoured bulk pre-mix & post-mix concentrates for mineral & aerated waters; non-alcoholic beverages0.35744
Cordials and syrups; powder flavours for soft drinks; concentrated cordial extracts0.35320
Dairy based dessertsIce cream and frozen confections1.22533
Cream (incl thickened), not concentrated or sweetened1.22406
Savoury and sweet biscuits and cakesBiscuits and biscuit crumbs; rusks; ice cream cones and wafers; unleavened bread0.65472
Cakes, pastries and crumpets0.65356
Biscuit and bread dough (incl frozen)0.63559
Bakers’ wares nec (incl pretzels and frozen pizza) (excl bread and pies)0.58847
Sweet and savoury pastries and pies Meat pies0.62161
Prepared meals (incl TV dinners), of meat or meat offal0.61268
ConfectionaryGlucose, glucose syrup (incl dextrose) and modified starches (incl dextrins)0.89764
Liquid refined sugar, golden syrup, artificial honey, starch and sugar products nec0.61563
Crystallised, drained and glace fruit, nuts and peel0.57841
Icing sugar, molasses (incl treacle) and sugar nec 0.57003
Other food preparations containing cocoa (excl chocolate confectionery)0.53570
Raw and refined sugar in solid form (incl brown sugar) (excl icing sugar)0.53402
Chocolate confectionery (excl chocolate coated biscuits and white chocolate)0.52437
Chewing gum, white chocolate and other confectionery not containing cocoa0.52369
Cocoa beans (roasted); cocoa paste, powder, butter, fat or oil0.51854
Jams0.48045
Other—stock, salt, dry soupsEdible tallow (excl refined)1.59973
Butter1.25690
Fats and oils derived from milk (incl butter oil); casein1.23787
Refined and processed animal or vegetable oils and fats (incl tallow) (excl neatsfoot, wool grease and lanolin)1.01827
Restaurants and catering0.69551
Fast food and takeaway0.64127
Food products nec (incl jelly crystals, meat pastes)0.56617
Pasta products, canned0.54331
Fried potato and extruded snacksCorn chips; taco, tortilla and tostada shells0.56981
Potato crisps and flakes0.55735
BeveragesNatural water nec0.34758
Natural and artificial mineral waters and aerated waters (excl sweetened or flavoured)0.23294
Ice0.22193
Healthy fats and oilsCrude soya bean, cotton seed, peanut, sunflower, safflower, rape seed, coconut and vegetable oils1.01000
Margarine1.03513
MiscellaneousWheat gluten and tapioca0.90385
Prepared baking powders0.86756
Mustard; worcestershire sauce; mayonnaise and salad dressing0.58727
Coffee and tea, including substitutes0.58032
Yeast and yeast extracts0.57738
Spices0.57732
Gelatine0.57695
Flavouring essences, industrial0.56924
Refined salt (cooking and table)0.56792
Soup and homogenised food preparations including fruit, vegetables, meat or composites thereof0.47864
Fruit and vegetable based health, invalid or baby preparations0.47812
Sauces (excl worcestershire/apple); vinegar (excl wine vinegar)0.47399

References

  1. Van Dooren, C.; Marinussen, M.; Blonk, H.; Aiking, H.; Vellinga, P. Exploring dietary guidelines based on ecological and nutritional values: A comparison of six dietary patterns. Food Policy 2014, 44, 36–46. [Google Scholar] [CrossRef]
  2. Monteiro, C.A.; Cannon, G.; Moubarac, J.-C.; Martins, A.P.B.; Martins, C.A.; Garzillo, J.; Canella, D.S.; Baraldi, L.G.; Barciotte, M.; Louzada, M.L.D.C.; et al. Dietary guidelines to nourish humanity and the planet in the twenty-first century. A blueprint from Brazil. Public Health Nutr. 2015, 18, 2311–2322. [Google Scholar] [CrossRef] [PubMed]
  3. Fischer, C.G.; Garnett, T. Plates, Pyramids, Planet. Developments in National Healthy and Sustainable Dietary Guidelines: A State of Play Assessment; FAO and the Environmental Change Institute & The Oxford Martin Programme on the Future of Food, The University of Oxford: Oxford, UK, 2016. [Google Scholar]
  4. Kromhout, D.; Spaaij, C.J.; de Goede, J.; Weggemans, R.M. The 2015 Dutch food-based dietary guidelines. Eur. J. Clin. Nutr. 2016, 70, 869–879. [Google Scholar] [CrossRef] [PubMed]
  5. Food and Agriculture Organization of the United Nations. Biodiversity and sustainable diets united against hunger. In Sustinable Diets and BioDiversity: Directions and Solutions for Policy, Research and Action, Proceedings of the International Scientific Synposium, Rome, Italy, 3–5 November 2010.
  6. Payne, C.L.R.; Scarborough, P.; Cobiac, L. Do low-carbon-emission diets lead to higher nutritional quality and positive health outcomes? A systematic review of the literature. Public Health Nutr. 2016, 1, 1–8. [Google Scholar] [CrossRef] [PubMed]
  7. Auestad, N.; Fulgoni, V.L. Reply to L Aleksandrowicz et al. Available online: http://advances.nutrition.org/content/6/3/283.short?rss=1&ssource=mfr (accessed on 5 May 2016).
  8. Drewnowski, A. Healthy diets for a healthy planet. Am. J. Clin. Nutr. 2014, 99, 1284–1285. [Google Scholar] [CrossRef] [PubMed]
  9. Garnett, T. What Is a Sustainable Diet? A Discussion Paper; Food and Climate Research Network: Oxford, UK, 2014. [Google Scholar]
  10. Hallstrom, E.; Carlsson-Kanyama, A.; Borjesson, P. Environmental impact of dietary change: A systematic review. J. Clean. Prod. 2015, 91, 1–11. [Google Scholar] [CrossRef]
  11. Johnston, J.L.; Fanzo, J.C.; Cogill, B. Understanding sustainable diets: A descriptive analysis of the determinants and processes that influence diets and their impact on health, food security, and environmental sustainability. Adv. Nutr. 2014, 5, 418–429. [Google Scholar] [CrossRef] [PubMed]
  12. Aleksandrowicz, L.; Haines, A.; Green, R. Sustainable diet studies show Co-Benefits for greenhouse gas emissions and public health. Adv. Nutr. 2015, 6, 282–283. [Google Scholar] [CrossRef] [PubMed]
  13. Berners-Lee, M.; Hoolohan, C.; Cammack, H.; Hewitt, C.N. The relative greenhousegas impacts of realistic dietary choices. Energy Policy 2012, 43, 184–190. [Google Scholar] [CrossRef]
  14. Scarborough, P.; Allender, S.; Clarke, D.; Wickramasinghe, K.; Rayner, M. Modelling the health impact of environmentally sustainable dietary scenarios in the UK. Eur. J. Clin. Nutr. 2012, 66, 710–715. [Google Scholar] [CrossRef] [PubMed]
  15. Macdiarmid, J.I.; Douglas, F.; Campbell, J. Eating like there’s no tomorrow: Public awareness of the environmental impact of food and reluctance to eat less meat as part of a sustainable diet. Appetite 2016, 96, 487–493. [Google Scholar] [CrossRef] [PubMed]
  16. Tilman, D.; Clark, M. Global diets link environmental sustainability and human health. Nature 2014, 515, 518–522. [Google Scholar] [CrossRef] [PubMed]
  17. Friel, S.; Barosh, L.J.; Lawrence, M. Towards healthy and sustainable food consumption: An Australian case study. Public Health Nutr. 2014, 17, 1156–1166. [Google Scholar] [CrossRef] [PubMed]
  18. Macdiarmid, J. Is a healthy diet an environmentally sustainable diet? Proc. Nutr. Soc. 2013, 72, 13–20. [Google Scholar] [CrossRef] [PubMed]
  19. Burlingame, B.; Dernini, S. Sustainable diets: Mediterranean diet as an example. Public Health Nutr. 2011, 14, 2285–2287. [Google Scholar] [CrossRef] [PubMed]
  20. Tukker, A.; Goldbohm, R.A.; de Koning, A.; Verheijden, M.; Kleijn, R.; Wolf, O.; Perez-Dominguez, I.; Rueda-Cantuche, J.M. Environmental impacts of changes to healthier diets in Europe. Ecol. Econ. 2011, 70, 1776–1788. [Google Scholar] [CrossRef]
  21. Vieux, F.; Soler, L.-G.; Touazi, D.; Darmon, N. High nutritional quality is not associated with low greenhouse gas emissions in self-selected diets of French adults. Am. J. Clin. Nutr. 2013, 97, 569–583. [Google Scholar] [CrossRef] [PubMed]
  22. Heller, M.C.; Keoleian, G.A. Greenhouse gas emission estimates of US dietary choices and food loss. J. Ind. Ecol. 2015, 19, 391–401. [Google Scholar] [CrossRef]
  23. Tom, M.S.; Fischbeck, P.S.; Hendrickson, C.T. Energy use, blue water footprint, and greenhouse gas emissions for current food consumption patterns and dietary recommendations in the US. Environ. Syst. Decis. 2016, 36, 92–103. [Google Scholar] [CrossRef]
  24. Vieux, F.; Darmon, N.; Touazi, D.; Soler, L.G. Greenhouse gas emissions of self-selected individual diets in France: Changing the diet structure or consuming less? Ecol. Econ. 2012, 75, 91–101. [Google Scholar] [CrossRef]
  25. National Health & Medical Research Council. Australian Dietary Guidelines. Available online: https://www.eatforhealth.gov.au/sites/default/files/files/the_guidelines/n55_australian_dietary_guidelines.pdf (accessed on 5 May 2016).
  26. Roos, E.; Karlsson, H.; Witthoft, C.; Sundberg, C. Evaluating the sustainability of diets-combining environmental and nutritional aspects. Environ. Sci. Policy 2015, 47, 157–166. [Google Scholar] [CrossRef]
  27. Meier, T.; Christen, O. Environmental impacts of dietary recommendations and dietary styles: Germany as an example. Environ. Sci. Technol. 2012, 47, 877–888. [Google Scholar] [CrossRef] [PubMed]
  28. United States Department of Agriculture Department of Health and Human Services. Scientific Report of the 2015 DIetary Guidelines Advisory Committee. Available online: https://health.gov/dietaryguidelines/2015-scientific-report/pdfs/scientific-report-of-the-2015-dietary-guidelines-advisory-committee.pdf (accessed on 5 May 2016).
  29. Australian Bureau of Statistics. Australian Health Survey: Nutrition First Results—Food and Nutrients, 2011–2012. Available online: http://www.abs.gov.au/ausstats/[email protected]/Lookup/4364.0.55.007main+features12011-12 (accessed on 5 May 2016).
  30. Australian Bureau of Statistics. Australian Health Survey: Users’ Guide, 2011–2013. Available online: http://www.abs.gov.au/ausstats/[email protected]/mf/4363.0.55.001 (accessed on 5 May 2016).
  31. Food Standards Australia and New Zealand. AUSNUT 2011–2013 Food Recipe File. Available online: http://www.foodstandards.gov.au/science/monitoringnutrients/ausnut/ausnutdatafiles/Pages/default.aspx (accessed on 5 May 2016).
  32. Duchin, F. Sustainable consumption of food: A framework for analyzing scenarios about changes in diets. J. Ind. Ecol. 2005, 9, 99–114. [Google Scholar] [CrossRef]
  33. Reynolds, C.J.; Piantadosi, J.; Buckley, J.D.; Weinstein, P.; Boland, J. Evaluation of the environmental impact of weekly food consumption in different socio-economic households in Australia using environmentally extended input-output analysis. Ecol. Econ. 2015, 111, 58–64. [Google Scholar] [CrossRef]
  34. Lenzen, M.; Geschke, A.; Wiedmann, T.; Lane, J.; Anderson, N.; Baynes, T.; Boland, J.; Daniels, P.; Dey, C.; Fry, J.; et al. Compiling and using input–output frameworks through collaborative virtual laboratories. Sci. Total Environ. 2014, 485–489, 241–251. [Google Scholar] [CrossRef] [PubMed]
  35. AEGIS Australian Greenhouse Emissions Information System. Available online: https://www.environment.gov.au/climate-change/greenhouse-gas-measurement/ageis (accessed on 10 May 2016).
  36. ABS Australian National Accounts: Input-Output Tables, 2009–2010. Available online: http://www.abs.gov.au/AUSSTATS/[email protected]/allprimarymainfeatures/738D25E1A23B4FF4CA257E6E0011AD13?opendocument (accessed on 5 May 2016).
  37. ABS Australian National Accounts: Input-Output Tables (Product Details), 2009–2010. Available online: http://www.abs.gov.au/AUSSTATS/[email protected]/DetailsPage/5215.0.55.0012009-10?OpenDocument (accessed on 5 May 2016).
  38. Lenzen, M. Aggregation versus disaggregation in input–output analysis of the environment. Econ. Syst. Res. 2011, 23, 73–89. [Google Scholar] [CrossRef]
  39. Hendrie, G.A.; Ridoutt, B.G.; Wiedmann, T.O.; Noakes, M. Greenhouse Gas Emissions and the Australian Diet—Comparing Dietary Recommendations with Average Intakes. Nutrition 2014, 6, 289–303. [Google Scholar] [CrossRef] [PubMed]
  40. Australian Bureau of Statistics Australian National Accounts: Input-Output Tables, 2009–2010. Available online: http://www.abs.gov.au/AUSSTATS/[email protected]/DetailsPage/5209.0.55.0012009-10?OpenDocument (accessed on 5 May 2016).
  41. CSIRO Food and Nutrition. FoodTrack™-Food and Nutrient Database. Available online: http://www.csiro.au/en/Research/Health/CSIRO-diets/FoodTrack (accessed on 5 May 2016).
  42. Golley, R.K.; Hendrie, G.A. The Dietary Guidelines Index for Children and Adolescents: What is the impact of the new dietary guidelines? Nutr. Diet. 2014, 71, 210–212. [Google Scholar] [CrossRef]
  43. Craig, W.J. Nutrition concerns and health effects of vegetarian diets. Nutr. Clin. Pract. 2010, 25, 613–620. [Google Scholar] [CrossRef] [PubMed]
  44. Perignon, M.; Masset, G.; Ferrari, G.; Barré, T.; Vieux, F.; Maillot, M.; Amiot, M.J.; Darmon, N. How low can dietary greenhouse gas emissions be reduced without impairing nutritional adequacy, affordability and acceptability of the diet? A modelling study to guide sustainable food choices. Public Health Nutr. 2016, 19, 2662–2674. [Google Scholar] [CrossRef] [PubMed]
  45. Lenzen, M. Errors in conventional and input-output-based life-cycle inventories. J. Ind. Ecol. 2001, 4, 127–148. [Google Scholar] [CrossRef]
  46. Suh, S.; Lenzen, M.; Treloar, G.J.; Hondo, H.; Horvath, A.; Huppes, G.; Jolliet, O.; Klann, U.; Krewitt, W.; Moriguchi, Y.; et al. System boundary selection in life-cycle inventories using hybrid approaches. Environ. Sci. Technol. 2004, 38, 657–664. [Google Scholar] [CrossRef] [PubMed]
  47. Wiedmann, T. Carbon footprint and input-output analysis—An introduction. Econ. Syst. Res. 2009, 21, 175–186. [Google Scholar] [CrossRef]
  48. Nemecek, T.; Jungbluth, N.; Canals, L.M.; Schenck, R. Environmental impacts of food consumption and nutrition: Where are we and what is next? Int. J. Life Cycle Assess. 2016, 21, 607–620. [Google Scholar] [CrossRef]
  49. Chen, G.; Wiedmann, T.; Hadjikakou, M.; Rowley, H. City carbon footprint networks. Energies 2016, 9, 602. [Google Scholar] [CrossRef]
  50. Garnett, T. Plating up: Can eating patterns be both healthier and nmore sustainable? Science 2016, 353, 1202–1204. [Google Scholar] [CrossRef] [PubMed]
  51. Hadjikakou, M. Trimming the excess: Environmental impacts of discretionary food consumption in Australia. Ecol. Econ. 2017, 131, 119–128. [Google Scholar] [CrossRef]
  52. Bodirsky, B.L.; Rolinski, S.; Biewald, A.; Weindl, I.; Popp, A.; Lotze-Campen, H. Global food demand scenarios for the 21st century. PLoS ONE 2015, 10, e0139201. [Google Scholar] [CrossRef] [PubMed]
Figure 1. Distribution of total dietary greenhouse gas emissions for Australian males (black dashed line, n = 4282) and Australian females (grey dotted line, n = 5059).
Nutrients 08 00690 g001
Figure 2. Scatterplot of total dietary greenhouse gas emissions against total energy intake for Australian males (n = 4282) (black) and Australian females (grey n = 5059).
Nutrients 08 00690 g002
Figure 3. Cumulative average contribution of food groups to total dietary greenhouse gas emissions for Australian males and females.
Nutrients 08 00690 g003
Figure 4. Difference between greenhouse gas emissions from the current average dietary patterns and the recommended daily diet as a percentage of the recommended intake for adults aged 19–50 years.
Nutrients 08 00690 g004
Table 1. Examples of ingredient composition percentages of mixed dishes.
Ingredient Number
1 (%) *2 (%)3 (%)4 (%)5 (%)
Sandwiches, hamburgers, wraps
Grain + Meat (or meat alternative) (e.g., cheese burger)Grain (50)Meat alt (40)Sauce (5)Cheese (5)-
Grain + Meat (or meat alternative) + Salad (e.g., chicken and salad wrap)Grain (30)Meat alt (30)Veg (30)Sauce (5)Cheese (5)
Mixed dishes where cereal grain main ingredient
Grain + Meat (or meat alternative)Grain (65)Meat alt (25)Sauce (5)Oil (5)-
Mixed dishes where Meat (or meat alternative) main ingredient
Meat (or meat alternative) + sauce (e.g., meat curry sauce)Meat alt (50)Veg (15)Sauce (5)Oil (5)-
Meat (or meat alternative) + Grain + Vege (e.g., meat, vegetable stir fry with rice)Meat alt (30)Grain (40)Veg (20)Sauce (10)-
* Percentage cereal grain component (Grain) e.g., bread, pasta, rice, and noodles; Meat and alternatives (Meat alt) e.g., beef, chicken, eggs, and tofu; and Vegetables (Veg) e.g., cooked, raw and salad vegetables within dishes.
Table 2. Average percentage contribution of food groups to total dietary greenhouse gas emissions for Australian males and females.
Male (n = 4282)Female (n = 5059)Total (n = 9341)
MeanSDMeanSDMeanSD
Fruit2.95.04.06.63.55.9
Vegetables5.59.57.511.06.510.3
Breads and cereals13.516.013.716.213.616.1
Fresh meat and alternatives34.729.733.129.533.929.6
Red meat18.827.516.526.917.627.2
Poultry10.920.311.020.511.020.4
Fish3.110.03.410.73.310.4
Vegetarian alt1.97.62.18.72.08.2
Other: Reptiles, offal0.11.00.00.60.00.8
Dairy9.411.311.512.710.512.1
Discretionary foods31.825.727.023.829.424.8
Processed meat, burgers, tacos, pizza12.619.510.017.811.318.7
Alcoholic beverages7.012.14.410.35.711.3
Sugar sweetened beverages3.45.92.86.03.15.9
Dairy based desserts, cream, butter2.15.52.05.52.15.5
Savoury and sweet biscuits, cakes1.94.12.44.72.24.5
Sweet and savoury pastries and pies1.54.91.65.81.55.4
Muesli bars, confectionary and choc1.53.11.94.01.73.6
Other—stock, salt, dry soups1.13.81.44.11.23.9
Fried potato and extruded snacks0.72.20.62.30.62.3
Other beverages (non sugar sweetened)1.65.12.47.22.06.2
Healthy fats and oils0.41.40.61.80.51.6
Miscellaneous0.33.00.21.20.22.3
Italics indicates sub-groups within the major food group.
Table 3. The average food intake (in serves) and dietary emissions from the three current dietary pattern scenarios and the recommended dietary pattern, for adults aged 19–50 years *.
Adults 19–50 yearsHigher Quality, Lower GHGe (7508 kJ)Lower Quality, Higher GHGe (13,195 kJ)Current Average (10,224 kJ)Recommended (10,598 kJ)
IntakeGHGeIntakeGHGeIntakeGHGeIntakeGHGe
(Serves)(kg CO2e)(serves)(kg CO2e)(Serves)(kg CO2e)(Serves)(kg CO2e)
Fruit2.30.81.90.72.00.72.00.7
Vege3.51.32.30.93.01.15.52.0
Grains4.52.23.61.74.22.06.02.8
Meat and alternatives1.86.53.211.52.79.52.89.9
Dairy1.31.51.61.91.51.72.52.9
Discretionary2.21.711.28.66.24.72.82.1
Total GHGe 13.9 25.2 19.7 20.4
* The estimation of energy in the current dietary patterns does not account for underreporting.

