The Response of More Health Focused and Less Health Focused People to a Physical Activity Calorie Equivalent Label on Discretionary Snack Foods


Abstract
:1. Introduction
2. Materials and Methods
2.1. Overview
2.2. Participants
2.3. Materials
2.4. Questionnaires
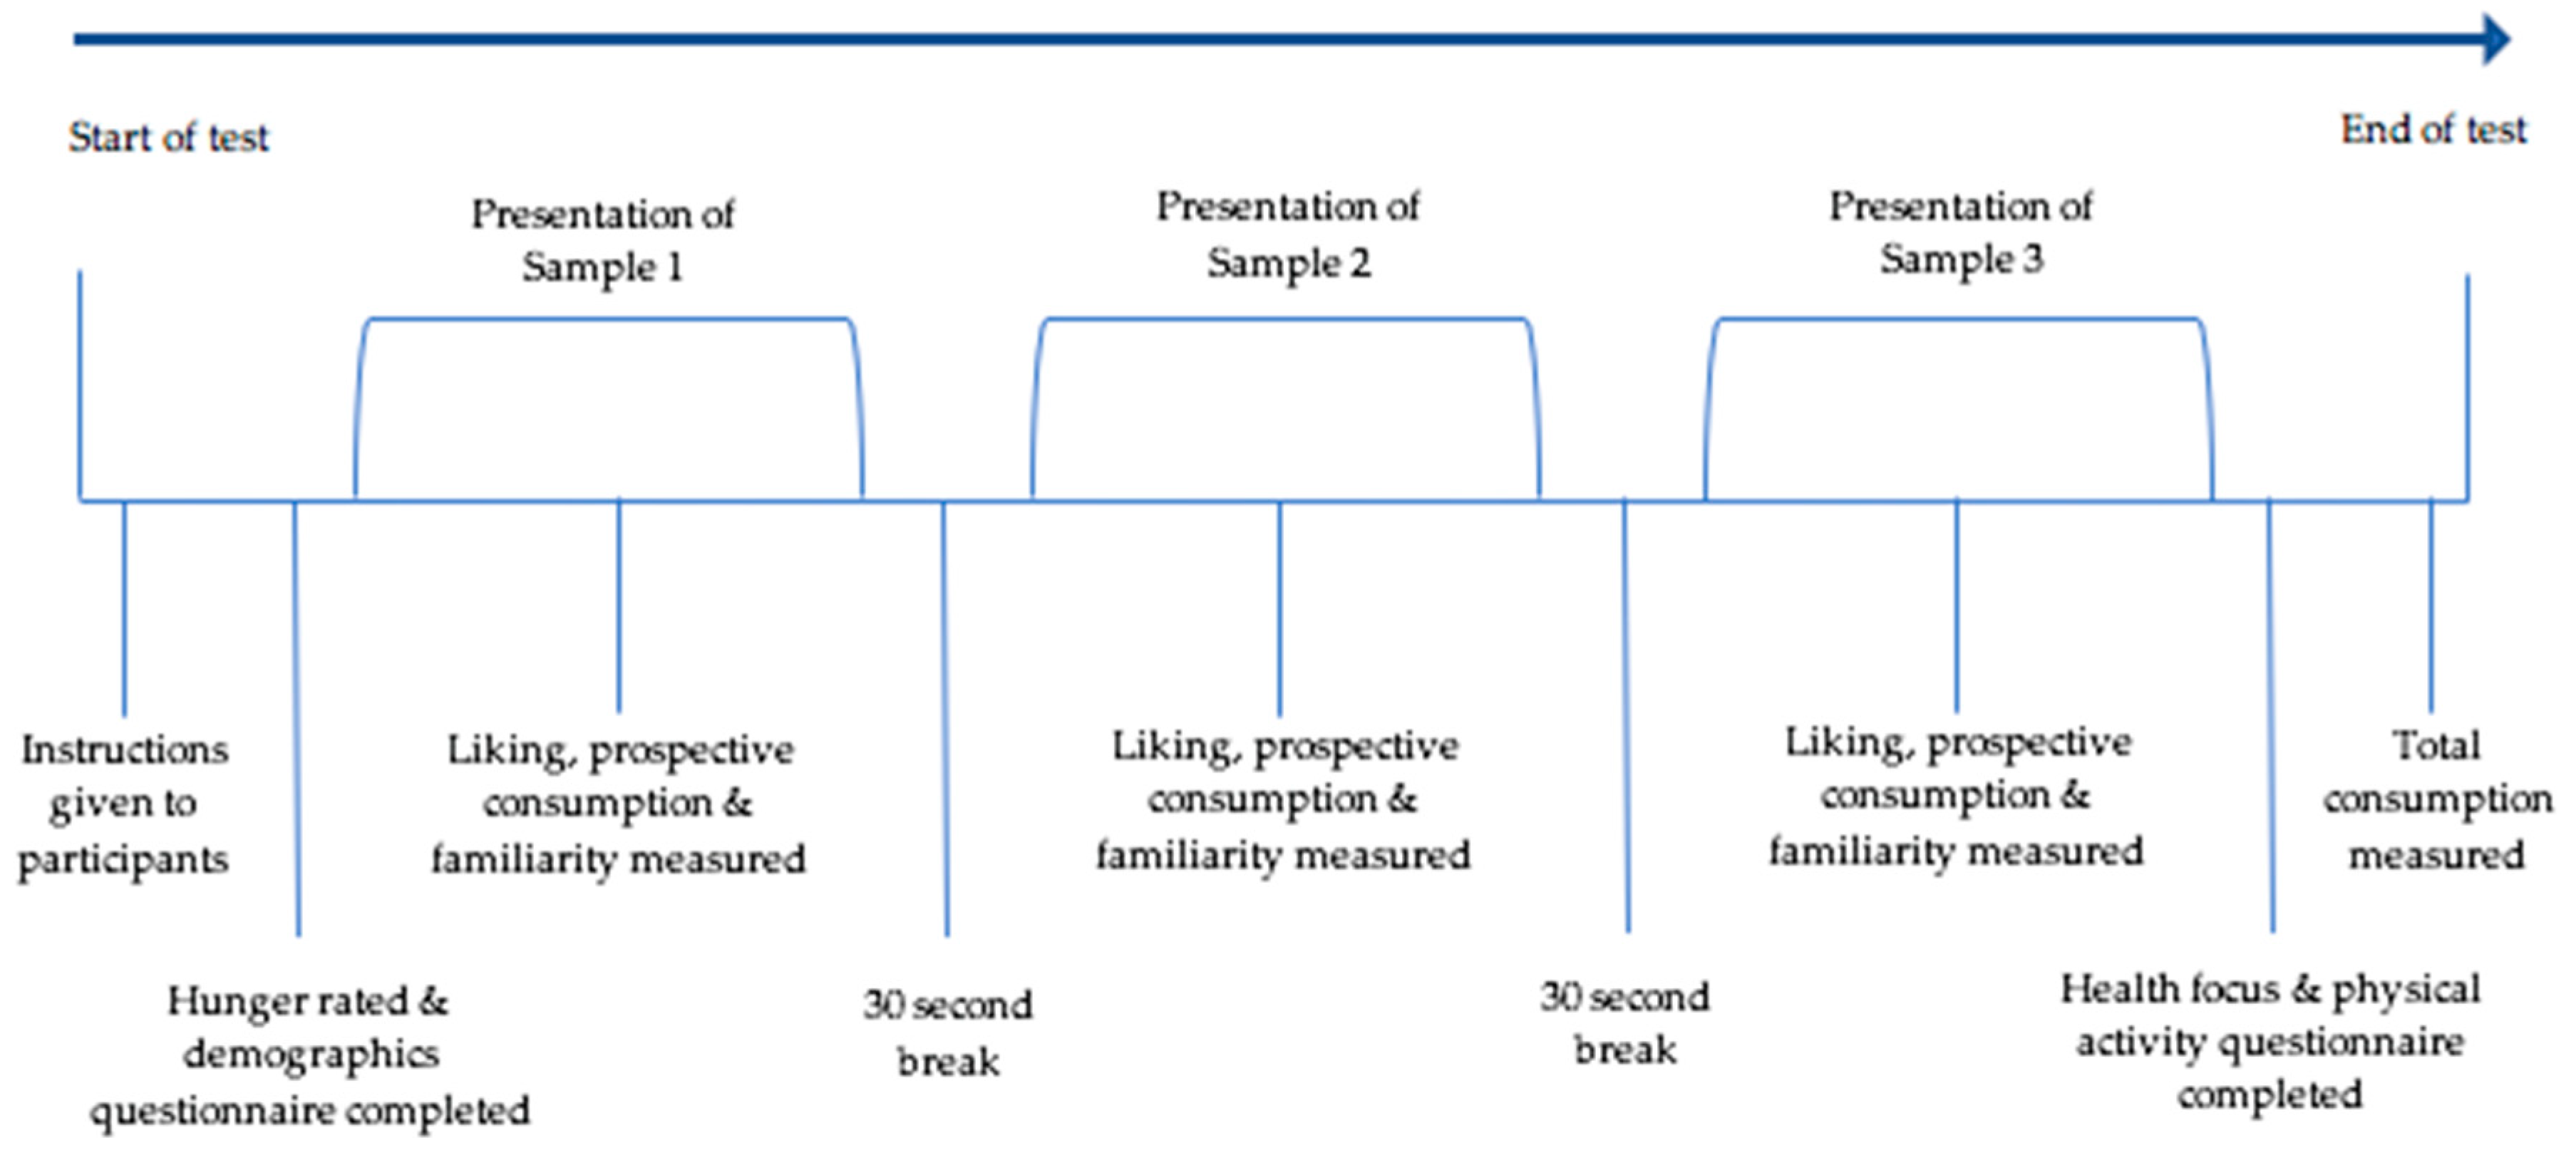
2.5. Procedure
2.6. Statistical Analyses
2.7. Ethics
3. Results
3.1. Demographic Information
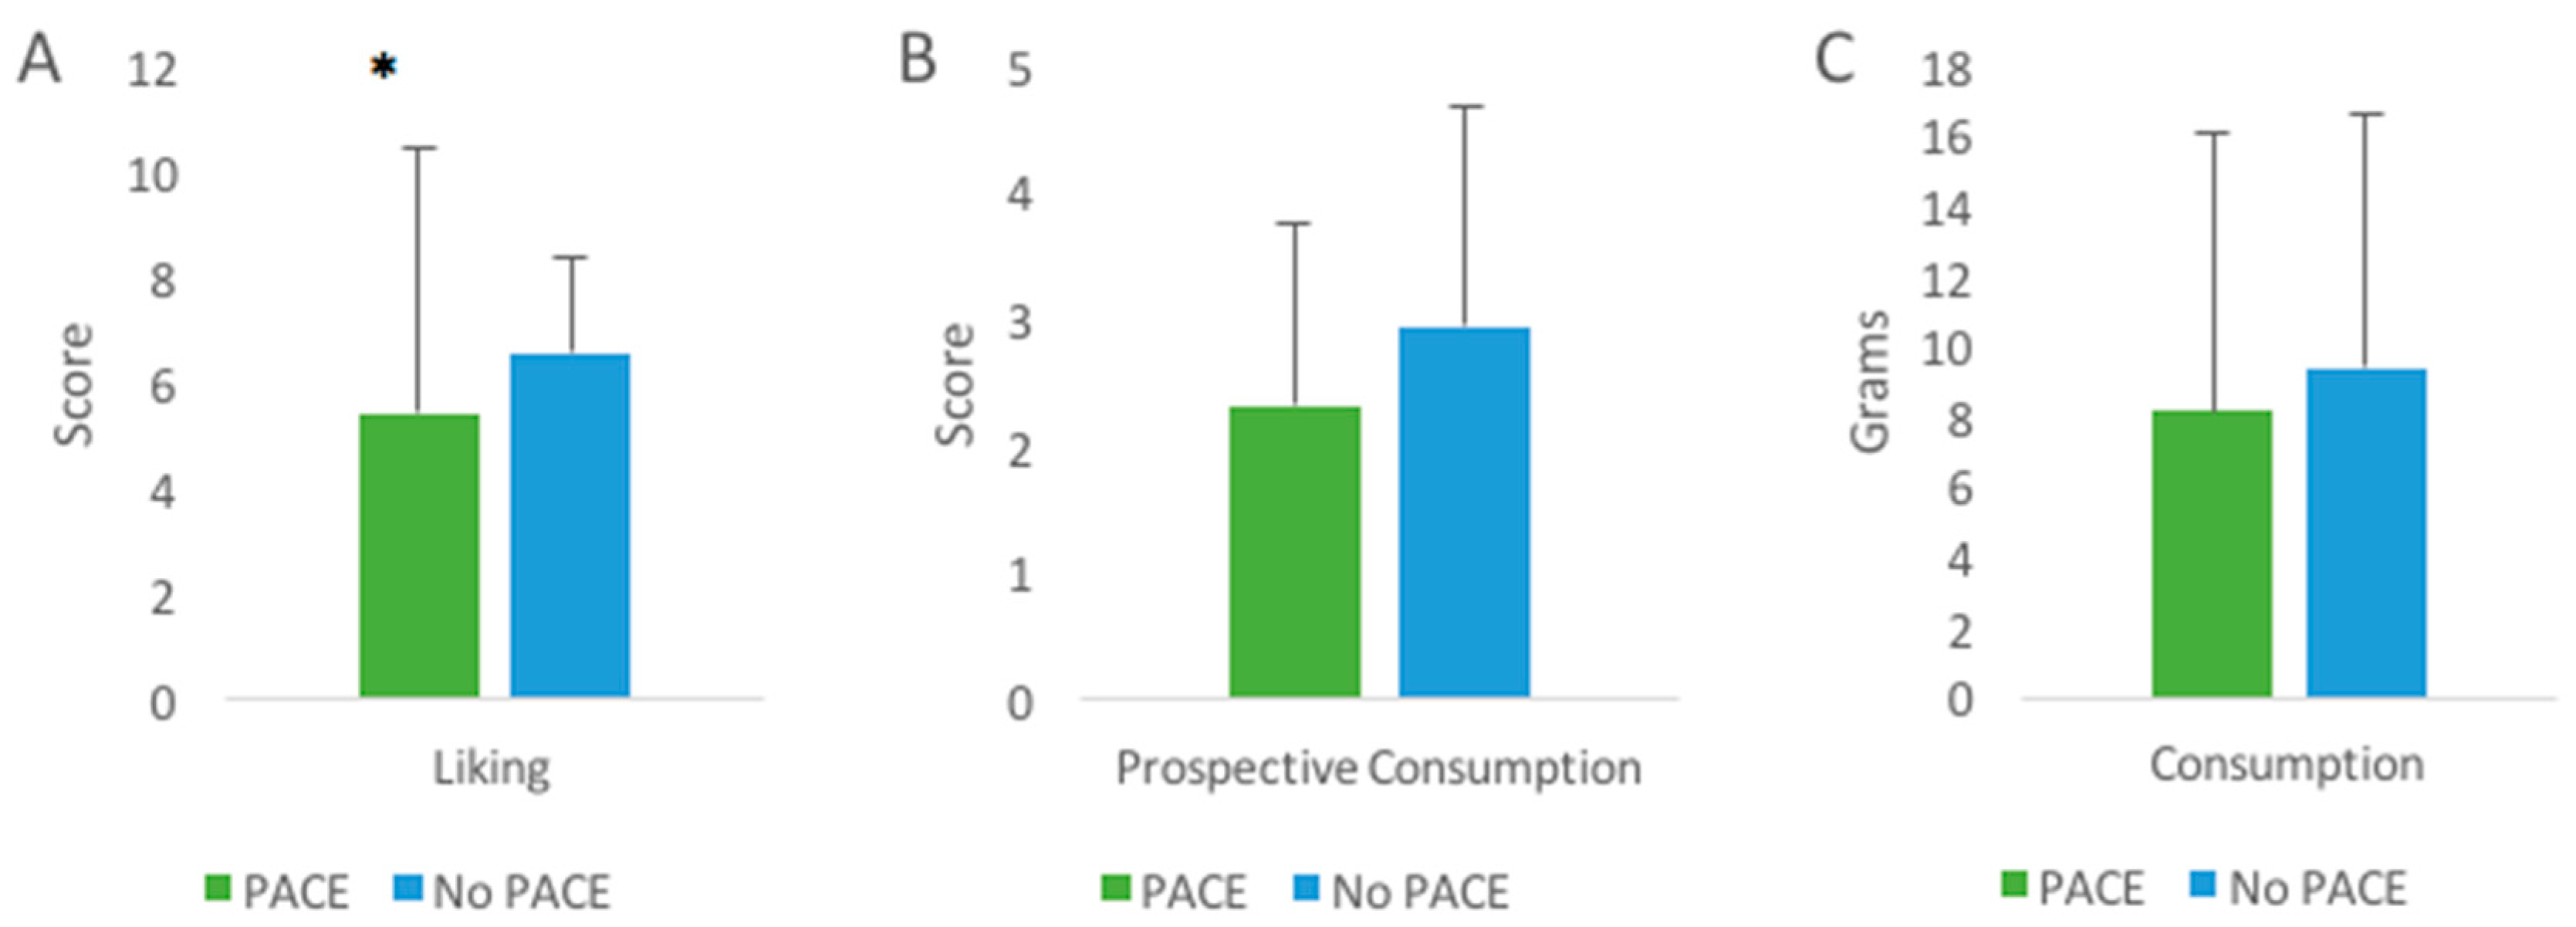
3.2. Liking
3.3. Prospective Consumption
3.4. Consumption
3.5. Association between Health Focus and Physical Activity
4. Discussion
Limitations
5. Conclusions
Author Contributions
Funding
Conflicts of Interest
References
- World Health Organization. Obesity and Overweight; World Health Organization: Geneva, Switzerland, 2016. [Google Scholar]
- Avsar, G.; Ham, R.; Tannous, W.K. Factors Influencing the Incidence of Obesity in Australia: A Generalized Ordered Probit Model. Int. J. Environ. Res. Public Health 2017, 14. [Google Scholar] [CrossRef] [PubMed]
- Australian Institute of Health and Welfare. Overweight and Obesity. Available online: http://www.aihw.gov.au/overweight-and-obesity/ (accessed on 23 April 2017).
- Gill, T.P.; Baur, L.A.; Bauman, A.E.; Steinbeck, K.S.; Storlien, L.H.; Fiatarone Singh, M.A.; Brand-Miller, J.C.; Colagiuri, S.; Caterson, I.D. Childhood Obesity In Australia Remains A Widespread Health Concern That Warrants Population-wide Prevention Programs. Med. J. Aust. 2009, 190, 146–148. [Google Scholar] [PubMed]
- Access Economics. The Growing Cost of Obesity in 2008: Three Years on 2008; Access Economics: Canberra, Australia, 2008. [Google Scholar]
- Colagiuri, S.; Lee, C.M.; Colagiuri, R.; Magliano, D.; Shaw, J.E.; Zimmet, P.Z.; Caterson, I.D. The cost of overweight and obesity in Australia. Med. J. Aust. 2010, 192, 260–264. [Google Scholar] [PubMed]
- Australian Bureau of Statistics. Australian Health Survey: Nutrition First Results–Foods and Nutrients 2011-12; ABS: Canberra, Australia, 2014.
- Dowray, S.; Swartz, J.J.; Braxton, D.; Viera, A.J. Potential effect of physical activity based menu labels on the calorie content of selected fast food meals. Appetite 2013, 62, 173–181. [Google Scholar] [CrossRef] [PubMed]
- Royal Society for Public Health. Introducting “Activity Eqivalent” Calorie Labelling to Tackle Obesity; Royal Society For Public Health: London, UK, 2016. [Google Scholar]
- Sinclair, S.E.; Cooper, M.; Mansfield, E.D. The influence of menu labeling on calories selected or consumed: A systematic review and meta-analysis. J. Acad. Nutr. Diet 2014, 114, 1375–1388.e15. [Google Scholar] [CrossRef] [PubMed]
- National Health and Research Medical Council. Australian Dietary Guidelines Department of Health and Ageing; Australian Government: Canberra, Australia, 2013.
- Niven, P.; Scully, M.; Morley, B.; Baur, L.; Crawford, D.; Pratt, I.S.; Wakefield, M. What factors are associated with frequent unhealthy snack-food consumption among Australian secondary-school students? Public Health Nutr. 2015, 18, 2153–2160. [Google Scholar] [CrossRef] [PubMed]
- Whybrow, S.; Mayer, C.; Kirk, T.R.; Mazlan, N.; Stubbs, R.J. Effects of two weeks’ mandatory snack consumption on energy intake and energy balance. Obesity (Silver Spring) 2007, 15, 673–685. [Google Scholar] [CrossRef] [PubMed]
- Gregori, D.; Foltran, F.; Ghidina, M.; Berchialla, P. Understanding the influence of the snack definition on the association between snacking and obesity: A review. Int. J. Food Sci. Nutr. 2011, 62, 270–275. [Google Scholar] [CrossRef] [PubMed]
- Bes-Rastrollo, M.; Sanchez-Villegas, A.; Basterra-Gortari, F.J.; Nunez-Cordoba, J.M.; Toledo, E.; Serrano-Martinez, M. Prospective study of self-reported usual snacking and weight gain in a Mediterranean cohort: The SUN project. Clin. Nutr. 2010, 29, 323–330. [Google Scholar] [CrossRef] [PubMed]
- Drewnowski, A.; Specter, S.E. Poverty and obesity: The role of energy density and energy costs. Am. J. Clin. Nutr. 2004, 79, 6–16. [Google Scholar] [CrossRef] [PubMed]
- Prentice, A.M.; Jebb, S.A. Fast foods, energy density and obesity: A possible mechanistic link. Obes. Rev. 2003, 4, 187–194. [Google Scholar] [CrossRef] [PubMed]
- Rouhani, M.H.; Haghighatdoost, F.; Surkan, P.J.; Azadbakht, L. Associations between dietary energy density and obesity: A systematic review and meta-analysis of observational studies. Nutrition 2016, 32, 1037–1047. [Google Scholar] [CrossRef] [PubMed]
- Bleich, S.N.; Wolfson, J.A. Weight loss strategies: Association with consumption of sugary beverages, snacks and values about food purchases. Patient Educ. Couns. 2014, 96, 128–134. [Google Scholar] [CrossRef] [PubMed] [Green Version]
- Kumanyika, S.K.; Obarzanek, E.; Stettler, N.; Bell, R.; Field, A.E.; Fortmann, S.P.; Franklin, B.A.; Gillman, M.W.; Lewis, C.E.; Poston, W.C., II; et al. Population-based prevention of obesity: The need for comprehensive promotion of healthful eating, physical activity, and energy balance: A scientific statement from American Heart Association Council on Epidemiology and Prevention, Interdisciplinary Committee for Prevention (formerly the expert panel on population and prevention science). Circulation 2008, 118, 428–464. [Google Scholar] [PubMed]
- Buttriss, J.L. Food reformulation: The challenges to the food industry. Proc. Nutr. Soc. 2013, 72, 61–69. [Google Scholar] [CrossRef] [PubMed]
- Van Kleef, E.; van Trijp, H.; Paeps, F.; Fernández-Celemín, L. Consumer preferences for front-of-pack calories labelling. Public Health Nutr. 2008, 11, 203–213. [Google Scholar] [CrossRef] [PubMed]
- Talati, Z.; Pettigrew, S.; Hughes, C.; Dixon, H.; Kelly, B.; Ball, K.; Miller, C. The combined effect of front-of-pack nutrition labels and health claims on consumers’ evaluation of food products. Food Qual. Prefer. 2016, 53, 57–65. [Google Scholar] [CrossRef]
- Deliza, R.; MacFie, H.J.H. The Generation of Sensory Expectations By External Cues and Its Effect On Sensory Perception and Hedonic Ratings: A Review. J. Sens. Stud. 1996, 11, 103–128. [Google Scholar] [CrossRef]
- Mueller, S.; Szolnoki, G. The relative influence of packaging, labelling, branding and sensory attributes on liking and purchase intent: Consumers differ in their responsiveness. Food Qual. Prefer. 2010, 21, 774–783. [Google Scholar] [CrossRef]
- Becker, M.W.; Bello, N.M.; Sundar, R.P.; Peltier, C.; Bix, L. Front of pack labels enhance attention to nutrition information in novel and commercial brands. Food Policy 2015, 56, 76–86. [Google Scholar] [CrossRef] [PubMed] [Green Version]
- Dumanovsky, T.; Huang, C.Y.; Nonas, C.A.; Matte, T.D.; Bassett, M.T.; Silver, L.D. Changes in energy content of lunchtime purchases from fast food restaurants after introduction of calorie labelling: Cross sectional customer surveys. Br. Med. J. 2011, 343, d4464. [Google Scholar] [CrossRef] [PubMed]
- Ellison, B.; Lusk, J.L.; Davis, D. Looking at the label and beyond: The effects of calorie labels, health consciousness, and demographics on caloric intake in restaurants. Int. J. Behav. Nutr. Phys. Act. 2013, 10, 21. [Google Scholar] [CrossRef] [PubMed]
- Lawrence, M.; Pollard, C. A Year On, Australia’s Health Star Food-Rating System Is Showing Cracks. Available online: https://theconversation.com/a-year-on-australias-health-star-food-rating-system-is-showing-cracks-42911 (accessed on 17 October 2017).
- Antonelli, R.; Viera, A.J. Potential Effect of Physical Activity Calorie Equivalent (PACE) Labeling on Adult Fast Food Ordering and Exercise. PLoS ONE 2015, 10, e0134289. [Google Scholar] [CrossRef] [PubMed]
- Masic, U.; Christiansen, P.; Boyland, E.J. The influence of calorie and physical activity labelling on snack and beverage choices. Appetite 2017, 112, 52–58. [Google Scholar] [CrossRef] [PubMed]
- Cramer, S. Food should be labelled with the exercise needed to expend its calories. Br. Med. J. 2016, 353, i1856. [Google Scholar] [CrossRef] [PubMed]
- Cowburn, G.; Stockley, L. Consumer understanding and use of nutrition labelling: A systematic review. Public Health Nutr. 2005, 8, 21–28. [Google Scholar] [CrossRef] [PubMed]
- Hartley, I.E.; Keast, R.S.J.; Liem, D.G. Physical activity-equivalent label reduces consumption of discretionary snack foods. Public Health Nutr. 2018, 21, 1435–1443. [Google Scholar] [CrossRef] [PubMed]
- Becker, M.H.; Maiman, L.A. Sociobehavioral Determinants of Compliance with Health and Medical Care Recommendations. Med Care 1975, 13, 10–24. [Google Scholar] [CrossRef] [PubMed]
- Newsom, J.T.; McFarland, B.H.; Kaplan, M.S.; Huguet, N.; Zani, B. The health consciousness myth: Implications of the near independence of major health behaviors in the North American population. Soc. Sci. Med. 2005, 60, 433–437. [Google Scholar] [CrossRef] [PubMed]
- Mesanovic, E.; Kadic-Maglajlic, S.; Cicic, M. Insights into Health Consciousness in Bosnia and Herzegovina. Procedia Soc. Behav. Sci. 2013, 81, 570–575. [Google Scholar] [CrossRef] [Green Version]
- Dutta-Bergman, M.J. An Alternative Approach to Social Capital: Exploring the Linkage Between Health Consciousness and Community Participation. Health Commun. 2004, 16, 393–409. [Google Scholar] [CrossRef] [PubMed]
- Shamal, S.; Mohan, B.C. Consumer behaviour in fortified food choice decisions in India. Nutr. Food Sci. 2017, 47, 229. [Google Scholar] [CrossRef]
- Visschers, V.H.; Hess, R.; Siegrist, M. Health motivation and product design determine consumers’ visual attention to nutrition information on food products. Public Health Nutr. 2010, 13, 1099–1106. [Google Scholar] [CrossRef] [PubMed] [Green Version]
- Roininen, K. Evaluation of Food Choice Behavior: Development and Validation of Health and Taste Attitude Scales; University of Helsinki: Helsinki, Finland, 2001. [Google Scholar]
- Liem, D.G.; Toraman Aydin, N.; Zandstra, E.H. Effects of health labels on expected and actual taste perception of soup. Food Qual. Prefer. 2012, 25, 192–197. [Google Scholar] [CrossRef]
- Kowalkowska, J.; Lonnie, M.; Wadolowska, L.; Czarnocinska, J.; Jezewska-Zychowicz, M.; Babicz-Zielinska, E. Health- and Taste-Related Attitudes Associated with Dietary Patterns in a Representative Sample of Polish Girls and Young Women: A Cross-Sectional Study (GEBaHealth Project). Nutrients 2018, 10. [Google Scholar] [CrossRef] [PubMed]
- Craig, C.L.; Marshall, A.L.; Sjostrom, M.; Bauman, A.E.; Booth, M.L.; Ainsworth, B.E.; Pratt, M.; Ekelund, U.; Yngve, A.; Sallis, J.F.; et al. International physical activity questionnaire: 12-country reliability and validity. Med. Sci. Sports Exerc. 2003, 35, 1381–1395. [Google Scholar] [CrossRef] [PubMed]
- IPAQ. Guidelines for Data Processing and Analysis of the International Physical Activity Questionnaire (IPAQ)-Short Form. 2004. Available online: http://www.ipaq.ki.se/scoring.pdf (accessed on 17 September 2017).
- World Health Organization. Global Physical Activity Questionnaire Analysis Guide; World Health Organization: Geneva, Switzerland, 2013. [Google Scholar]
- Mai, R.; Hoffmann, S. How to combat the unhealthy = Tasty intuition: The influencing role of health consciousness. J. Public Policy Mark. 2015, 34, 63–83. [Google Scholar] [CrossRef]
- Walls, H.L.; Peeters, A.; Loff, B.; Crammond, B.R. Why Education and Choice Won’t Solve the Obesity Problem. Am. J. Public Health 2009, 99, 590–592. [Google Scholar] [CrossRef] [PubMed]
- Swinburn, B.A.; Sacks, G.; Hall, K.D.; McPherson, K.; Finegood, D.T.; Moodie, M.L.; Gortmaker, S.L. The global obesity pandemic: Shaped by global drivers and local environments. Lancet 2011, 378, 804–814. [Google Scholar] [CrossRef]
- Schwarzer, R. Social-cognitive factors in changing health-related behaviors. Curr. Dir. Psychol. Sci. 2001, 10, 47–51. [Google Scholar] [CrossRef]
- Iversen, A.C.; Kraft, P. Does socio-economic status and health consciousness influence how women respond to health related messages in media? Health Educ. Res. 2006, 21, 601–610. [Google Scholar] [CrossRef] [PubMed] [Green Version]
- Petty, R.; Cacioppo, J.T. Involvement and persuasion—Tradition versus integration. Psychol. Bull. 1990, 107, 367–374. [Google Scholar] [CrossRef]
- Rosen, C.S. Integrating stage and continuum models to explain processing of exercise messages and exercise initiation among sedentary college students. Health Psychol. 2000, 19, 172–180. [Google Scholar] [CrossRef] [PubMed]
- Ripptoe, P.; Rogers, R.W. Effects of components of protection-motivation theory on adaptive and maladaptive coping with a health threat. J. Personal. Soc. Psychol. 1987, 52, 596–604. [Google Scholar] [CrossRef]
- Rogers, R. Protection motivation theory. In Handbook of Health Behavior Research: Personal and Social Determinants; Gochman, D.S., Ed.; Plenum Press: New York, NY, USA, 1997. [Google Scholar]
- Schafer, R.; Schafer, E.; Bultena, G.; Hoiberg, E. Coping with a health threat: A study of food safety. J. Appl. Soc. Psychol. 1993, 386–394. [Google Scholar] [CrossRef]
- Fishbach, A.; Zhang, Y. Together or apart: When goals and temptations complement versus compete. J. Personal. Soc. Psychol. 2008, 94, 547–559. [Google Scholar] [CrossRef] [PubMed]
- Wilcox, K.; Vallen, B.; Block, L.; Fitzsimons, G.J. Vicarious Goal Fulfillment: When the Mere Presence of a Healthy Option Leads to an Ironically Indulgent Decision. J. Consum. Res. 2009, 36, 380–393. [Google Scholar] [CrossRef] [Green Version]
- Talati, Z.; Pettigrew, S.; Dixon, H.; Neal, B.; Ball, K.; Hughes, C. Do Health Claims and Front-of-Pack Labels Lead to a Positivity Bias in Unhealthy Foods? Nutrients 2016, 8, 787. [Google Scholar] [CrossRef] [PubMed]
- Coveney, J. Food and trust in Australia: Building a picture. Public Health Nutr. 2008, 11, 237–245. [Google Scholar] [CrossRef] [PubMed]
- Hoogland, C.T.; de Boer, J.; Boersema, J.J. Food and sustainability: Do consumers recognize, understand and value on-package information on production standards? Appetite 2007, 49, 47–57. [Google Scholar] [CrossRef] [PubMed]
- McEachern, M.G.; Warnaby, G. Exploring the relationship between consumer knowledge and purchase behaviour of value-based labels. Int. J. Consum. Stud. 2008, 32, 414–426. [Google Scholar] [CrossRef]
- Meiselman, H.L. Methodology and theory in human eating research. Appetite 1992, 19, 49–55. [Google Scholar] [CrossRef]
- De Castro, J.M. Eating behavior: Lessons from the real world of humans. Nutrition 2000, 16, 800–813. [Google Scholar] [CrossRef]
- Williams, P. Consumer understanding and use of health claims for foods. Nutr. Rev. 2005, 63, 256–264. [Google Scholar] [CrossRef] [PubMed]


| Blinding Code | Sample |
|---|---|
| 843 | Control: Sakata Seaweed Rice Cracker |
| 157 | PACE: Arnott’s Nacho Cheese Shapes |
| 825 | Arnott’s Nacho Cheese Shapes |
| 125 | PACE: Want Want Cheese Rice Cracker |
| 427 | Want Want Cheese Rice Cracker |
| I am very particular about the healthiness of food |
| I always follow a healthy and balanced diet |
| It is important for me that my diet is low in fat |
| It is important to me that my daily diet contains a lot of vitamins and minerals |
| I eat what I like and do not worry about healthiness of food R |
| The healthiness of food has little impact on my food choice R |
| The healthiness of snacks makes no difference to me R |
| I do not avoid any foods, even if they may raise my cholesterol R |
| Less Health Focused 2 (n = 40) (mean ± SD) | More Health Focused 2 (n = 57) (mean ± SD) | |
|---|---|---|
| Male:Female * | 43%:58% | 30%:70% |
| Age (years) | 34 ± 12 | 36 ± 14 |
| Height (cm) | 164 ± 27 | 165 ± 17 |
| Weight * (kgs) | 88 ± 19 | 67 ± 13 |
| BMI * | 32 ± 7 | 25 ± 5 |
| Physically active 1,* | 58% | 32% |
| Physically inactive 1 | 42% | 68% |
| Liking | Prospective Consumption | Consumption | |
|---|---|---|---|
| Mean (SD) | Mean (SD) | Mean (SD) | |
| Familiar Product (Arnott’s Nacho Cheese Shapes) | |||
| PACE | 6.50 (1.8) | 3.18 (2.1) | 10.01 (8.5) |
| No PACE | 6.85 (1.5) | 3.34 (1.7) | 11.17 (7.8) |
| Unfamiliar Product (Want Want Cheese Rice Crackers) | |||
| PACE | 5.24 (2.5) | 2.42 (1.5) | 8.17 (8.3) |
| No PACE | 5.86 (2.2) | 2.79 (2.1) | 8.47 (7.9) |
© 2019 by the authors. Licensee MDPI, Basel, Switzerland. This article is an open access article distributed under the terms and conditions of the Creative Commons Attribution (CC BY) license (http://creativecommons.org/licenses/by/4.0/).
Share and Cite
Hartley, C.; Keast, R.S.; Liem, D.G. The Response of More Health Focused and Less Health Focused People to a Physical Activity Calorie Equivalent Label on Discretionary Snack Foods. Nutrients 2019, 11, 525. https://doi.org/10.3390/nu11030525
Hartley C, Keast RS, Liem DG. The Response of More Health Focused and Less Health Focused People to a Physical Activity Calorie Equivalent Label on Discretionary Snack Foods. Nutrients. 2019; 11(3):525. https://doi.org/10.3390/nu11030525
Chicago/Turabian StyleHartley, Claudia, Russell SJ Keast, and Djin Gie Liem. 2019. "The Response of More Health Focused and Less Health Focused People to a Physical Activity Calorie Equivalent Label on Discretionary Snack Foods" Nutrients 11, no. 3: 525. https://doi.org/10.3390/nu11030525