1. Introduction
A rapidly expanding literature suggests that the gut microbiota may have beneficial or harmful impacts on health [
1,
2]. Diet plays an important role in modulating gut microbiota, although much of this work has been in adults with little research undertaken in children [
3,
4]. A dietary component of particular interest is dietary fiber, as it is the main food source for the gut microbiota [
5,
6]. Because different classes (soluble, insoluble) or fractions (e.g., arabinoxylan from whole grains, pectin from fruits, and cellulose from vegetables) of fiber appear to impact gut microbiota in different ways [
7,
8,
9,
10], appropriate dietary assessment techniques must be used to improve understanding of how diet influences the microbiota and subsequent health outcomes. While weighed diet records (WDR) or 24-h recalls are generally considered gold standard methods of dietary assessment [
11], they entail considerable respondent and researcher burden, and do not directly assess ‘usual’ intake. Food frequency questionnaires (FFQ) have lower respondent burden, estimate usual intake, and can be used in larger studies examining the long-term effects of diet on the gut microbiota. However, the validity of any new FFQ must be determined in order to ensure that it adequately measures the nutrients of interest in the relevant population [
12].
In addition to investigating intake of nutrients, such as dietary fiber, it is also important to be able to determine intake of foods. Most foods are complex combinations of multiple nutrients and food components that cannot be captured by simply measuring nutrient intake, we eat foods rather than nutrients, and dietary guidelines refer to foods rather than nutrients [
12].
To date, no studies have validated an FFQ specifically designed to look at both nutrients and food groups of relevance to the gut microbiota, specifically dietary fiber [
9], soluble and insoluble non-starch polysaccharides (NSP) [
7,
8], and food groups that are high and low in fiber. Therefore, the aim of this study was to determine the relative validity and reproducibility of the EAT5 FFQ for estimating intake of both nutrients and food groups of relevance to the gut microbiota in 5-year old New Zealand children.
2. Materials and Methods
2.1. Study Design
The study was designed to validate the EAT5 FFQ for measuring intake of nutrients (energy, carbohydrate, fiber, total NSP, soluble NSP, and insoluble NSP) and food groups (e.g., ‘Higher fiber more healthy cereals’, ‘Higher fiber less healthy cereals’, ‘Lower fiber more healthy cereals’, ‘Lower fiber less healthy cereals’, ‘Nuts and legumes’, ‘Fruits’, ’Vegetables’, ‘Potatoes and hot chips’, ‘Yoghurt’). Parent and child participants attended two appointments four weeks apart. At the first appointment, the EAT5 FFQ and socio-demographic questionnaire were completed by the parents, and anthropometric measurements of the child were obtained. A 3-day WDR was completed over the following four weeks. At the second appointment, the EAT5 FFQ was administered again so that reproducibility could be assessed. The FFQs asked about intake in the past month.
2.2. Participants
A convenience sample of 100 participants (parent-child pairs) was recruited from Dunedin, Auckland and Wellington (New Zealand) from February 2015 to December 2017. The child had to be healthy and aged ≥5 to ≤6 years during the time of assessment to be eligible for the study. The study was conducted in accordance with the Declaration of Helsinki. The Human Ethics Committee of the University of Otago, Dunedin, New Zealand, granted ethical approval for the study (reference number H14/154). Written informed consent was obtained from all parents and children.
Parents completed a questionnaire on their child’s age, sex, ethnicity and number of siblings. Using the participants’ home address, the NZDep2013 Index of Deprivation was determined (range from 1 to 10, with a value of 1 representing the least deprived 10% of New Zealand households, and a value of 10 representing the 10% most deprived) [
13]. The child’s height and weight were measured using standard protocols [
14]. Height was measured using a Leicester wall stadiometer (Tanita, IL, USA) to the nearest 0.1 cm, with duplicate measures taken (and a third measurement if duplicates were not within 0.7 cm of each other). Weight was measured using digital scales (Seca Alpha model 770; Seca, Hamburg, Germany) to the nearest 0.1 kg, with duplicate measures taken (and a third measurement if duplicates were not within 0.1 kg of each other). Body mass index (BMI) was calculated from the average of height and weight measurements using the formula: weight in kilograms divided by height in meters squared.
2.3. EAT5 Food Frequency Questionnaire
The EAT5 FFQ was designed to be quantitative, interviewer administered and to rank 5-year old children by intake over the past month of nutrients of relevance to the gut microbiota, with data collected from the primary caregiver (usually a parent). The EAT5 FFQ was a modified version of the previously validated EAT FFQ designed to assess nutrient intake [
15] and dietary patterns [
16] in New Zealand toddlers aged 12–24 months, which was in turn originally based on the Southampton Women’s Survey questionnaire for infants [
17]. For the EAT5 FFQ, the EAT food list was reconstructed to remove infant foods and to include a wider variety of fruit and vegetable food items in order to better differentiate between fiber fractions (e.g., soluble vs. insoluble NSPs). Three important components were present in the EAT5 FFQ: (i) cross-check questions for fruit and vegetable intake; (ii) use of volume for the amount eaten for foods that did not have a natural portion size (e.g., ‘slice’) with participants demonstrating volumes consumed using dried beans and rice on plates, bowls and cups; and (iii) a wide variety of fruit and vegetable food items—14 and 18 food items respectively. The cross-check question asked parent participants the overall frequency of their child’s fruit (or vegetable) consumption over the past month, so that the frequency of each individual item within the fruit (or vegetable) section could be weighted to adjust for the overall frequency (i.e., ‘fruit and vegetable adjusted’ frequency) [
18]. The EAT5 FFQ fruit (or vegetable) weighting factor was calculated as follows: ‘frequency from cross-check question’ divided by ‘sum of frequencies from the fruit (or vegetable)’. The weighting factor was then applied to the frequency for each fruit (or vegetable) item to get the ‘fruit and vegetable adjusted’ frequency value for that individual fruit (or vegetable) item. This was undertaken to account for the well-established overestimation in fruit and vegetable intake that can occur when participants estimate and report consumption frequency for multiple individual fruits and vegetables [
19,
20].
The EAT5 FFQ asked about intakes over the past month using 10 frequency-response options, ranging from ‘not eaten this month’ to an open-ended question for multiple times per day. The EAT5 FFQ comprised 123 food items under 11 section headings: (i) bread, crackers and breakfast cereals; (ii) rice and pasta; (iii) fruits; (iv) vegetables; (v) meat, chicken, fish, eggs, beans; (vi) spreads; (vii) cakes, biscuits, snacks; (viii) milk and dairy products; (ix) puddings; (x) drinks; (xi) takeaways. The EAT5 FFQ is available upon request from the corresponding author.
Nutrient intakes were calculated using FOODfiles 2014 [
21], except for NSP values where FOODfiles 2010 [
22] was used because these data were not available for all foods in FOODfiles 2014. Some of the 123 food items had multiple foods in the same food item question. For these food items, the nutrient composition of the individual foods was weighted using age-appropriate frequency and portion size consumption data [
23,
24].
2.4. Weighed Diet Record
Parents completed a 3-day WDR on 3 randomly assigned, non-consecutive days (1 weekend day and 2 week days) over four weeks. Participants were given detailed verbal and written instructions and a calibrated electronic kitchen scale (Salter Vista, Kent, UK; ±1 g) at the first visit and then contacted during the collection period so that they could ask further questions. On the second visit, the WDR was collected and checked by trained staff. Diet records were analyzed with the Kai-culator nutritional software package version 1.16a (Department of Human Nutrition, University of Otago, New Zealand) using the nutrient database FOODfiles 2014 [
21], except for NSP values where FOODfiles 2010 [
22] was used.
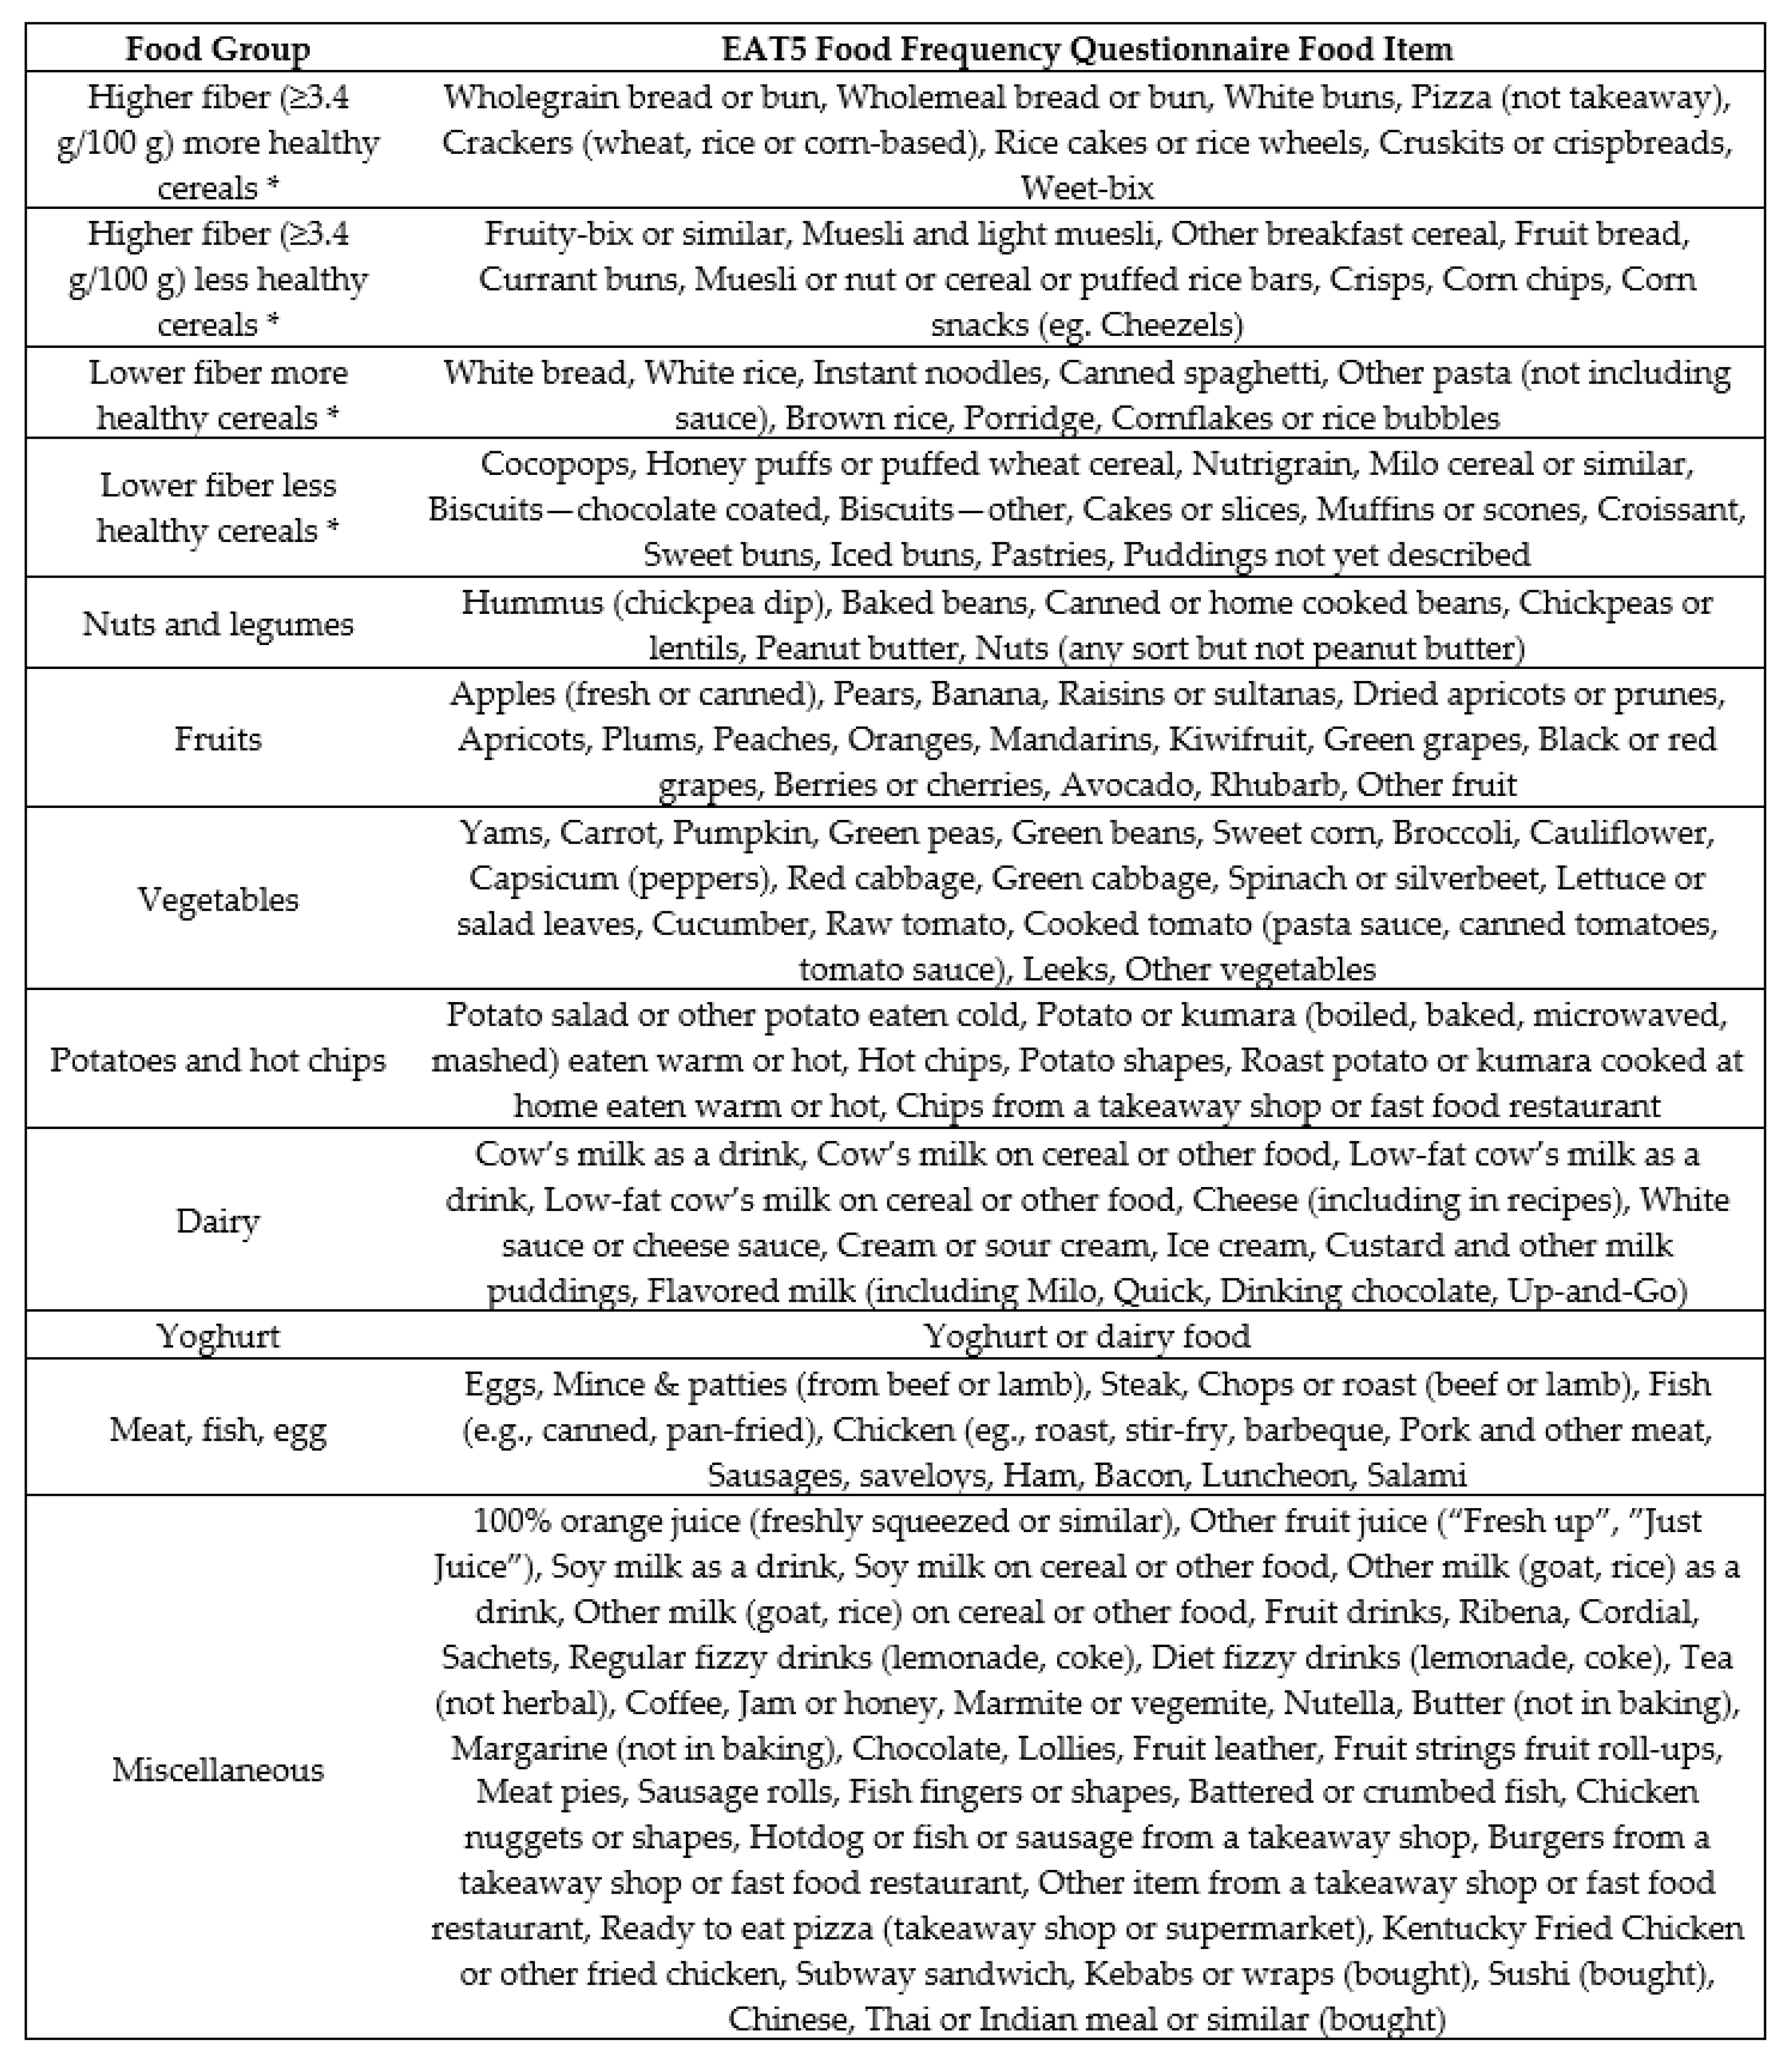
2.5. Food Groups
The 123food items in the EAT5 FFQ were assigned to 12 food groups that were defined based on food groups of relevance to the gut microbiota [
4,
7,
25,
26], and the number of consumers (i.e., at least 8 consumers were required in each food group so that there would be sufficient power to perform the food group analyses [
27]). Food items were allocated to the food groups based on nutrient profile and similarity of use (
Figure 1). The same 12 food groups were used for the 3-day WDR data. In total, 1010 individual food items were entered into Kai-culator from the WDRs. These 1010 individual food items were allocated to the 12 food groups, except for water, which was excluded.
2.6. Statistical Analysis
Data were analyzed using Stata statistical software (version 13; StataCorp, College Station, TX, USA). A p-value of p < 0.05 was considered to indicate statistical significance.
The EAT5 FFQ used for the validation analysis was randomly chosen from the first or second FFQ administered. Data reported in the main text uses the ‘fruit and vegetable adjusted’ EAT5 FFQ values, which were calculated using a weighting factor to adjust the individual fruit and vegetable food items for the participant’s overall consumption of fruits and vegetables (see above). Crude EAT5 FFQ values can be found in the
supplementary material (Tables S1–S6). Histograms were plotted for each variable and used to visually assess the normality of their distribution. The majority of the distributions were right-skewed so geometric means and 95% confidence intervals (CI) were used. However, the majority of the distributions of the paired differences were normally distributed. Spearman’s correlation coefficients were calculated comparing the FFQ with the WDR. Correlations of 0.30–0.49 were considered ‘acceptable’, 0.50–0.70 ‘good’ [
12], and >0.70 were considered ‘very good’. The WDR data were adjusted for intra-individual variation using the Multiple Source Method (MSM) program [
28] in order to provide a better estimate of ‘usual intake’. Cross-classification of WDR and FFQ quartiles was also carried out. The percentage of participants correctly classified was defined as the FFQ categorizing the diet into the same quartile as the WDR, while gross misclassification was defined as the FFQ categorizing the diet into the highest quartile when the WDR was categorized into the lowest quartile, and vice versa. The ‘absolute values for surrogate categories’ approach determines the extent to which intakes measured using a new method (EAT5 FFQ) reflect intakes measured using a reference method (WDR). Actual values for the surrogate categories [
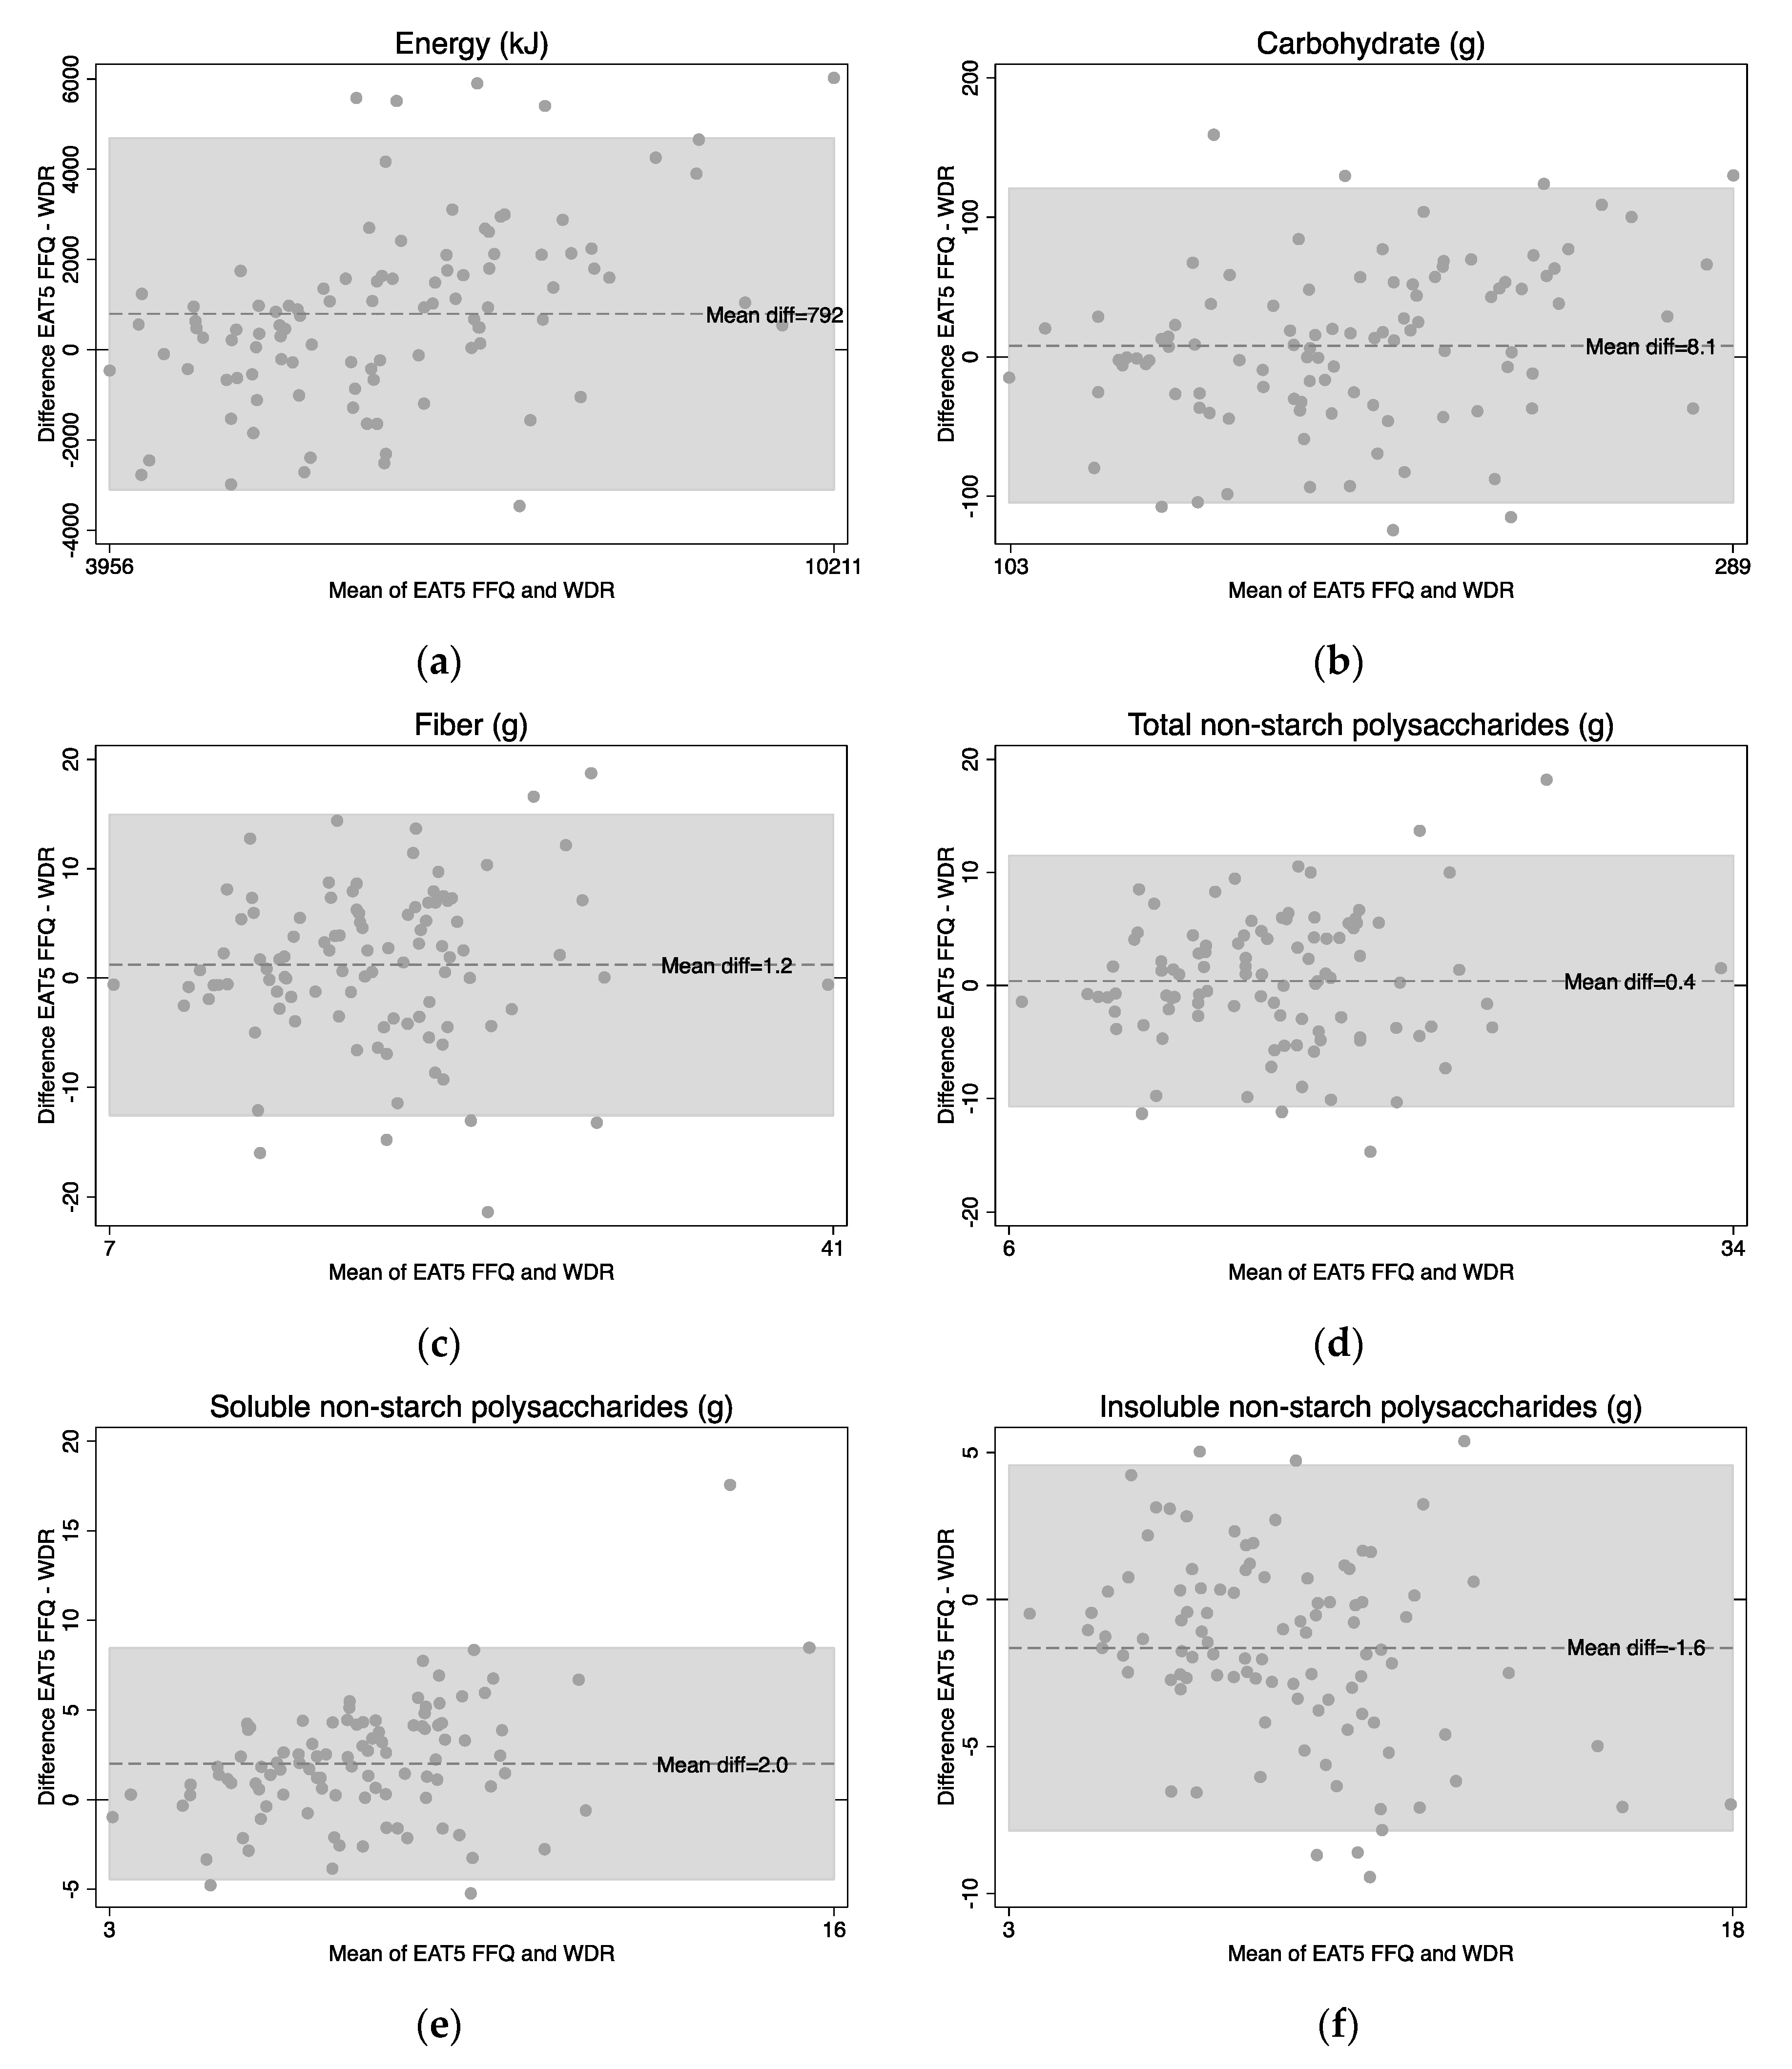
12] were calculated as follows: participants were assigned to quartiles according to intake estimated by the EAT5 FFQ, then the mean intake in each quartile was calculated using the intake determined by the WDR. Regression analyses were calculated to see if there was a trend in the step-wise increases across the quartiles, and the difference in quartile 1 to quartile 4. Bland-Altman analyses [
29] were used to assess the agreement between the FFQ and WDR at the individual level.
Intra-class correlation coefficients were calculated comparing the first and second administration of the EAT5 FFQ to assess reproducibility, with correlations of 0.30–0.49 considered ‘acceptable’, 0.50-0.70 ‘good’ [
12], and >0.70 ‘very good’.
4. Discussion
The EAT5 FFQ was designed to measure intakes of nutrients and food groups of relevance to the gut microbiota in 5-year old children and showed acceptable validity, and very high reproducibility, for these over a 4-week period. The FFQ provided good estimates of mean intakes of carbohydrate, fiber and total NSP intake, although it tended to overestimate energy (by 14%) and soluble NSP (32%) and underestimate insoluble NSP (by 18%) compared to the WDR; ranked most intakes acceptably (measured by correlation); and was able to differentiate well between categories of intake. Specifically, the EAT5 FFQ assigned children to correct quartiles of intake well, with very few children being grossly misclassified into the opposite quartile of intake, and was able to clearly differentiate between low and high intakes identified in the WDR.
It is difficult to compare our results directly with the literature given that no FFQs have been validated to specifically measure nutrients and foods of relevance to the gut microbiota in children. However, several validation studies have measured intake of energy and nutrients such as carbohydrate and fiber. The correlations we observed in the current study for these nutrients were within the range of those obtained in previous FFQ validation studies in young children [
33,
38,
39,
40,
41,
42]. Adjusting for usual intake (using MSM) resulted in a small improvement in correlation values. The cross-classification results for energy, carbohydrate and fiber were similar to [
31] and better than [
39] other FFQ validation studies in young children that have reported these data. Unfortunately, the food group correlations and cross-classifications cannot be compared to previous studies because food groupings depend on the nutrients of focus for the specific validation study, so are different for different studies. However, we believe the FFQ performs well in this context, with correlation values and gross-misclassification values for the food groups being comparable to those obtained for the nutrients in this study.
‘Absolute values for surrogate categories’ showed the expected stepwise increase for all nutrients and food groups and suggested that the EAT5 FFQ clearly differentiated between highest and lowest quartiles for all nutrients and food groups tested. The ‘absolute values for surrogate categories’ approach was developed by Willett [
12], and although it has not been commonly reported, it has been used in the validation of calcium intakes in children [
43] and iron intakes in adults [
44]. It is a useful validation tool as it indicates the extent to which an FFQ is able to differentiate between broad categories of intake, as is often required in epidemiological studies.
The reproducibility of the EAT5 FFQ was consistently high, with mean correlations for reproducibility for nutrients of 0.83 and food groups of 0.80. This was higher than the range of 0.26 to 0.78 that was found for the same nutrients in other FFQ validation studies [
31,
39,
41]. Bland-Altman plots for nutrients showed little bias in the EAT5 FFQ with a good scatter seen in the plots, but there was some bias for the food groups, particularly at higher intakes. As expected of an FFQ, the EAT5 FFQ had wide limits of agreement for nutrients and food groups suggesting that it is not appropriate for determining nutrient or food intake in individuals.
This study has several strengths. First, the EAT5 FFQ is the first FFQ validated to measure total, soluble and insoluble NSP intakes, and food groups of relevance to the gut microbiota, in children. The only other studies that have validated FFQs for nutrients of relevance to the gut microbiota (i.e., intake of NSPs [
45], dietary fiber [
46,
47], inulin and oligosaccharides [
48]) have been in adults. Interestingly, our study had lower correlations (i.e., they were ‘acceptable’) than the correlations that were obtained in an adult study, validating intake of NSPs (which were ‘acceptable’ to ‘good’) [
45]. A possible explanation may be that parental proxy reporting acts as an additional layer of potential error in assessing diets in children. However, the studies validating dietary fiber intake in adults [
46,
47] also used another questionnaire as the reference method, rather than a diet record. This means that they did not use a widely accepted method of dietary assessment with different errors to those of the FFQ as a reference method, as is recommended [
49], and as was used in the current study. Second, we aimed to validate several carbohydrate food groups of interest defined by their dietary fiber content and overall healthiness using strict criteria. By contrast, most previous studies have combined all carbohydrate containing foods into a single group such as cereal or grains [
16,
50] with most of the ‘less healthy’ carbohydrate foods appearing in the ‘snacks’ food group, even if they contained fiber [
51]. Third, we used a non-consecutive 3-day WDR as the reference method. Many other FFQ validation studies in children used 24-h recalls [
31,
33,
38,
39,
41,
42] or estimated diet records [
32], both of which have similar errors to an FFQ with potential for memory lapses and errors in portion size estimation. Finally, cross-check questions were used for the fruit and vegetable sections. Using the cross-check questions improved the performance of the EAT5 FFQ (unadjusted values can be found in the
supplementary material). This is particularly important, as the EAT5 FFQ was developed to look at nutrients of relevance to the gut microbiota and hence has a large number of fruit and vegetable questions. Fruit and vegetable food groups have been shown to be commonly over-reported in other FFQ validation studies [
18].
Our study has some limitations. First, the ethnicity of the participants is not representative of the New Zealand population as a whole, with a higher proportion of New Zealand Europeans, and an over-representation of participants from the lower and middle deciles of household deprivation. Second, the FFQ was administered only to the primary caregiver, and as the children were five years of age, they would be attending school, so were not with their parents at all times. However, in an effort to overcome this common limitation, parents were asked to report any food and amount eaten if someone else provided their child with food, and the child attended the appointment with their parent so was available for parents to clarify their answers. Third, it was only possible to test the ability of the FFQ to measure intake of fiber and total, soluble and insoluble NSPs, not intake of smaller fiber fractions such as arabinoxylan and pectin that may also impact on the gut microbiota. This was because these fractions are not measured and reported in the New Zealand food composition database, FOODfiles, and the literature was not sufficient to provide reliable data for all 1010 foods consumed in the WDRs.

 ,
, 


