The Potential Cost-Effectiveness and Equity Impacts of Restricting Television Advertising of Unhealthy Food and Beverages to Australian Children

 ,
,  , ,
, , 
Abstract
:1. Introduction
2. Materials and Methods
2.1. Current Practice
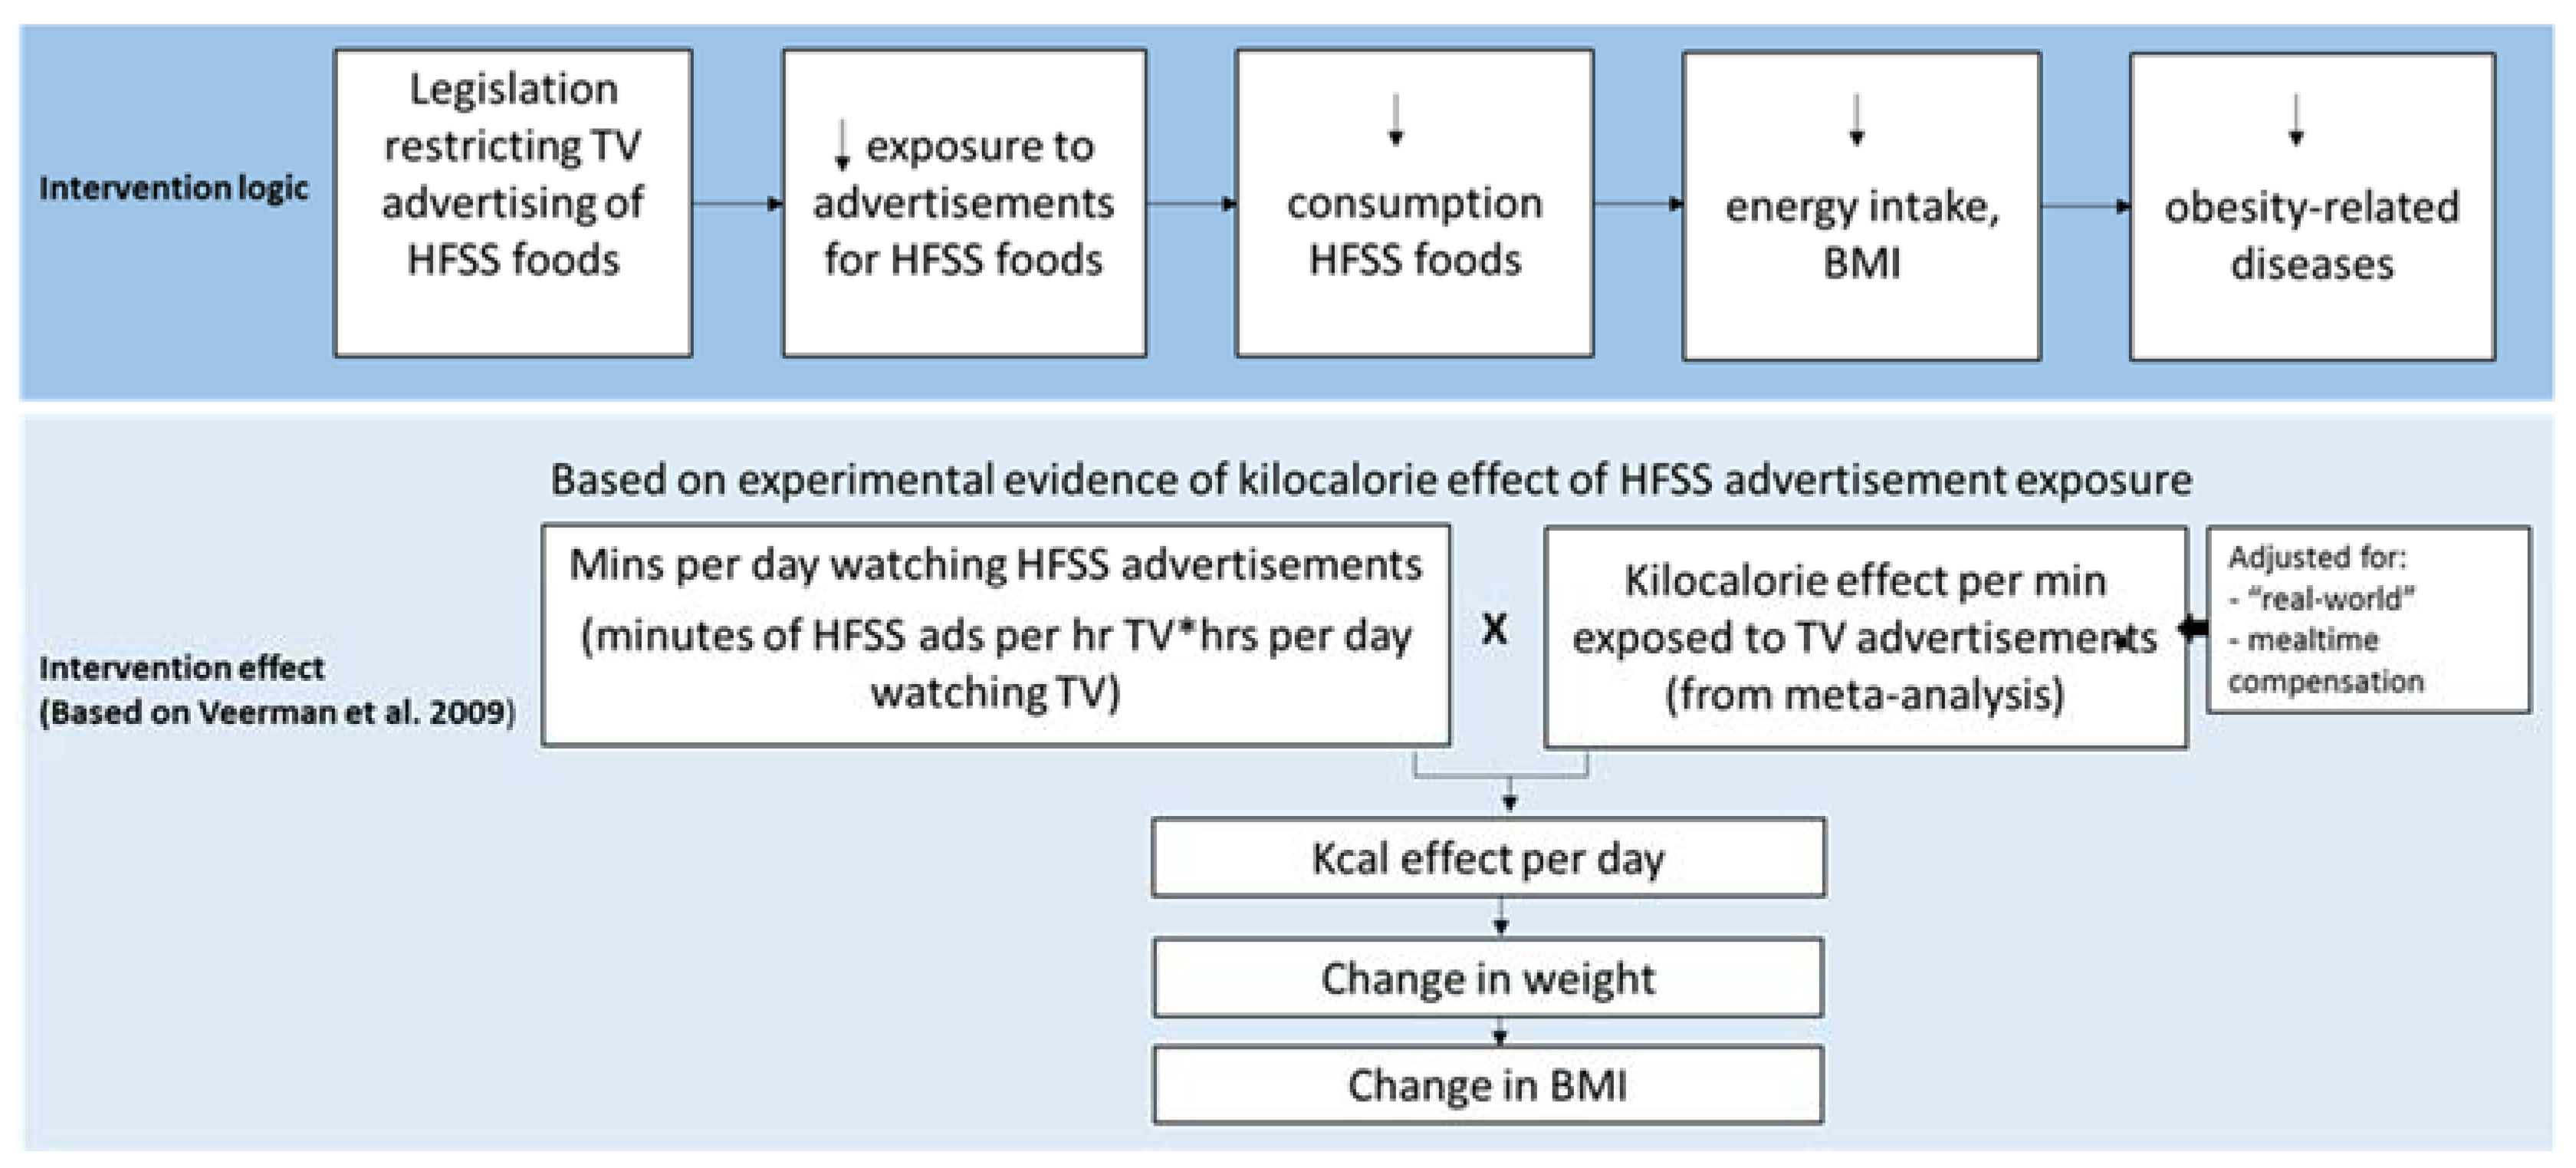
2.2. The Intervention
2.3. Assessment of Benefit
2.4. Assessment of Costs
2.5. Cost-Effectiveness Modelling
2.6. Sensitivity Analyses
2.7. Threshold Analysis
2.8. Implementation Considerations
3. Results
4. Discussion
5. Conclusions
Supplementary Materials
Author Contributions
Acknowledgments
Conflicts of Interest
References
- World Health Organisation. Report of the Commission on Ending Childhood Obesity; WHO: Geneva, Switzerland, 2016. [Google Scholar]
- Stettler, N.; Iotova, V. Early growth patterns and long-term obesity risk. Curr. Opin. Clin. Nutr. Metab. Care 2010, 13, 294–299. [Google Scholar] [CrossRef] [PubMed]
- Gebremariam, M.; Lien, N.; Nianogo, R.; Arah, O. Mediators of socioeconomic differences in adiposity among youth: A systematic review. Obes. Rev. 2017, 18, 880–898. [Google Scholar] [CrossRef] [PubMed]
- Peeters, A.; Backholer, K. Reducing socioeconomic inequalities in obesity: The role of population prevention. Lancet Diabetes Endocrinol. 2015, 3, 838–840. [Google Scholar] [CrossRef]
- World Health Organisation. Set of Recommendations on the Marketing of Foods and Non-Alcoholic Beverages to Children; WHO: Geneva, Switzerland, 2010. [Google Scholar]
- Bittman, M.; Sipthorp, M. Turned on, Tuned in or Dropped Out? Young Children’s Use of Television and Transmission of Social Advantage; Australian Institute of Family Studies: Canberra, Australia, 2011.
- Mullan, K. Growing Up in Australia: The Longitudinal Study of Australian Children Annual Statistical Report 2013; Time Use and Children’s Social and Emotional Wellbeing and Temperament; Australian Institute of Family Studies: Canberra, Australia, 2013.
- Cameron, A.J.; Spence, A.C.; Laws, R.; Hesketh, K.D.; Lioret, S.; Campbell, K.J. A Review of the Relationship between Socioeconomic Position and the Early-Life Predictors of Obesity. Curr. Obes. Rep. 2015, 4, 350–362. [Google Scholar] [CrossRef] [PubMed]
- Chambers, S.A.; Freeman, R.; Anderson, A.S.; MacGillivray, S. Reducing the volume, exposure and negative impacts of advertising for foods high in fat, sugar and salt to children: A systematic review of the evidence from statutory and self-regulatory actions and educational measures. Prev. Med. 2015, 75, 32–43. [Google Scholar] [CrossRef] [PubMed]
- Australian Government. Children’s Television Standards 2009; Australian Communications and Media Authority: Canberra, Australia, 2009.
- Australian Food & Grocery Council. Advertising to Children: AFGC; n.d. Available online: http://www.afgc.org.au/our-expertise/health-nutrition-and-scientific-affairs/advertising-to-children/ (accessed on 24 April 2017).
- Galbraith-Emami, S.; Lobstein, T. The impact of initiatives to limit the advertising of food and beverage products to children: A systematic review. Obes. Rev. 2013, 14, 960–974. [Google Scholar] [CrossRef] [PubMed]
- Watson, W.L.; Lau, V.; Wellard, L.; Hughes, C.; Chapman, K. Advertising to children initiatives have not reduced unhealthy food advertising on Australian television. J. Public Health 2017, 4, 787–792. [Google Scholar] [CrossRef] [PubMed]
- The Australian Communications and Media Authority. Children’s Television Viewing and Multi-Screen Behaviour; Analysis of 2006-16 OzTAM Audience Data and 2017 Survey of Parents, Carers and Guardians; ACMA: Canberra, Australia, 2017.
- Smithers, L.G.; Lynch, J.W.; Merlin, T. Television Marketing of Unhealthy Food and Beverages to Children in Australia: A Review of Published Evidence from 2009; Final Report; Australian National Preventive Health Agency: Canberra, Australia, 2012.
- Cairns, G.; Angus, K.; Hastings, G.; Caraher, M. Systematic reviews of the evidence on the nature, extent and effects of food marketing to children. A retrospective summary. Appetite 2013, 62, 209–215. [Google Scholar] [CrossRef] [PubMed]
- Dhar, T.; Baylis, K. Fast-food consumption and the ban on advertising targeting children: The Quebec experience. J. Mark. Res. 2011, 48, 799–813. [Google Scholar] [CrossRef]
- Silva, A.; Higgins, L.M.; Hussein, M. An Evaluation of the Effect of Child-Directed Television Food Advertising Regulation in the United Kingdom. Can. J. Agric. Econ. Revue Can. D’agroecon. 2015, 63, 583–600. [Google Scholar] [CrossRef]
- Veerman, J.L.; Van Beeck, E.F.; Barendregt, J.J.; Mackenbach, J.P. By how much would limiting TV food advertising reduce childhood obesity? Eur. J. Public Health 2009, 19, 365–369. [Google Scholar] [CrossRef] [PubMed]
- Goris, J.M.; Petersen, S.; Stamatakis, E.; Veerman, J.L. Television food advertising and the prevalence of childhood overweight and obesity: A multicountry comparison. Public Health Nutr. 2010, 13, 1003–1012. [Google Scholar] [CrossRef] [PubMed]
- Magnus, A.; Haby, M.; Carter, R.; Swinburn, B. The cost-effectiveness of removing television advertising of high-fat and/or high-sugar food and beverages to Australian children. Int. J. Obes. 2009, 33, 1094–1102. [Google Scholar] [CrossRef] [PubMed]
- Cecchini, M.; Sassi, F.; Lauer, J.A.; Lee, Y.Y.; Guajardo-Barron, V.; Chisholm, D. Tackling of unhealthy diets, physical inactivity, and obesity: Health effects and cost-effectiveness. Lancet 2010, 376, 1775–1784. [Google Scholar] [CrossRef]
- Sonneville, K.R.; Long, M.W.; Ward, Z.J.; Resch, S.C.; Wang, Y.C.; Pomeranz, J.L.; Moodie, M.L.; Carter, R.; Sacks, G.; Swinburn, B.A.; et al. BMI and healthcare cost impact of eliminating tax subsidy for advertising unhealthy food to youth. Am. J. Prev. Med. 2015, 49, 124–134. [Google Scholar] [CrossRef] [PubMed]
- Chou, S.-Y.; Rashad, I.; Grossman, M. Fast-food restaurant advertising on television and its influence on childhood obesity. J. Law Econ. 2008, 51, 599–618. [Google Scholar] [CrossRef]
- Robinson, T.N. Reducing children’s television viewing to prevent obesity: A randomized controlled trial. JAMA 1999, 282, 1561–1567. [Google Scholar] [CrossRef] [PubMed]
- Gorn, G.J.; Goldberg, M.E. Behavioral evidence of the effects of televised food messages on children. J. Consum. Res. 1982, 9, 200–205. [Google Scholar] [CrossRef]
- Bolton, R.N. Modeling the impact of television food advertising on children’s diets. Curr. Issues Res. Advert. 1983, 6, 173–199. [Google Scholar]
- Obesity Policy Coalition and the Global Obesity Centre. Tipping the Scales, Australian Obesity Prevention Consensus; Obesity Policy Coalition and the Global Obesity Centre: Melbourne, Australia, 2017. [Google Scholar]
- The Australian Prevention Partnership Centre Deakin University and Informas. Policies for Tackling Obesity and Creating Healthier Food Environments; TAPPC: Ultimo, Australia; Deakin University: Geelong, Australia, 2017. [Google Scholar]
- Australian Communications and Media Authority. Children’s Television Viewing, Research Overview; ACMA: Melbourne, Australia, 2015.
- Boyland, E.J.; Whalen, R. Food advertising to children and its effects on diet: Review of recent prevalence and impact data. Pediatr. Diabetes 2015, 16, 331–337. [Google Scholar] [CrossRef] [PubMed]
- Sadeghirad, B.; Duhaney, T.; Motaghipisheh, S.; Campbell, N.; Johnston, B. Influence of unhealthy food and beverage marketing on children’s dietary intake and preference: A systematic review and meta-analysis of randomized trials. Obes. Rev. 2016, 17, 945–959. [Google Scholar] [CrossRef] [PubMed]
- Boyland, E.J.; Nolan, S.; Kelly, B.; Tudur-Smith, C.; Jones, A.; Halford, J.C.; Robinson, E. Advertising as a cue to consume: A systematic review and meta-analysis of the effects of acute exposure to unhealthy food and nonalcoholic beverage advertising on intake in children and adults. Am. J. Clin. Nutr. 2016, 103, 519–533. [Google Scholar] [CrossRef] [PubMed]
- Lusk, J.L.; Roosen, J.; Shogren, J.F. (Eds.) The Oxford Handbook of the Economics of Food Consumption and Policy; Oxford University Press: Oxford, UK, 2011. [Google Scholar]
- Cecil, J.E.; Palmer, C.N.; Wrieden, W.; Murrie, I.; Bolton-Smith, C.; Watt, P.; Wallis, D.J.; Hetherington, M.M. Energy intakes of children after preloads: Adjustment, not compensation. Am. J. Clin. Nutr. 2005, 82, 302–308. [Google Scholar] [CrossRef] [PubMed]
- Hall, K.D.; Butte, N.F.; Swinburn, B.A.; Chow, C.C. Dynamics of childhood growth and obesity: Development and validation of a quantitative mathematical model. Lancet Diabetes Endocrinol. 2013, 1, 97–105. [Google Scholar] [CrossRef]
- Lal, A.; Mantilla-Herrera, A.M.; Veerman, L.; Backholer, K.; Sacks, G.; Moodie, M.; Siahpush, M.; Carter, R.; Peeters, A. Modelled health benefits of a sugar-sweetened beverage tax across different socioeconomic groups in Australia: A cost-effectiveness and equity analysis. PLoS Med. 2017, 14, e1002326. [Google Scholar] [CrossRef] [PubMed]
- Australian Bureau of Statistics. 6302.0-Average Weekly Earnings, Australia, May 2010; ABS: Canberra, Australia, 2010. Available online: http://www.abs.gov.au/AUSSTATS/[email protected]/DetailsPage/6302.0May%202010?OpenDocument (accessed on 22 May 2017).
- Australian Bureau of Statistics. 6348.0-Labour Costs, Australia, 2010-11; ABS: Canberra, Australia, 2012. Available online: http://www.abs.gov.au/AUSSTATS/[email protected]/DetailsPage/6348.02010-11?OpenDocument (accessed on 22 May 2017).
- Fair Work Ombudsman. Payment for Annual Leave; Australian Government: Canberra, Australia, 2017. Available online: https://www.fairwork.gov.au/leave/annual-leave/payment-for-annual-leave (accessed on 22 May 2017).
- Australian Institute of Health and Welfare. Health System Expenditure on Disease and Injury in Australia, 2000-01; AIHW: Canberra, Australia, 2004.
- Australian Institute of Health and Welfare. Health Expenditure 2012-13; AIHW: Canberra, Australia, 2014.
- Australian Bureau of Statistics. Socio-Economic Indexes for Areas; ABS: Canberra, Australia, 2017. Available online: http://www.abs.gov.au/websitedbs/censushome.nsf/home/seifa (accessed on 11 July 2017).
- Australian Bureau of Statistics. 4324.0.55.002-Microdata: Australian Health Survey: Nutrition and Physical Activity, 2011-12; ABS: Canberra, Australia, 2013. Available online: http://www.abs.gov.au/AUSSTATS/[email protected]/Lookup/4324.0.55.002Main+Features12011-12 (accessed on 8 June 2017).
- Murray, C.J.; Abraham, J.; Ali, M.K.; Alvarado, M.; Atkinson, C.; Baddour, L.M.; Bartels, D.H.; Benjamin, E.J.; Bhalla, K.; Birbeck, G. The state of US health, 1990–2010: Burden of diseases, injuries, and risk factors. JAMA 2013, 310, 591–606. [Google Scholar] [CrossRef] [PubMed]
- Crino, M.; Herrera, A.M.M.; Ananthapavan, J.; Wu, J.H.; Neal, B.; Lee, Y.Y.; Zheng, M.; Lal, A.; Sacks, G. Modelled Cost-Effectiveness of a Package Size Cap and a Kilojoule Reduction Intervention to Reduce Energy Intake from Sugar-Sweetened Beverages in Australia. Nutrients 2017, 9, 983. [Google Scholar] [CrossRef] [PubMed]
- EpiGear International. Ersatz; EpiGear International: Brisbane, Australia, 2016; Available online: http://www.epigear.com/index_files/ersatz.html (accessed on 29 May 2017).
- Chen, G.; Ratcliffe, J.; Olds, T.; Magarey, A.; Jones, M.; Leslie, E. BMI, health behaviors, and quality of life in children and adolescents: A school-based study. Pediatrics 2014, 133, 133. [Google Scholar] [CrossRef] [PubMed]
- George, B.; Harris, A.; Mitchell, A. Cost-effectiveness analysis and the consistency of decision making. Pharmacoeconomics 2001, 19, 1103–1109. [Google Scholar] [CrossRef] [PubMed]
- OzTAM. Australian Multi-Screen Report; Quarter 03 2016; OzTAM: Australia, 2016; Available online: http://www.oztam.com.au/documents/Other/Australian%20Multi%20Screen%20Report%20Q2%202016%20FINAL.pdf (accessed on 14 May 2018).
- FreeTV Australia. Advertising Revenue for Commercial Television Networks, January to June 2010. FreeTV Australia, 2010. Available online: http://www.freetv.com.au/media/News-Media_Release/PR14_Advertising_revenue_for_commercial_television_networks_-_Jan-Jun_2010.pdf (accessed on 20 July 2017).
- FreeTV Australia. Advertising Revenue for Commercial Television Networks, July to December 2010. FreeTV Australia, 2011. Available online: http://www.freetv.com.au/Media/News-Media_Release/Revenue_figures_July_Dec_2010.pdf (accessed on 20 July 2017).
- Adnews. Where’s the Money Going? Exclusive ad Spend Trends Report; Adnews: Australia, 2016; Available online: http://www.adnews.com.au/news/where-s-the-money-going-exclusive-ad-spend-trends-report (accessed on 14 May 2018).
- Deloitte Australia. Media Consumer Survey 2016, Australian Media and Digital Preferences; Deloitte Australia: Sydney, Australia, 2016. [Google Scholar]
- Vos, T.; Carter, R.; Barendregt, J.; Mihalopoulos, C.; Veerman, L.; Magnus, A. Assessing Cost-Effectiveness in Prevention; ACE Prevention Final Report; University of Queensland and Deakin University: Melbourne, Australia, 2010. [Google Scholar]
- Parents’ Voice. Junk Food Marketing 2017. Available online: https://parentsvoice.org.au/our-work/junk-food-marketing/ (accessed on 10 November 2017).
- Australian Communications and Media Authority. Children’s Television Standards Review; ACMA: Canberra, Australia, 2007.
- Mialon, M.; Swinburn, B.; Allender, S.; Sacks, G. Systematic examination of publicly-available information reveals the diverse and extensive corporate political activity of the food industry in Australia. BMC Public Health 2016, 16, 283. [Google Scholar] [CrossRef] [PubMed]
- Brown, V.; Moodie, M.; Cobiac, L.; Herrera, A.M.; Carter, R. Obesity-related health impacts of fuel excise taxation-an evidence review and cost-effectiveness study. BMC Public Health 2017, 17, 359. [Google Scholar] [CrossRef] [PubMed]


| Parameters | Mean Values and 95% UI | Data Source and Assumptions |
|---|---|---|
| Intervention effect estimate | ||
| Mean minutes per day watching TV, by age and SEIFA IRSD quintile | See Supplementary Information 3 | Sampled from a normal distribution, from Government sources [44]. Adjusted for time spent using TV screens for other uses [50]. |
| Number of advertisements per hour for HFSS foods during children’s peak viewing times | 3.4 (95% UI 1.9–5.2) | Sampled from a pert distribution, minimum 1.5 maximum 6.5 from a 2012 Australian review of outcomes for studies that reported non-core TV advertising during children’s peak viewing times (based on television audience patterns, generally weekday evenings and weekend mornings) [15]. Most likely 3.1 taken from Australian study 2017 [13]. |
| TV advertisement length (seconds) | 29.9 (95% UI 19.2–40.9) | Sampled from pert distribution, minimum 15, most likely 30, maximum 45. Based on logical reasoning and published estimates [20]. |
| Reduction factor for application of experimental effect to real-world setting | 0.50 (95% UI 0.16–0.85) | Sampled from a pert distribution, minimum 0.00, most likely 0.50, maximum 1.00. Based on assumption. |
| Mealtime compensation effect for snacking | 0.37 (95% UI 0.22–0.61) | Sampled from a pert distribution, minimum 0.20, most likely 0.30, maximum 0.80 compensation index [35]. |
| Kcal effect per minute of TV ad exposure per day | 38 (95% UI 15.5–60.6) | Sampled from a normal distribution (mean 37.94, 95% UI 15.6–60.3), see Supplementary Information 2. After base-case reduction factor for application of experimental effect to real-world setting and mealtime compensation are applied, the kcal effect per minute of TV ad exposure per day is estimated as 12 (95% UI 3–27). |
| Intervention cost estimate | ||
| Cost of legislation (including RIS process) | AUD1,089,650 (95% UI AUD940,351–1,240,624) | Sampled from a gamma distribution [37]. |
| Weekly wage of personnel for legislation administration | AUD1242 (95% UI AUD1127–1358) | Sampled from a gamma distribution (mean 1240.90, se 58.90) Administrative and Support Services, fulltime adult [38]. |
| Labour on-costs, 14% salary cost | AUD174 (95% UI AUD155–195) | Sampled from a pert distribution (+/−10%), from Government sources [39]. |
| Annual leave loading, 17.5% weekly salary cost, 4 weeks per annum | AUD870 (95% UI AUD773–975) | Sampled from a pert distribution (+/−10%), from Government sources [40]. |
| Sensitivity analysis, worst case analysis | ||
| Assumed loss of network revenue, year one of intervention | 2.5% (95% UI 0.4–5.1) | Sampled from a pert distribution (minimum 0, most likely 2%, maximum 7%), based on 2010 network advertising revenue of AUD3.9B [51,52,53]. |
| Kcal effect per minute of TV ad exposure per day | 27.6 (95% UI 19.3–35.8) | Sampled from a normal distribution (mean 27.6, 95% UI 19.5–35.7), see Supplementary Information 2. |
| Reduction factor for application of experimental effect to real-world setting | 0.67 (95% UI 0.30–0.95) | Sampled from a pert distribution, minimum 0.00, most likely 0.75, maximum 1.00. Based on assumption. |
| Proportion of time spent watching paid or streamed TV services (assumed no advertisements) | 0.22 (95% UI 0.20–0.24) | Sampled from a pert distribution, minimum 0.2, most likely 0.22, maximum 0.24 (+/−10%) from published estimate [54]. |
| Results | Children (5–15 Years) | Children Q1 (Most Disadvantaged) | Children Q5 (Least Disadvantaged) |
|---|---|---|---|
| Mean modelled kJ effect per day, children aged five to 15 years | −115 kJ/day | −132 kJ/day | −97 kJ/day |
| Mean modelled BMI effect, children aged five to 15 years | −0.352 kg/m2 | −0.395 kg/m2 | −0.299 kg/m2 |
| Mean BMI effect maintained in adulthood | −0.345 kg/m2 | −0.313 kg/m2 | −0.282 kg/m2 |
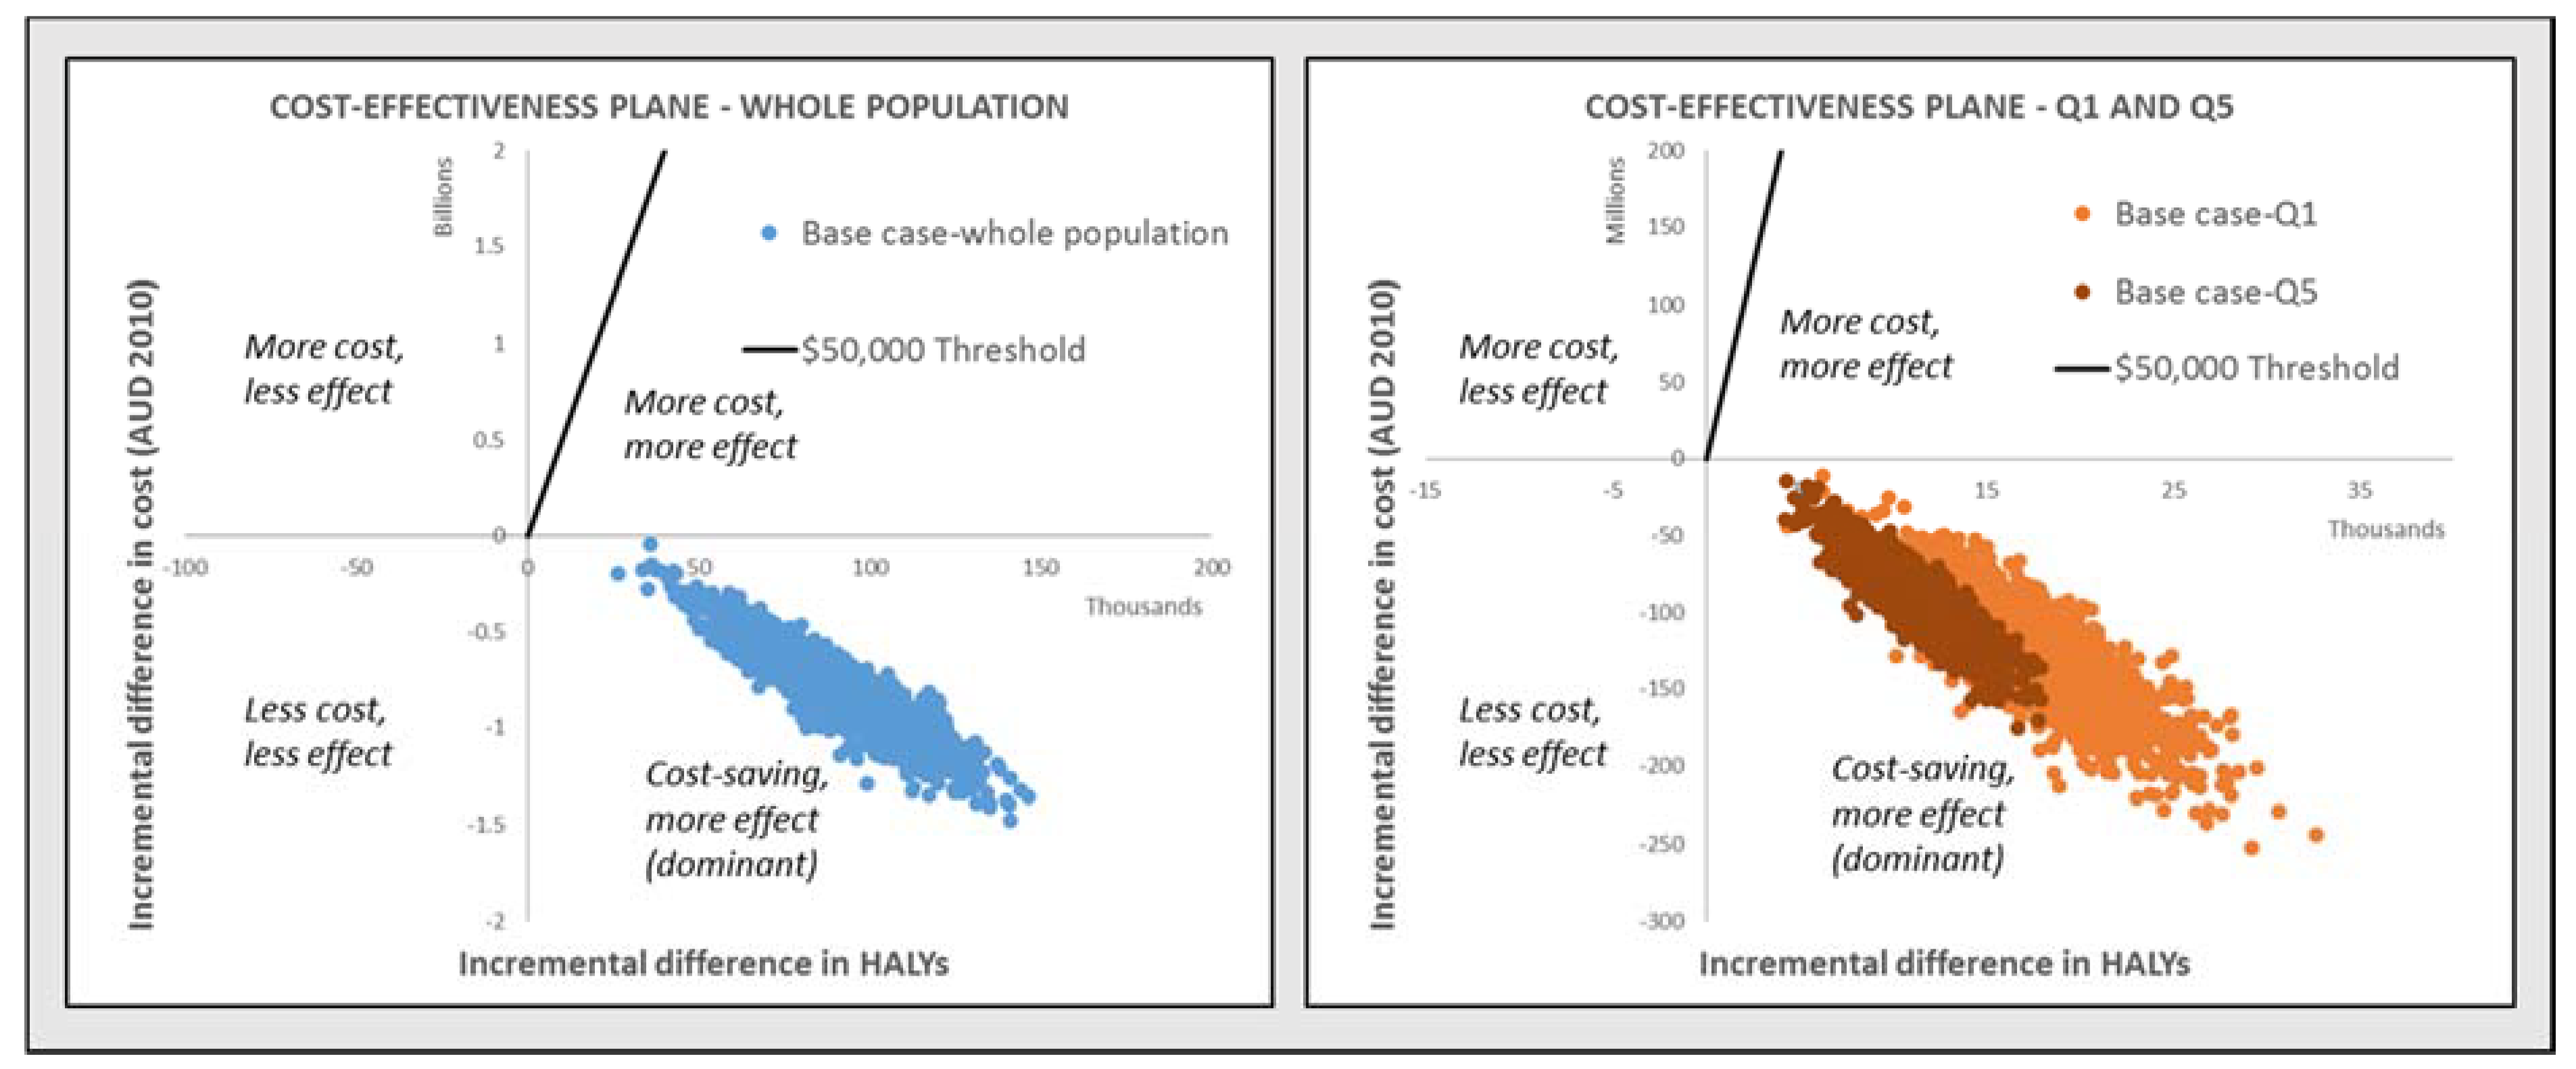
| Total HALYS saved over lifetime | 88,396 (95% UI 54,559–123,199) | 17,512 (95% UI 10,372–25,155) | 11,321 (95% UI 6812–15,679) |
| Total healthcare cost-savings over lifetime | AUD783.8M (95% UI AUD375.6M–1.2B) | AUD127.5M (95% UI AUD59.8M–198.1M) | AUD92.1M (95% UI AUD45.4M–137.5M) |
| Total intervention costs | AUD5.9M (95% UI AUD5.8M–7M) | AUD1.2M # (95% UI AUD1.1M–1.3M) | AUD1.2M # (95% UI AUD1.1M–1.3M) |
| Total net cost-savings | AUD777.9M (95% UI AUD369.8–1.2B) | AUD126.3M (95% UI AUD58.7M–196.9M) | AUD90.9M (95% UI AUD44.3M–136.3M) |
| Net cost per HALY saved (ICER) | Dominant * | Dominant * | Dominant * |
| Probability of dominance | 100% | 100% | 100% |
| Probability of cost-effectiveness | 100% | 100% | 100% |
| Implementation Consideration: | Adjustments/Considerations | Overall Rating |
|---|---|---|
| Strength of evidence | Direct evidence of BMI effect of TV advertising of food and beverages HFSS from RCTs is currently not available. The intervention is modelled using an effect estimate derived from meta-analysis of non-naturalistic experimental evidence. | Low |
| Acceptability | Food, media industry acceptability Likely to be low. Marketing and advertising drives sales. | Low |
| Political acceptability To date, political motivation to enact legislation has been low but may vary by political party and over time. International experience in countries such as Ireland and the United Kingdom suggests the potential for political acceptability. | Low | |
| Consumer acceptability Public support for government regulation of advertising of HFSS food and beverages to children is high [56]. | High | |
| Feasibility | This legislative intervention is feasible to implement in the Australian setting. | High |
| Sustainability | The intervention is sustainable once implemented. The ACMA already has regulatory responsibilities and can oversee the regulation of TV HFSS advertising. The sustainability of potential BMI effect is unknown, and more evidence is required on the effects of TV advertising of HFSS food and beverages in adults. | High |
| Equity | Children with low SEP may have more exposure to HFSS TV advertising than children with high SEP, due to differences in TV viewing practices. | Positive |
| Side effects | Positive side effects The intervention may have an impact on the food preferences and consumption behaviours of older children and adults. | Positive |
| Negative side effects The intervention may result in loss of revenue to TV networks (likely to be short-term effect). The intervention may result in loss of revenue to food companies (although over the longer term it may be expected that companies adapt to market conditions). | ||
| Policy conclusion: The intervention demonstrates significant potential for cost-effectiveness, positive equity effects and is feasible, sustainable and acceptable to the Australian general public. | ||
© 2018 by the authors. Licensee MDPI, Basel, Switzerland. This article is an open access article distributed under the terms and conditions of the Creative Commons Attribution (CC BY) license (http://creativecommons.org/licenses/by/4.0/).
Share and Cite
Brown, V.; Ananthapavan, J.; Veerman, L.; Sacks, G.; Lal, A.; Peeters, A.; Backholer, K.; Moodie, M. The Potential Cost-Effectiveness and Equity Impacts of Restricting Television Advertising of Unhealthy Food and Beverages to Australian Children. Nutrients 2018, 10, 622. https://doi.org/10.3390/nu10050622
Brown V, Ananthapavan J, Veerman L, Sacks G, Lal A, Peeters A, Backholer K, Moodie M. The Potential Cost-Effectiveness and Equity Impacts of Restricting Television Advertising of Unhealthy Food and Beverages to Australian Children. Nutrients. 2018; 10(5):622. https://doi.org/10.3390/nu10050622
Chicago/Turabian StyleBrown, Vicki, Jaithri Ananthapavan, Lennert Veerman, Gary Sacks, Anita Lal, Anna Peeters, Kathryn Backholer, and Marjory Moodie. 2018. "The Potential Cost-Effectiveness and Equity Impacts of Restricting Television Advertising of Unhealthy Food and Beverages to Australian Children" Nutrients 10, no. 5: 622. https://doi.org/10.3390/nu10050622