Article

Beeswax-Colophony Blend: A Novel Green Organic Coating for Protection of Steel Drinking Water Storage Tanks

by
Sara Abdikheibari
1,2,
Reza Parvizi
2,3,*,
Mohammad Hadi Moayed
3,
Seyed Mojtaba Zebarjad
4 and
Seyed Abdolkarim Sajjadi
3
1
Chemical Engineering Department, Faculty of Engineering, Ferdowsi University of Mashhad, Mashhad 91775-1111, Iran
2
School of Engineering, Faculty of Science and Technology, Deakin University, Geelong Waurn Ponds Campus, Waurn Ponds, Victoria 3216, Australia
3
Materials and Metallurgical Engineering Department, Faculty of Engineering, Ferdowsi University of Mashhad, Mashhad 91775-1111, Iran
4
Department of Engineering Materials, Engineering Faculty, Shiraz University, Shiraz 71946-84471, Iran
*
Author to whom correspondence should be addressed.
Metals 2015, 5(3), 1645-1664; https://doi.org/10.3390/met5031645
Submission received: 30 July 2015 / Revised: 7 September 2015 / Accepted: 9 September 2015 / Published: 15 September 2015
(This article belongs to the Special Issue Oxidation of Metals)

Abstract

:
Beeswax-colophony blend is mainly used as a sealant mixture for preservation applications. The beeswax itself, however, has had a long way in history taking part in conservation processes including mummification. In this research, this blend was used as a protective coating for drinking water distribution tanks. Initially, a layer with 400 μm thickness was applied on a sand blasted mild steel plate. The long-term electrochemical behavior of the coating was investigated by open circuit potential (OCP) and electrochemical microbiological characteristics of the coating, microbial and chemical examinations were performed on drinking water samples that had been in contact with the coating. Furthermore, its behavior in an up-flow anaerobic sludge blanket reactor (UASBR) in a wastewater treatment plant was investigated using the scanning electron microscopy (SEM) technique. Regarding the consistency of experimental results, it was concluded that this proposed recyclable blend could be considered as a novel green organic coating and also a good corrosion barrier even in aggressive environments.

Graphical Abstract

1. Introduction

Worldwide, drinking water distribution systems (DWDS) have been constructed out of steels that are potentially susceptible to biodeterioration. Undesirable consequences of biodeterioration include economic loss, water leaks, and water quality deterioration (red water due to the release of Fe oxy-hydroxides), which negatively affects human health [1,2,3,4,5,6,7]. Biodegradation of metallic materials, termed as biocorrosion, is attributed to microorganisms growing and producing a viscoelastic layer, referred to as biofilm, on the material surface [1,8,9,10]. Hence, growing awareness of detrimental effects of biofouling on the potable water systems has led to various water techniques being devised and developed to prevent and control biocorrosion. One such prevention method could be covering the inner wall of storage tanks (where water may settle for some time) with an appropriate coating to minimize the occurrence of localised or uniform corrosion. Nevertheless, the coating itself should be non-toxic, resistant to bacterial attack and should not release corrosive products during degradation [3]. To decrease the chance of water pollution and increase the operating life of drinking water tanks, researchers have suggested many types of green organic coatings; however, they have hardly ever considered natural waxes as corrosion barriers [11,12,13]. Hence, proposing the recyclable ancient wax with superplastic properties would be a convenient choice for coating purposes due to diverse requirements of industries and restricted environmental regulations [14].
Beeswax is a material that consists of a mixture of several compounds mainly palmitate, palmitoleate, and oleate esters of long-chain (30–32 carbons) aliphatic alcohols [15,16]. Concerning its chemistry, an approximate chemical formula for beeswax is reported to be C15H31COOC30H61. Beeswax has a relatively low melting point in the range of 62 °C to 64 °C with a density about 960 kg/m3. Nowadays, it is being used for various industrial applications including protection and production of food or cosmetics, as a metal injection molding binder, and as a sealing agent specifically when blended with rosin (colophony) [15,17,18,19]. Colophony mainly consists of different resin acids, mainly abietic acid and is soluble in alcohol, ether, benzene and chloroform. It is brittle at room temperature, but it melts at temperatures ranging from 70 °C to 78 °C. Colophony can be used as a glazing agent in medicines, chewing gum, as an additive in adhesives, and as a flux in soldering [20]. Figure 1 shows natural beeswax and colophony along with the molecular structures of their major components.
In corrosion and electrochemistry science, a mixture of these two components is mainly used as a sealant [17]. Different chemical, physical and structural properties of the beeswax-colophony green blend, including their crystal structure and complex phase diagrams, have been investigated using X-ray diffraction (XRD), differential scanning calorimetry (DSC), and nuclear magnetic resonance (NMR) which are not in the scope of this work [15,16,21,22].
Figure 1. Images showing (a) natural beeswax; (b) colophony; (c) molecular structure of triacontanyl palmitate as the major component of beeswax; and (d) molecular structure of abietic acid as the major component of colophony.
Metals 05 01645 g001
This study investigates the electrochemical and microbiological properties of beeswax-colophony green mixture as a proposed coating for drinking water storage tanks. In order to assess the coating performance in preventing corrosion or fouling, electrochemical techniques such as electrochemical impedance spectroscopy (EIS) have been previously used in chloride containing solutions [23,24,25,26,27,28,29,30,31,32,33,34]. Therefore, in this study, the long-term electrochemical behavior of the coating was studied in 3.5 wt. % NaCl corrosive solution.
On the other side, current and proposed environmental regulations in the field of water policy require analysis of different hygienic aspects of drinking water to ensure that it secures the public health [35]. Treated drinking water delivered to consumers via water distribution systems should be free of any kind of waterborne pathogens which have the potential to infect humans. Hence, it is important to check the probable presence of indicator microorganisms in water that are usually accompanying pathogens. Accordingly, in this study, micro-pollutant measurements were conducted on circulated drinking water samples of a simulated coated tank to examine the potential of the proposed coating in releasing any health-threatening substance into the ready-to-distribute water. Besides, most bacteria associated with drinking water distribution systems are heterotrophs which use organic carbon and nitrogen containing compounds as a nourishment source [36]. This implies the necessity to check if bacteria consume the coating, which is a source of carbon, to live and grow. Therefore, heterotrophic plate count (HPC) procedure was conducted on the mentioned water samples. As a result, it is important to check the water quality not only during the treatment and purification but also within the distribution network. Finally, a scanning electron microscopy (SEM) technique was employed to study the coating surface condition after immersion in an up-flow anaerobic sludge blanket reactor (UASBR) in a wastewater treatment plant.

2. Materials and Methods

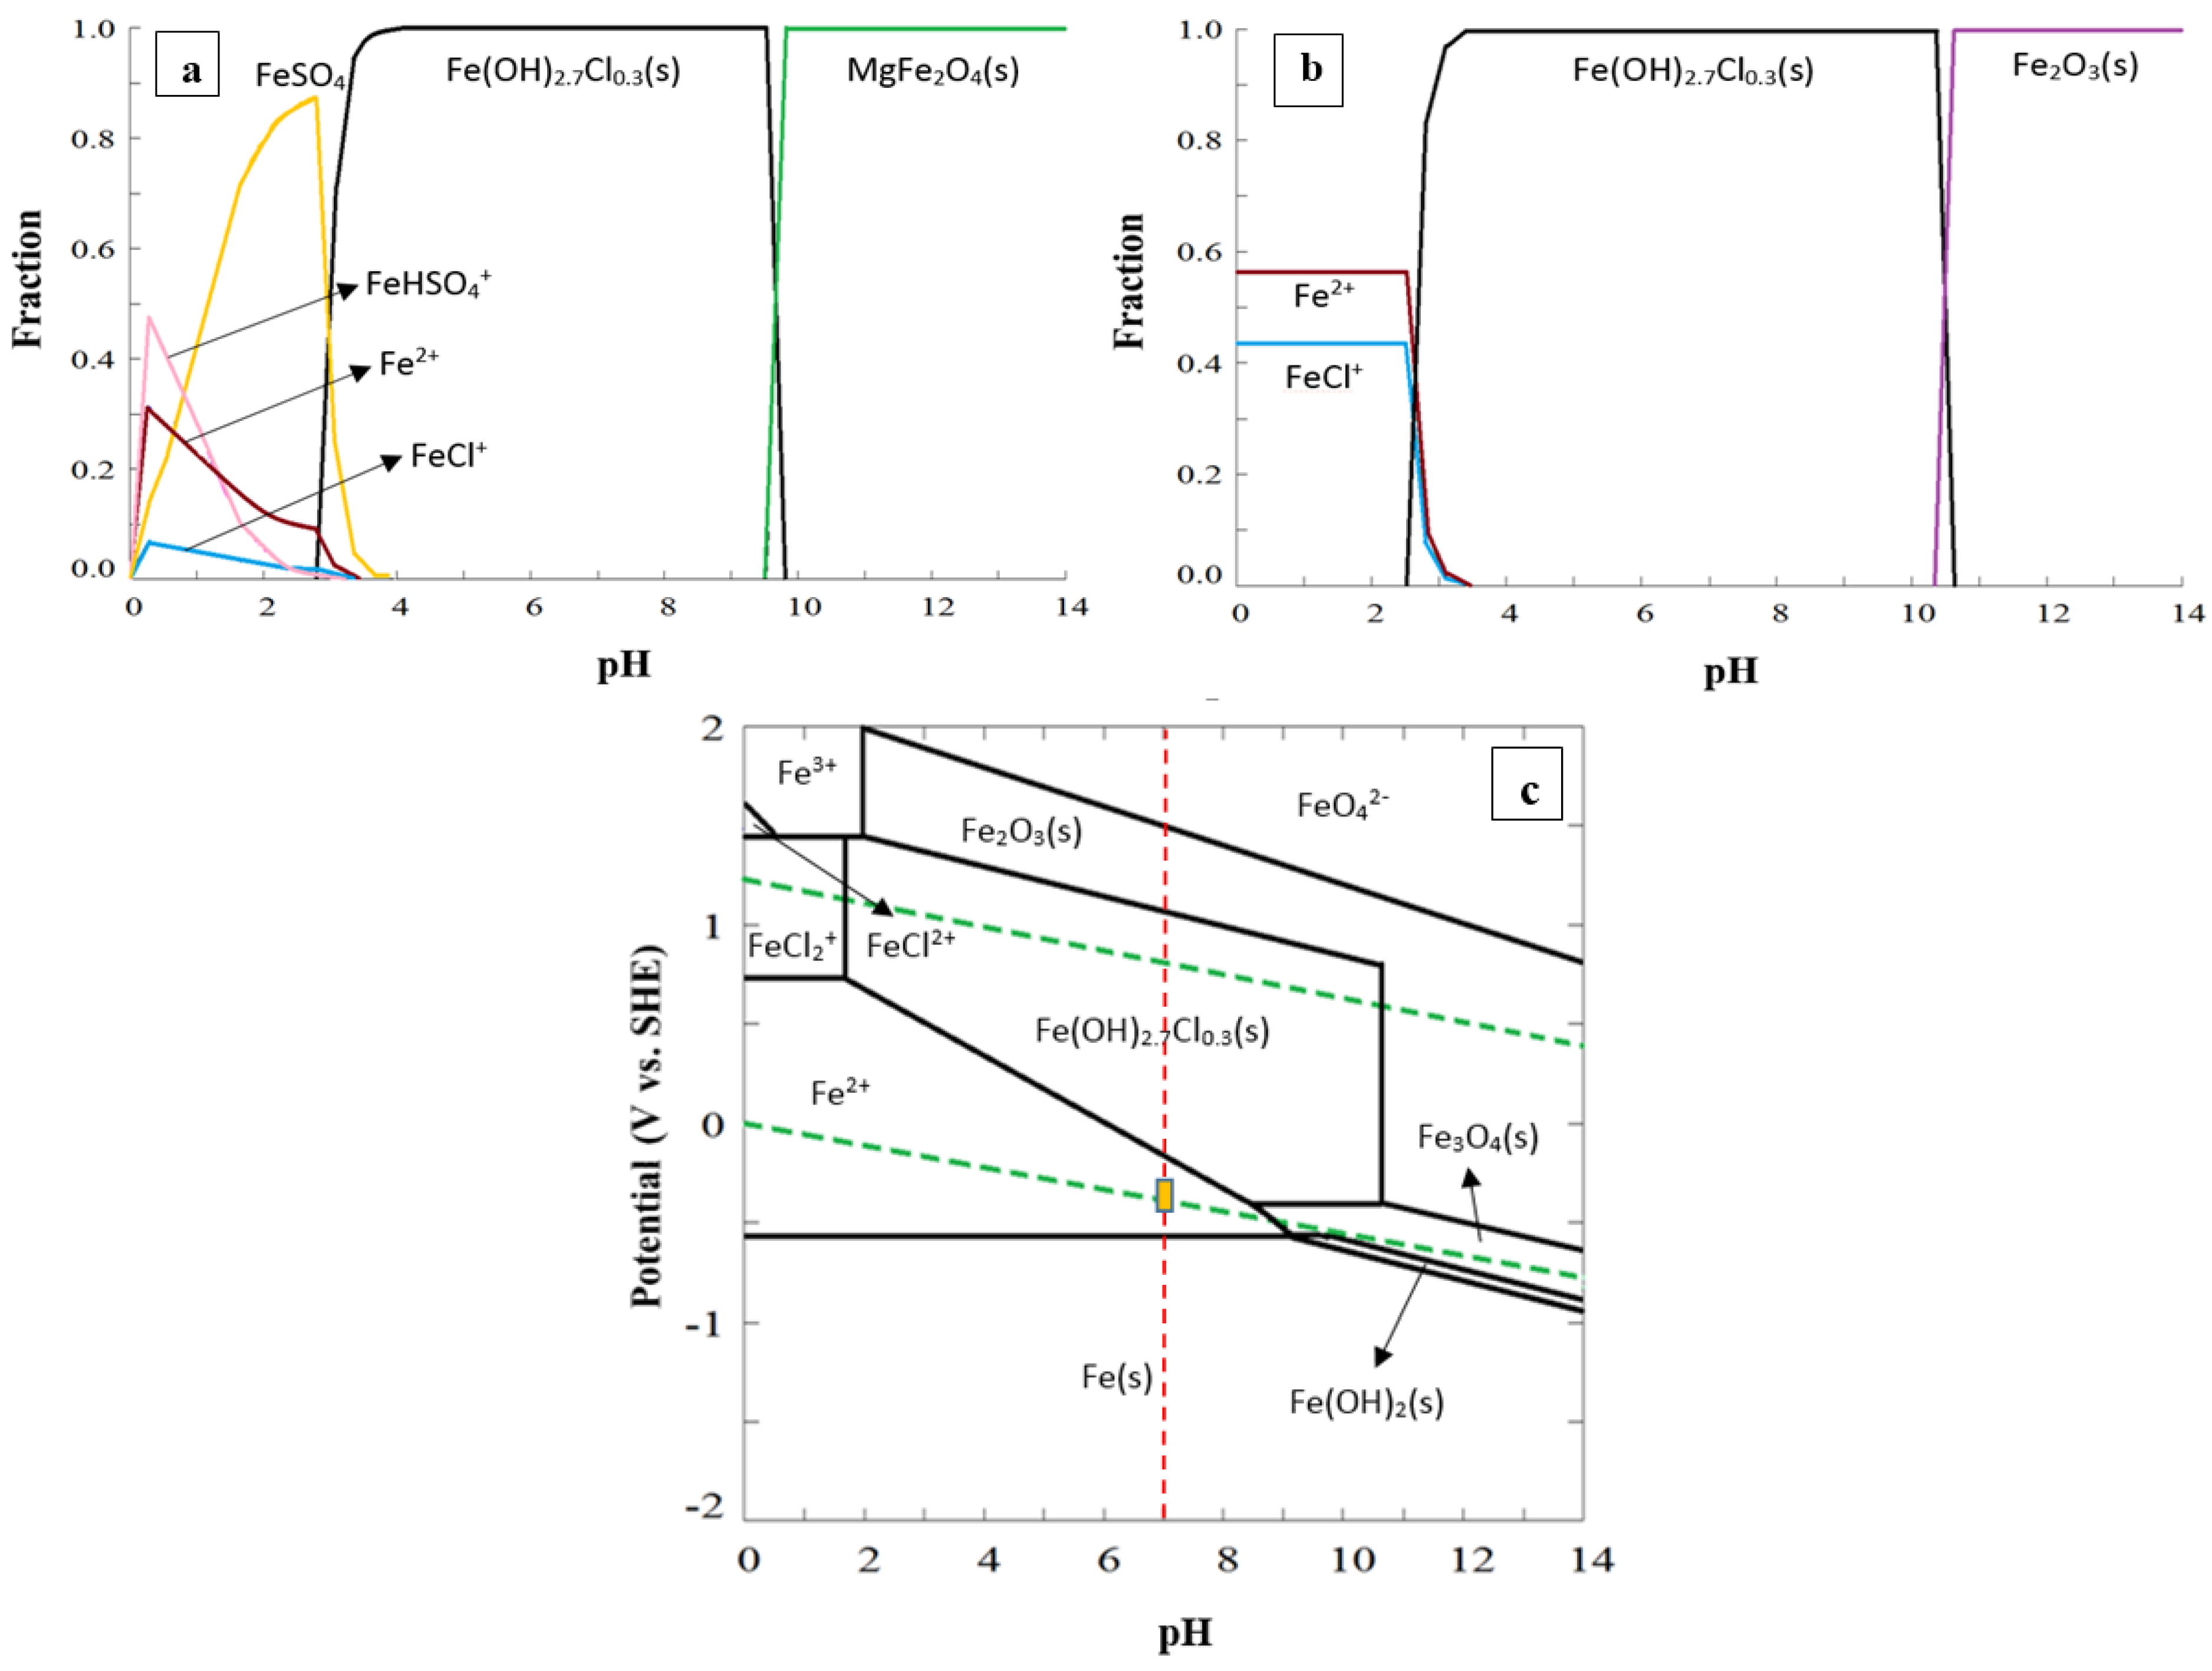
2.1. Thermodynamic Calculations

In order to determine the possible influence of soluble ions within drinking water on a coated steel substrate, thermodynamic calculations were performed using Medusa software [37]. Accordingly, multicomponent fraction-pH diagrams were plotted to show predominance areas for various anions and cations against the solution pH. A fraction-pH diagram shows distribution of ions for a given chemical component in which the fraction values vary from zero to one (0% to 100%). Using the thermodynamic calculations, a simplified chloride containing solution was chosen as the corrosive media to check the electrochemical behavior of the coated substrate. Finally, the multicomponent Pourbaix diagram was plotted to understand the predominance regions of various soluble/insoluble species at different surface pH and potentials.

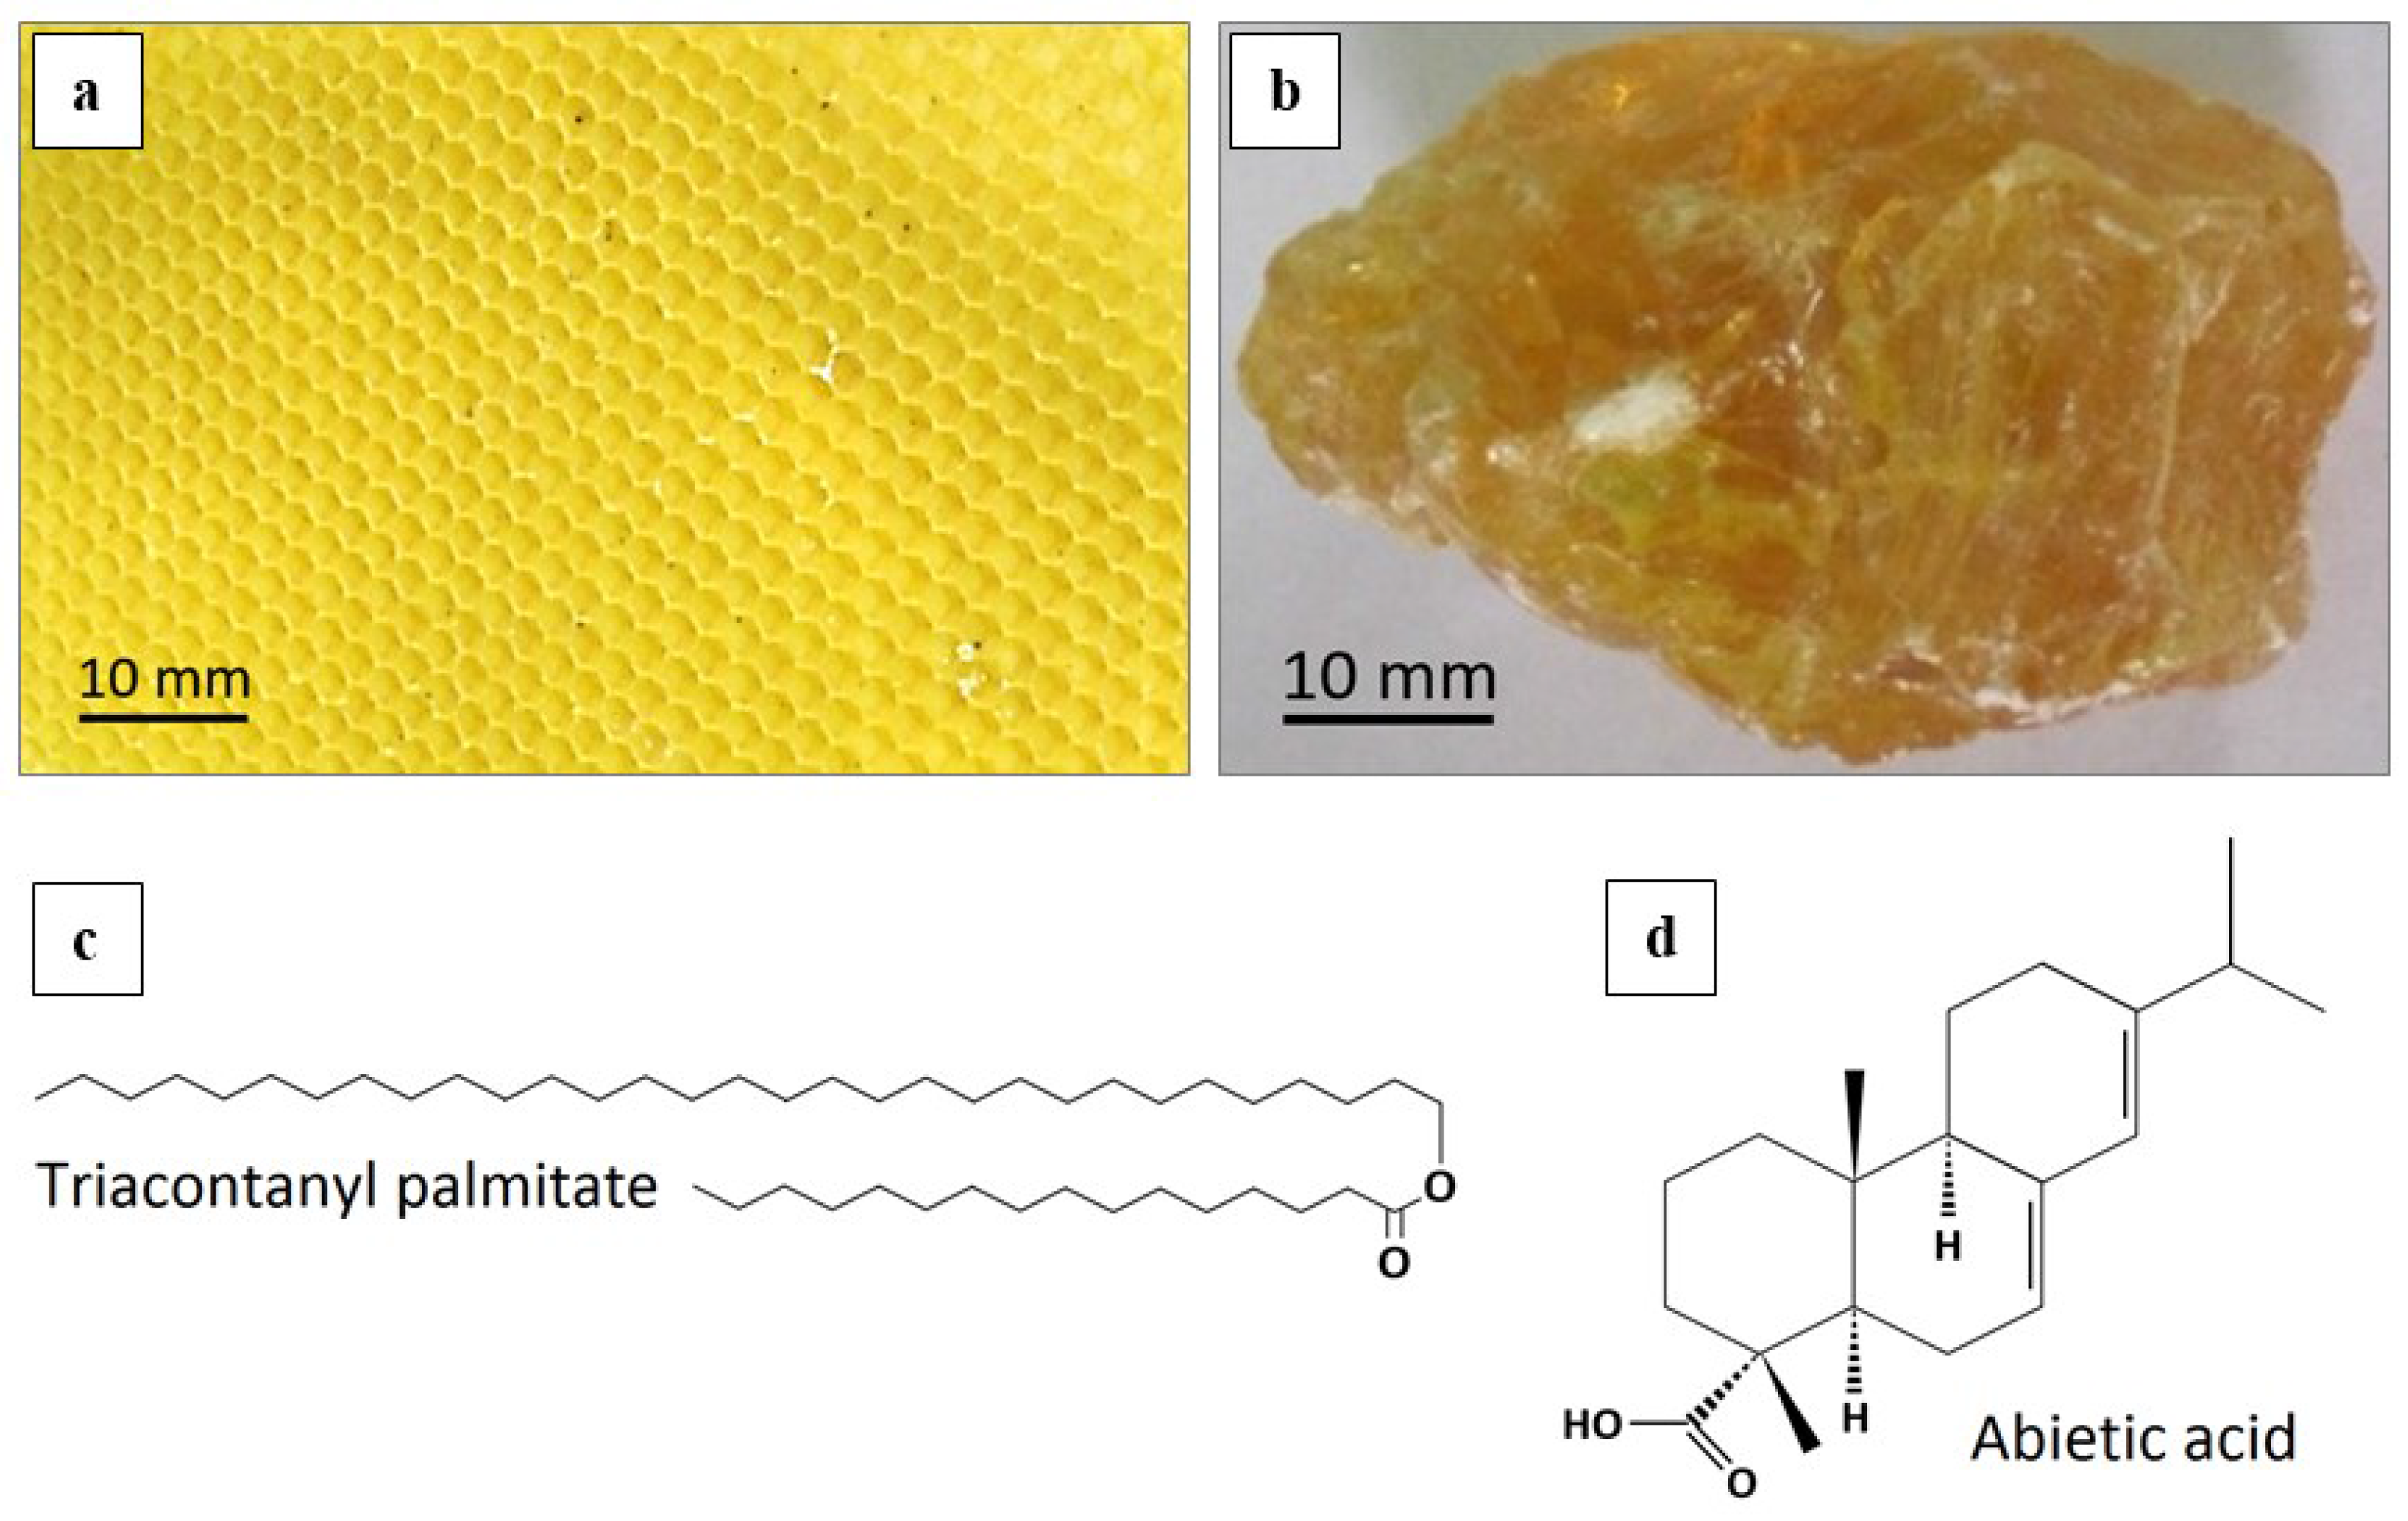
2.2. Coating Preparation

Various proportions (in wt. %) of beeswax to colophony were examined to choose an optimum blend with the highest adhesiveness and resistivity to cracking (or delamination from the metallic surface). Each selected mixture was heated on a hot plate up to around 85 °C, after which it was applied to the cleaned steel substrate and was air cooled for 20 min. Subsequently, a three-point bending test was performed using a Zwick (Z250, Kennesaw, GA, USA) materials testing machine with five-millimeter replacement of the machine indenter under a constant load of 50 kgf (results are not shown here). The results were completely in agreement with expected superplastic behavior of such a blend at room temperature that was reported by Gaillard et al. [22]. Consequently, a 6:4 mixture of beeswax and colophony was chosen as the optimum coating composition.

2.3. Corrosion Measurements

2.3.1. Sample Preparation

A commercial mild steel plate (AISI 1020) with 3 mm thickness was used as a substrate for coating purposes. The plate was cut into several pieces with 10 cm × 5 cm dimensions. The samples were then descaled and cleaned using a sand blast cleaner. Afterwards, the specimens were degreased using acetone and were dried by warm air blowing. In order to examine the electrochemical properties of the samples, an electrical connection was made between each plate and a piece of a copper wire. The prepared samples were then coated with the proposed coating using hand-layup technique. To reach a uniform surface, the applied coating was post-treated by a blow of warm air at 55 °C temperature. The coating thickness was then measured using a magnetic pull-off gage and was attempted to be kept constant at 400 μm. At that thickness, the coating was semi-transparent which enabled visual inspection of any type of defect as a consequence of undercoat corrosion. This has been found to be useful to evaluate the coating degradation behavior after exposure to corrosive solutions [34]. To maintain a uniform electrochemical behavior across the coated sample, all edges were covered by a thick layer of the same coating blend. Edges of the samples have been reported as preferential sites to initiate localised corrosion [38].

2.3.2. Experimental Procedure

The electrochemical behavior of the coated samples were studied by a long-term open circuit potential (OCP) monitoring and EIS. Furthermore, the same type of experiments were performed on a 3 cm × 3 cm epoxy mounted bare mild steel sample only at the instant measurement time. For this purpose, the steel sample was mechanically ground down to 4000 grit abrasive SiC paper, washed with ethanol and dried with warm air. The data was used as a control group to compare with the results of the coated samples. All corrosion experiments were performed at room temperature. The corrosive media (3.5 wt. % sodium chloride solution) was prepared by dissolving an adequate amount of analytical grade sodium chloride (from Merck, Darmstadt, Germany) in distilled water. Prior to corrosion measurements, each specimen was kept at its rest potential for around 15 min to reach a stable corrosion potential. The samples were then immersed in the mentioned solution for 1462 h to investigate the long-term electrochemical behavior of this novel green coating. The results were measured after 15 min (instant), 7, 22, 46, 70, 94, 118, 142, 166, 214, 262, 310, 358, 406, 454, 622, 790, 958, 1126, 1294 and 1462 h of immersion. All electrochemical measurements were performed using an ACM Instruments potentiostat (AC Gill No. 1380, Grange-Over-Sands, UK). A three electrode configuration, schematic of which is depicted in Figure 2, was used for electrochemical measurements including platinum wire as the counter electrode (CE), saturated calomel electorde (SCE) as the reference electrode (RE), and the bare/coated specimen as the working electrode (WE). It should be noted that all potentials were measured and plotted against SCE. At each measurement, the OCP of each specimen was measured for 5 min. Furthermore, the EIS test was performed in the frequency range of 10 kHz to 0.01 Hz with a potential amplitude of ±15 mV. The EIS test results were analyzed and the equivalent circuits parameters were extracted using the EIS spectrum analyzer software [39], as shown in Figure 2. At the end of the electrochemical measurements, the samples were extracted, washed with distilled water and visually checked for any evidence of disbondment or corrosion. An image of a coated sample used for the electrochemical measurements is also included in Figure 2. In order to check the reproducibility of the experiments, each of the mentioned tests was repeated three times. Finally, the most representative set of data, being the closest to the average of the three experimental measurements, was selected for plotting and interpretations.

2.4. Preliminary Microbiological Evaluations

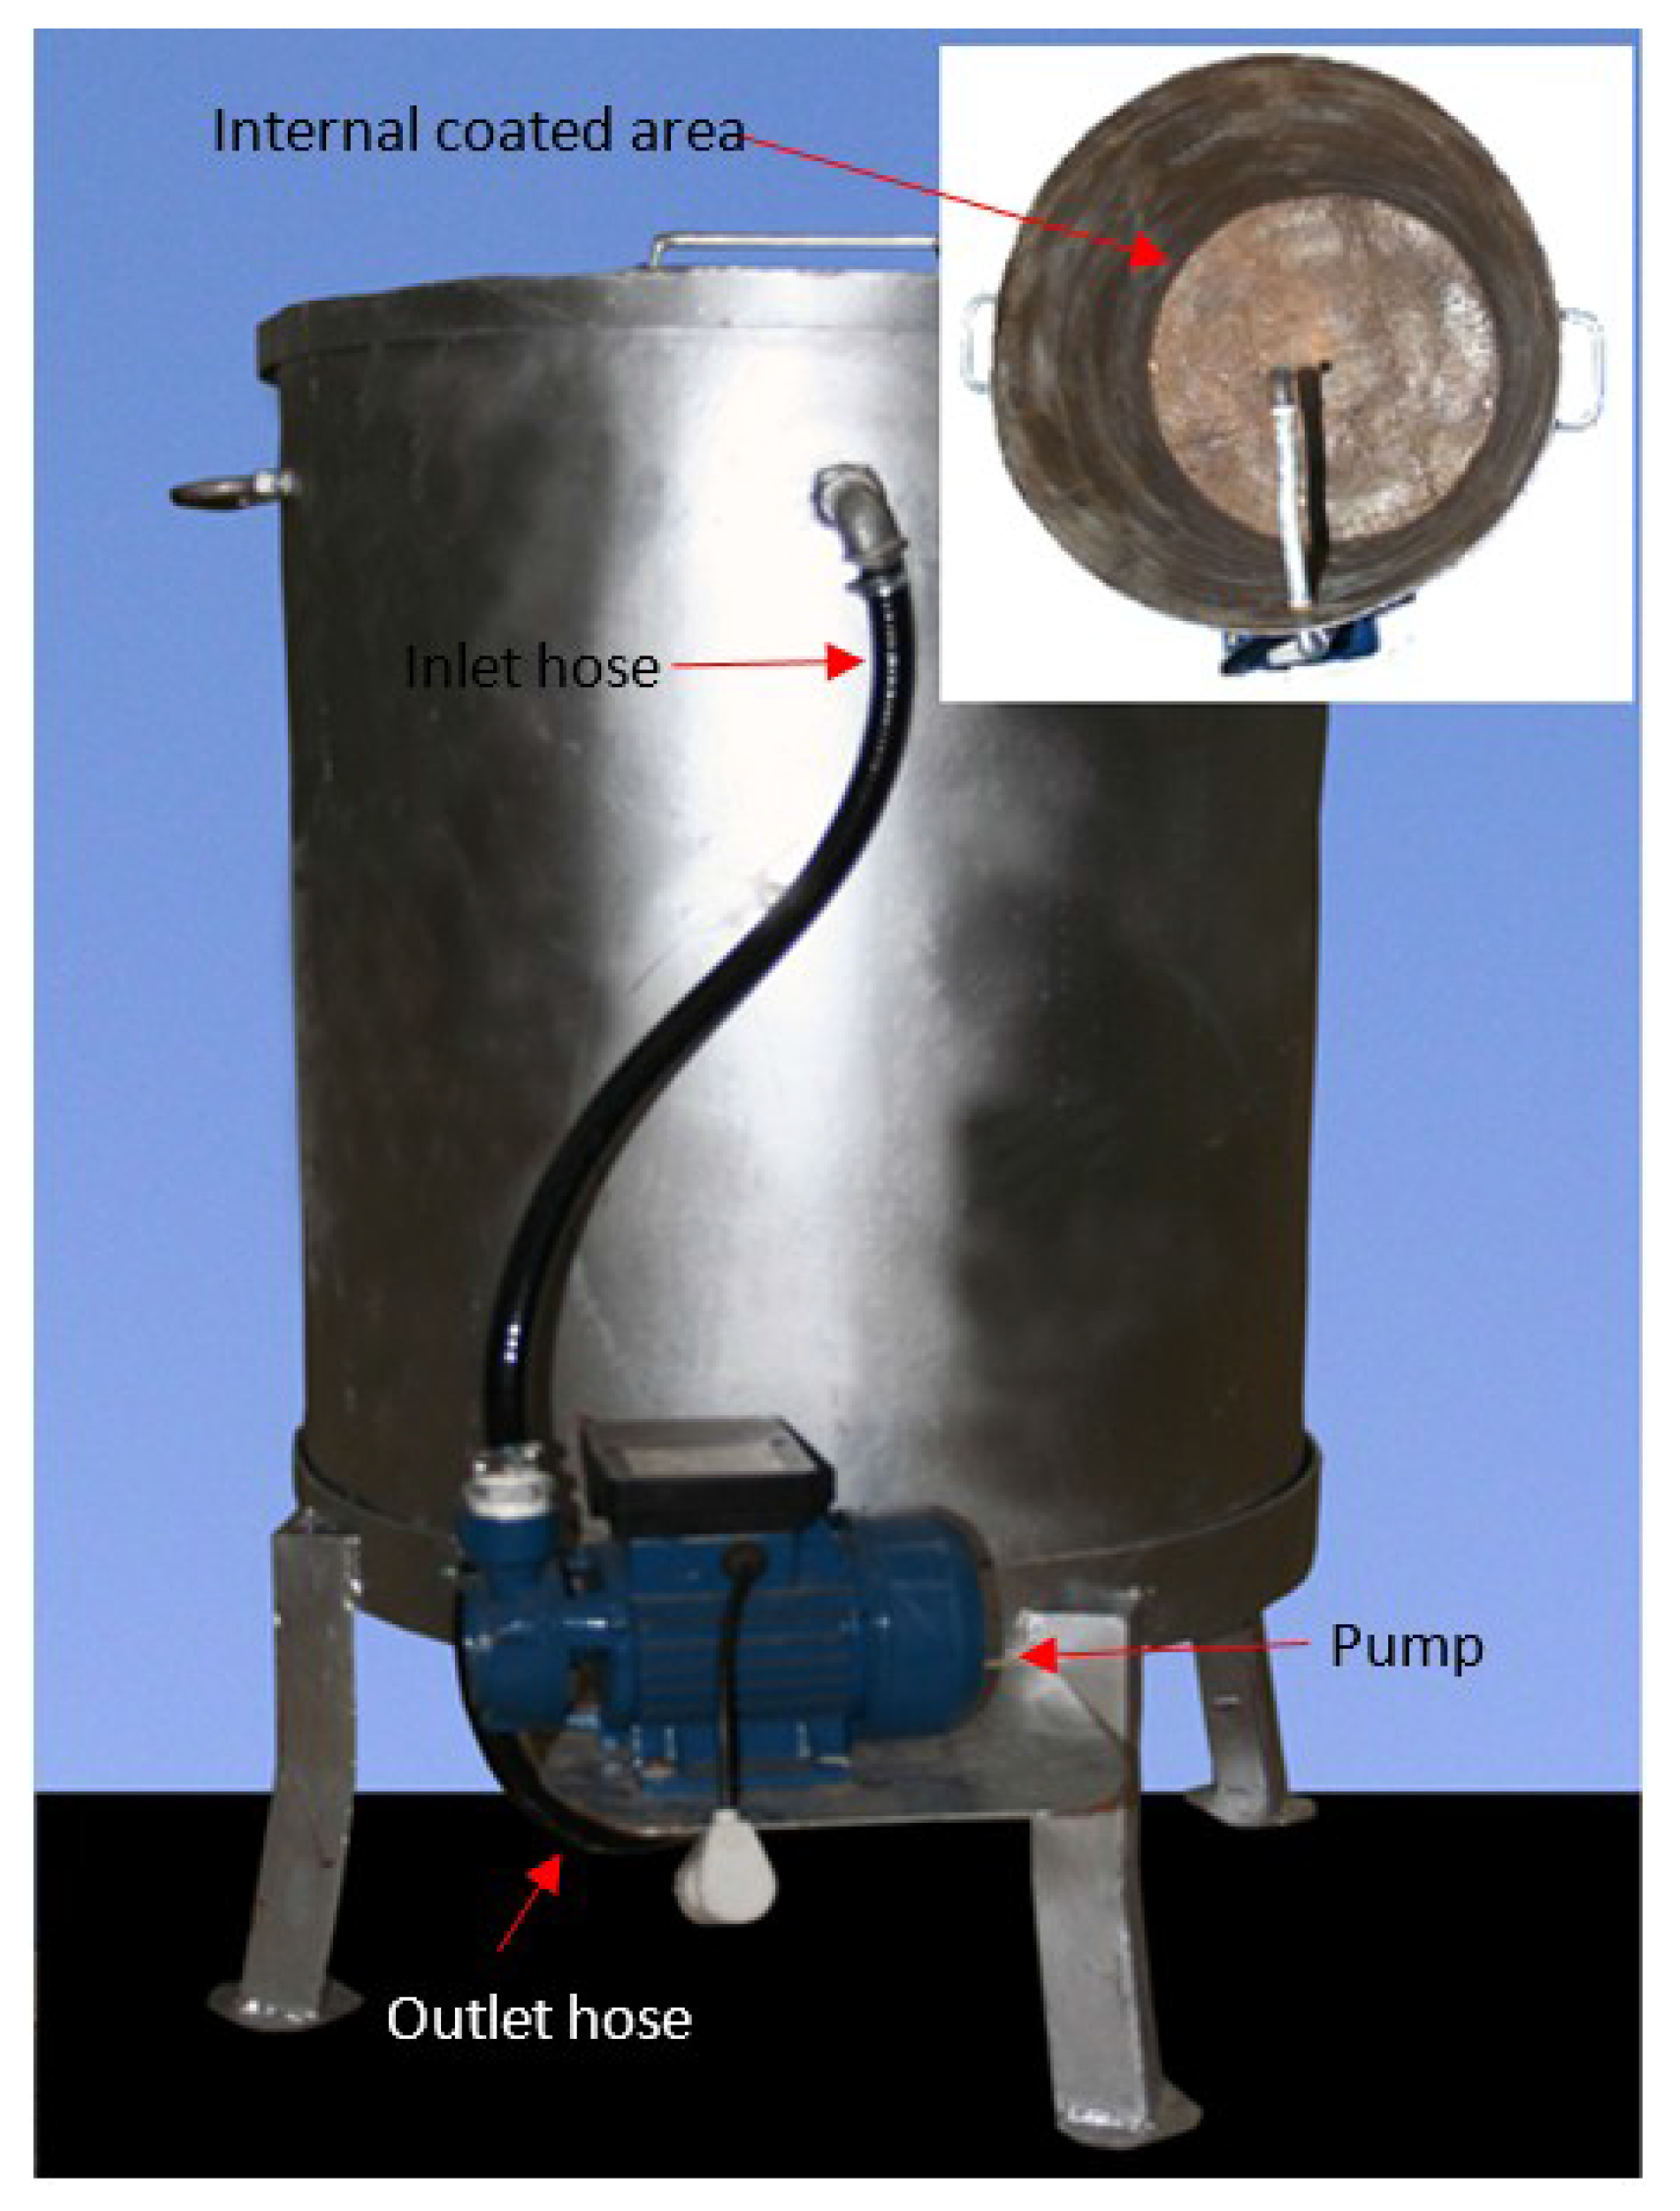
2.4.1. Simulated Water Tank

In order to study chemical and microbiological performance of the proposed coating in contact with drinking water, a 400 L water storage tank, as shown in Figure 3, was constructed using the same steel plate as disscused above. The tank was equiped with a water circulating system to simulate the condition of municipal drinking water distribution tanks. The tank was then coated with the proposed blend using the hand-layup method.
Figure 2. Experimental set up used for electrochemical measurements and data analysis.
Metals 05 01645 g002
Figure 3. The 400-L water tank constructed from AISI 1020 steel (as used for the coating substrate).
Metals 05 01645 g003

2.4.2. Experimental Procedure

Sampling

In order to perform microbiological and chemical examinations, the tank was filled with 400 L of drinking water of Mashhad (Iran). The chemical composition of the water is summerized in Table 1. Since municipal drinking water does not remain in storage tanks for more than 15 days, sampling was carried out after one month to ensure enough retention time, after which the water was discharged. At each sampling, 250 mL of drinking water was collected from the tank and maintained in a sterile dark glass container. Consequently, it was transferred to the Khorasan Razavi Water and Wastewater Co. laboratory (Mashhad, Iran) in a cool box (under 4 °C temperature) within 4 h for conducting HPC procedure and micro-pollutants measurement.
Table 1. Chemical and physical properties of the drinking water.
ParameterConductivity (μS/cm)pH[Ca2+] (mg L−1)[Mg2+] (mg L−1)[Na+] (mg L−1)[K+] (mg L−1)[Cl] (mg L−1)[NO3] (mg L−1)[SO42−] (mg L−1)[HCO3] (mg L−1)
Value13507.10119461011.201561011473.20

HPC Procedure

HPC is a relevant and widely used analytical tool in water quality assessment [36]. In this research, HPC measurements were performed implementing the pour plate method. The pour plate method is still the official reference method for the enumeration of cultivable microorganisms for drinking water analysis [40]. As R2A agar medium yields significantly higher bacterial counts compared to other media, it was used to recover heterotrophic bacteria from water samples. The medium was prepared according to the Reasoner and Geldreich procedure, and then allowed to cool in a water bath to 45 °C [41]. Out of the drinking water sample, 1 mL was transferred to a sterile, empty petri dish without dilution, to which 15 mL of R2A agar medium was added. The sample and agar were mixed thoroughly by rotating the plate several times, clockwise, then counterclockwise. When the media was solidified, the plates were inverted and incubated at 35.5 °C for 48 h. Using a Quebec colony counter (Depew, NY, USA), all colonies on the plate were counted promptly after incubation.

Micro-Pollutants Measurements

Type and amount of micro-pollutants in drinking water samples were measured using an Agilent-Technologies gas chromatography (GC, Santa Clara, CA, USA) system coupled to a 5975 C mass selective detector (MSD, Santa Clara, CA, USA). The analytes were separated on an HP-5MS capillary column (30 m × 0.25 mm I.D., film thickness 0.25 μm) from Agilent-Technologies using helium as the carrier gas. To check out the reproducability of the measurements, the tank was again filled with 400 L of fresh drinking water and the mentioned procedure was repeated. Each time, to monitor any possible coating disbondment or evidence of corrosion/rust formation, the coating was totaly removed from all the corrosion coupones. The inner surface of the tank (each time after the water was discharged) was also checked thoroughly to inspect any probable disbondment imprint.

2.5. Surface Characterization

The corrosion attack morphology of the bare sample after electrochemical measurements was characterized using optical macroscopy and SEM (model: LEO 1450VP, Cambridge, UK). Besides, as the proposed coating contains organic compounds that may be a nourishment source for microorganisms, it is important to investigate the surface exposed to these species. Since water that is reserved in municipal storage tanks is purified from pathogenic microorganisms [42], performing microbiological examinations is time-consuming. Therefore, in this study, a wastewater treatment plant with intense microbial flora was suggested as a controlling environment. To study the probable coating deterioration in presence of the microorganisms, a coated plate (4 cm × 4 cm) was immersed in an UASBR in a treatment plant with microbial flora of 10,000 mg/L for a month. At the end of the period, the plate was removed from the mentioned plant, gently washed with distilled water, and dried in air. Subsequently, the coating surface was imaged using the SEM. Based on the literature, SEM together with electrochemical techniques such as EIS, have been suggested as useful methods to characterize the fouling occurrence on organic coating surfaces [43].

3. Results and Discussion

3.1. Thermodynamic Calculations

In order to investigate the probable interactions between the soluble anions and cations of the drinking water and the steel substrate, thermodynamic calculations were performed based on chemical composition of the water. In all conditions, iron concentration (as the main alloying element of the substrate) was assumed to be 10−6 M. Figure 4a shows the fraction-pH diagram of all the complex ions in the drinking water (with same concentrations as mentioned in Table 1), including iron elements. Formation of one or more complex product(s) that are proposed in this Figure, could be due to pH fluctuations. Figure 4b shows the same type of diagram for a simplified condition that only contains chloride ions at 0.6 M concentration (which equals to Cl concentration in 3.5 wt. % NaCl solution). From the thermodynamic point of view, both diagrams indicate that at pH values around 7 (that is the pH of the drinking water; shown in Table 1), if solution reaches the metal/coating interface, the most viable corrosion product would be Fe(OH)2.7Cl0.3. On the other side, various ions have different affinities for diffusion into the coating layer, which is intrinsically related to the size and type of each ion. This behavior could not be estimated even by the multicomponent thermodynamic calculations. Therefore, the corrosive environment was simplified and chosen as 3.5 wt. % NaCl solution to minimize any ionic interference during the corrosion process. In this manner, if any corrosion occurs at the coating/metal interface, the reactions could be identified conveniently.
To understand the influence of the selected environment on the samples, Pourbaix diagram which takes into account both the sample potential and the solution pH was plotted using the Medusa software (Figure 4c). By converting the corrosion potential (SCE) of the sample (Figure 5) to the standard hydrogen electrode (SHE) potential during the whole immersion time, it is observed that the coating/metal interface would be situated in the orange rectangle shown in Figure 4c. This indicates that if the solution penetrates the coating/metal interface, the metal would start to dissolve according to the Fe → Fe2+ + 2e anodic reaction while the cathodic reaction would be the reduction of oxygen. Comparing Figure 4b,c, it could be concluded that the fraction-pH diagram by itself could not predict the most probable thermodynamic condition, hence the electrochemical history of the sample would also be required.
Figure 4. Thermodynamic calculations showing (a) multicomponent fraction-pH diagrams for dissolved species (anions and cations) in drinking water including iron (as the main alloying element of the substrate material) with the same concentrations (in molar) as reported in Table 1; (b) simplified multicomponent fraction-pH diagram containing only chloride ions at 0.6 M (equal to Cl concentration in 3.5 wt. % NaCl solution) concentration; and (c) multi-component Pourbaix diagram of Fe-Cl-H2O system obtained at 25 °C and Cl concentration of 0.6 M. Note that iron concentration was fixed at 10−6 M in all thermodynamic calculations.
Metals 05 01645 g004
Figure 5. Mean OCP values of the coated samples during 1462 h of immersion in 3.5 wt. % NaCl solution.
Metals 05 01645 g005

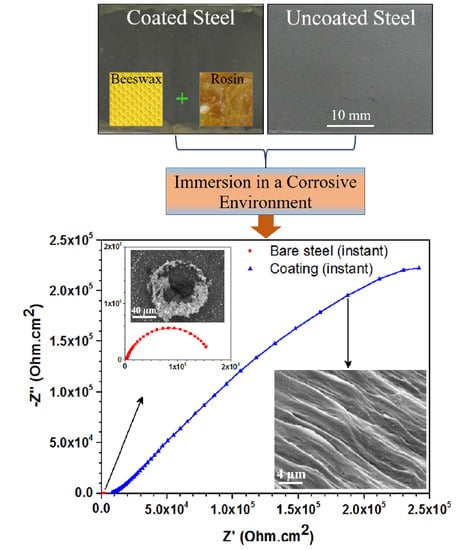
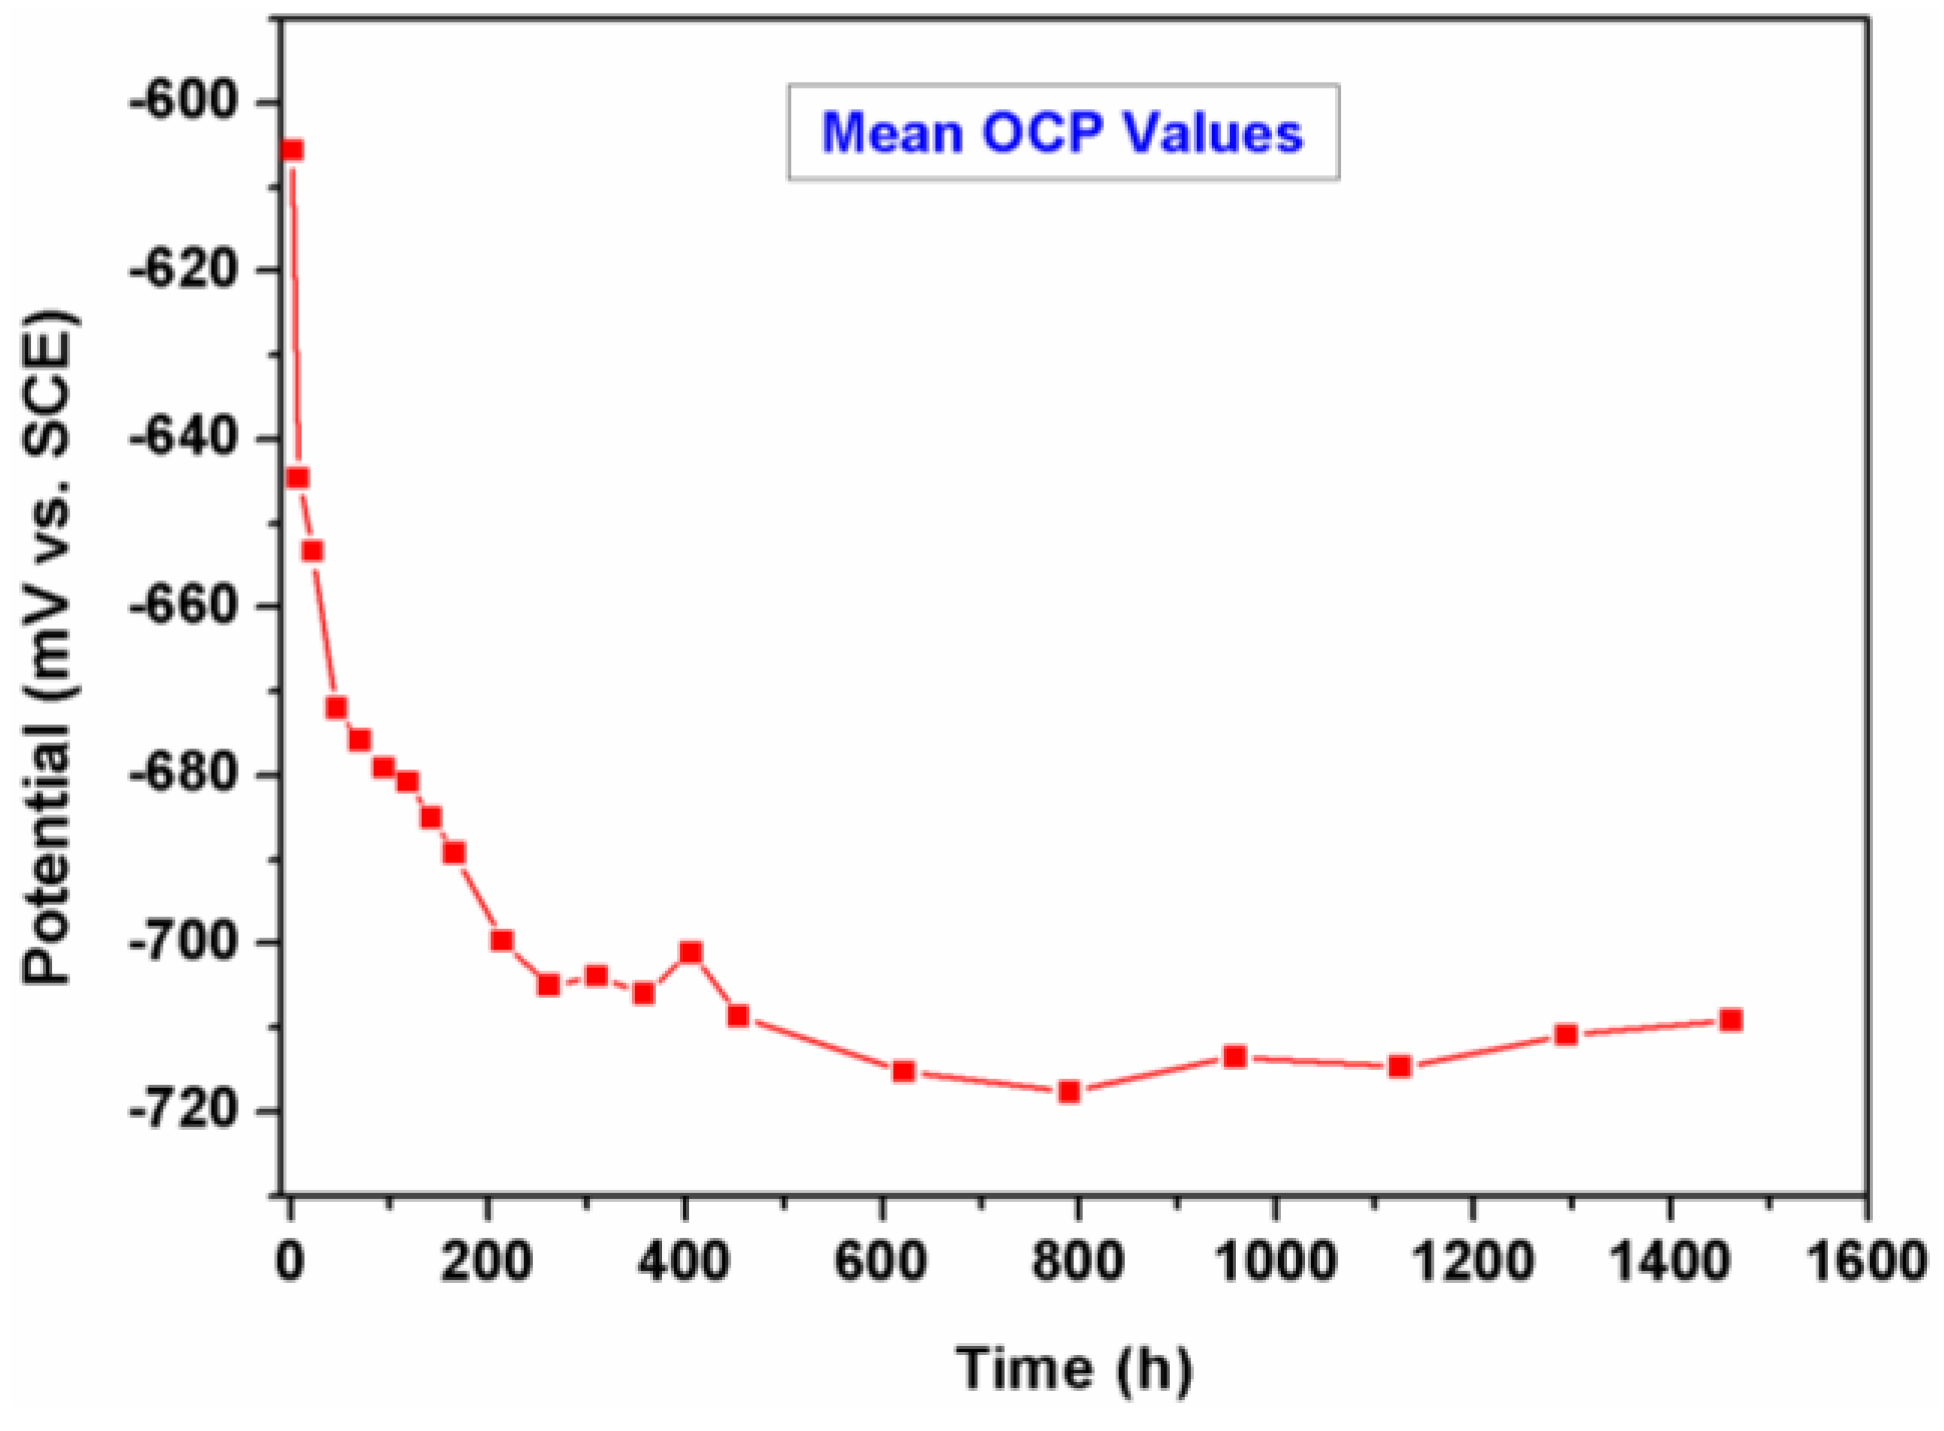
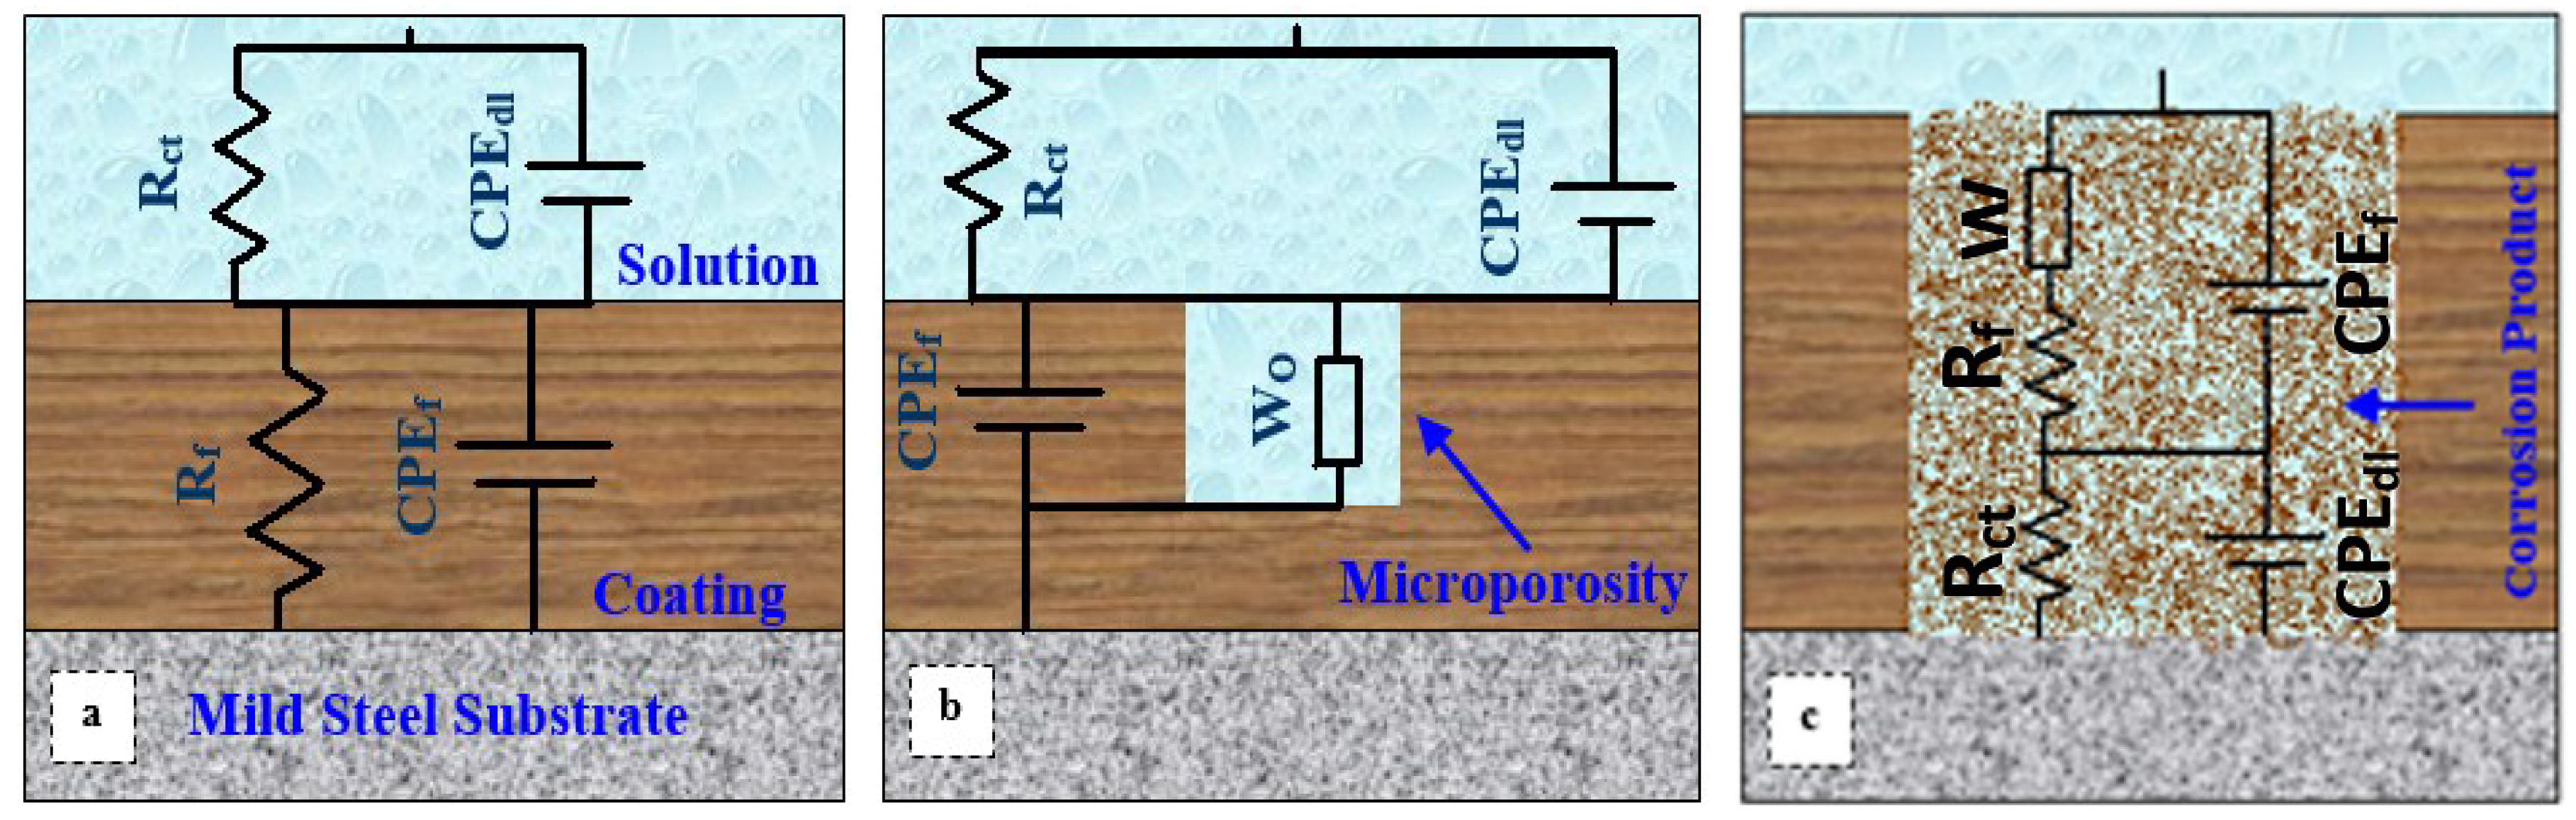
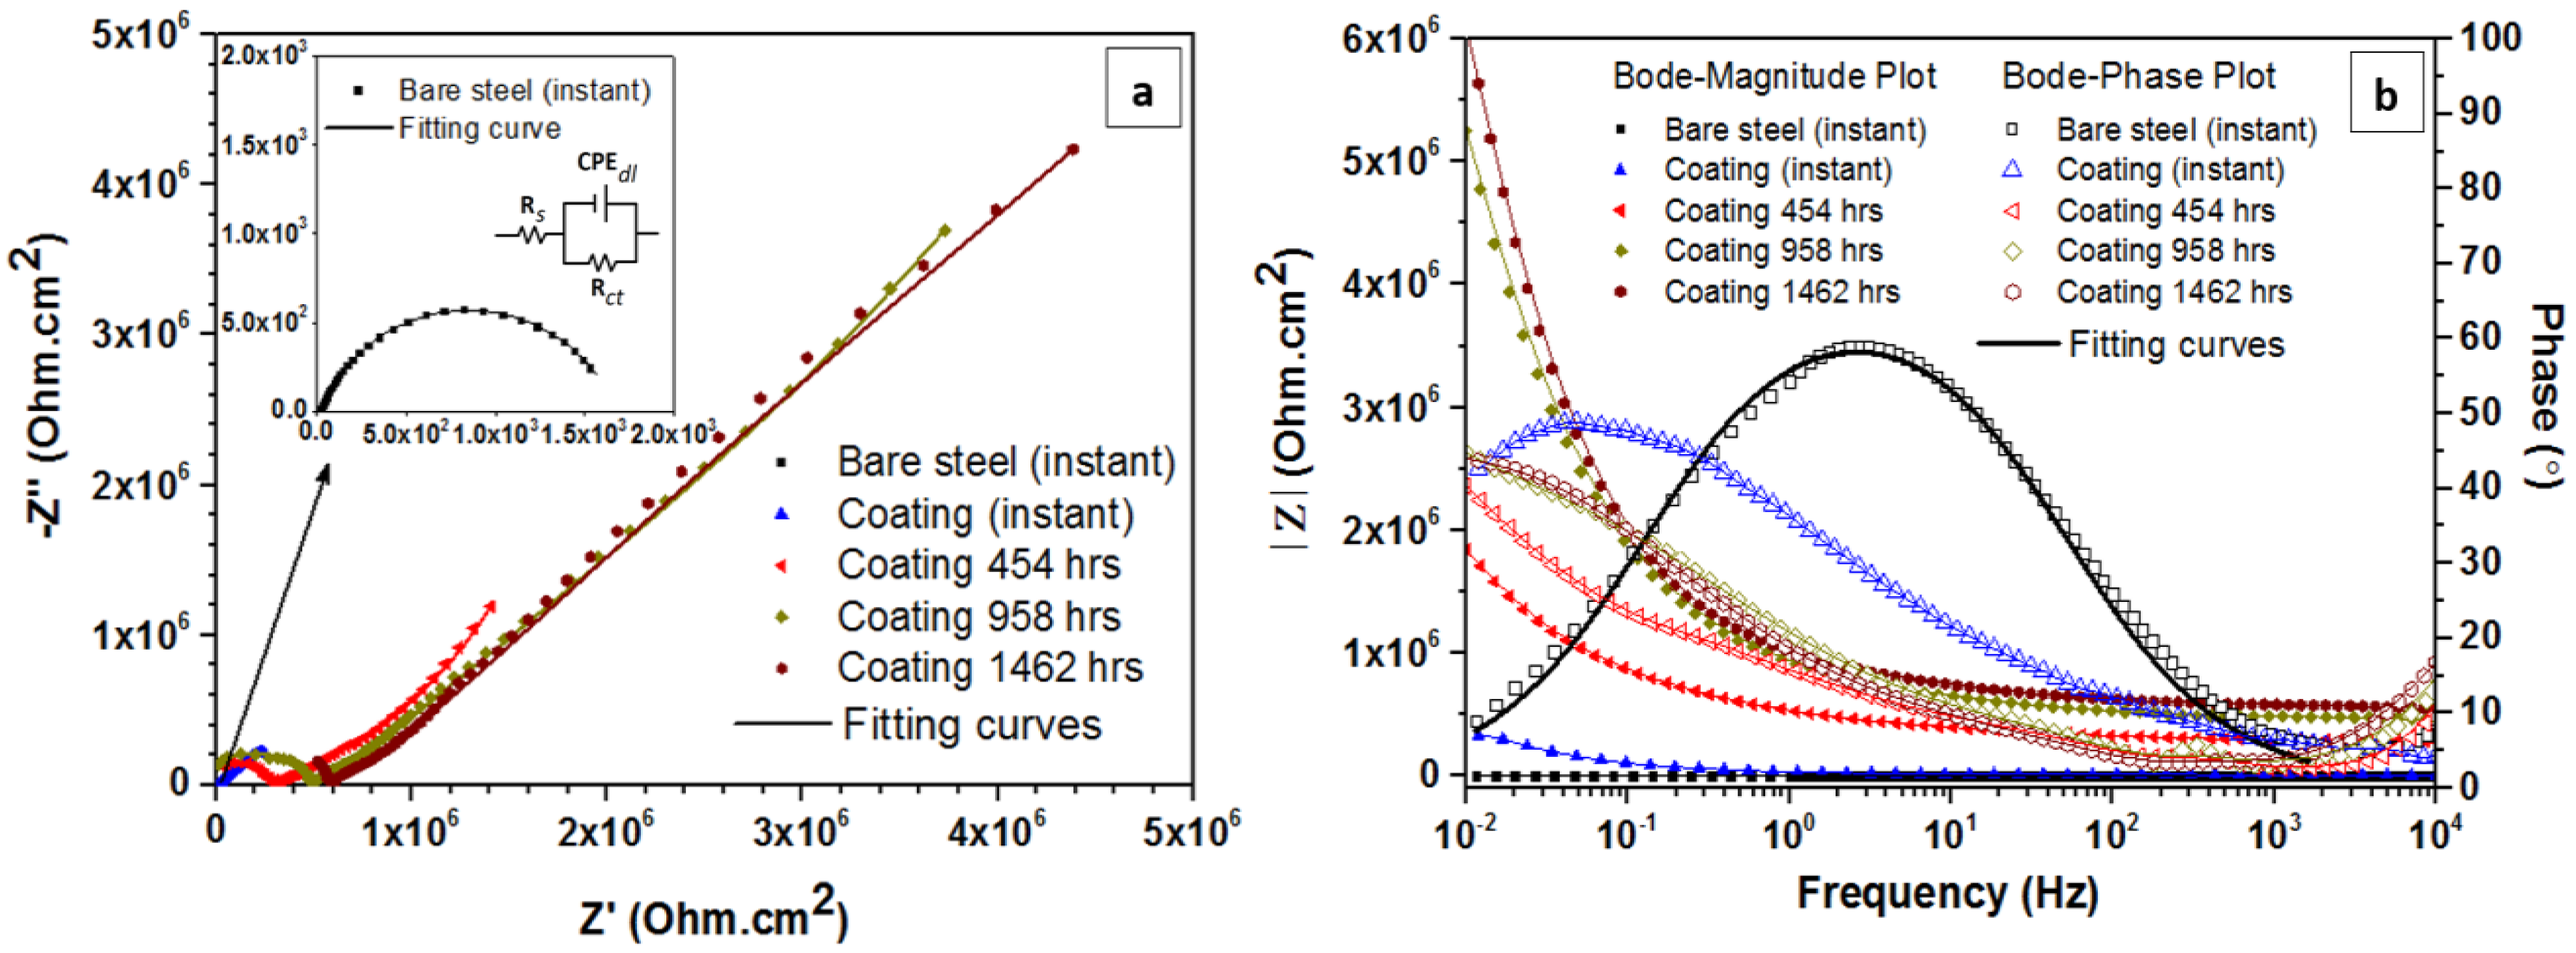
3.2. Electrochemical Measurements

The instant mean OCP value of the bare steel sample in 3.5 wt. % NaCl solution was −470 mV (vs. SCE). At this stage, the exposed surface of the sample started rusting which requires further mechanistic studies. On the other side, carbon steels used for construction of the drinking water tanks should not be in direct contact with water due to the health-related regulations. Therefore, the long-term electrochemical behavior of the bare steel was not investigated in this research. In order to study the potential variations of the coated samples during the whole immersion time, the mean OCP values for each 5 min measurement is calculated and shown in Figure 5. It is observed that during the first 454 h of immersion, the OCP values of the sample decreased considerably to around −710 mV (vs. SCE) and remained almost constant until the end of the measurements. It is reported that the free corrosion potential of the sample shifts towards more positive values in an aqueous environment containing a natural distribution of microorganisms [44,45]. This would be due to the release of additional oxidizers during microorganisms’ reproduction and growth [44]. Therefore, a decreasing OCP trend could be due to low oxidizing activity of microorganisms, presence of insignificant number of them in the environment or water diffusion into the coating [13]. The decline in OCP values could also be attributed to water adsorption into the coating layer [25]. Accordingly in Figure 5, the plateau part of the graph at longer immersion times could be due to the water saturation of the coating and surface reactions reaching a stable condition. This was further investigated by performing EIS analysis, results of which are discussed in the following. It should be noted that the maximum potential difference among OCP measurements is around 110 mV, which is not significantly high for the period of immersion.
In order to study the electrochemical behavior of the coating, EIS tests were performed on the sample at the mentioned measurement intervals. According to the EIS results, three equivalent circuits are proposed as physical models (as shown in Figure 6), although various equivalent circuits could be employed for an entity corroding system [24,25,26,27]. To achieve an optimum fitting result, not only relative estimated errors of the calculated parameters by the software were kept below 3%, but also the fitting precision was checked by comparing the experimental and fitted curves. Figure 6a shows the equivalent circuit and the proposed physical model to fit the experimental EIS results for the first 22 h of immersion. For longer immersion times as shown in Figure 6b,c, two other different models/circuits were proposed showing the presence of diffusion related parameters, i.e., finite and infinite Warburg elements. The equivalent circuits parameters include Rct (Ohm cm2) as the charge transfer resistance at the surface/electrolyte interface, double-layer constant phase element, CPEdl (F cm−2), as the imperfect capacitance, Rf (Ohm cm2) as the surface film (or coating) resistance, CPEf (F cm−2) as the surface film capacitance, and Wor and W (Ohm s−0.5) as the Warburg open (finite) and infinite Warburg elements, respectively [13,24]. CPE derivatives known as P and n are the magnitude of CPE and deviation parameter, respectively. Finally, Woc is defined as the Warburg exponent of Wor where finite Warburg is the applicable factor.
Figure 6. Proposed equivalent circuits to fit long-term EIS results for; (a) the first 22 h; (b) the next 408 h and (c) the last 840 h of immersion.
Metals 05 01645 g006
The Warburg impedance depends on the potential perturbation frequency. For example, at low frequencies, the reactant species have to diffuse farther from the reacting surface, resulting in an increase in the Warburg impedance, ZW, [26,27]. Therefore, the equation for the infinite Warburg is as following [24,27]:
Z W = σ ( ω ) 0.5 ( 1 j )
In this equation (Equation (1)), σ (Ohm s−0.5) is the Warburg coefficient that is defined as [24,27]:
σ = R T n 2 F 2 A 2 ( 1 C O D O + 1 C R D R )
where
  • ω = radial frequency (rad s−1)
  • DO = diffusion coefficient of the oxidant (cm2 s−1)
  • DR = diffusion coefficient of the reductant (cm2 s−1)
  • A = surface area of the electrode (cm2)
  • n = number of electrons involved
  • F = Faradays constant
  • R = gas constant
  • T = temperature (K)
  • C*o = concentration of oxidant in the bulk
  • C*R = concentration of reductant in the bulk
  • J = (−1)0.5
This form of the Warburg impedance is only valid if the diffusion layer has an infinite thickness that is quite often not the case. However, if the diffusion layer is limited, the impedance at lower frequencies will no longer follow the Equation (1). Instead, another equation, being the “finite” Warburg, will be implied [24,27]:
Z O = σ ω 0.5 ( 1 j ) tanh ( δ ( j ω D ) 0.5 )
in which
  • ZO = finite Warburg impedance
  • δ = Nernst diffusion layer thickness (cm)
  • D = some average value of the diffusion coefficients of the diffusing species (cm2 s−1)
According to literature, the corrosion resistance of a metallic surface is directly related to the total impedance of the surface [27]. Every element of the circuit, e.g., electrode resistance (R) or capacitance (C), has a defined impedance value that contributes to the total impedance value [24,27]. For instance, the impedance value of the Rf element is the same as its resistance value [24,26].
Figure 7 shows the experimental and fitted EIS curves of the coated sample at four different measurement times, being 0 (instant), after 454, 958, and 1462 h of immersion. As a control group experiment, the EIS curve of the bare steel sample at the instant measurement time is also included. The inset graph in Figure 7a illustrates the Nyquist plot of the bare steel sample together with the proposed equivalent circuit of the fitted data. Nyquist and Bode plots of the corroded steel sample showed only one time-constant that is typically an indication of uniform corrosion occurrence on metallic surfaces. Comparing the results of the bare steel and the coated sample (instant EIS measurements), it can be observed that the coating has led to a significant increase in the corrosion resistance of the sample; around 500 times. Note that these results have been chosen so that they cover all the proposed equivalent circuits shown in Figure 6.
The extracted impedance parameters analyzed by the EIS analyzer software from the EIS plots are summarized in Table 2.
Figure 8 shows the relationship between different EIS parameters of the coated sample listed in Table 2. The discontinuities in the data plots in Figure 8a,d correspond to those measurement times where a parameter (e.g., Rf in Figure 8a) was not applicable to the defined equivalent circuit for that specific period (showed by dashed lines in Table 2).
Figure 7. The experimental and fitted EIS curves of bare steel (at instant immersion time) and coated sample at four different measurement times, being 0 (instant), after 454, 958, and 1462 h of immersion; (a) Nyquist plots and (b) Bode plots; The inset graph in (a) illustrates the Nyquist plot of the bare steel sample together with the proposed equivalent circuit of the fitted data.
Metals 05 01645 g007
Table 2. Extracted electrochemical impedance spectroscopy (EIS) parameters for the bare and the coated steel at different immersion times.
Time (h)Rf (Ohm cm²)Rct (Ohm cm2)nfndlpf (F cm−2)pdl (F cm−2)Wor (Ohm s−0.5)Woc (s0.5)W (Ohm s−0.5)
Bare steel (instant)---1.63 × 10³---0.78---6.3 × 10⁻⁴---------
Coating (Instant)6.67 × 1038.11 × 1050.280.733.73 × 10−51.81 × 10⁻⁵---------
76.07 × 1031.50 × 1060.220.715.57 × 10−51.49 × 10⁻⁵---------
226.44 × 1031.60 × 1060.210.705.32 × 10−51.52 × 10⁻⁵---------
46---9.10 × 1030.500.788.40 × 10−61.25 × 10−91.56 × 1050.95---
70---7.38 × 1030.530.791.17 × 10−51.10 × 10−92.04 × 1051.01---
94---7.43 × 1030.520.781.12 × 10−51.29 × 10−91.62 × 1051.02---
118---8.03 × 1030.480.781.05 × 10−51.32 × 10−91.35 × 1051.07---
142---8.57 × 1030.520.781.10 × 10−51.55 × 10−91.82 × 1051.15---
166---8.27 × 1030.520.781.09 × 10−51.87 × 10−111.93 × 1051.34---
214---2.26 × 1050.440.931.83 × 10−62.90 × 10−116.21 × 1053.22---
262---2.17 × 1050.450.911.78 × 10−63.66 × 10−115.92 × 1053.42---
310---2.50 × 1050.430.921.50 × 10−63.54 × 10−117.03 × 1053.52---
358---2.60 × 1050.420.901.39 × 10−64.21 × 10−116.61 × 1053.64---
406---2.64 × 1050.380.911.24 × 10−63.59 × 10−115.90 × 1053.65---
454---2.64 × 1050.380.921.24 × 10−63.59 × 10−115.89 × 1053.65---
6225.67 × 1054.13 × 1050.580.983.59 × 10−71.33 × 10⁻¹¹------1.03 × 10⁶
7904.53 × 1054.53 × 1050.590.973.02 × 10−71.49 × 10⁻¹¹------1.11 × 10⁶
9584.79 × 1054.96 × 1050.600.923.92 × 10−72.54 × 10⁻¹¹------1.37 × 10⁶
11262.74 × 1055.68 × 1050.620.832.35 × 10−76.09 × 10⁻¹¹------1.30 × 10⁶
12942.65 × 1055.55 × 1050.630.832.49 × 10−75.67 × 10⁻¹¹------1.19 × 10⁶
14622.50 × 1055.84 × 1050.620.862.50 × 10−74.57 × 10⁻¹¹------1.19 × 10⁶
According to the EIS results, it can be understood that at the first 22 h of immersion, the coating demonstrates a capacitive behavior (Figure 6a) probably due to the partial water adsorption into the coating layer. However, at longer immersion times, a diffusion control condition (as indicated by the Warburg element) could be observed (Figure 6b,c) as a result of water diffusion/penetration through the micro porosities or micro pipes of the coating [24,26]. As can be seen in Figure 7a, after 22 h of immersion, the coating layer induces resistance towards the diffusion of the reaction components, reducing the anodic and cathodic reaction rates. This phenomenon leads to an increase in the Rct values at longer than the 622 h of immersion. Moreover, considering Figure 7b, the phase depression and shift during the immersion times confirms the water adsorption phenomenon through the coating micro porosities [23,25,26,28]. According to the measured impedance values of the coating, it can be deduced that the coating resistance is increased during the whole immersion times which could be due to obstruction of the micro porosities by possible reaction products such as salts [23,24,26]. Concerning the possible effect of coating ingredients (beeswax and colophony) on blocking the micro porosities, it should be noted that both components are reported to be mainly insoluble in water, and thus having no contribution to coating behavior [18,20]. However, the coating degradation and its influence on the coating performance requires further research. Subsequently, to investigate the coating disbondment, blistering, corrosion or rust formation at the steel/coating interface, all samples were checked visually after the final electrochemical measurements, and no evidence was observed.
Figure 8. The relationship between different EIS parameters of the coated sample listed in Table 2, (a) Resistance values “R”; (b) deviation parameters “n”; (c) CPE magnitudes “P”, and (d) finite/infinite Warburg coefficients “Wor” and Warburg exponent “Woc”.
Metals 05 01645 g008
Based on the results, the beeswax-colophony blend could be recommended as an appropriate coating for corrosion protection applications in municipal drinking water tanks. Another advantage of this coating is that it could be recycled and easily restored at any damaged area of the tank. Regarding human health, this novel coating does not allow corrosion, which releases noxious compounds, to occur.

3.3. Preliminary Chemical and Microbiological Evaluations

3.3.1. HPC Procedure

Based on the experiments, heterotrophic plate count for drinking water samples collected after one month circulation in the coated tank at 35 °C/48 h were 125 CFU mL−1 and 98 CFU mL−1, respectively. The world health organization (WHO) has declared 500 CFU mL−1 as the maximum acceptable level for heterotrophic bacteria in drinking water [36,40,46]. Therefore, it is apparent that the measured values are in the accepted range defined by the standard. Furthermore, no bacterial growth occurred compared with the initial water quality as regards the colony forming units. This preliminary experiment confirms that the proposed green coating could not be consumed as a nourishment source for heterotrophs.

3.3.2. Micro-Pollutants Measurements

Within the water samples collected after one-month circulation in the coated tank, four discrete compounds were detected at various concentrations being toluene, chloroform, bromodichloromethane and dibromochloromethane. Comparing the micro-pollutants analyses (listed in Table 3) with WHO guidelines [46], it could be understood that the measured concentrations of the compounds in both samples are in accordance with the defined limitations of the standard.
Table 3. Micro-pollutants concentrations in circulated drinking water samples in the coated tank.
SampleDetected Compounds (ppb)
TolueneChloroformBromodichloromethaneDibromochloromethane
10.830.735.8110.48
21.2Not detectedNot detected17.7

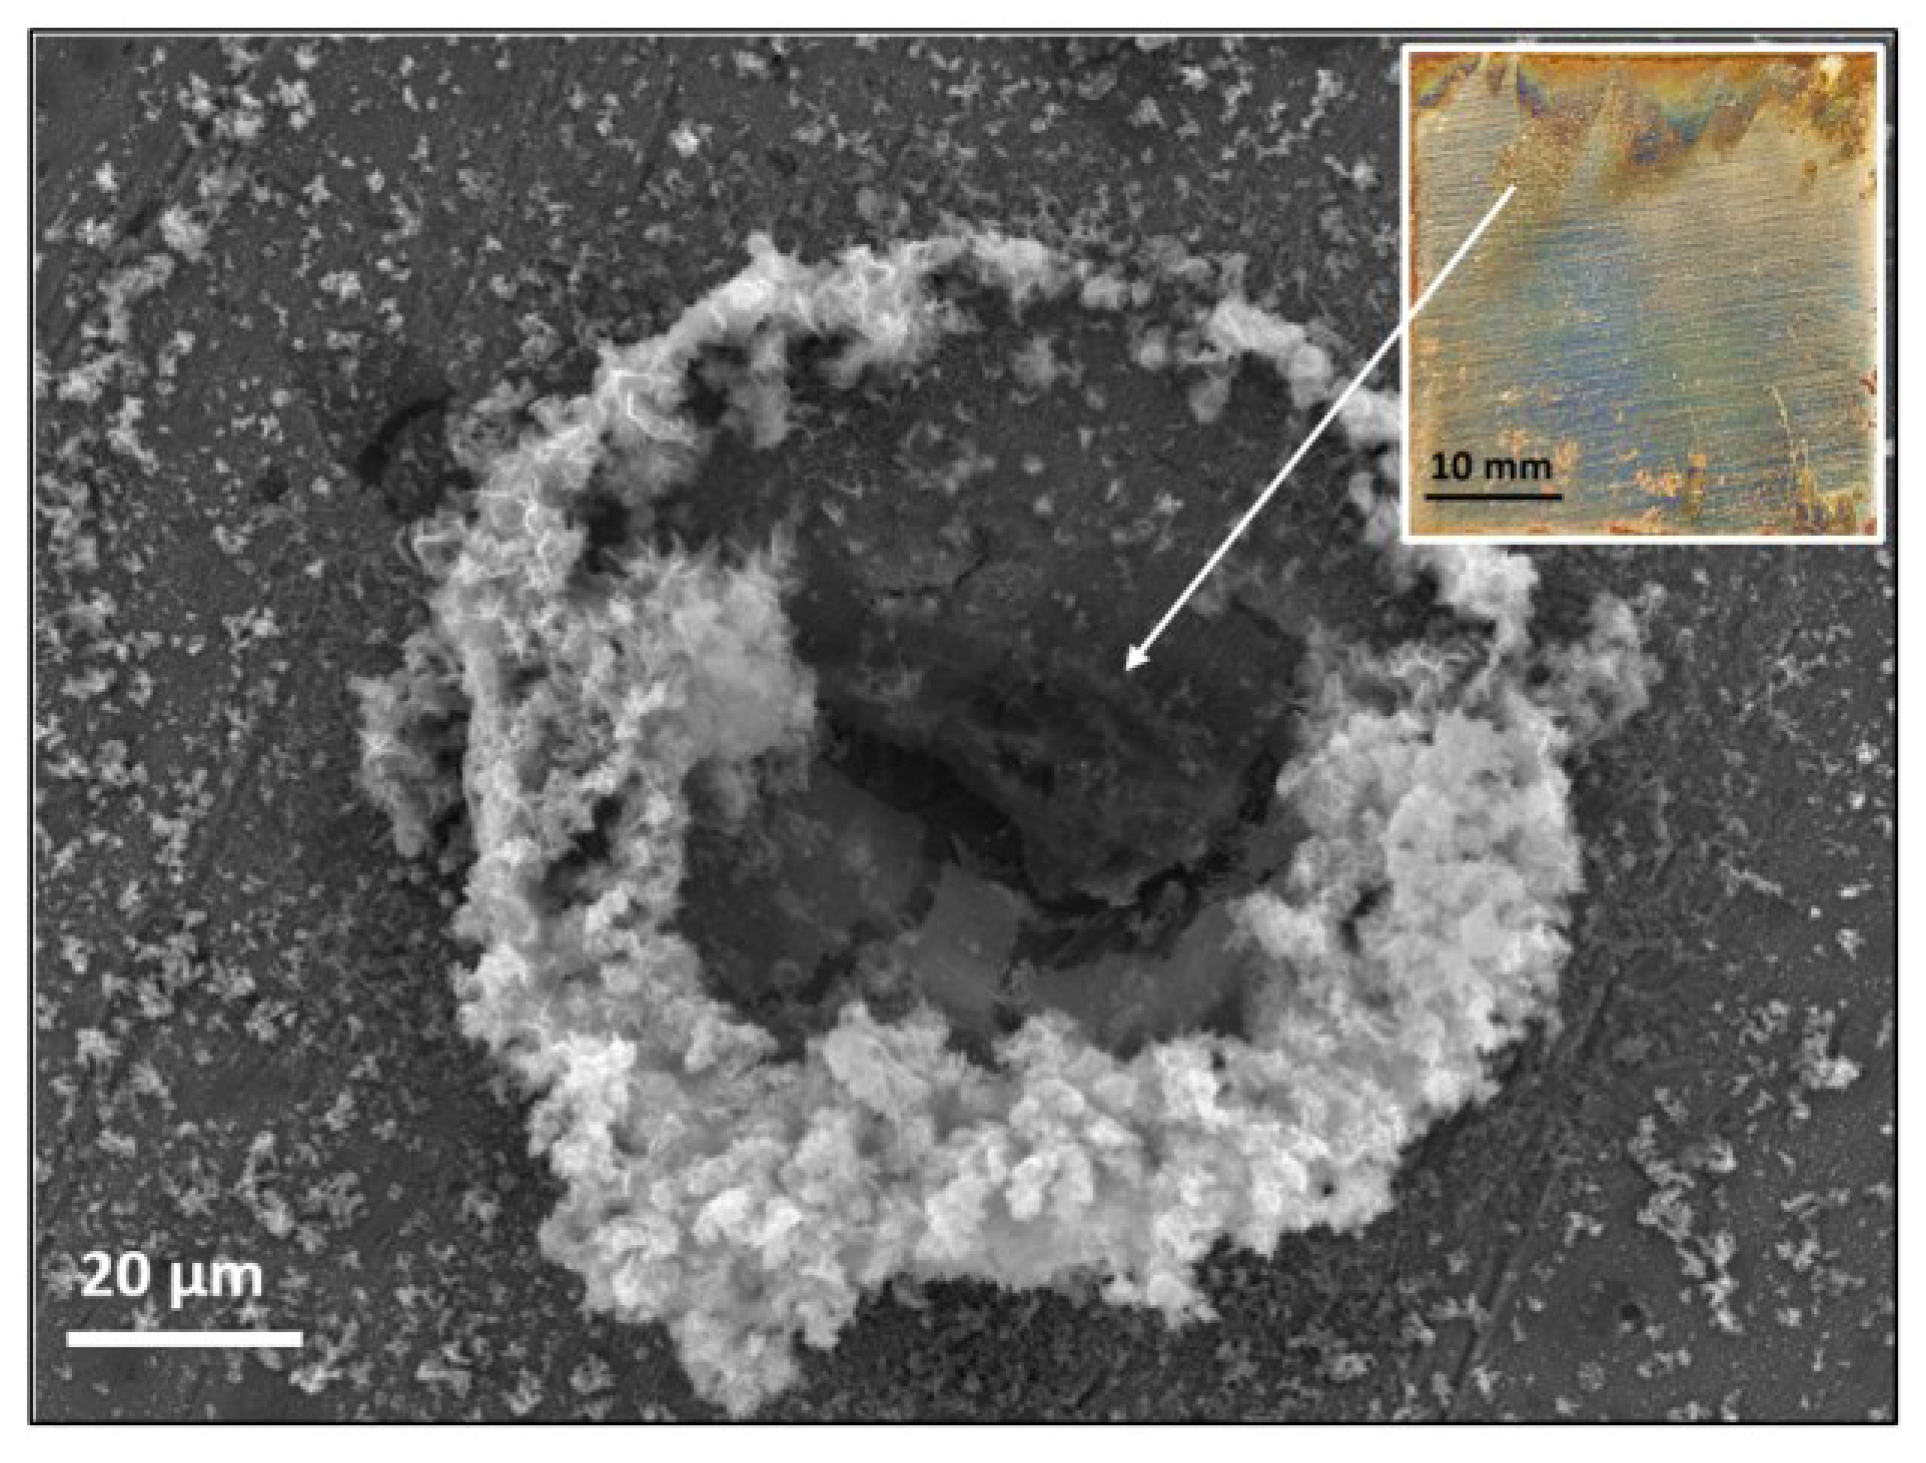
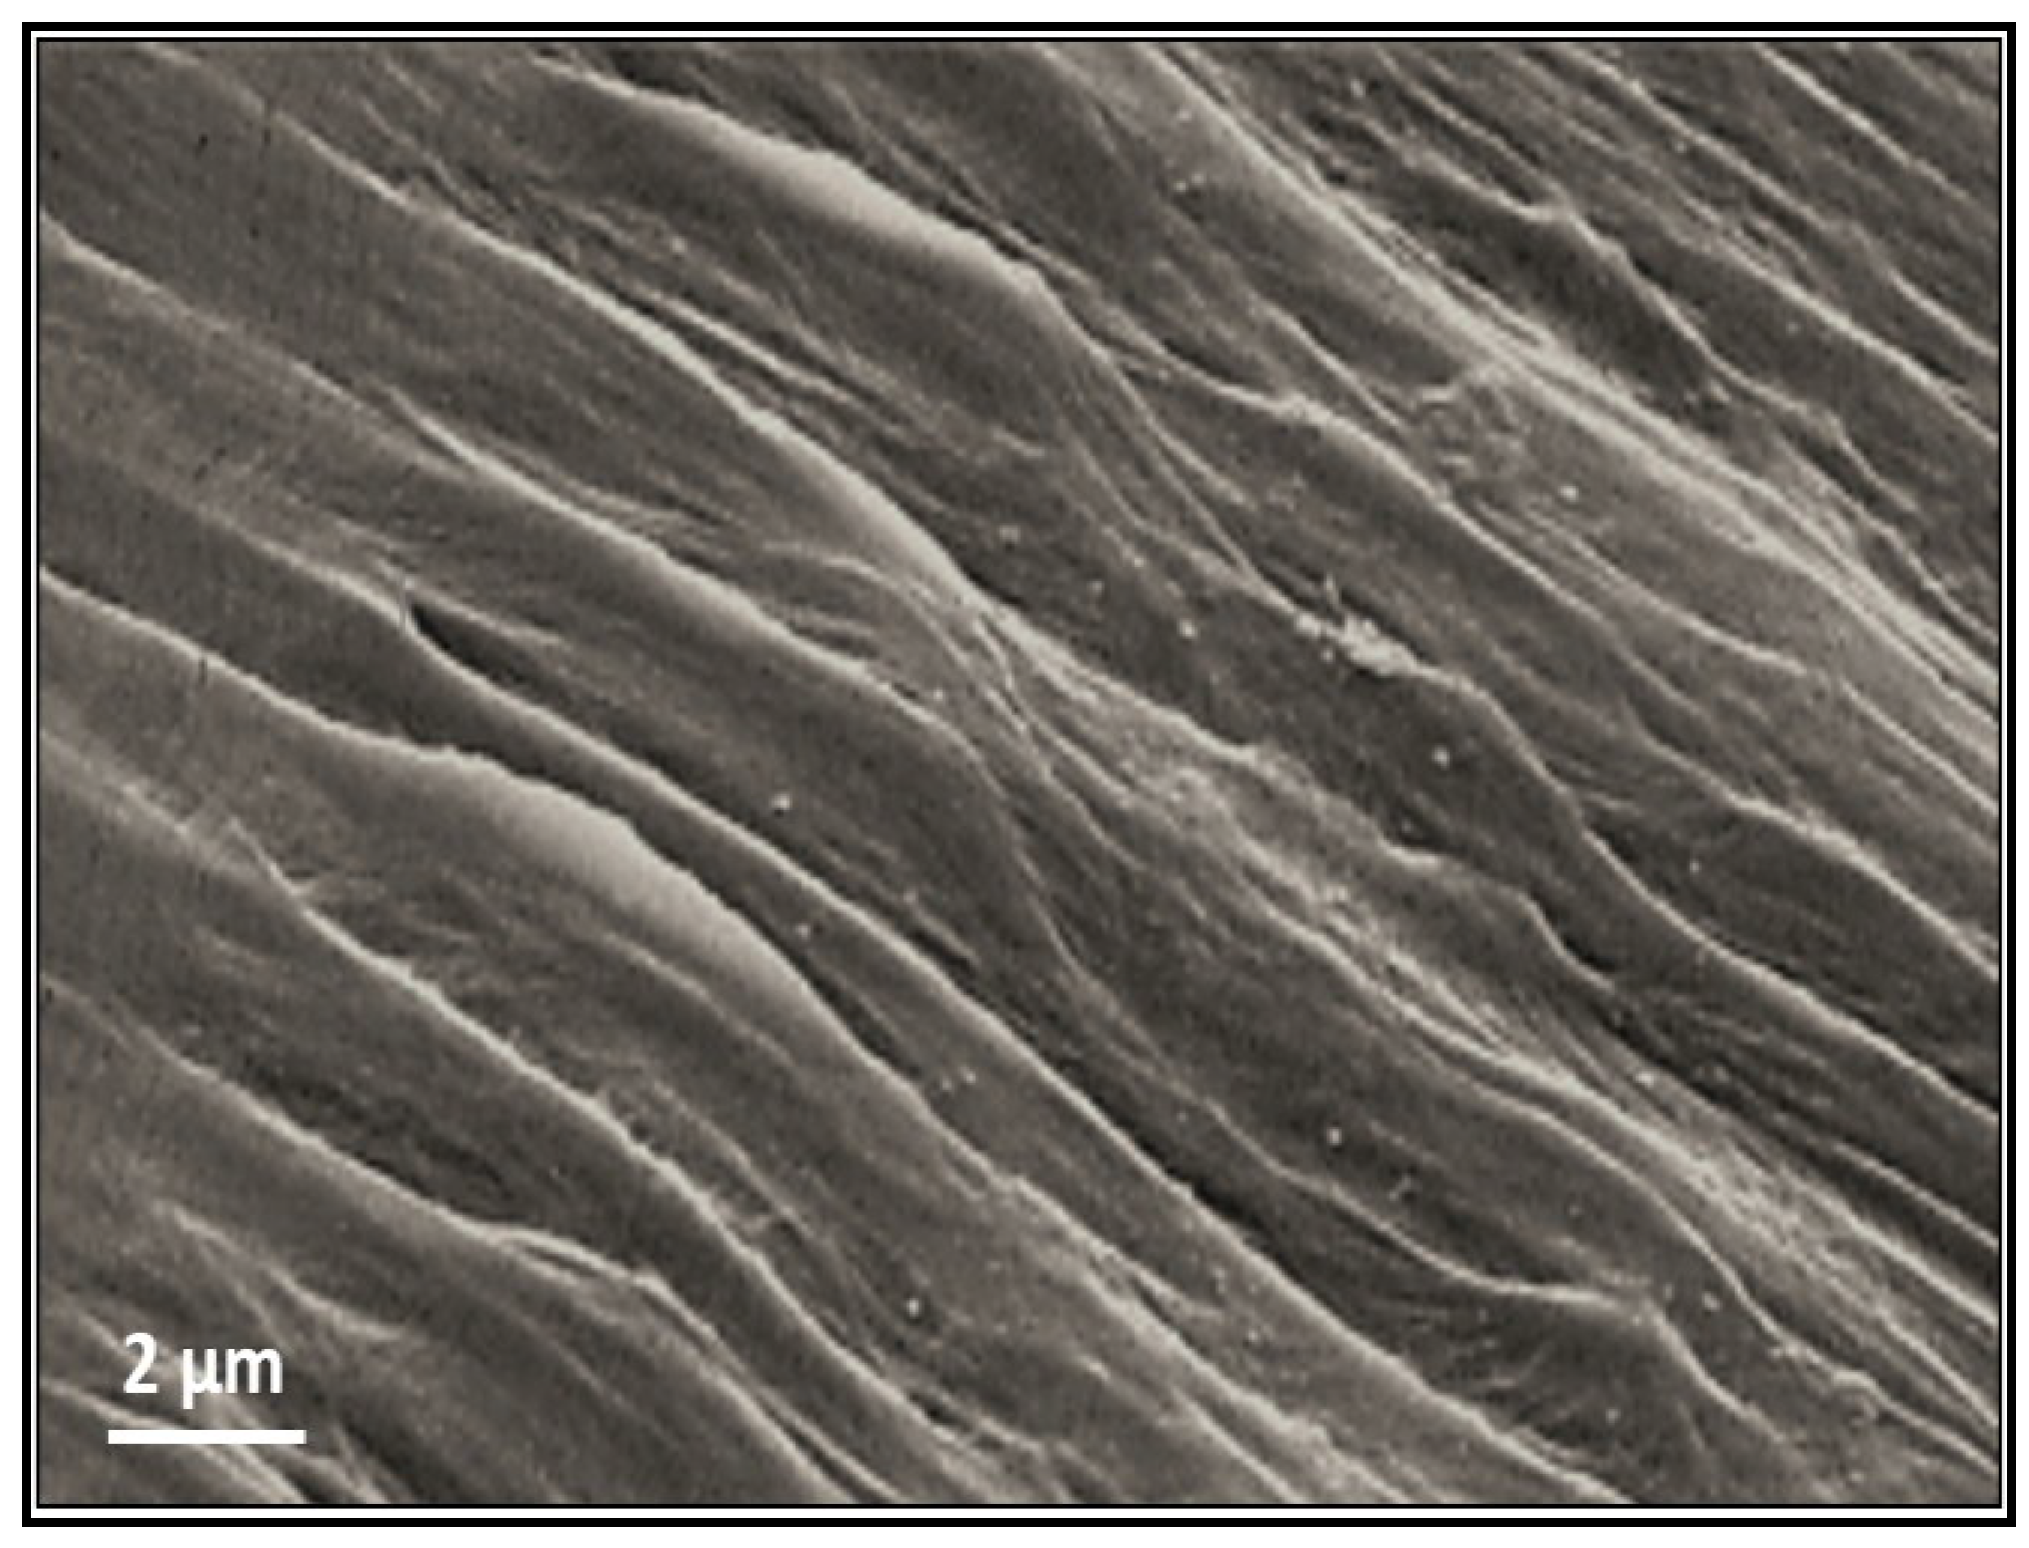
3.4. Surface Characterization

Figure 9 illustrates corrosion attack morphology of the as-ground mild steel sample immersed in 3.5 wt. % NaCl solution at the instant measurement time using optical macroscopy and SEM. The inset figure shows the uniform corrosion pattern and rust formation on the surface of the bare steel after instant EIS measurement. However, using SEM, micron size pits surrounded by rings of corrosion products are also observed within the uniformly corroded regions, which demonstrate co-existence of localised degradation. This could be due to formation of local galvanic cells in presence of surface heterogeneities such as impurities and inclusions. Nevertheless, the EIS results confirmed the uniform corrosion or rusting as the predominant corrosion mechanism.
Figure 9. Secondary electron SEM image showing corrosion attack morphology of the ground mild steel sample immersed in 3.5 wt. % NaCl solution at the instant measurement time. The inset figure demonstrates the uniform corrosion pattern and rust formation on the surface.
Metals 05 01645 g009
Figure 10 shows the SEM image of the coated specimen after immersion in the UASBR treatment plant for a month. Initially, it was supposed that in presence of microorganisms, the coating would act as a nutrition source due to its high carbon content. However, based on the SEM image, it is seen that the coating experienced no attack by microorganisms (the wrinkles on the coating surface were formed due to shrinkage during solidification). The SEM results confirmed that even in presence of a microbe-intensified UASBR environment, the proposed coating would be non-biodegradable.
Figure 10. Secondary electron SEM image of the beeswax-colophony blend surface after being immersed in the UASBR treatment plant for a month.
Metals 05 01645 g010

4. Conclusions

In this study, electrochemical, chemical and microbiological properties of a beeswax-colophony blend as a novel recyclable organic coating for drinking water tanks was studied. It was observed that during the 1462 h of immersion, the maximum potential difference among OCP values was around 110 mV (vs. SCE), which was not significant for long immersion times. Three equivalent circuits were employed to fit the experimental EIS results. During the first 22 h of immersion, the coating revealed a capacitive behavior, while, at longer immersion times, a diffusion-control behavior was observed. In the whole immersion time, this green organic blend demonstrated a high corrosion resistance. HPC examination, as a commonly used analytical tool in water quality assessment, was performed using the pour plate method and confirmed the water quality within the WHO guidelines. By comparing micro-pollutants’ analyses with drinking water quality standards, it was deduced that the measured concentrations of the detected components were in accordance with the defined limitations. Considering the HPC results, micro-pollutants investigations and the complementary SEM examination, it was observed that the coating did not experience any deterioration and was not consumed by microorganisms as a nourishment source. Nevertheless, the authors believe that other supplementary techniques could also be implemented in future work to characterize other physical and chemical aspects of this newly proposed coating.

Acknowledgments

The authors would like to thank Ferdowsi University of Mashhad and Khorasan Razavi Water and Wastewater Co. for their vast laboratory support and also Valizadeh and Zibaee for their kind support.

Author Contributions

S. Abdikheibari interpreted chemical and microbiological results and drafted the paper. R. Parvizi performed electrochemical studies, analyzed the data and wrote related sections of the manuscript. M.H. Moayed, S.M. Zebarjad and S.A. Sajjadi supervised the project, and provided valuable recommendations on the research and the paper.

Conflicts of Interest

The authors declare no conflict of interest.

References

  1. Morton, L.H.G.; Surman, S.B. Biofilms in biodeterioration—A review. Int. Biodeterior. Biodegrad. 1994, 34, 203–221. [Google Scholar] [CrossRef]
  2. Volk, C.; Dundore, E.; Schiermann, J.; le Chevallier, M. Practical evaluation of iron corrosion control in a drinking water distribution system. Water Res. 2000, 34, 1967–1974. [Google Scholar] [CrossRef]
  3. Videla, H.A. Prevention and control of biocorrosion. Int. Biodeterior. Biodegrad. 2002, 49, 259–270. [Google Scholar] [CrossRef]
  4. Teng, F.; Guan, Y.T.; Zhu, W.P. Effect of biofilm on cast iron pipe corrosion in drinking water distribution system: Corrosion scales characterization and microbial community structure investigation. Corros. Sci. 2008, 50, 2816–2823. [Google Scholar] [CrossRef]
  5. Świetlik, J.; Raczyk-Stanisławiak, U.; Piszora, P.; Nawrocki, J. Corrosion in drinking water pipes: The importance of green rusts. Water Res. 2012, 46, 1–10. [Google Scholar] [CrossRef] [PubMed]
  6. Li, X.; Wang, H.; Zhang, Y.; Hu, C.; Yang, M. Characterization of the bacterial communities and iron corrosion scales in drinking groundwater distribution systems with chlorine/chloramine. Int. Biodeterior. Biodegrad. 2014, 96, 71–79. [Google Scholar] [CrossRef]
  7. Usher, K.M.; Kaksonen, A.H.; Cole, I.; Marney, D. Critical review: Microbially influenced corrosion of buried carbon steel pipes. Int. Biodeterior. Biodegrad. 2014, 93, 84–106. [Google Scholar] [CrossRef]
  8. Wagner, P.A.; Little, B.J.; Hart, K.R.; Ray, R.I. Biodegradation of composite materials. Int. Biodeterior. Biodegrad. 1996, 38, 125–132. [Google Scholar] [CrossRef]
  9. Beech, I.B. Corrosion of technical materials in the presence of biofilms—Current understanding and state-of-the art methods of study. Int. Biodeterior. Biodegrad. 2004, 53, 177–183. [Google Scholar] [CrossRef]
  10. El-Shamy, A.M.; Soror, T.Y.; El-Dahan, H.A.; Ghazy, E.A.; Eweas, A.F. Microbial corrosion inhibition of mild steel in salty water environment. Mater. Chem. Phys. 2009, 114, 156–159. [Google Scholar] [CrossRef]
  11. Sathiyanarayanan, S.; Muthkrishnan, S.; Venkatachari, G. Corrosion protection of steel by polyaniline blended coating. Electrochim. Acta 2006, 51, 6313–6319. [Google Scholar] [CrossRef]
  12. Kim, H.J. Development of a new organic composite coated steel sheet with high corrosion resistance. Surf. Coat. Technol. 1994, 70, 37–41. [Google Scholar] [CrossRef]
  13. Gonçalves, G.S.; Baldissera, A.F.; Rodrigues, L.F., Jr.; Martini, E.M.A.; Ferreira, C.A. Alkyd coatings containing polyanilines for corrosion protection of mild steel. Synth. Met. 2011, 161, 313–323. [Google Scholar] [CrossRef]
  14. Gaillard, Y.; Girard, M.; Monge, G.; Burr, A.; Ceretti, E.D.; Felder, E. Superplastic behavior of rosin/beeswax blends at room temperature. J. Appl. Polym. Sci. 2013, 128, 2713–2719. [Google Scholar] [CrossRef]
  15. Kameda, T. Molecular structure of crude beeswax studied by solid-state 13C NMR. J. Insect Sci. 2004. [Google Scholar] [CrossRef]
  16. Kameda, T.; Tamada, Y. Variable-temperature 13C solid-state NMR study of the molecular structure of honeybee wax and silk. Int. J. Biol. Macromol. 2009, 44, 64–69. [Google Scholar] [CrossRef] [PubMed]
  17. Naderi, R.; Attar, M.M.; Moayed, M.H. EIS examination of mill scale on mild steel with polyester-epoxy powder coating. Prog. Org. Coat. 2004, 50, 162–165. [Google Scholar] [CrossRef]
  18. Luo, W.; Li, T.; Wang, C.; Huang, F. Discovery of Beeswax as binding agent on a 6th-century BC Chinese Turquoise-inlaid Bronze sword. J. Archaeol. Sci. 2012, 39, 1227–1237. [Google Scholar] [CrossRef]
  19. Scholz, G.; Militz, H.; Gascón-Garrido, P.; Ibiza-Palacios, M.S.; Oliver-Villanueva, J.V.; Peters, B.C.; Fitzgerald, C.J. Improved termite resistance of wood by wax impregnation. Int. Biodeterior. Biodegrad. 2010, 64, 688–693. [Google Scholar] [CrossRef]
  20. Silvestre, A.J.D.; Gandini, A. Chapter 4—Rosin: Major Sources, Properties and Applications. In Monomers, Polymers and Composites from Renewable Resources; Belgacem, N.N., Gandini, A., Eds.; Elsevier: Amsterdam, The Netherlands, 2008; pp. 67–88. [Google Scholar]
  21. Mellema, M. Co-crystals of Beeswax and Various Vegetable Waxes with Sterols Studied by X-ray Diffraction and Differential Scanning Calorimetry. J. Am. Oil Chem. Soc. 2009, 86, 499–505. [Google Scholar] [CrossRef]
  22. Gaillard, Y.; Mija, A.; Burr, A.; Darque-Ceretti, E.; Felder, E.; Sbirrazzuoli, N. Green material composites from renewable resources: Polymorphic transitions and phase diagram of beeswax/rosin resin. Thermochim. Acta 2011, 521, 90–97. [Google Scholar] [CrossRef]
  23. Yasuda, H.; Yu, Q.S.; Chen, M. Interfacial factors in corrosion protection: An EIS study of model systems. Prog. Org. Coat. 2001, 41, 273–279. [Google Scholar] [CrossRef]
  24. Bierwagen, G.; Tallman, D.; Li, J.; He, L.; Jeffcoate, C. EIS studies of coated metals in accelerated exposure. Prog. Org. Coat. 2003, 46, 149–158. [Google Scholar] [CrossRef]
  25. Zhang, J.T.; Hu, J.M.; Zhang, J.Q.; Cao, C.N. Studies of water transport behavior and impedance models of epoxy-coated metals in NaCl solution by EIS. Prog. Org. Coat. 2004, 51, 145–151. [Google Scholar] [CrossRef]
  26. Deflorian, F.; Rossi, S. An EIS study of ion diffusion through organic coatings. Electrochim. Acta 2006, 51, 1736–1744. [Google Scholar] [CrossRef]
  27. Hinderliter, B.R.; Croll, S.G.; Tallman, D.E.; Su, Q.; Bierwagen, G.P. Interpretation of EIS data from accelerated exposure of coated metals based on modeling of coating physical properties. Electrochim. Acta 2006, 51, 4505–4515. [Google Scholar] [CrossRef]
  28. Zuo, Y.; Pang, R.; Li, W.; Xiong, J.P.; Tang, Y.M. The evaluation of coating performance by the variations of phase angles in middle and high frequency domains of EIS. Corros. Sci. 2008, 50, 3322–3328. [Google Scholar] [CrossRef]
  29. Ito, D.; Yokoyama, T.; Okazaki, S. Evaluation of Blister Growth of High Performance Organic Coatings by Electrochemical Impedance Measurements. ECS Trans. 2012, 41, 55–60. [Google Scholar]
  30. Kong, D.; Wang, Y.; Zhang, W.; Wang, W.; Liu, X.; Wang, J. Correlation between electrochemical impedance and current distribution of carbon steel under organic coating. Mater. Corros. 2012, 63, 475–480. [Google Scholar] [CrossRef]
  31. Mills, D.; Jamali, S.; Tobiszewski, M.T. Developing electrochemical measurements in order to assess anti-corrosive coatings more effectively. Prog. Org. Coat. 2012, 74, 385–390. [Google Scholar] [CrossRef]
  32. Amand, S.; Musiani, M.; Orazem, M.E.; Pébère, N.; Tribollet, B.; Vivier, V. Constant-phase-element behavior caused by inhomogeneous water uptake in anti-corrosion coatings. Electrochim. Acta 2013, 87, 693–700. [Google Scholar] [CrossRef]
  33. Upadhyay, V.; Harkal, U.; Webster, D.; Bierwagen, G. Preliminary investigation of the impact of polymer composition on electrochemical properties of coatings as determined by electrochemical impedance spectroscopy. J. Coat. Technol. Res. 2013, 10, 865–878. [Google Scholar] [CrossRef]
  34. Zhou, Q.; Wang, Y. Comparisons of clear coating degradation in NaCl solution and pure water. Prog. Org. Coat. 2013, 76, 1674–1682. [Google Scholar] [CrossRef]
  35. Tölgyessy, P.; Vrana, B.; Krascsenits, Z. Development of a screening method for the analysis of organic pollutants in water using dual stir bar sorptive extraction-thermal desorption-gas chromatography-mass spectrometry. Talanta 2011, 87, 152–160. [Google Scholar] [CrossRef] [PubMed]
  36. World Health Organization. Heterotrophic Plate Counts and Drinking-Water Safety; Bartram, J., Cotruvo, J., Exner, M., Fricker, C., Glasmacher, A., Eds.; IWA Publishing: Padstow, UK, 2003. [Google Scholar]
  37. Medusa Thermodynamic Software; KTH Royal Institute of Technology: Stockholm, Sweden, 2009.
  38. Poelman, M.; Recloux, I.; Cornil, N.; Blandin, N.; Deronne, L.; LeDisert, Y.; Olivier, M.-G. Electrochemical study of the corrosion behaviour at the edges of electrocoated steel. Prog. Org. Coat. 2012, 74, 453–460. [Google Scholar] [CrossRef]
  39. Bondarenko, A.S.; Ragoisha, G.A. Inverse Problem in Potentiodynamic Electrochemical Impedance. Available online: http://www.abc.chemistry.bsu.by/vi/analyser/ (accessed on 14 September 2015).
  40. Allen, M.J.; Edberg, S.C.; Reasoner, D.J. Heterotrophic plate count bacteria—What is their significance in drinking water? Int. J. Food Microbiol. 2004, 92, 265–274. [Google Scholar] [CrossRef] [PubMed]
  41. Massa, S.; Caruso, M.; Trovatelli, F.; Tosques, M. Comparison of plate count agar and R2A medium for enumeration of heterotrophic bacteria in natural mineral water. World J. Microbiol. Biotechnol. 1998, 14, 727–730. [Google Scholar] [CrossRef]
  42. WHO. Guidelines for Drinking-Water Quality: Recommendations; World Health Organization: Geneva, Switzerland, 1993. [Google Scholar]
  43. Chambers, L.D.; Wharton, J.A.; Wood, R.J.K.; Walsh, F.C.; Stokes, K.R. Techniques for the measurement of natural product incorporation into an antifouling coating. Prog. Org. Coat. 2014, 77, 473–484. [Google Scholar] [CrossRef]
  44. Mansfeld, F.; Little, B. A technical review of electrochemical techniques applied to microbiologically influenced corrosion. Corros. Sci. 1991, 32, 247–272. [Google Scholar] [CrossRef]
  45. George, R.P.; Marshall, D.; Newman, R.C. Mechanism of a MIC probe. Corros. Sci. 2003, 45, 1999–2015. [Google Scholar] [CrossRef]
  46. Standardization ECf. Water Quality-Sampling for Microbiological Analysis; British Standards Institute: Brussels, Belgium, 2006. [Google Scholar]

