Review

An Overview of Major Experimental Methods and Apparatus for Measuring and Investigating Erosion-Corrosion of Ferrous-Based Steels

1
School of Naval Architecture and Ocean Engineering, Dalian University of Technology, Dalian 116024, China
2
School of Civil Engineering, Dalian University of Technology, Dalian 116024, China
3
School of Physic and Optoelectronic Engineering, Dalian University of Technology, Dalian 116024, China
4
School of Engineering, Deakin University, Geelong, VIC 3216, Australia
5
Institute for Frontier Materials, Deakin University, Geelong, VIC 3216, Australia
*
Authors to whom correspondence should be addressed.
Metals 2020, 10(2), 180; https://doi.org/10.3390/met10020180
Submission received: 18 December 2019 / Revised: 22 January 2020 / Accepted: 22 January 2020 / Published: 25 January 2020

Abstract

:
This paper firstly provides an overview of major efforts made over the past several decades on developing the test apparatus for the study of erosion-corrosion of ferrous-based steels. The merits and the application range of the set-ups, i.e., rotating disc/cylinder electrode system, slurry jet impingement rig, and test flow loop, are introduced. Secondly, the advantages and limitations of both non-electrochemical and electrochemical methods used for the measurement of erosion-corrosion are presented. Thereafter, the interaction between erosion and corrosion using a cyclic erosion-corrosion method was introduced. The synergy between erosion and corrosion for the steels under the passive state were analyzed on the basis of the breakdown and restoration of the passive film. In addition, the difference between the obtained erosion-enhanced corrosion and the corrosion-enhanced erosion using different experimental methods for steels under active corrosion was discussed. Finally, the interaction between the localized corrosion and erosion was studied through the dynamic change of the local current distribution revealed by the wire beam electrode.

1. Introduction

Erosion-corrosion of steels is a complex issue which affects various industrial sectors such as the ship hull, impeller, and propeller, water injection system, oil and gas exploitation pipelines, slurry transportation, nuclear power industry, and hydro turbines [1,2,3,4,5,6]. It is a complicated phenomenon that involves simultaneous occurrence of corrosion of a metal surface due to electrochemical reactions and erosion of the surface due to mechanical action such as impingement, abrasion, and cavitation. Corrosion of steels is an electrochemical process which suggests the metal atoms are firstly oxidized into cations before them leaving the metal interface [7,8,9,10]. On the other hand, erosion is a mechanical wear process which can physically separate the metal atoms from the steel substrate [11,12,13,14]. The metal loss induced by the coupled effect of erosion and corrosion can sometimes be dramatically higher than the sum of the metal loss caused by individual pure erosion and pure corrosion on a finely polished steel surface [10,11,12,13,14,15,16,17,18,19]. Therefore, various studies were conducted in past decades trying to figure out the interaction and synergy between erosion and corrosion. A general equation, which defines the main components of the interaction and synergy between erosion and corrosion, widely used in previous studies and standards [10,14,15,20,21] is given below.
W t = W c + W e = W c 0 + W c e + W e 0 + W e c ,
where Wt is the total metal loss, Wc is the corrosion component with the presence of corrosion, We is the erosion component with the presence of corrosion, Wc0 is the pure corrosion component without the appearance of erosion, W c e is the erosion-enhanced corrosion, We0 is the pure erosion component without the appearance of corrosion, and W e c is the corrosion-enhanced erosion.
According to Equation (1), the main leads for the metal degradation can be divided into four regimes on the basis of Stack et al.’s efforts [22]:
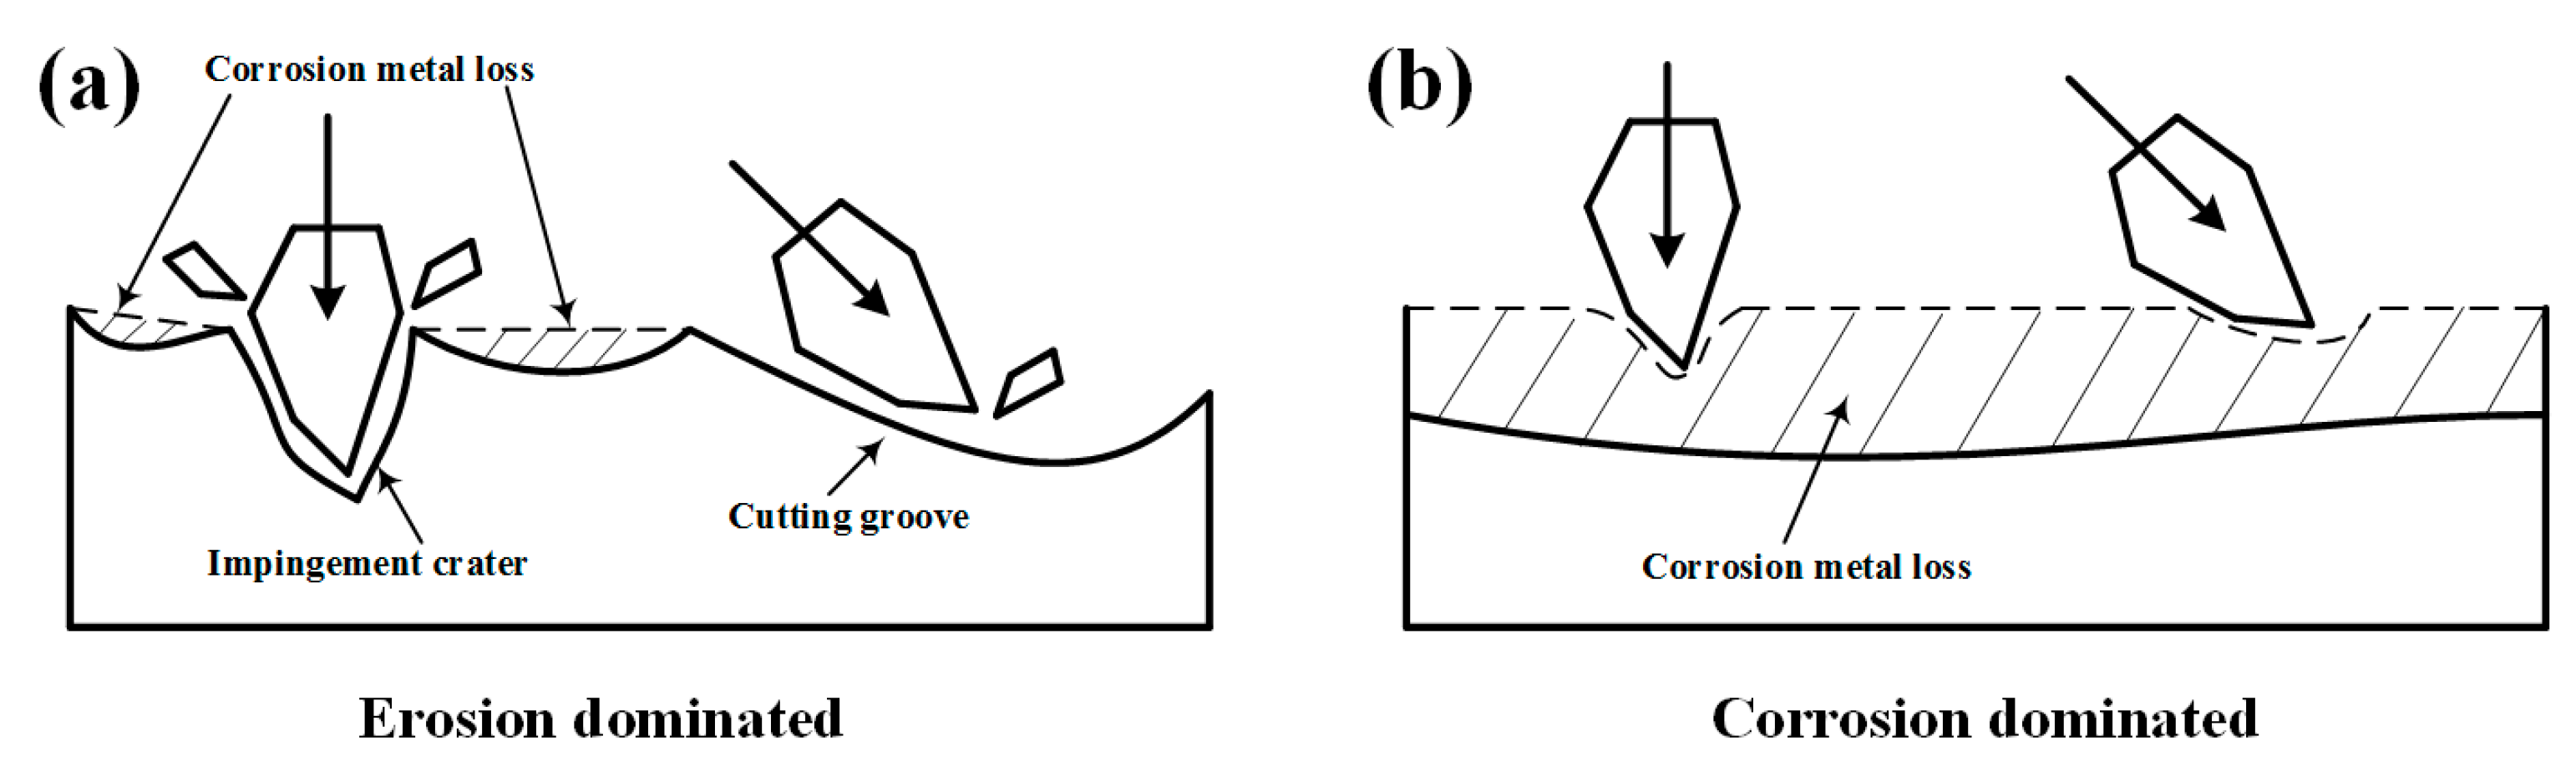
  • Erosion-dominated (Wc/We < 0.1);
  • Erosion-corrosion-dominated (0.1 ≤ Wc/We < 1);
  • Corrosion-erosion-dominated (1 ≤ Wc/We < 10);
  • Corrosion-dominated (Wc/We ≥ 10).
In consideration of the material’s property, impact angle, impact velocity, applied potential, and temperature, various erosion-corrosion maps [23,24,25,26,27,28,29,30] were constructed to predict the metal loss rate and to understand the mechanisms of erosion-corrosion. These maps can facilitate selecting suitable metals for different erosive and corrosive working environments.
According to the erosion-corrosion maps, it is found that, when the impact velocity of the particle is high and the applied anodic potential is low, the metal loss is erosion-dominated as shown in Figure 1a. When the impact energy is high, an intense crater or cutting groove would form on the metal surface which would be much deeper than the corrosion thinning, indicating that corrosion nearly has no influence on erosion. In this case, the traditional erosion models developed by Finnie [31], Bitter [32], Hutchings [33], and other researchers [34,35,36] can be used to predict the metal loss rate under different impingement conditions. Likewise, as shown in Figure 1b, when an intense anodic current is applied on the steel surface and the impact velocity is low, the steel dissolution would be much quicker than the depth loss induced by erosion. The metal loss becomes corrosion-dominated in this case, and the metal loss can be calculated from Faraday’s law [9]. However, when the interfacial modification induced by corrosion or erosion can be significantly influenced by each other, leading to dramatic corrosion-enhanced erosion or erosion-enhanced corrosion, the erosion-corrosion wastage would either fall in the range of erosion-corrosion-dominated or corrosion-erosion-dominated [22]. Although the erosion component and the corrosion component can be roughly evaluated based on the erosion-corrosion map, the synergy or interaction between erosion and corrosion ( W c e   and   W e c ) is hard to directly obtain from the erosion-corrosion map, limiting the further analysis of the essential mechanism of erosion-corrosion.
Various theoretical and empirical models were established in the past decades to clarify the mechanism of erosion-enhanced corrosion and corrosion-enhanced erosion [21,37,38,39,40]. The cyclic erosion-corrosion test [39,40,41] and the erosion-corrosion test in corrosive slurry [10,38] were normally employed in previous studies. The erosion process and corrosion process were totally separated in a cyclic erosion-corrosion test. However, erosion and corrosion would simultaneously occur on the steel interface in the test using corrosive slurry. Accordingly, the obtained conclusions on the interaction or synergy between erosion and corrosion would be totally different by using different test methods. As Equation (1) is generally applied in both cases to express the mechanism of erosion-corrosion, the readers would be confused by the obtained results since the research objectives would be varied using different experimental methods. The erosion-corrosion cycles mainly relate to how the surface topography change induced by pure erosion or corrosion would influence the following pure corrosion or erosion process [40]. Erosion-corrosion tests conducted in corrosive slurries are mainly focused on the synergy of erosion and corrosion which are to work simultaneously [10]. The mechanism of the synergy between erosion and corrosion in the corrosive slurry can be further divided into two cases, i.e., the steel under active corrosion and the steel having a protective film such as an inhibitor film, corrosion product film, or passive film due to different steel properties and test environments [9,10,15,21,38,42,43]. Consequently, it needs a detailed classification and introduction of these erosion-corrosion patterns to comprehend the research advances of erosion-corrosion.
This article provides an overview of the progress made in developing erosion-corrosion simulation apparatus and measuring techniques for both lab tests and field applications. The advantages and drawbacks of the test set-ups and measuring techniques are introduced. In addition, the capabilities and the application ranges of the apparatus and the measuring techniques for the ferrous-based steels under both active corrosion and passivation are discussed. On the basis of the simulation apparatus and measuring techniques, the generated experimental evidences for some theoretical and empirical models of steels under different corrosion patterns are provided.

2. Apparatus for Simulating Erosion-Corrosion of Steel

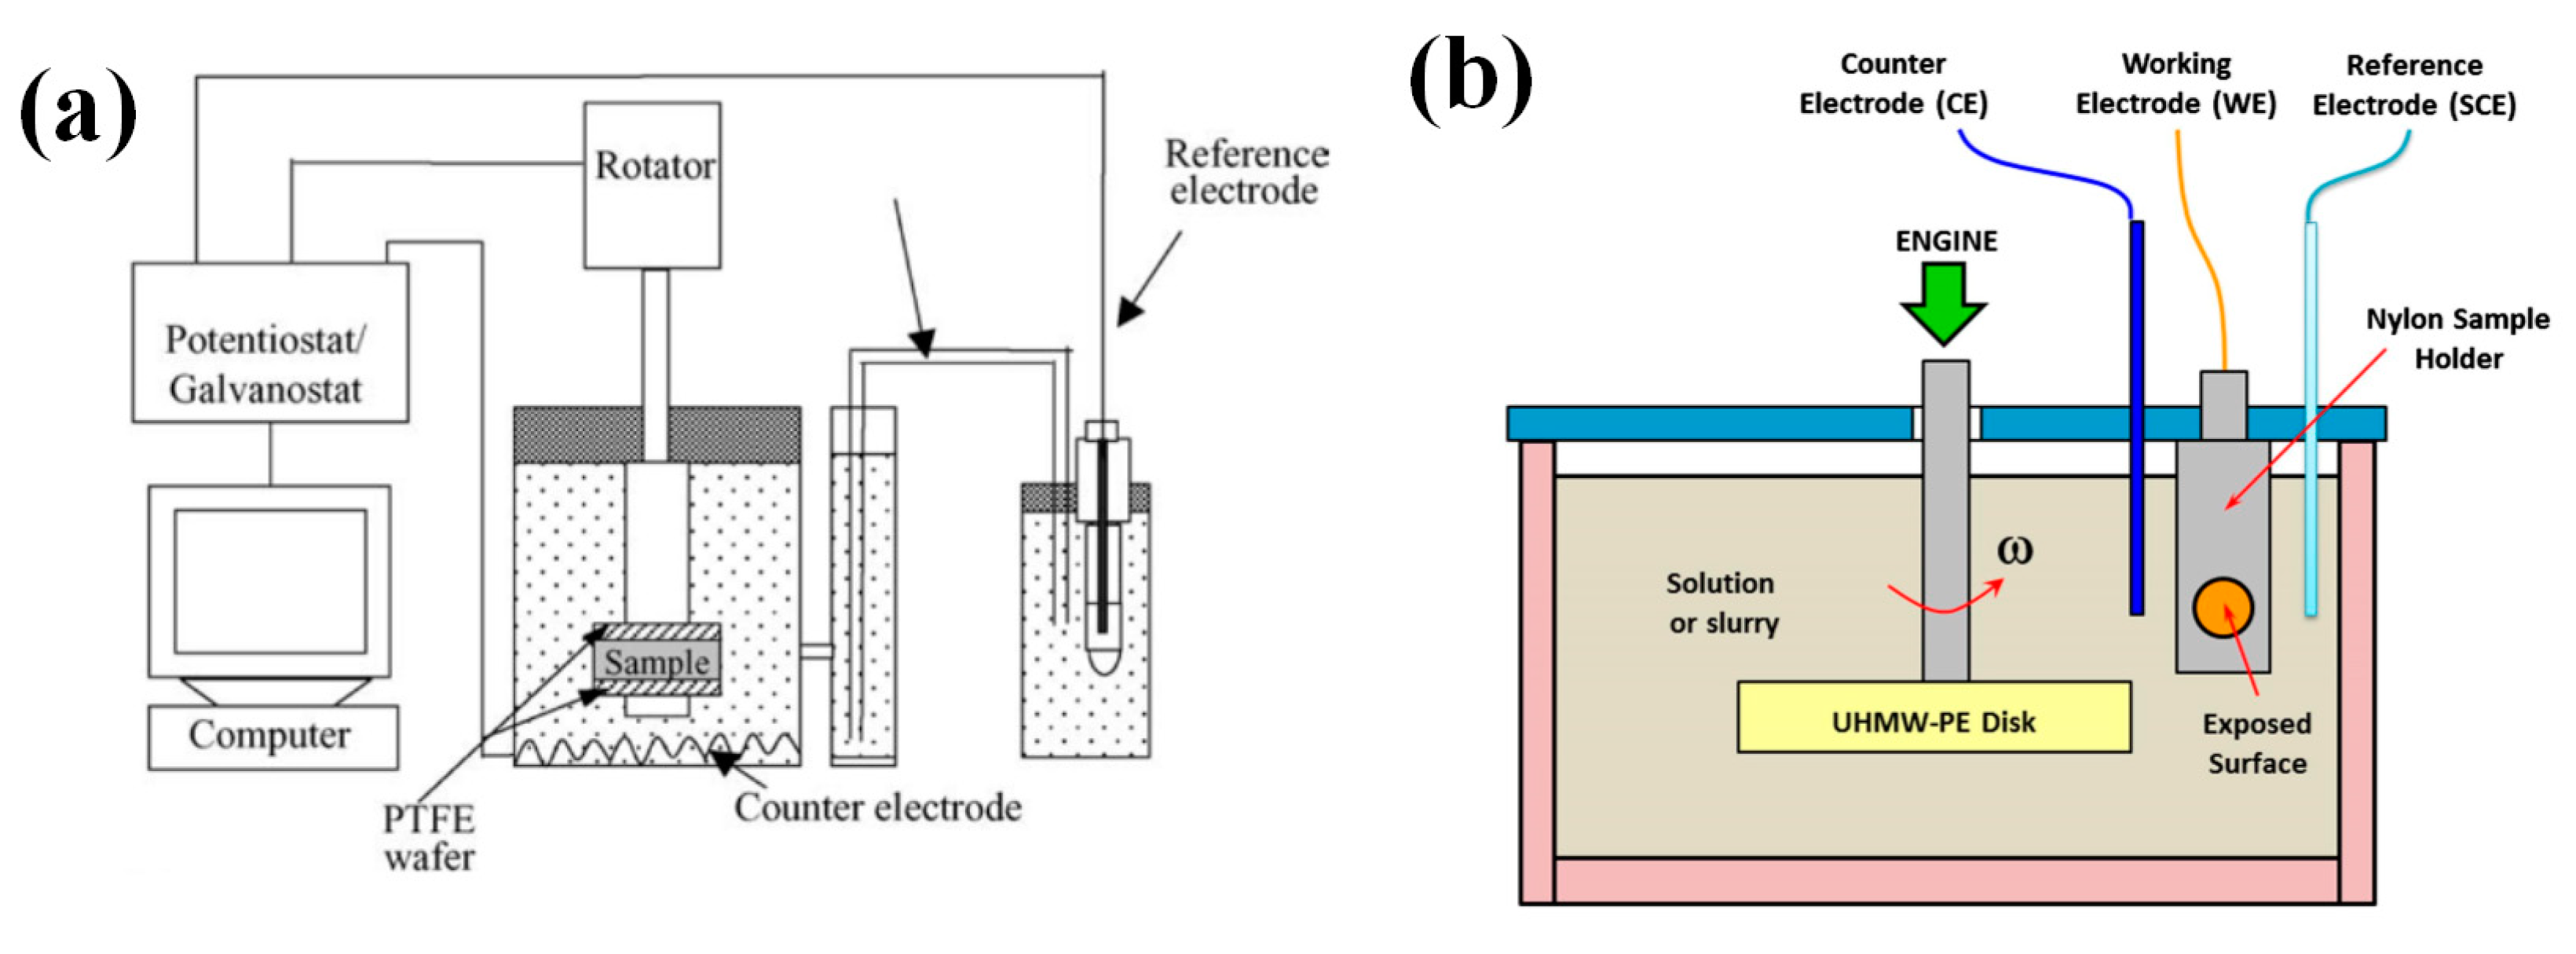
2.1. Rotating Disc/Cylinder Electrode System

The rotating disc/cylinder electrode system is widely used in the study of flow-accelerated corrosion (FAC) and erosion-corrosion since 1950 due to its relative low cost and convenient operation [44,45,46,47]. It is seen from Figure 2 that two forms of rotating disc/cylinder systems are adopted in erosion-corrosion studies [7,30,48,49,50,51,52,53,54,55,56]. Both test sets are composed of a three-electrode system and a rotation disc/cylinder to simulate a hydrodynamic condition. The difference is that, in the first set, as shown in Figure 2a, the test sample itself works as the rotating cylinder and the test specimen in the second set is arranged at the edge of the rotating disc. In the first set, the linear velocity on the sample surface can be simply controlled by the rotating speed. For the specimen in the second set, the flow rate of the slurry on the sample surface cannot be simply deemed as the linear velocity of the disc due to the edge effect. Therefore, a more uniform corrosion pattern would form on the steel sample immersed in the first set than that in the second set. However, the angle between the sample and the flow direction cannot be adjusted, which indicates that all the erosion metal loss in the first set is coming from the tangential direction at the beginning of the test (the flow field distribution would be complex once an erosion scar forms on the steel surface). In contrast, the angle between the specimen and the flow direction can be adjusted from 0° to 90° in the second set. Accordingly, the influences of the sand impact angle can be roughly studied using the second set.
The hydrodynamic parameters of the rotating cylinder system were well studied in previous work [44]. The Reynolds number (Re) and the wall shear stress (τRCE) can be calculated based on theoretical and empirical equations [44].
Re = ω r d υ ,
τ R C E = 0.079 R e 0.30 ρ ω 2 r 2 ,
where ω is the rotation speed, r is the radius of the rotating cylinder, d is the diameter of the cylinder, υ is kinematic viscosity of the electrolyte, and ρ is the density of the electrolyte. More details on the hydrodynamic parameters and mass transport coefficient of the rotating disc/cylinder system can be reviewed from Walsh’s work [45] which provides a summary of this technique used in various FAC and erosion-corrosion studies. The rotating disc/cylinder system can simulate an erosion-corrosion environment conveniently. However, there are some defects of the system which limit the further application of this system. The most serious issue of the rotating disc/cylinder electrode system is the control of the sand concentration when corrosive slurry is introduced into the test cell. Although the overall weight percentage or volume percentage of the sand particles is a certain value in the whole test cell, the real sand concentration at different liquid levels would be dramatically different due to the inhomogeneous sand distribution in the test cell [45]. As the samples are fixed at a certain height, the real sand concentration at the corresponding liquid level would keep changing with the variation of the rotation speed. The uncontrollable sand concentration limits accurately evaluating the influence of the sand concentration on the erosion-corrosion behavior. Meanwhile, the design of the rotating disc/cylinder makes it impossible to study the erosion-corrosion performance under a single-particle impact. The erosion-corrosion environment is refined as the pure electrolyte or slurry in the test cell. Moreover, as the rotating disc/cylinder test cell is a totally sealed system, the sand particles in the test cell cannot be replaced when the sharp edges of the sand particles are smoothed after long-term erosion. The modification of the sand shape might weaken the erosion-corrosion strength.

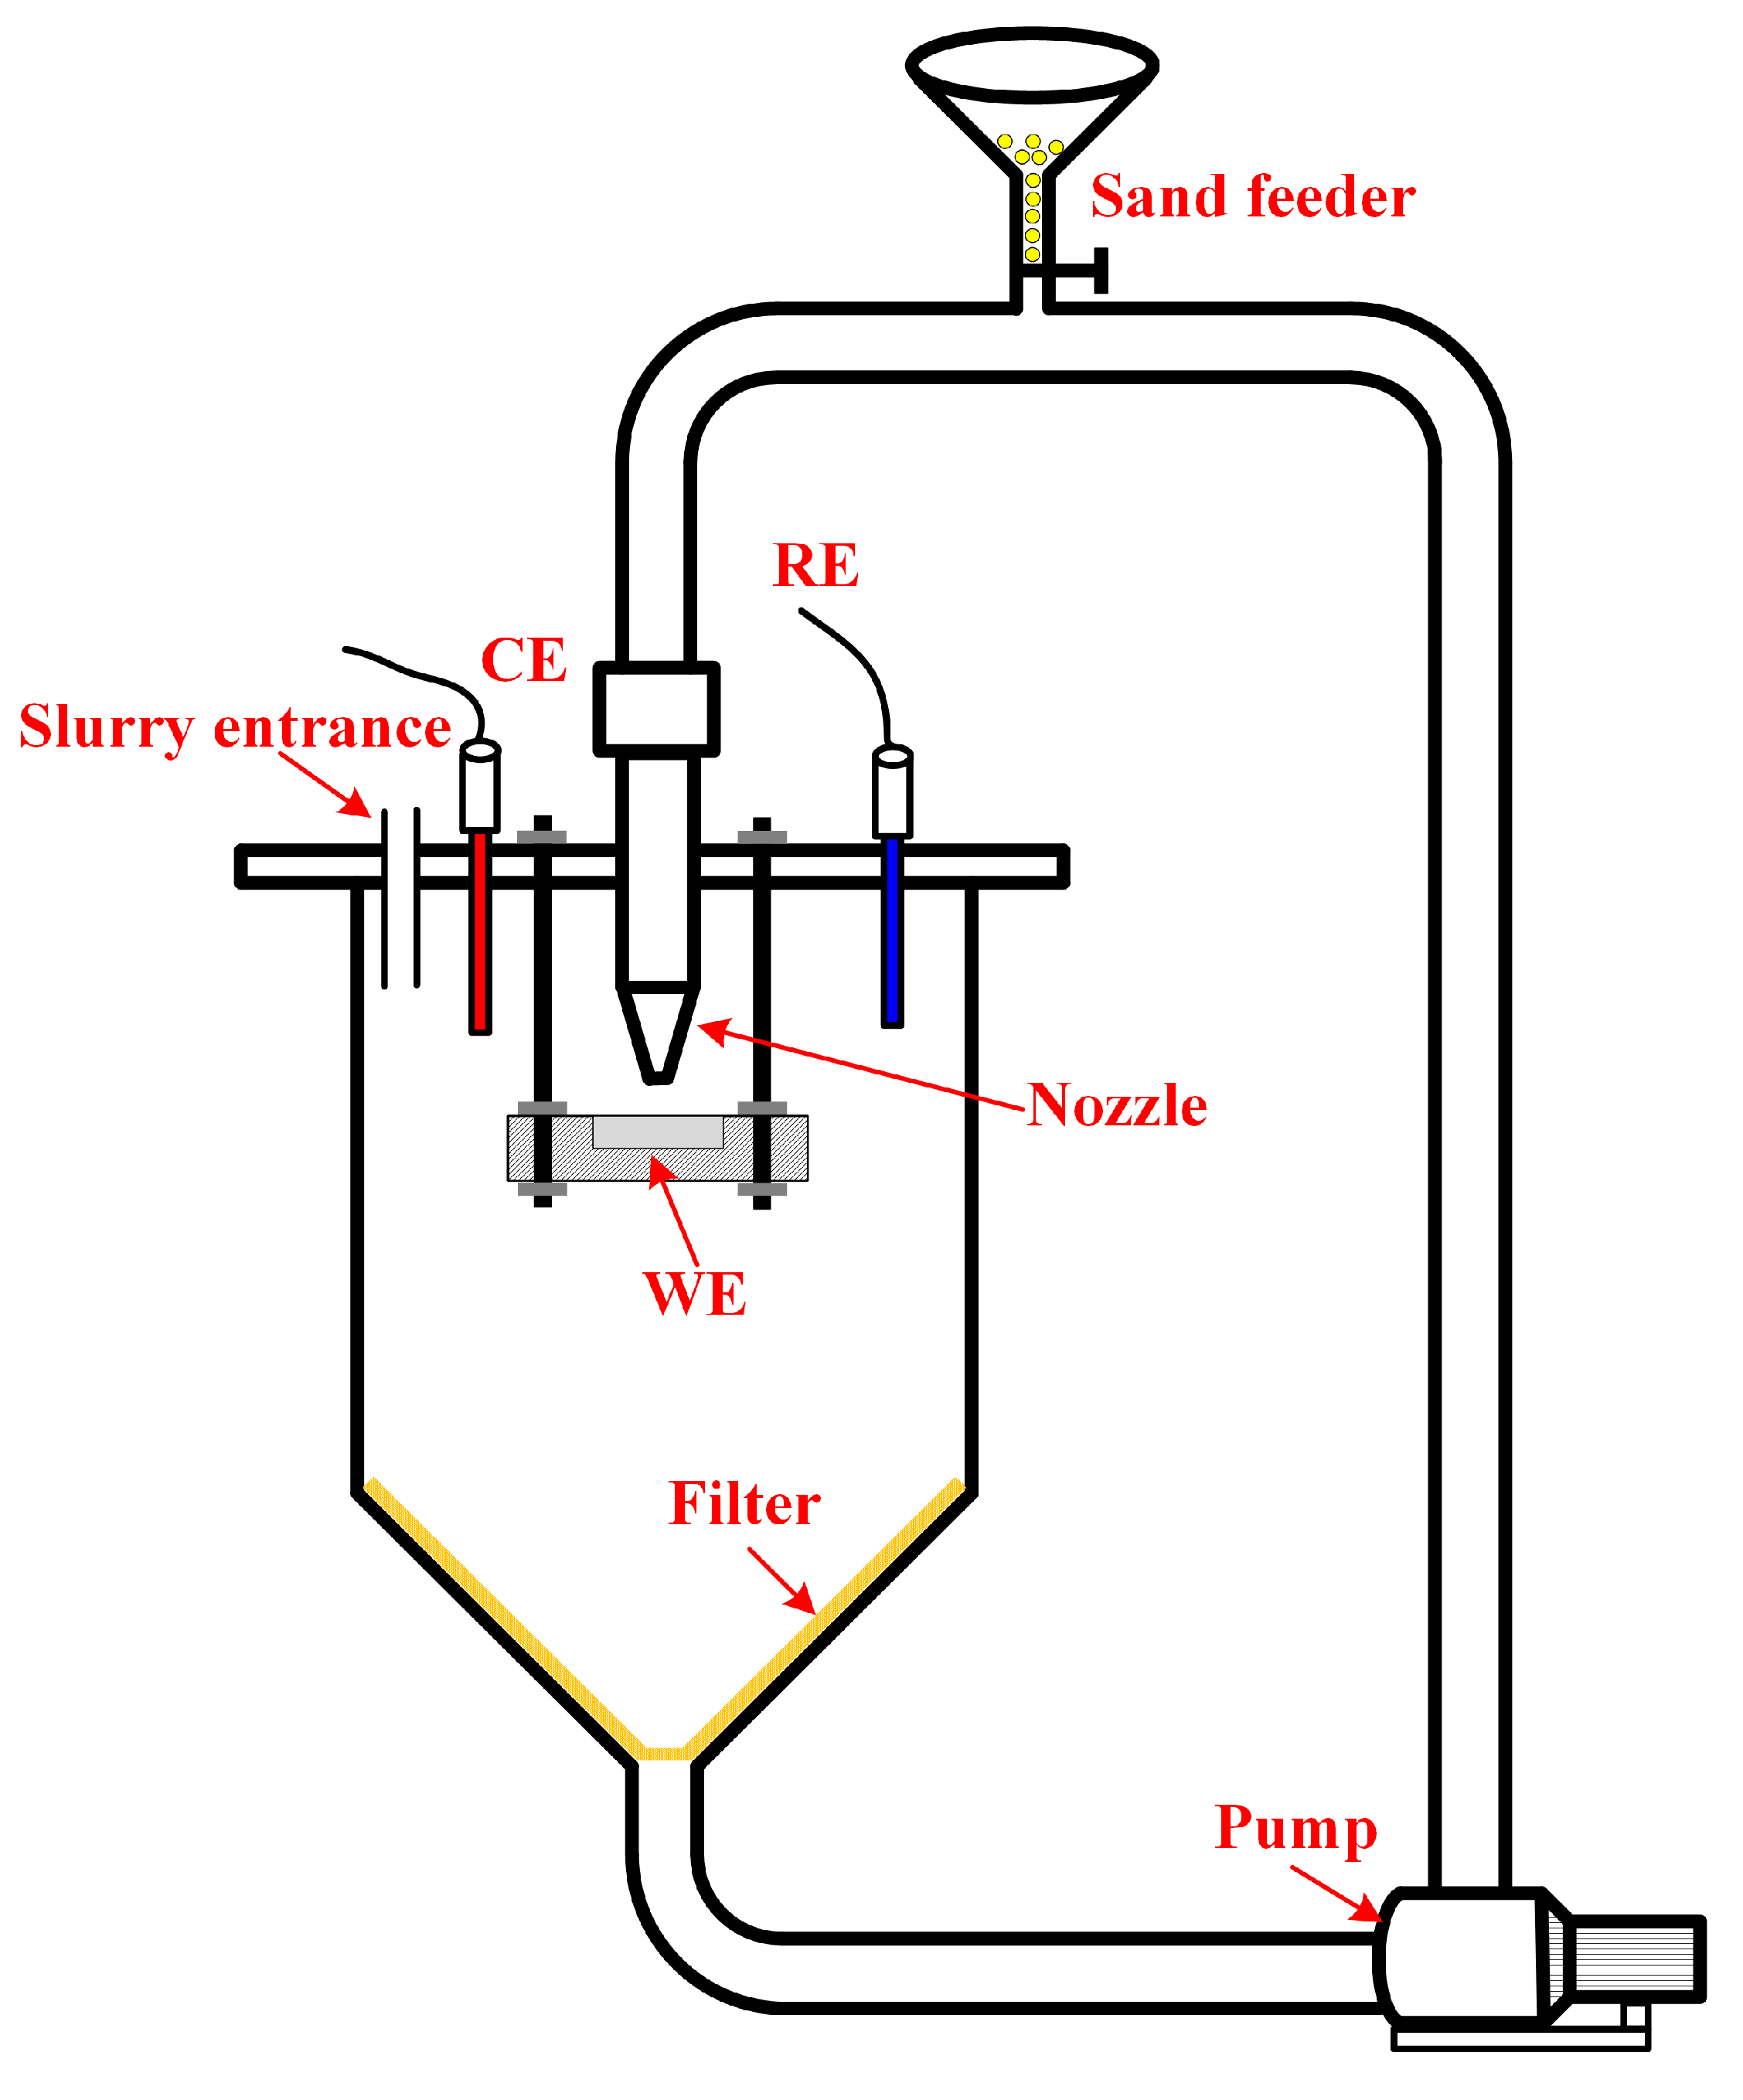
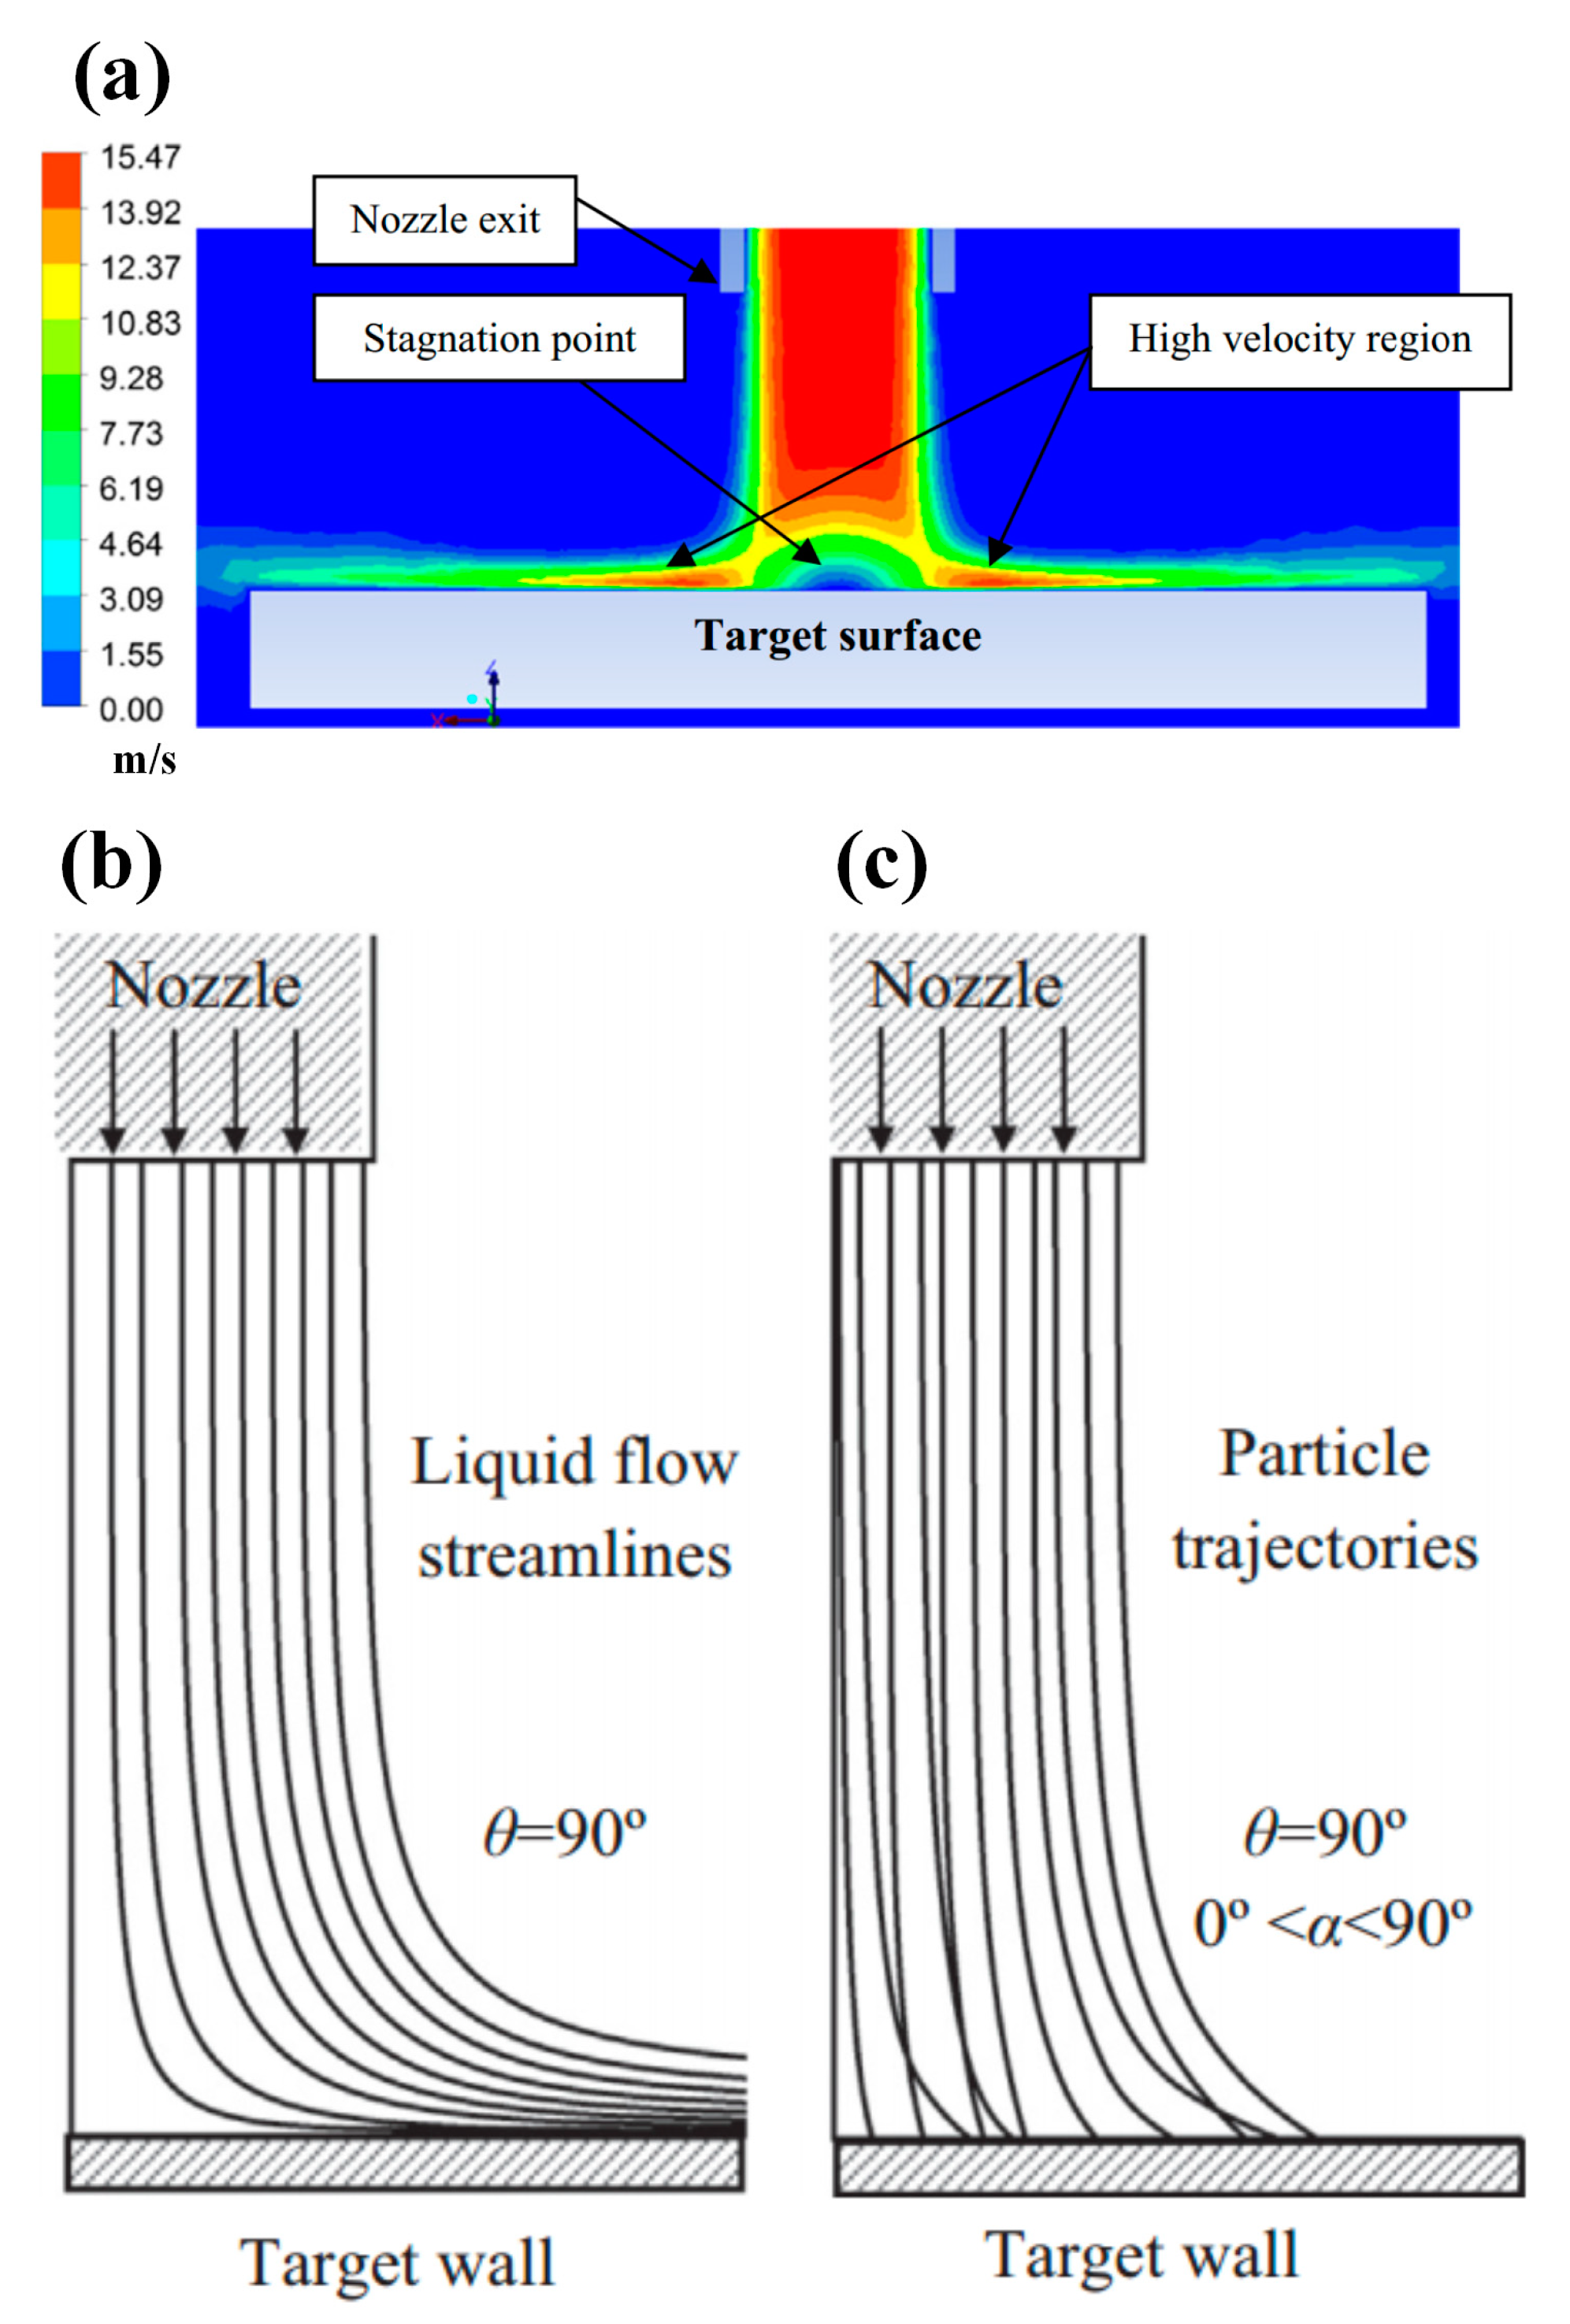
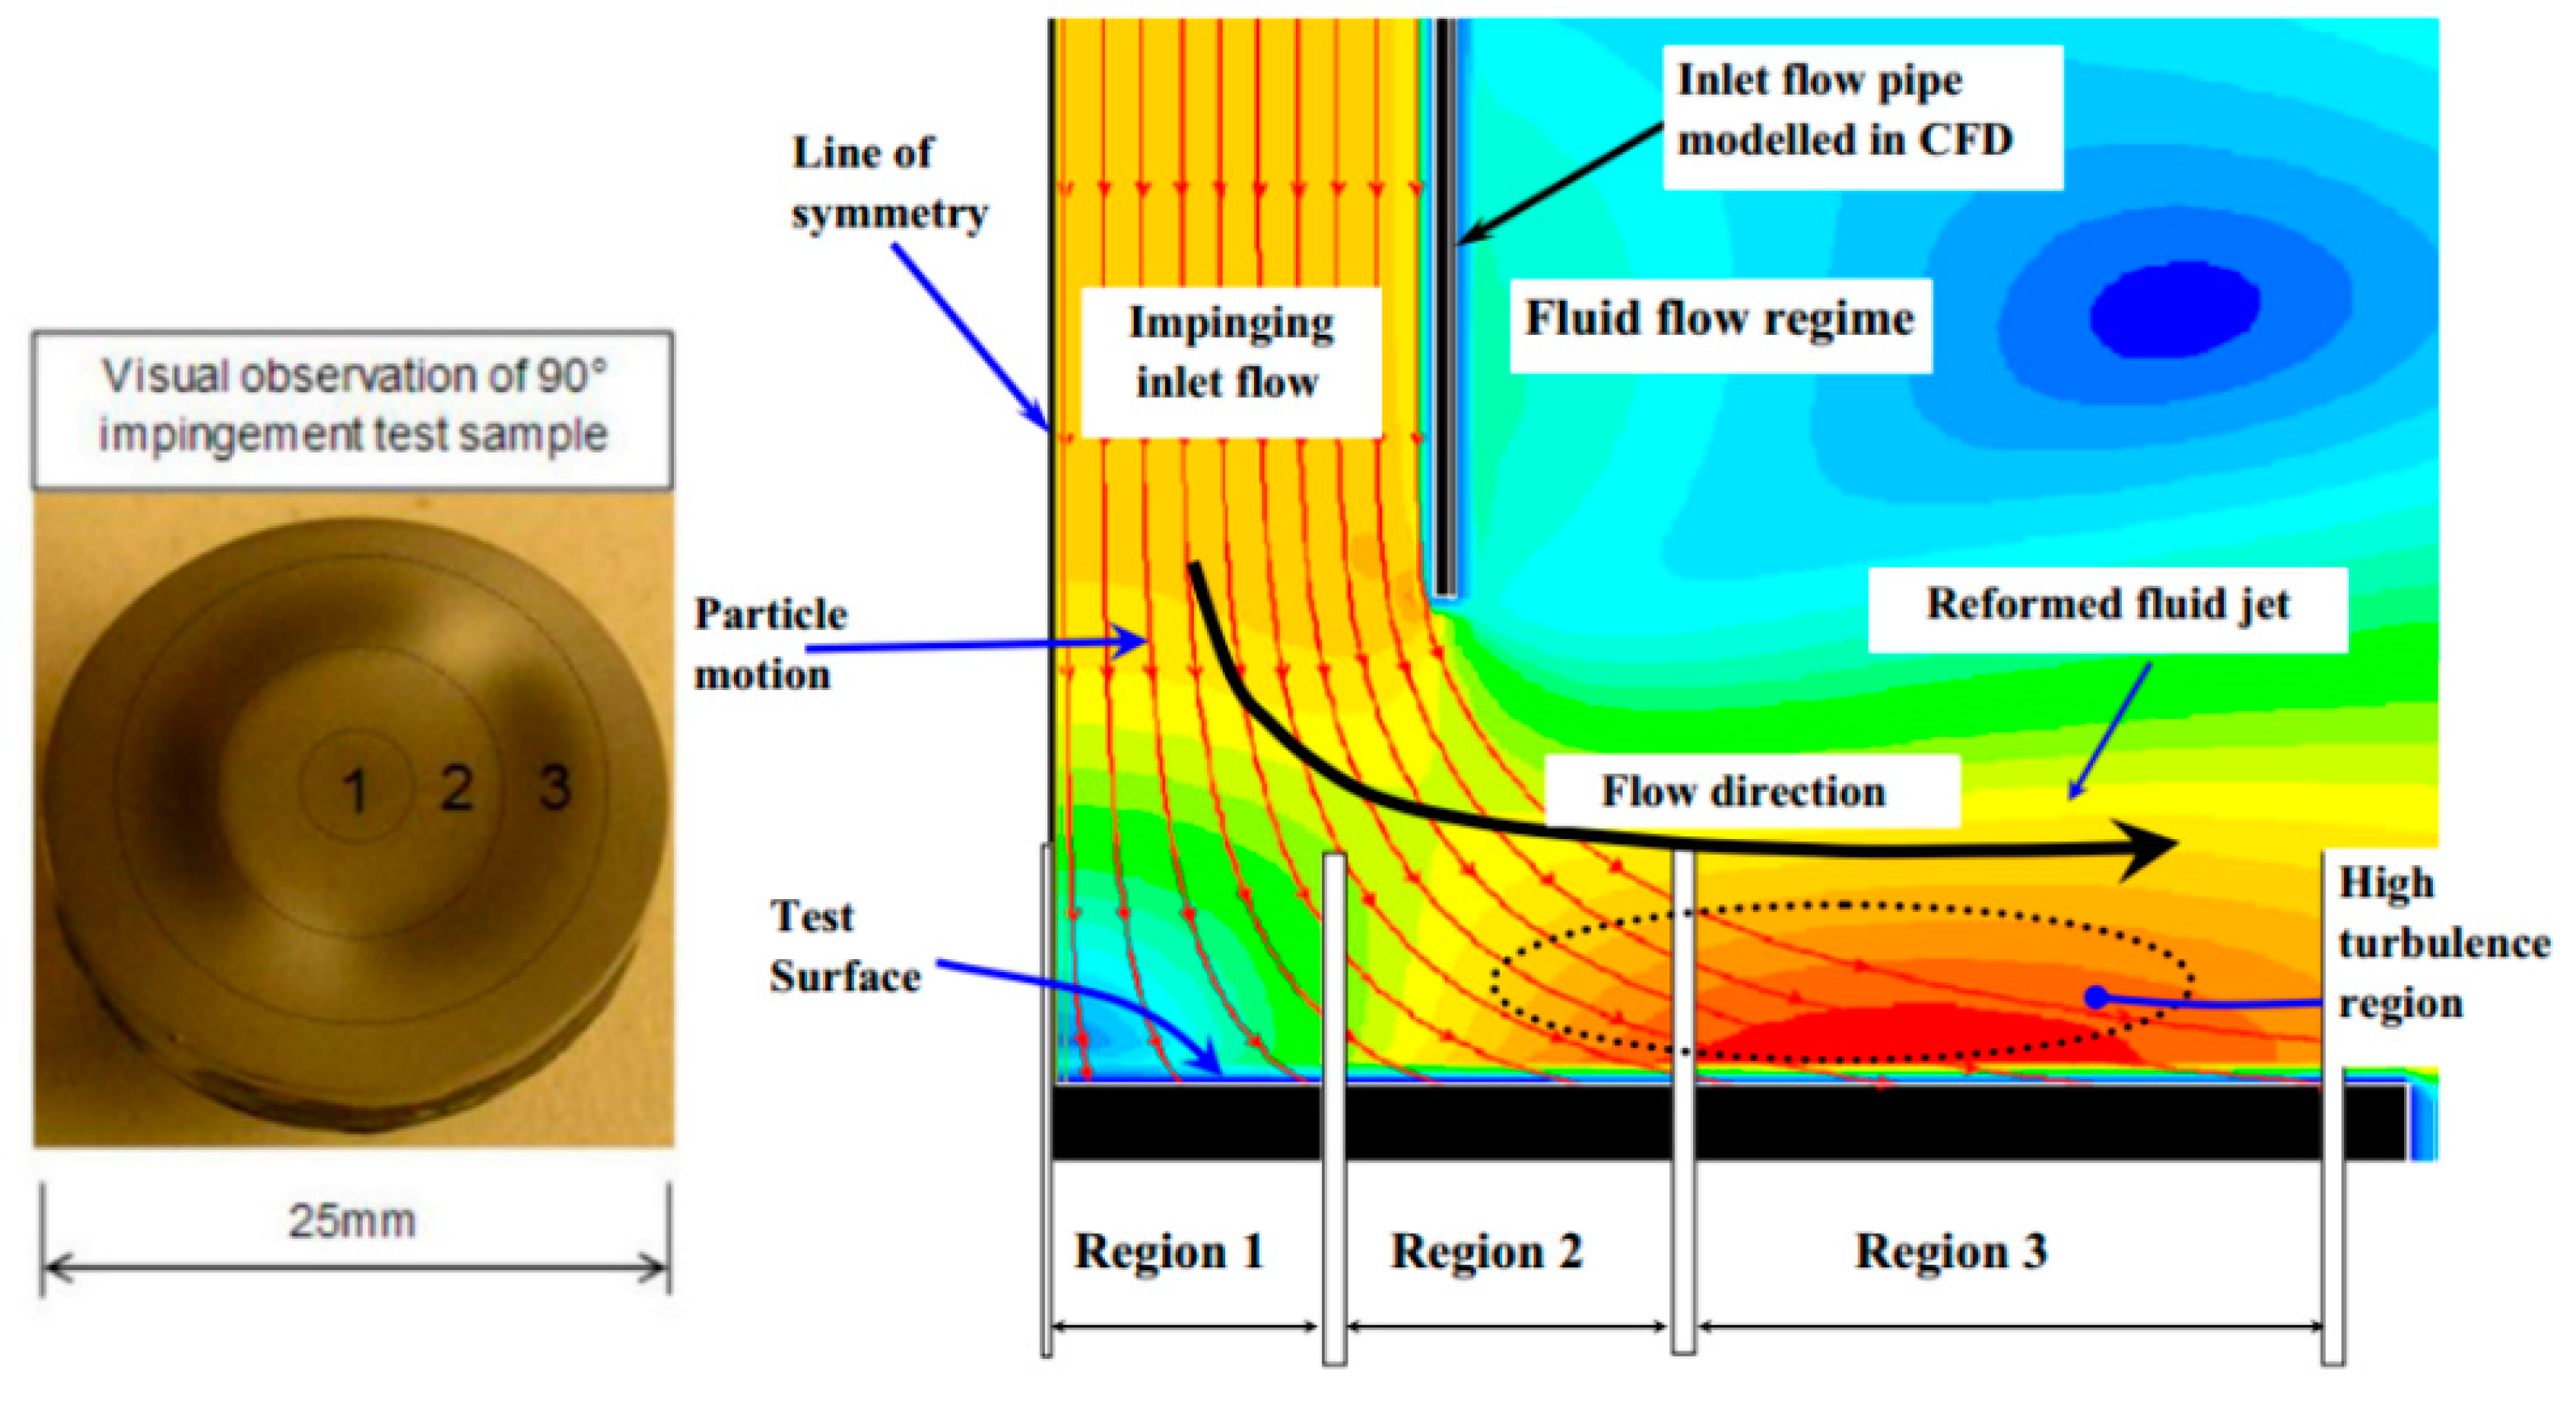
2.2. Slurry Jet Impingement Rig System
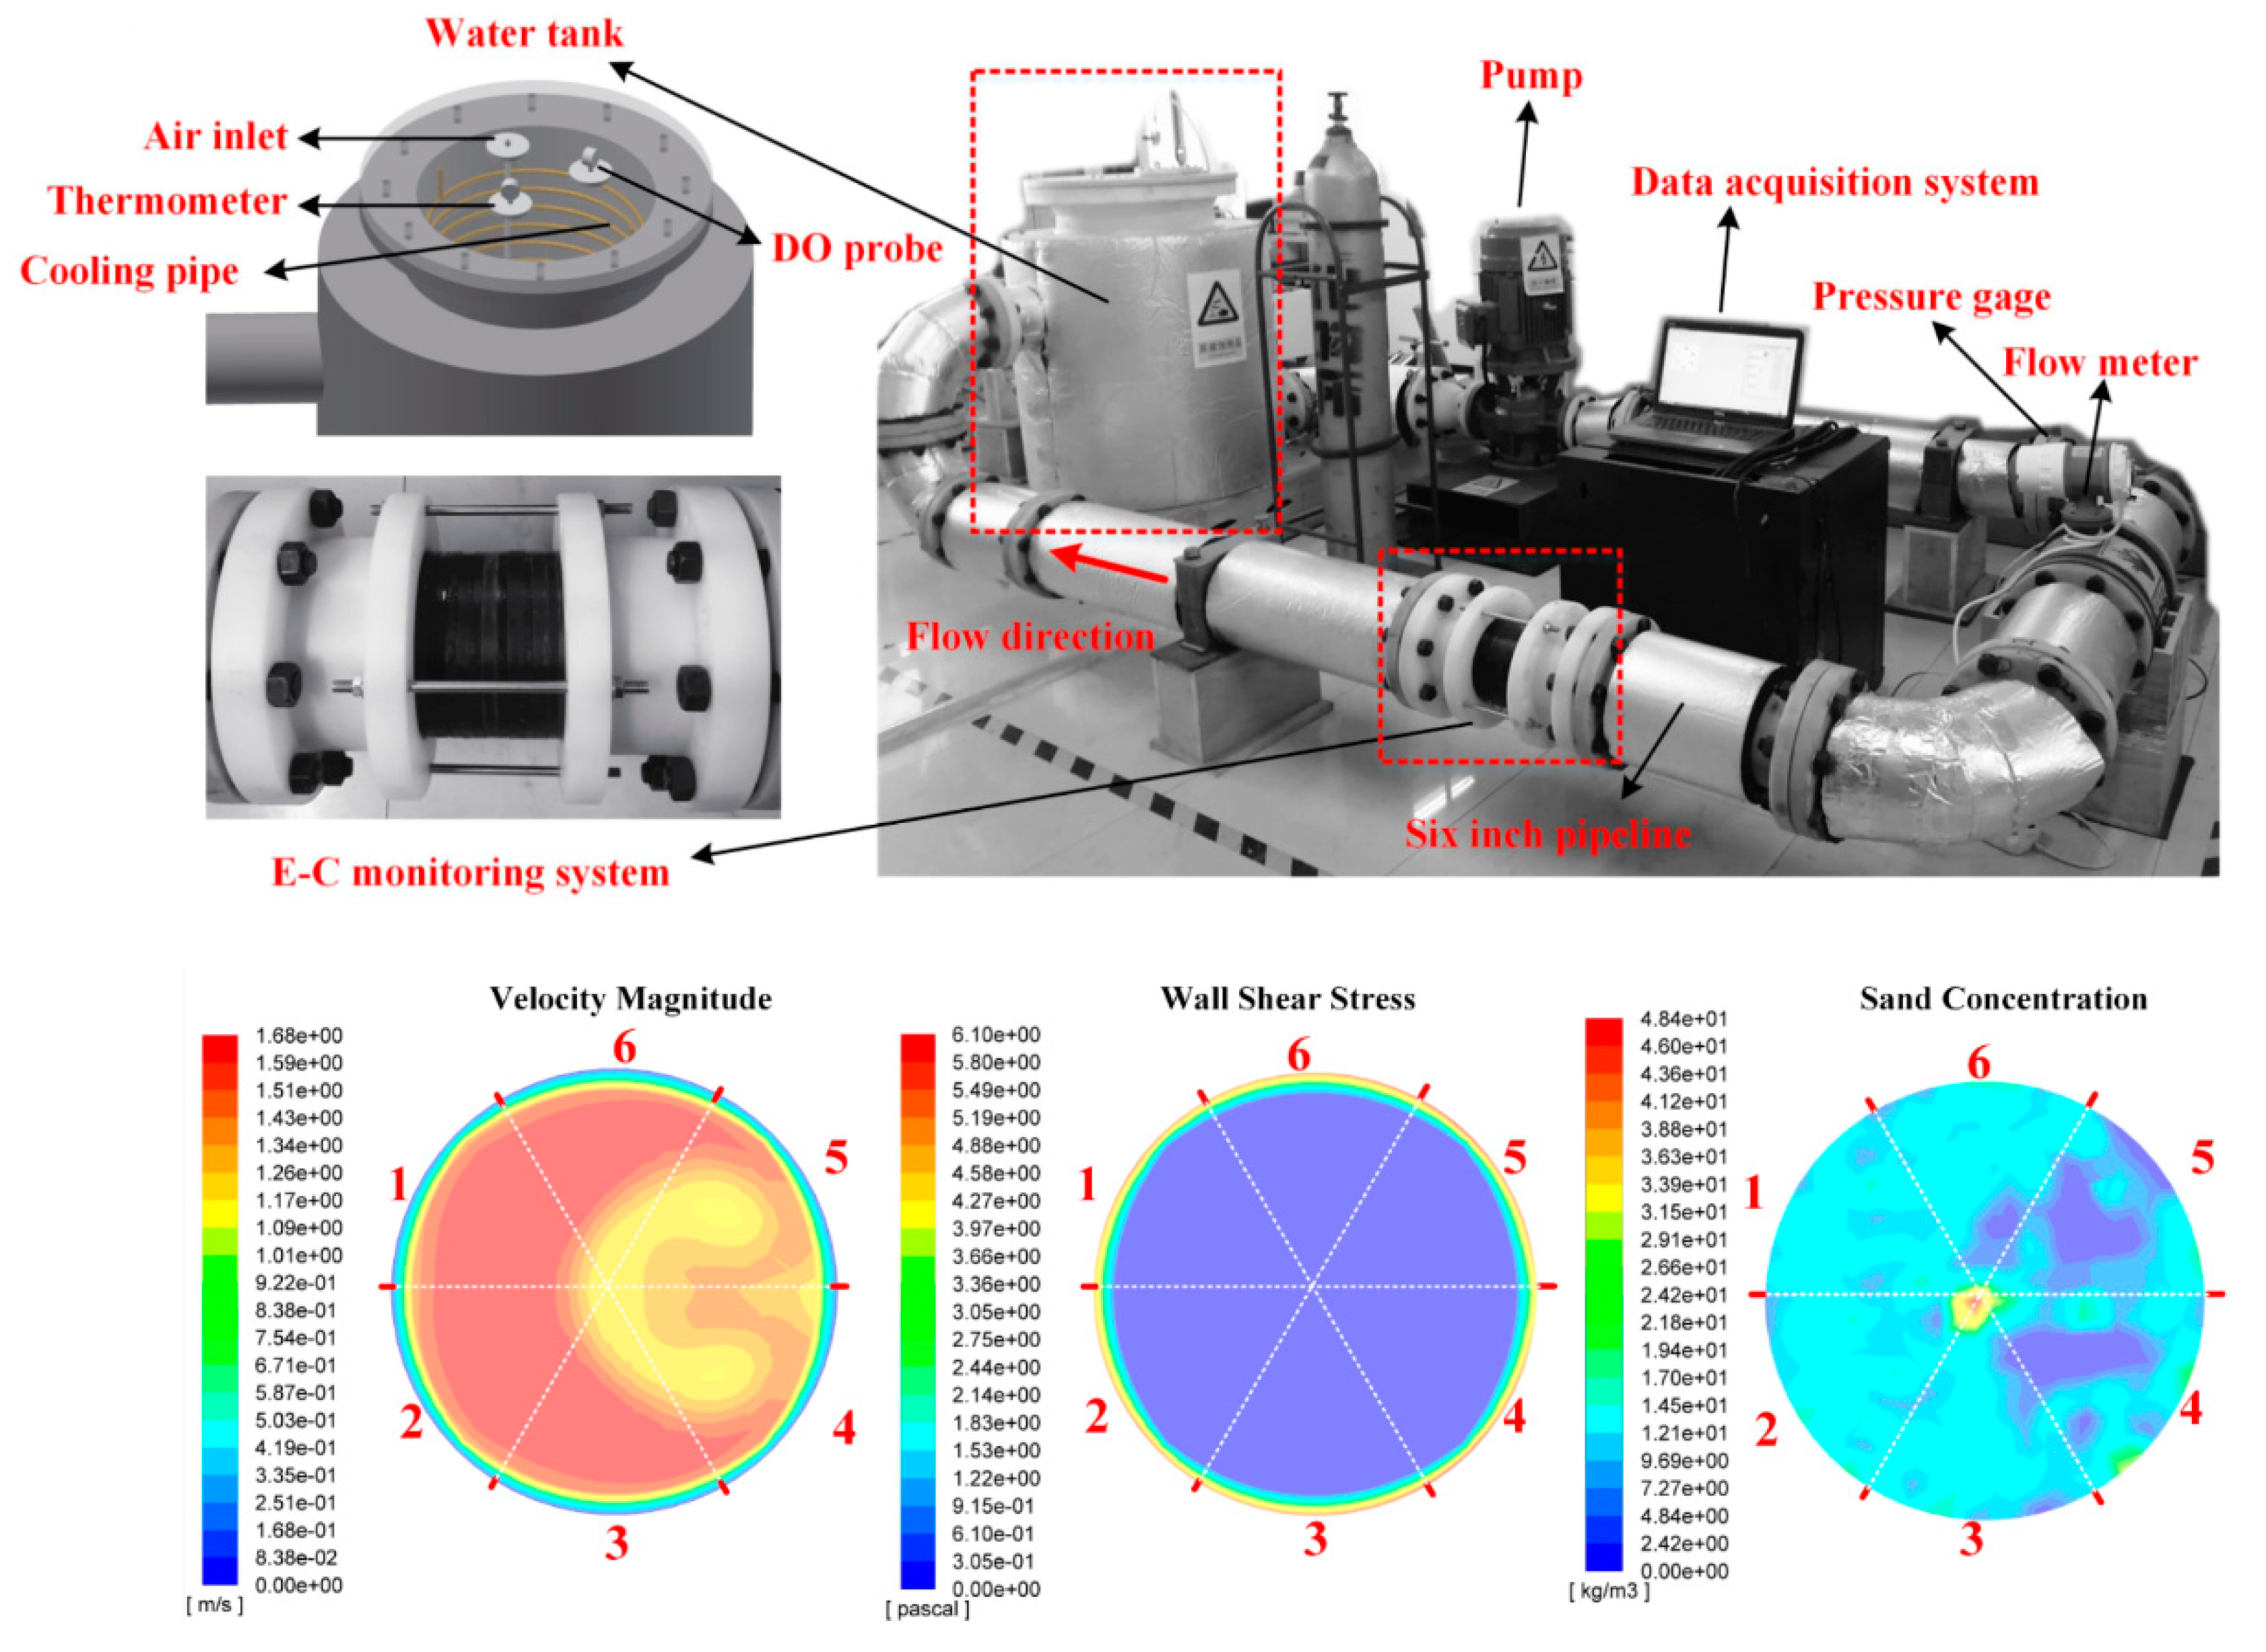
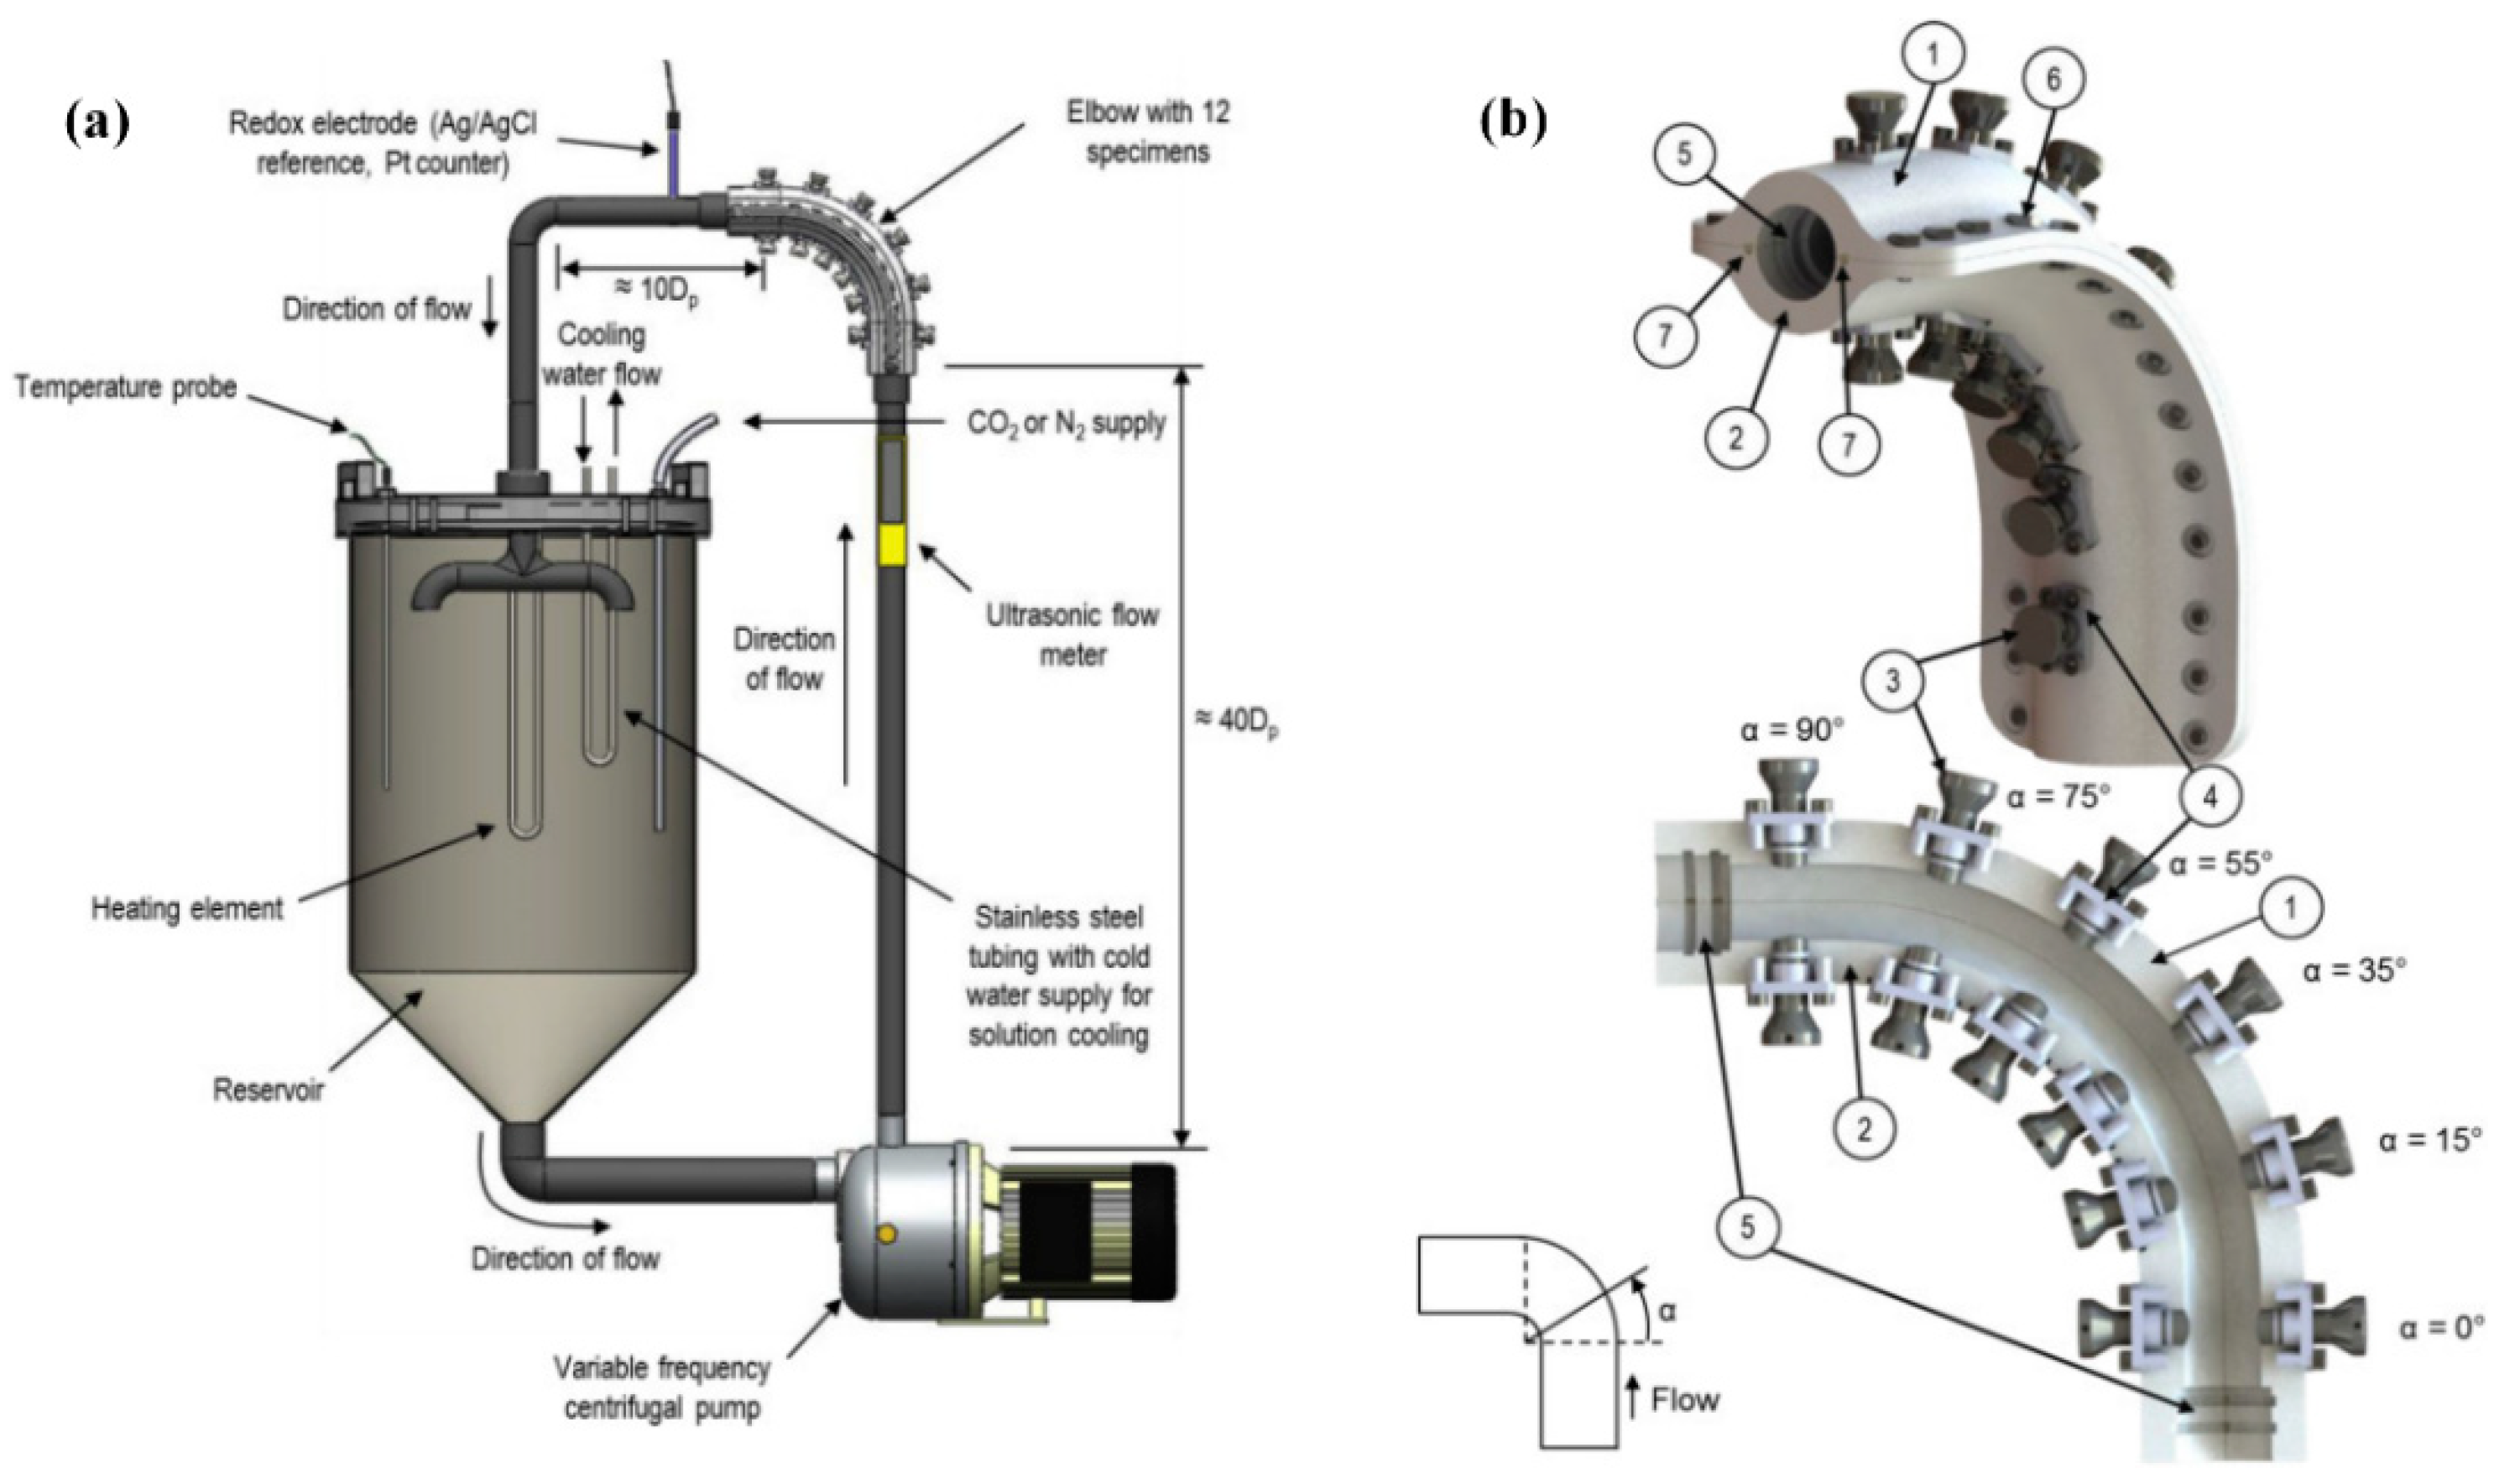
A jet rig system can be employed for both pure erosion under dry sand impingement using an air compressor [57,58,59] and erosion-corrosion under a slurry impingement using a fluid pump [13,60,61,62,63,64,65,66,67,68]. This section only focuses on the slurry jet impingement systems which are used in the study of erosion-corrosion. Figure 3 shows a schematic diagram of a typical slurry jet impingement rig system. The system is composed of a three-electrode system and a slurry loop driven by an electro fluid pump. In comparison to the rotating disc/cylinder electrode system, the structure of the slurry jet rig is more complex as a pump is needed for solution circulation. However, the slurry jet impingement rig can provide a more beneficial control of the impingement velocity and impact angle of the sand particles. The sand particles can be injected into the flow loop using a sand feeder which can ensure the impingement intensity of the sand particles. Moreover, the erosion-corrosion performance of the steel under the impingement of a single sand particle can be studied as well [69].
It is seen from Figure 3 that the sample is always placed a few millimeters beneath the jet rig to maintain a stable impact velocity. The impact angle can be well adjusted from normal to oblique through rotation the sample holder. It should be noted that the flow field distribution below the jet rig is inhomogeneous [59], suggesting that the wall shear stress, impingement angle, impact velocity, and particle trajectories at local surface areas are significantly different. A typical flow velocity distribution beneath a slurry jet rig obtained from a computational fluid dynamics (CFD) simulation is presented in Figure 4a [59]. It is seen that a stagnation area appears at the center of the target surface, indicating that the flow velocity is close to zero in this area. The region suffering high sand impact velocity distributes at the vicinity area of the stagnation point which can lead to a high erosion rate. The fluid streamline and sand particle trajectories are presented in Figure 4b,c, respectively [59]. It is seen that the impact angles of the sand particles are influenced by the fluid stream. The center of the sample would suffer a normal impact. The normal impact gradually transforms to oblique impact along with the increasing distance from the center of the sample. Consequently, when studying the general performance of the erosion-corrosion under different sand impact angles, it is better to machine the sample smaller than the area of the nozzle to maintain a small deviation of the impact angle on the target surface. However, a sample with a larger diameter of the nozzle can be used to study the local erosion-corrosion behavior at different fluid flow regimes as shown in Figure 5 [61]. Likewise, a series of small samples can be placed at different regions below the slurry jet rig to study the influence of the hydrodynamic parameters on the erosion-corrosion [62,70].

2.3. Test Flow Loop

On the basis of the rotating disc/cylinder electrode and slurry jet impingement rig systems, the erosion-corrosion behaviors of the samples under different flow velocities and impact angles can be simulated in the lab. However, the erosion-corrosion behaviors of complex pipe sections such as the elbow and pipe weldment, and the pipe sections having a diameter change cannot be simulated using rotating disc/cylinder and slurry jet rig. As a result, test flow loops which allow the installation of different kinds of sensors are always adopted to study the erosion-corrosion behaviors of some typical pipe sections [6,14,71,72,73,74,75,76]. The test flow loop can provide a more realistic erosion-corrosion condition which directly corresponds to practice energy pipelines. Nevertheless, the wear of the pump in the flow loop would lead to a high cost for periodical restoration or replacement. Figure 6 shows a typical test flow loop which was used for the study of the inhomogeneous erosion-corrosion behavior around the pipe circle using a designed sensor system [76]. The flow loop is composed of a water tank, a centrifugal pump which is normally used to allow the sand particle passing through, a pressure gauge, and a flow meter. According to the measured hydrodynamic parameters, the distributions of the flow velocity, wall shear stress, and sand concentration at a certain pipe section (Figure 6) can be well predicted from the CFD simulation [76]. The CFD simulation results can facilitate understanding the non-uniform erosion-corrosion behavior. Figure 7a presents a typical flow loop used for the study of the non-uniform erosion-corrosion behavior of an elbow [75]. It is seen from Figure 7b that multi sensors are arranged at different areas of the elbow to provide the localized erosion-corrosion information. Consequently, using test flow loops can effectively cover the shortage of the rotating disc/cylinder and slurry jet rig systems on simulating the erosion-corrosion performances of large-scale pipe sections.

3. The Main Measuring Techniques for Erosion-Corrosion

3.1. Non-Electrochemical Measurement Techniques

Erosion-corrosion is a dynamic progression which is determined by the variation of the surface property, flow velocity, impact angle, fluid temperature, and sand concentration [24]. The erosion-corrosion rate can be very high, and it can vary significantly with time. Therefore, the erosion-corrosion rate needs to be on-line monitored in order to detect the potential risks associated with peak corrosion rate and localized erosion-corrosion. The instantaneous corrosion current can be obtained using electrochemical methods such as linear polarization resistance (LPR) [77] and electrochemical impedance spectroscopy (EIS) [6,78]. Although electrochemical techniques can gain the corrosion current easily and rapidly, they are not suitable for erosion-corrosion monitoring in the field, especially for energy pipelines, due to the inability to directly measure the non-Faradaic part of the metal loss [9,37]. Therefore, electrical resistance (ER) probes as shown in Figure 8 are used to monitor the total metal loss caused by erosion-corrosion in most industrial applications [76,77,79,80,81,82,83,84,85].
Figure 8a shows a typical erosion-corrosion ER probe with its sensing part in a rectangular form. The measurement schematic diagram of the probe is shown in Figure 8b. The probe is composed of a sensing element which directly exposes to the erosion-corrosion environment and a temperature compensation element which is sealed inside of the probe to prevent any metal loss. The resistance of each element can be measured using the four-wire method [86] and the total corrosion depth x of the sensing part can be expressed as follows:
x = d ( 1 R r e f / R s e n R r e f 0 / R s e n 0 ) ,
where d is the thickness of the sensing element, Rref/Rsen is the monitored resistance ratio between the reference element and sensing element, and Rref0/Rsen0 is the initial resistance ratio when no corrosion or erosion happens. The ER method is widely used to study the erosion-corrosion performances in energy pipelines due to its simple operation. The ER probes can be fixed at different directions to ensure the sufficient impingement of sand particles on the sensing element [79,80,84]. Figure 9 shows the arrangement of the ER probes at different locations of the pipeline in a previous test [80]. It is seen that a flush head probe is used for the elbow and an oblique probe is adopted in the horizontal flow line.
It is reported in previous studies that the distributions of the flow filed and the sand concentration are not uniform in pipelines [6]. Different measurement results would be obtained when the erosion-corrosion probes are fixed at various pipe locations. Therefore, some modified ER sensors are developed to monitor the non-uniform corrosion in pipelines. Figure 10 shows two kinds of modified ER sensors which are defined as the field signature method (FSM) [81] and ring pair electrical resistance sensor (RPERS) [82], respectively. The basic principle of these sensors involves dividing the pipe into small sections, and the resistance of each section is on-line monitored. The localized erosion-corrosion rate of each segment can be reflected from the localized erosion-corrosion depth.
The advantage of an ER probe is that it provides the cumulative metal loss without needing to remove the samples from the service environment. In addition, ER probes are applicable to both conductive and non-conductive erosive and corrosive environments, which suggests both pure erosion and erosion-corrosion can be well probed by the ER technique [83,86]. The major disadvantage of the ER technique is that it cannot respond rapidly to a change of the erosion-corrosion depth loss. The measurement sensitivity heavily relies on the thickness of the sensing element. Decreasing the element thickness can improve the measurement sensitivity; however, it would shorten the service life of the ER sensor. Some researchers tried to prolong the service life of ER erosion probes by using high-corrosion-resistance materials for probe fabrication [76,79]. Nonetheless, the synergy of erosion and corrosion could not be identified since the corrosion component is eliminated in this case. For the mild steel under active corrosion, the corrosion-enhanced erosion sometimes occupies a large proportion of the total metal loss [10,87]. This suggests that high-corrosion-resistance ER probes are not suitable for the erosion-corrosion monitoring of mild steels.
Acoustic emission sensors are always used in combination with ER probes to build the relationship between the total metal loss rate and sand impingements [65,75,80,88,89]. It is seen from Figure 9 that an acoustic sensor was applied at the downstream of the elbow in previous study [80] to provide the sand impact rate. As the impact of the sand particles on the steel surface would cause a response signal in the metal, the sand rate can be monitored through the extraction of the signals in a certain range. Through analyzing the generation of acoustic emission, the erosion rate can be basically evaluated [65,89]. Nevertheless, the acoustic signal is sensitive to the background noise, and the erosion rate calculated from the acoustic emission heavily relies on the property of the material [65]. Therefore, acoustic sensors are normally implemented as an additional method [75,80] in combination with ER probes in the measurement of erosion-corrosion.

3.2. Electrochemical Techniques in Conjunction with Gravimetric Measurement

The total metal loss caused by erosion-corrosion mostly concerns the industry; therefore, ER methods are considered to be an effective technique for erosion-corrosion monitoring. However, ER sensors are unable to provide individual erosion metal loss and corrosion metal loss. The erosion-enhanced corrosion and corrosion-enhanced erosion are impossible to be understood only based on ER measurement. The main contributor to erosion-corrosion damage would be unclear without figuring out the interaction and synergy between erosion and corrosion. Consequently, the combination of electrochemical methods and gravimetric measurements is now the common method for the coupled effect study of erosion-corrosion in labs [16,17,24,25,29,30,68,75].
To figure out the synergy between erosion and corrosion, the components presented in Equation (1) should be all obtained from the erosion-corrosion test. Since the total metal loss is caused by both electrochemical corrosion and mechanical erosion, gravimetric measurements can be performed to calculate the overall weight loss (Wt). As the corrosion process is an electrochemical reaction, the corrosion metal loss (Wc) can be probed using traditional electrochemical methods such as LPR, EIS, polarization curve measurement and anodic constant current/potentiostatic polarization. It should be noted that LPR, EIS and polarization curve measurements are normally used for the measurement of the corrosion rate under open circuit potential (OCP). Since the potential disturbances of LPR and EIS are less than ± 20 mV, the influence of the applied potential on the steel interface can be neglected. This indicates that the gravimetric method can be conducted on the same test sample after LPR and EIS measurement. The linear polarization resistance (Rp) and charge transfer resistance (Rt) can be fitted from the LPR and EIS measurements, respectively. Thereafter, the corrosion current density (icorr) can be calculated using the Stern-Geary equation [90].
i c o r r = B R p ,
where B is the Stern-Geary coefficient. In contrast, the gravimetric measurement is not suitable for the steel sample after anodic polarization curve measurement since a large anodic polarization current would lead to a serious anodic dissolution on the steel interface. Anodic constant current polarization is normally used to study the erosion-corrosion behavior of the steel under controlled anodic dissolution rates [9,37,91,92]. The corrosion metal loss can be calculated from the integrated anodic charge, and the total metal loss can be measured from the weight loss of the same test sample.
Anodic potentiostatic polarization is normally used to study the erosion-corrosion behavior of passive steels [15,38,42,70,93,94,95,96,97,98,99,100]. The corrosion metal loss of the passive steel is always induced by the sand impingements, leading to local breakdown of the passive film. It suggests that LPR, EIS, and polarization curve measurements are not suitable to evaluate the metal loss rate induced by localized corrosion. Therefore, the current transition under a constant anodic potential can be employed to calculate the corrosion metal loss. Figure 11 shows typical anodic current transitions of passivated steel after sand impingements. With the local breakdown of the passive film, the current would have a significant increase due to the exposure of the fresh steel interface to the electrolyte. The anodic current would soon decay with the restoration of the passive film. The corrosion metal loss can be calculated from the accumulated anodic current charge (the shaded areas shown in Figure 11). After the Wt and Wc are measured, the erosion metal loss (We) can be further calculated from the difference between Wt and Wc.
The synergy of erosion and corrosion can be further studied if pure erosion rate (We0) and pure corrosion rate (Wc0) are measured. For the measurement of Wc0, the common method is to eliminate the sand particles from the slurry [6,19]. Then, the pure corrosion rate can be measured by electrochemical methods. For the measurement of We0, the most common method is to apply cathodic protection on the steel surface in the corrosive slurry. Another method for We0 measurement is to inhibit corrosion in the slurry by eliminating the corrosive medium or adding an inhibitor [19,71]. The pure erosion rate can be calculated from the weight loss. Thereafter, according to Equation (1), the contributions of both W c e and W e c for total steel loss can be quantified. However, serious measurement errors and data scatters were still found in previous tests [19]. The measurement accuracy of the four parts can be influenced by various factors during the electrochemical test. The main influence factors are concluded as follows:
1. The metal loss obtained from the gravimetric measurement is the accumulated material loss through the whole test period. Since it was found in the previous studies that the erosion-corrosion process is continuously changing with the modification of the surface status [73], the average erosion-corrosion rate might not be a stable value in the whole test duration, especially for localized corrosion cases. Therefore, using the erosion-corrosion rate calculated from the accumulated metal loss may lead to a wrong judgment of the dynamic erosion-corrosion process.
2. As the electrochemical corrosion is a Faraday process, the corrosion rate in both corrosion and erosion-corrosion conditions can be on-line monitored using electrochemical methods. This can guarantee the measurement accuracy of the corrosion rate in a large extent. However, there are still some issues which may cause the measurement error occurring. In some cases, the impingements of the sand particles on the metal surface are not uniform, resulting in a significant macro-cell current on the steel surface which might influence the corrosion rate measurement [53]. On the other hand, when using the Stern-Geary equation to calculate the corrosion metal loss, B (Stern-Geary coefficient) is always selected as 26 mV for active steel dissolution and 52 mV for the steel under a passive state. As the value of B is not constant with the propagation of erosion-corrosion, the fixed B value might induce a measurement error of the corrosion rate [101].
During the measurement of pure corrosion rate, it is thought that erosion can be neglected without the appearance of sand particles in the corrosive solution. Nevertheless, it was reported in Reference [9] that the non-Faradaic process still exists in the electrolyte without sand particles when the flow rate is sufficient high. This means that the corrosion rate measured in the corrosive electrolyte free of sand particles may be enhanced by the non-Faradaic process as well, which may result in the overestimation of the pure corrosion rate.
3. Similar to the measurement of the total metal loss, gravimetric measurement is the most effective way to obtain the pure erosion rate because of the non-Faradaic process. However, the evaluation of the pure erosion rate is more challenging in comparison to the measurement of the total metal loss because the corrosion part should be totally removed in the pure erosion test. Firstly, the continuous introduction of noble gas in the solution to eliminate the corrosive agents can influence the flow distribution in the test cell. Secondly, when using cathodic protection to remove the corrosion part in sea water or tap water, the deposition of calcareous deposits [102] might mitigate the erosion metal loss. Finally, when using inhibitors, the thin organic protective film may be partially or totally eroded away in an uncontrollable way [48]. Therefore, the pure erosion rate is the hardest part to be accurately assessed.
4. In addition, the experimental duration for the erosion-corrosion test is always limited to 24 h to avoid smoothening of the sand particles. As the erosion-corrosion process is a long-term action in real industry applications, the test result in a short period is different from the realistic situation. The empirical and theoretical models are almost established in considering that the general erosion-corrosion process reaches a stable state. However, in most practice cases, the erosion-corrosion performance keeps changing and the highest penetration rate would concentrate at a local area, especially for stainless steel. Nevertheless, only few studies focused on the propagation process of the localized corrosion caused by the erosion-corrosion [53,73]. With the forming of local anodes and cathodes on the steel surface, erosion-corrosion prefers to propagate on a certain area rather than the overall steel surface. In this case, the localized corrosion rate cannot be directly evaluated according to the calculation of the average anodic current.

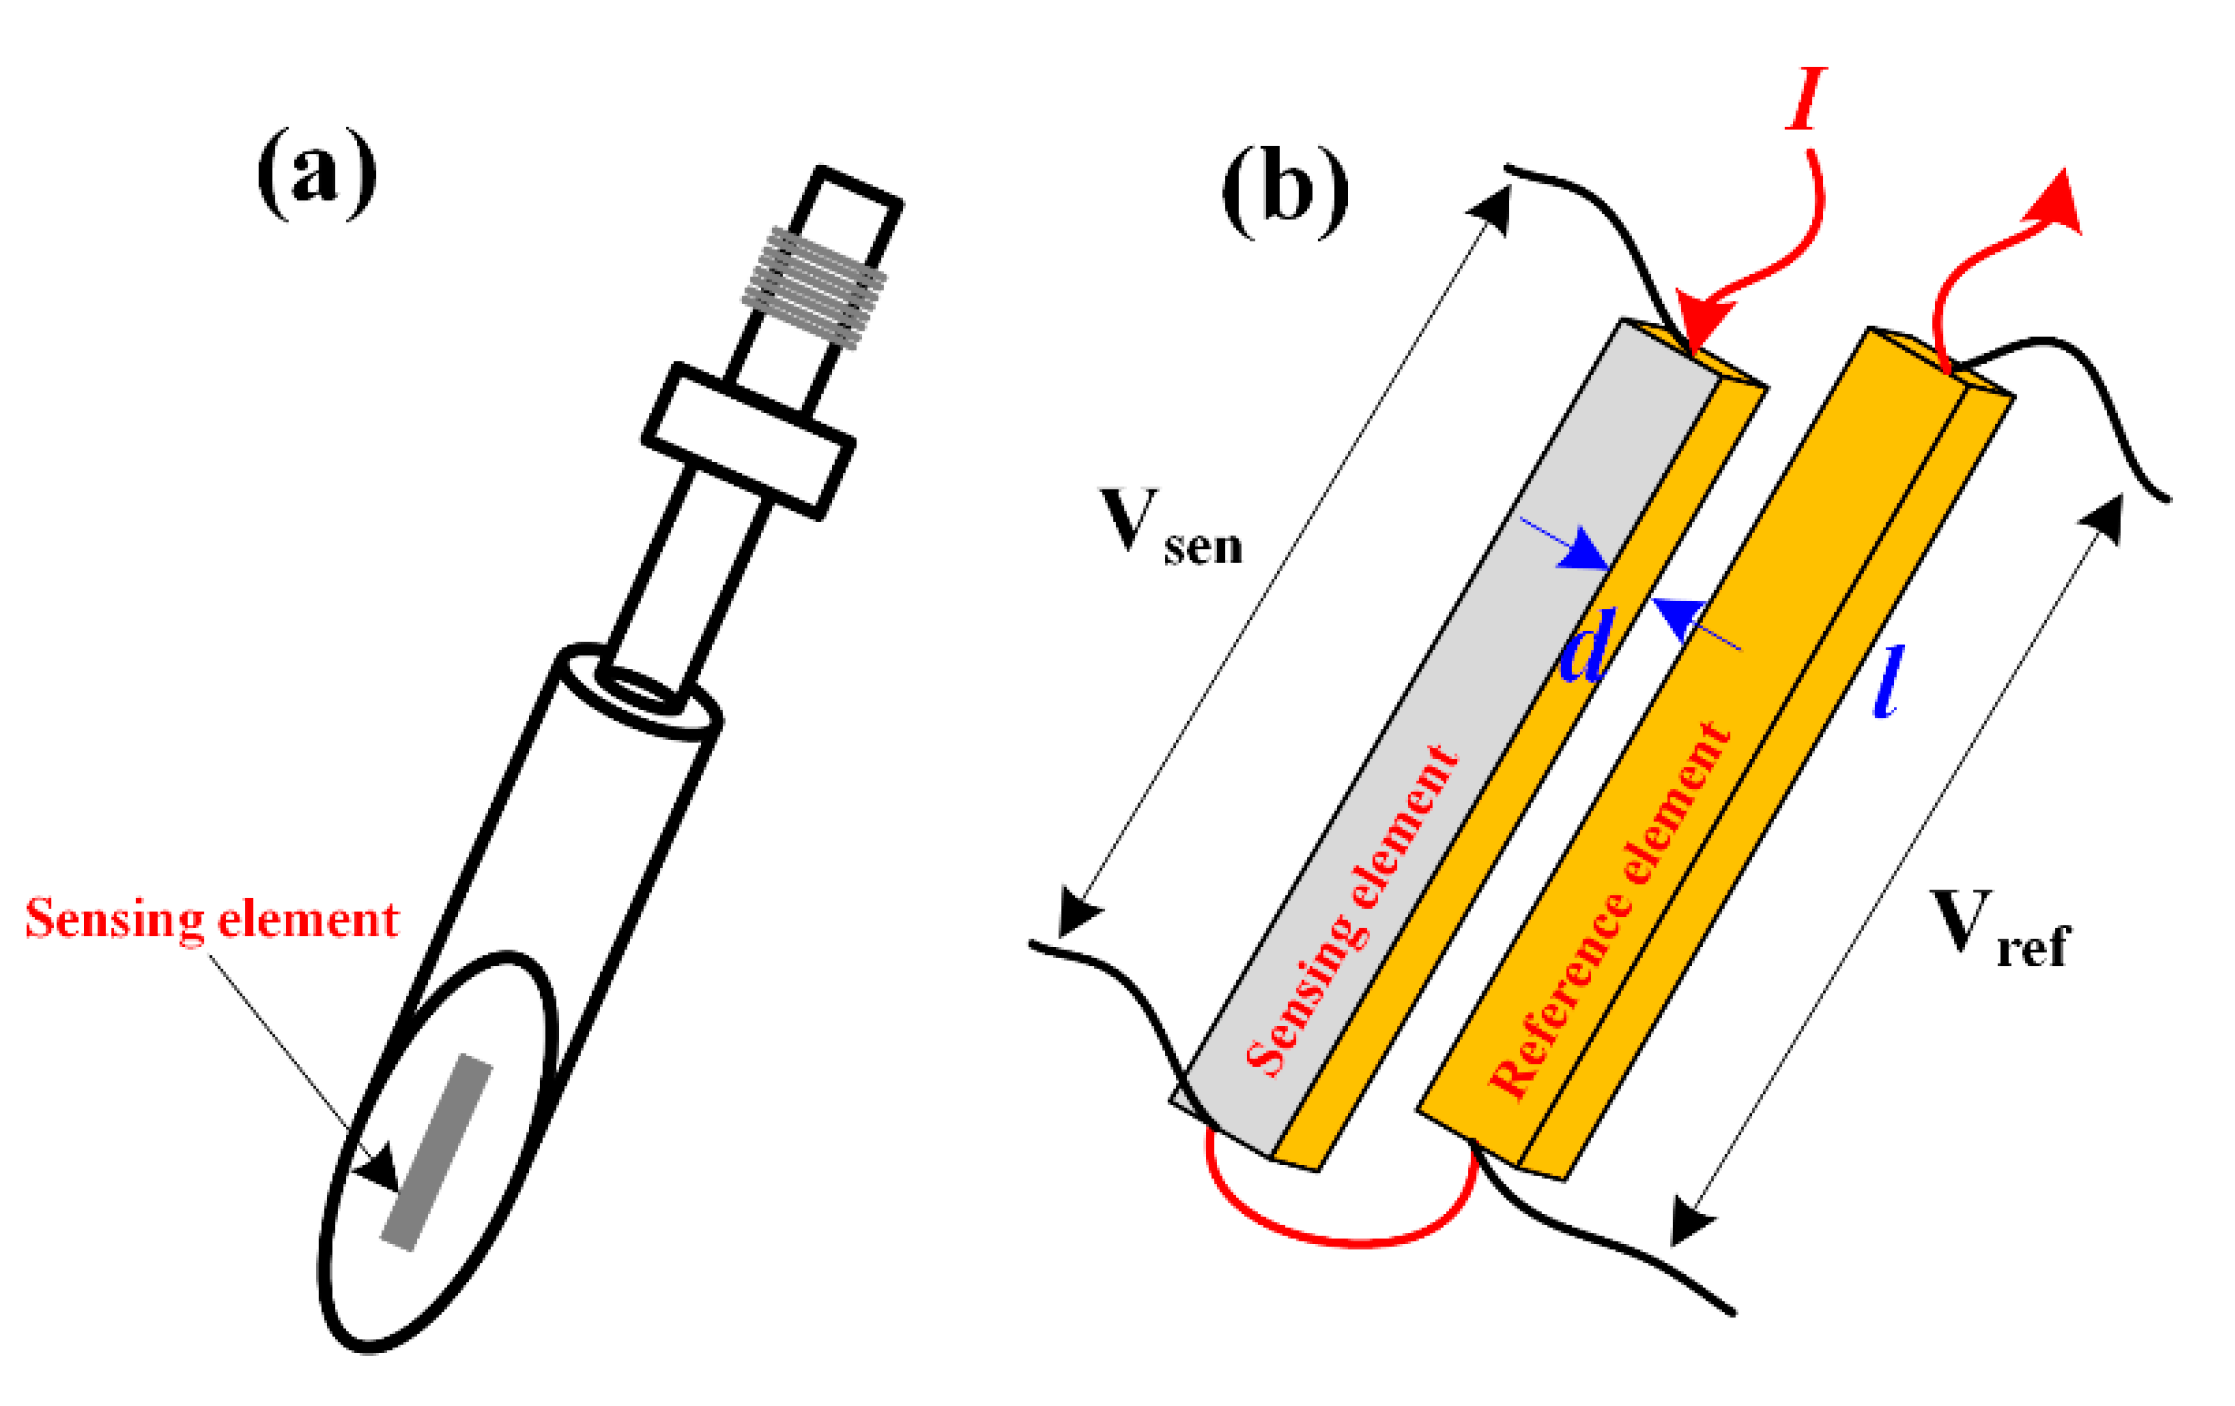
3.3. Advances in the Monitoring of Erosion-Corrosion Using Specially Designed Sensors

Various sensors were developed to monitor erosion-corrosion in both field and lab tests. This section introduces some typical cases in the application of erosion-corrosion sensors, aimed at understanding how to design and employ both electrochemical and non-electrochemical sensors to study erosion-corrosion.
Figure 12 shows an electrochemical test system for the study of erosion-corrosion in a simulated pipeline circle using specially designed ring form electrodes [14]. It is seen that pipe sections with different diameters were used and a protrusion was arranged in the flow loop to establish an intense change of the flow field. In this system, a two-electrode system was applied for LPR measurement [103] and the corrosion rate could be directly obtained from the LPR measurement results. The total weight loss of the electrodes in the erosion-corrosion test was obtained from gravimetric measurements. The pure corrosion rate and pure erosion rate were measured in a corrosive electrolyte free of sand particles and in a non-corrosive slurry, respectively. The design of the ring form electrode is to study how the sudden diameter change and the appearance of the protrusion would influence the localized erosion-corrosion behavior. The test results show that, for pipeline steel under active corrosion, the corrosion-enhanced erosion contributes the most to the metal loss caused by synergism. It was also investigated that the sudden change of the flow distribution would have a significant influence on the erosion-corrosion due to the local turbulences.
The novel designed ring form electrode could reveal the variation of the corrosion rate of different pipe sections with the changing of the flow field distribution. However, the total metal loss still needs to be obtained from weight loss measurement, which limits the study of the dynamic progression of the erosion component. Liu and co-workers [76] provided a new kind of sensor which combined ER and LPR measurements together to obtain the total metal loss and the corrosion metal loss simultaneously. It is seen from Figure 13 that a ring array was employed for both ER and LPR measurement. The rings made of targeted pipeline steel (3, 4, 5, 6) were used as working rings. Four stainless-steel rings (1, 2, 7, 8) were used as the counter electrodes and the reference electrodes to construct the three-electrode system in the pipe. The working rings were divided into six segments using the RPERS technique, which allows the on-line monitoring of the localized total metal loss around the pipe circle. On the basis of the ring array, both the total metal loss and the corrosion metal loss can be on-line monitored, suggesting that the erosion component can be immediately calculated during the test. More detailed information on the dynamic change of the erosion rate is provided by the ring array in comparison to gravimetric measurements.
To further understand the relationship between the fluid dynamic and erosion-corrosion, Zhang and Zeng [71,72,73] studied the FAC and erosion-corrosion performances at different locations of a pipe elbow using a multi-electrode sensor in conjunction with a CFD simulation. It is seen from Figure 14a that multi-electrodes were arranged at different locations of the elbow. The localized erosion rate and the distribution of the sand concentration at the elbow could be well predicted by CFD, as presented in Figure 14b. The total metal loss and the corrosion rate were obtained by weight loss and EIS measurements, respectively. The test results indicate that the localized erosion-corrosion rate is in good agreement with the hydrodynamics and sand concentration distribution at the elbow. The combination of the multi-electrode sensor and CFD provides a quantitative and effective analysis of the relationship between erosion-corrosion and the flow field distribution. In the further studies of the erosion-corrosion of stainless steel at the elbow using a coupled multi-electrode sensor system [73], it was found that the corrosion process of the stainless steel at the elbow was not stable due to the inhomogeneous distributions of the sand particles and the local intensity of mass transfer. The macro-cell currents among the different elbow locations demonstrated that the location confronted with a high impingement frequency would become the anodic site. The significant anodic current can lead to a more serious erosion-corrosion damage at this area.
In order to measure the localized corrosion rate in flow dynamic conditions and to mimic the progression of flow-accelerated corrosion (FAC) and erosion-corrosion on a steel interface, a wire beam electrode (WBE) in combination with three-dimensional (3D) surface profilometry measurement was proposed to study the synergy between localized corrosion and erosion [53,104,105]. The WBE technique can effectively restore the electrochemical integrity and local chemical environment change on a one-piece steel sample. The measurement principle of WBE was clarified in various studies, allowing the measurement of the in situ potential and galvanic current distribution maps [53]. On the basis of the distributions of the potential and galvanic current, the dynamic variation of the anodic sites and cathodic sites can be captured, indicating that the propagation of localized corrosion in the flowing slurry can be visualized. The localized metal loss induced by corrosion can be calculated from the anodic current charge on a single electrode. Meanwhile, the total metal loss of a single electrode can be measured from the volume loss using a 3D profile measurement. Thereafter, the metal losses induced by localized corrosion and erosion can both be obtained, indicating that the influence of the local galvanic current on the erosion rate can be studied. Figure 15 shows a typical WBE which was fabricated using 100 tiny electrodes [104]. It is seen that the surface morphologies of the WBE after FAC and erosion-corrosion were similar to those of the steel coupons which were tested in the same FAC and erosion-corrosion conditions. The similar surface morphology suggests that WBE can be used as an effective technique to monitor erosion-corrosion without disturbing the integrity of the local chemical environment and local electrochemical reaction in the flowing electrolyte.

4. Advances in the Mechanism Study of Erosion-Corrosion of Steel

4.1. The Interaction between Erosion and Corrosion in Cyclic Erosion-Corrosion Tests

Cyclic erosion-corrosion tests were used in various researches to study how the pure erosion and pure corrosion can influence each other [39,40,106,107,108,109,110,111,112,113,114]. The measurement procedure using erosion-corrosion cycles is different from the erosion-corrosion process in a corrosive slurry, as introduced in Section 3.2. The erosion tests and corrosion tests are conducted separately in an erosion-corrosion cycle. Generally, the test samples firstly undergo a pure erosion process which is conducted under dry sand impingements or in a slurry without containing any corrosive agents. Then, the test samples are transferred in a static corrosive electrolyte for a pure corrosion cycle. The erosion-corrosion cycle is commonly repeated several times to obtain an average erosion rate and corrosion rate of all the test cycles. Equation (1) is also used in this case to calculate the erosion-enhanced corrosion and corrosion-enhanced erosion [110,111,112,113]. However, the definitions of Wc, We, Wc0, We0, W c e , and W e c using cyclic erosion-corrosion test methods are completely different from those introduced in Section 3.2, which should be noted. In this case, Wc and We are the average metal losses induced by all pure erosion cycles and all pure corrosion cycles, respectively. Wc0 is the corrosion metal loss in only one corrosion cycle with the original steel surface fine polished, and We0 is the erosion metal loss in only one erosion cycle with the original finely polished steel surface. Thereafter, W c e and W e c can be calculated from the difference between Wc and Wc0 and the difference between We and We0, respectively. Since pure erosion and pure corrosion alternatively occur on the steel surface, the “synergy” might be not appropriate to describe W c e and W e c in a cyclic erosion-corrosion test because “synergy” prefers to clarify the coupled effect of erosion and corrosion which should happen simultaneously on the steel surface. It is more suitable to use “interaction” to clarify W c e and W e c in this case.
Xie and co-workers [39] proposed a theoretical model for the erosion-enhanced corrosion in the cyclic erosion-corrosion tests to elaborate the influence of the pre-erosion on the corrosion process. He reported that the plastic deformation of the steel caused by sand impacts would lead to an increase of the strain energy. The chemical potential of a highly deformed steel induced by erosion would have a negative shift [39].
μ s = μ 0 + R T l n a + Δ P · V ,
where µs is the chemical potential, µ0 is the standard chemical potential, R is the gas constant, T is the absolute temperature, ΔP is the residual strength, and V is the volume of the deformation area. The decreased corrosion potential caused by plastic deformation can be expressed as
Δ E c o r r = Δ P · V z F ,
where ΔEcorr is the decreased corrosion potential caused by plastic deformation, z is the valence, and F is the Faraday’s constant. Due to the corrosion potential decreasing, the corrosion rate would have an increase.
Δ i c o r r = i c o r r 0 exp ( Δ E c o r r β a + β c ) ,
where Δicorr is the increased corrosion current density, i c o r r 0 is the original corrosion current density without deformation, βa is the anodic Tafel slope, and βc is the cathodic Tafel slope. Accordingly, the plastic deformation can lead to the increase of the anodic current. It was further stressed by Xie [39,106] that the increasing of the corrosion rate induced by the plastic strain arises from the erosion process rather than the prior mechanical deformation of the steel sample.
Islam and co-workers [107,110,111,115,116] conducted a series of studies on the interaction between erosion and corrosion of API pipeline steels using cyclic erosion-corrosion tests. The typical surface morphologies of API X100 steel after several erosion-corrosion cycles are summarized and presented in Figure 16. Islam [116] concluded that the corrosion-enhanced erosion is induced by the increase of the surface roughness, removal of work-hardened layers, accelerated removal of embedded sand particles, and promoted delamination by extending sub-surface cracks during the corrosion process. On the other hand, erosion can remove the protective film from the steel surface, break the cementite network, provide favorable conditions for pitting, and increase the effective surface area by increasing the surface roughness, which all accelerate the corrosion kinetics. Furthermore, erosion can create sub-surface cracks and deform the work-hardened layer, which can also enhance corrosion. Comparing the performances of API X42, X70, and X100 pipeline steels after cyclic erosion-corrosion tests, it was found by Islam and co-workers [110] that API X100 provides the highest erosion-corrosion resistance among all API steels. The high erosion-corrosion resistance of API 100 steel is attributed to the higher mechanical strength and better corrosion resistance. However, API X70 suffers the highest erosion-corrosion loss percentage among all the API steels. This suggests that the pipeline made of API X70 might have a faster material degradation when corrosive slurry is passing through.
Using a cyclic erosion-corrosion test can clearly identify the change of the surface morphology and the crack propagation beneath the interface during the separated erosion and corrosion processes. The impact velocity of the sand particles in the pure erosion process must be high enough (always higher than 20 m/s) to induce significant damage of steel interface such as obvious plastic deformation, ploughing, cutting, or even embedded sand particles. Otherwise, a low impact velocity which cannot induce an obvious surface damage would have no influence on the following corrosion process. This is totally different from the erosion-corrosion test conducted in corrosive slurry, where even 1.5 m/s flow rate could lead to the synergy of erosion and corrosion [76]. In addition, the erosion-corrosion cycle cannot be used to study the interaction between erosion and corrosion of stainless steels which are protected by oxidation passive films. Most of the stainless steels can be self-passivated in natural corrosion conditions. This suggests that, even after serious pure erosion, the restoration of the passive film would soon be completed, leading to no corrosion happening in the following corrosion cycle.

4.2. Understanding the Erosion-Corrosion Behavior of Steels under Passive State

It is known that a passive film can form on the steel surface to prevent the steel substrate from corrosion in various cases [117,118,119,120]. A thin passive film can form on the stainless-steel surface due to the presence of the elements such as Ni, Cr, and Mo in the steel components [98]. For the carbon steels, a passive film can also form which is usually composed of Fe3O4, γ-FeOOH, and α-FeOOH in an alkaline environment [119]. The properties of the passive film are relatively different from the corrosion product films such as FeCO3 and some ferric oxides, which cannot be recovered once broken. The local damage of the corrosion product film induced by high fluid shear stress or sand impacts can result in the formation of macro-cell corrosion between the bare steel area and the area covered by the corrosion product film [2,121,122]. However, the restoration of the passive film can be finalized in a few milliseconds from the sand impingement and, thus, erosion-corrosion is hindered on the steel surface under a passive state. Sasaki and Burstein [123] found that there is a threshold impact energy of the sand particles to induce the rupture of the passive film on the stainless steel. It was also found that the threshold impact energy would have an increase with the decrease of the impact angle. From Sasaki’s study [123], it was empirically concluded that, if the impact energy of the sand particle reaches 0.03 μJ at normal impact, the sand particle would lead to the local breakdown of the passive film. This suggests that a 2 m/s flow rate of a silica sand particle (160 μm diameter) can normally lead to the breakdown of the passive film. However, in Hu and Neville’s work [124], it was found that obvious erosion-corrosion of stainless steels only could happen when the sand impact velocity reached a critical value. The test results showed that the impact energy of the sand particle at the critical velocity was dramatically higher than 0.03 μJ. This phenomenon was confirmed in Yi and Wang’s studies [70,97], where the breakdown of the passive film was not sufficient to induce obvious erosion-corrosion on the passivated steel. They proposed that there is competition between the depassivation process caused by sand impingements and the repassivation process, which determined the initiation of significant erosion-corrosion. It is thought that the critical flow velocity is an indicator which suggests that the depassivation time is equal to the repassivation time. Yi and co-workers [98] compared the critical flow velocities of six different stainless steels in same corrosive slurry. The critical flow velocities of the six stainless steels measured from different methods are listed in Table 1. It was found that the stainless steel having a higher content of Cr and Mo element would have a better erosion-corrosion resistance. In contrast, the addition of Ni element would lead to a lower erosion-corrosion resistance. Since it was verified in previous studies that higher concentrations of Cr and Mo would facilitate the repassivation process and the addition of Ni would retard the restoration of the passive film, the different erosion-corrosion resistances of the stainless steels indicate that repassivation is an important factor for the initiation of erosion-corrosion on passivated steels.
Laleh and co-workers [100] compared the erosion-corrosion behaviors of commercial 316L stainless steel and selective laser melting (SLM)-produced 316L stainless steel. The basic chemical compositions of both 316L stainless steels were similar except that MnS inclusions were eliminated from the SLM-produced 316L samples. Therefore, the SLM-316L stainless steel had a much higher pitting potential than the commercial 316L stainless steel (Figure 17a), but the repassivation potential of the SLM-316L was lower than that of the commercial one. Figure 17b shows the anodic current of both commercial 316L and SLM-316L stainless-steel samples under 100-mV anodic polarization in slurries with different flow rate. It is observed that the corrosion currents of the SLM-produced samples were nearly 20–100% higher than those of the commercial samples. Results showed that the erosion-corrosion resistance is controlled by the repassivation behavior rather than the pitting resistance, which further verified Yi and Wang’s assumptions [97]. However, there is still no direct evidence which illustrates that the critical flow velocity is determined by the depassivation time and repassivation time because the repassivation time is hard to measure. It seems that the repassivation time is not a constant parameter which might be influenced by sand concentration, impingement frequency, and impact angle. As a result, the critical impact energy is hard to accurately measure from traditional methods such as scratch tests and one-sand-particle impingement tests [97]. In addition, the definition of the complete repassivation is difficult, which means that critical flow velocity cannot be fully understood. Zheng and co-workers [70,94,97] further studied the influences of the sand concentration and impact angle on the critical flow velocity. It was reported that the increasing of the sand concentration would lead to the decrease of the critical flow velocity, and the lowest critical velocity would appear under oblique impacts ranging from 30° to 60°.
When the erosion-corrosion process on the steel surface becomes stable and the current decay coefficient (τ) still can be deemed as a constant after multiple sand impingements, a theoretical model was proposed by Lu and Luo [21,42] to predict the metal loss rate of passivated steels. Figure 18 shows typical current responses with the breakdown of the passive film induced by multi-particle impacts. The corrosion current density i would have an immediate increase after a sand impingement [21].
i = i s + i p e a k exp ( t R P τ ) ,
where is is the stable passive current density, tRP (= t − t0) is the time period after impingement, and t0 is the moment when the impingement occurs. The average corrosion current density ( i ¯ ) over the whole steel surface can be expressed as
i ¯ =   1 A 0 A i d A ,
where A is the surface area of the steel. Since the fresh metal would be exposed to the corrosive slurry after the sand impingements, the generating rate of the fresh metal area ( A e ˙ ) within a unit area can be calculated as
A e ˙ = ( C p V sin θ m ¯ p ) A ¯ c r a t e r ,
where Cp, θ, and V are the solid particle concentration, impact angle, and impact velocity, respectively, A ¯ c r a t e r is the average area of a crater newly formed by sand impingement, and m ¯ p is the average mass of the sand particles. Since the corrosion current of the local areas would change back to i0+is after new sand impingements, the derivative of the surface area having the same local current density over the repassivation time can be written as
d A d t = A e   A ˙ .
Solving Equation (12), and substituting the solved results and Equation (9) into Equation (10), the average corrosion current density can be calculated as
i ¯ = i s + i p e a k τ ( C p U sin θ m ¯ p ) A c r a t e r 1 + τ ( C p U sin θ m ¯ p ) A c r a t e r .
According to Equation (13), the erosion-enhanced corrosion of the stainless steels can be well predicted. This theoretical model is also suitable for passivated carbon steels with the modification of the current decay after sand impingement using the bi-exponential law [42].
i = i s + i 1 exp ( t R P τ 1 ) + i 2 exp ( t R P τ 2 ) .
It should be noted that this model is established based on the assumption that the breakdown and restoration of the passive film reaches a stable status, and the current decay coefficient is a constant [21]. Once stable pitting corrosion propagates on the steel surface, this theoretical model would be inapplicable.
As the breakdown of the passive film is the main lead for the synergy of erosion-corrosion of passivated steels, only erosion-enhanced corrosion is discussed in this section. However, in the case that a new sand impingement occurs on the area where the passive film is not well repaired from last impingement, the corrosion would also enhance the erosion behavior. However, this case is more likely to be a situation where erosion occurs under an active corrosion process which is introduced below.

4.3. Understanding the Erosion-Corrosion Behavior of Steels under Active Corrosion

Unlike passivated steels, the erosion-corrosion of the steels under active corrosion is a more complicated process. The fresh steel surface would directly expose to the erosive and corrosive environment, leading to erosion and corrosion simultaneously happening on the steel surface. It was reported in Section 4.1 that the increased surface roughness and the removal of the work-hardened layer are the main factors for the corrosion-enhanced erosion [111]. However, there is a basic requirement for the appearance of these kinds of corrosion-enhanced erosion, whereby the impact velocity of the sand particles should be high enough to induce significant surface plastic deformation or cutting. Nevertheless, it was found that, if a sand particle with a relative low impact velocity (much lower than the velocity to induce significant plastic deformation) indents on a steel surface, significant erosion can also happen if the steel is undergoing active dissolution. This indicates that electrochemical corrosion can lead to the decrease of the threshold for erosion initiation. Consequently, the concept of “erosion-enhanced corrosion” in the corrosive slurry would be totally different from that in a cyclic erosion-corrosion test.
It is known that the erosion rate is normally determined by the impact parameters of the sand particles and the surface hardness of the target metal. The erosion rate can be expressed as follows [22,125]:
W e = K ( H v ) n ,
where K and n are the parameters which are decided by the particle size, impact velocity, and impact angle, and Hv is the surface hardness of the target material. It is seen from Equation (15) that, when the particle size, impingement velocity, and angle are fixed, the threshold for the initiation of erosion is determined by the surface hardness. Guo and co-workers [126] studied the degradation of the surface hardness induced by the anodic dissolution using in-situ nano-indentation technique. It can be clearly seen from Figure 19a that the surface hardness had a double decrease with 1-mA/cm2 anodic current applied on the steel surface. The surface hardness would recover back to a large extent after corrosion. It can be further seen from Figure 19b that the influence of the surface hardness degradation was less than 200 nm beneath the surface layer. The test results indicate that the corrosion-enhanced erosion in the corrosive slurry is mostly induced by the in situ surface hardness degradation. Guo and co-workers [126] suggested that the degradation of the surface hardness is caused by the generation of vacancies in the metal surface layer. Some voids and fine cracks were also observed by Owen and co-workers [17] using the focused ion beam (FIB) technique. The comparison of the cross-sections of X65 steel samples after pure erosion and erosion-corrosion are presented in Figure 20. The voids and cracks were extremely close to the steel interface, which might have contributed to the surface hardness degradation.
In the further studies conducted by Guo and Lu [9,37], it was empirically found that the relationship between the degradation level of the surface hardness and the anodic dissolution rate can be expressed as
Δ H v H v 0 = b l o g [ i a i t h ] ,
where ΔHv is the decreased surface hardness due to the anodic dissolution, Hv0 is the original surface hardness, b is an experimental constant, ia is the anodic current density, and ith is the threshold anodic current density to induce the surface hardness degradation. Substituting Equation (16) into Equation (15), the corrosion-enhanced erosion can be obtained.
W e c W e 0 = n b l o g ( i a i t h ) .
In a test conducted by Guo and co-workers [9] in a flowing electrolyte without sand particles using a rotation disc, it was found that the total steel loss was 1.3 times higher than the metal loss induced by corrosion when the rotation speed reached 9000 rpm. The test results demonstrated that, if the corrosion rate is high enough to induce significant surface hardness degradation, even the fluid shear stress can lead to erosion without needing sand particles.
According to Guo and Lu’s work [9,37], the relationship between the anodic dissolution rate and the erosion rate was basically studied. Nonetheless, most of these findings were obtained from steel surface under rather larger anodic polarization. This means that the whole steel surface would suffer anodic dissolution without any cathodic sites existing on the steel surface. Therefore, the obtained results are significantly different from the natural corrosion conditions under OCP with both anodes and cathodes simultaneously distributing on the steel surface to maintain a net zero current. On the other hand, it is normally believed that the erosion-enhanced corrosion is induced by the wear of the fluid force or the sand impingements, which can remove the corrosion product and maintain a high mass transportation rate [118]. It is thought that the corrosion rate would have an increase with the flow rate increasing at the initial stage. Once the flow rate increased to a certain value, the corrosion rate would have no further increase due to the limitation of the mass transportation. Therefore, through the calculation of W c e , it is found that the erosion-enhanced corrosion is tiny in high-flow-rate conditions when the cathodic reaction is totally under diffusion control [9,10,14]. However, it can be clearly seen from Figure 15 that, with the initiation of erosion-corrosion in the slurry, the corrosion morphology significantly transforms from a long and narrow “flow mark” to craters [104]. This indicates that the corrosion process might have a thorough change from large anodic areas to pitting corrosion with the appearance of erosion. As a result, it is necessary to investigate how the local anode and cathode would influence the erosion process, and, in turn, how the sand erosion can change the localized corrosion behavior.
It was introduced in Section 3.3 that WBE can be used as an effective method for visualizing the dynamic change of localized corrosion in a flowing slurry. Therefore, WBE was employed to probe the initiation and propagation of both FAC and erosion-corrosion under different test conditions [53,104,105]. It is seen from Figure 21a,b that the anodic sites would expand along the flow direction due to the analyte transportation from the tip pit to the downstream as shown in Figure 22a, finally leading to the formation of “flow mark” in FAC conditions. However, as shown in Figure 21c, once the steel surface is eroded by sand particles, the anodic sites would fix at certain areas due to the formation of craters which are mostly induced by the sand impingements at the anodic sites. The craters are much deeper than the “flow mark”, which retards the transportation of the analyte. With the accumulation of corrosive agents in the deep craters, the craters would possibly propagate to pits, which leads to the change of the surface morphology. As shown in Figure 22b, new craters would form close to the initial craters as the rims of the initial craters become new anodic sites. On the other hand, the cathodic areas on the steel surface are less affected by the impingements because the cathodic current can inhibit the surface hardness degradation and provide a local high-pH condition. From the WBE test, it is found that, under natural active corrosion conditions, the interaction between erosion and corrosion cannot be simply quantified from the calculated components as presented in Equation (1). More work should be conducted in the future to understand the coupled effect between the localized corrosion and local sand impingement.

5. Summary

1. The rotating disc/cylinder electrode system is the most economic and convenient method for the study of erosion-corrosion. However, the real sand concentration and the smoothening of the sand shape due to long-term erosion cannot be controlled in the test cell. The flow velocity and impact angle can be well controlled using a jet impingement rig, and the continual sand feeding can ensure the concentration and the shape of the sand particles. Flow loops are always used to study the erosion-corrosion of some typical large-scale pipe sections such as the elbow and weldment, as well as pipe sections having a sudden diameter change.
2. Typical non-electrochemical methods such as the ER method and acoustic emission measurement are usually used in the field test to capture the total metal loss rate and the sand rate. However, the interaction between erosion and corrosion cannot be captured only through non-electrochemical methods. The combination of electrochemical and gravimetric measurements is the most common method for the study of erosion-corrosion in lab tests. The interaction and synergy between erosion and corrosion can be analyzed. However, the measurement error for both corrosion-enhanced erosion and erosion-enhanced corrosion cannot be avoided based on these traditional methods.
3. Although the same equation is used to describe the erosion-enhanced corrosion and corrosion-enhanced erosion in both the cyclic erosion-corrosion test and the erosion-corrosion test in a corrosive slurry, the meaning of W c e and W e c in a cyclic erosion-corrosion test is totally different from that in the test conducted in the corrosive slurry. Since the erosion process and corrosion process are completely separated in an erosion-corrosion cycle, it is better to use “interaction” to describe W c e and W e c in a cyclic erosion-corrosion test rather than “synergy”. “Synergy” is preferred to clarify the coupled effect of erosion and corrosion, which should happen simultaneously on the steel surface.
4. The main synergistic effect is erosion-enhanced corrosion for the passivated steels. The increased corrosion rate is mostly induced by the breakdown of the passive film due to the sand impingements. However, serious erosion-corrosion would occur only when the flow velocity increases to a critical value, which is much higher than the flow velocity that can induce the breakdown of the passive film. It is proposed that the critical flow velocity for the initiation of significant erosion-corrosion of passivated steel is determined by both depassivation and repassivation processes.
5. The surface hardness would have an in situ degradation under active anodic dissolution, which can significantly lead to the decrease of the threshold for erosion imitation. Therefore, the main synergy is corrosion-enhanced erosion when the steel is under active corrosion. Under natural corrosion conditions, the sand impingement at the anodic sites would lead to the corrosion behavior transforming from a “flow mark” to pitting corrosion due to the accumulation of corrosive agents in the deep craters. In turn, new impingement craters would appear close to the initial craters with the pitting propagation. On the other hand, the cathodic areas on the steel surface are less affected by the impingements because the cathodic current can inhibit the local degradation of the surface hardness and provide a local high-pH condition. In addition to the general synergy of erosion and corrosion calculated from typical equations, the transformation of the localized corrosion pattern should be paid more attention in future erosion-corrosion studies.

Author Contributions

Y.X. organized the research topic and draft the basic structure of the manuscript. L.L. and Q.Z. drafted the second chapter of the manuscript and helped edit the whole manuscript. X.W. drafted part of the third chapter. M.Y.T. revised the manuscript and provided constructive suggestions for this work. Y.H. sponsored the research project and revised the manuscript. All authors have read and agreed to the published version of the manuscript.

Funding

This research was funded by [Key Projects in the National Science & Technology Pillar Program during the Thirteenth Five-year Plan Period of China] grant number [2016ZX05057] and the [China Postdoctoral Science Foundation] grant number [2019TQ0049 and 2019M661101].

Conflicts of Interest

The authors declare no conflict of interest.

References

  1. Wu, J.; Graham, L.J.W.; Lester, D.; Wong, C.Y.; Kilpatrick, T.; Smith, S.; Nguyen, B. An effective modeling tool for studying erosion. Wear 2011, 270, 598–605. [Google Scholar] [CrossRef]
  2. Matsumura, M. Erosion-Corrosion: An Introduction to Flow Induced Macro-Cell Corrosion; Bentham Science Publishers, Hiroshima University: Hiroshima, Japan, 2012. [Google Scholar]
  3. Zhu, M.; Sun, L.; Ou, G.; Wang, K.; Wang, K.; Sun, Y. Erosion corrosion failure analysis of the elbow in sour water stripper overhead condensing reflux system. Eng. Fail. Anal. 2016, 26, 93–102. [Google Scholar] [CrossRef]
  4. Muthanna, B.G.N.; Amara, M.; Meliani, M.H.; Mettai, B.; Božić, Z.; Suleiman, R.; Sorour, A.A. Inspection of internal erosion-corrosion of elbow pipe in the desalination station. Eng. Fail. Anal. 2019, 102, 293–302. [Google Scholar] [CrossRef]
  5. Zhang, M.; Liu, Y.; Wang, W.; Wang, P.; Li, J. The fatigue of impellers and blades. Eng. Fail. Anal. 2016, 62, 208–231. [Google Scholar] [CrossRef]
  6. Zeng, L.; Zhang, G.A.; Guo, X.P. Erosion–corrosion at different locations of X65 carbon steel elbow. Corros. Sci. 2014, 85, 318–330. [Google Scholar] [CrossRef]
  7. Tian, B.R.; Cheng, Y.F. Electrochemical corrosion behavior of X-65 steel in the simulated oil sand slurry I: Effects of hydrodynamic condition. Corros. Sci. 2008, 50, 773–779. [Google Scholar] [CrossRef]
  8. Dong, C.F.; Xiao, K.; Li, X.G.; Cheng, Y.F. Erosion accelerated corrosion of a carbon steel–stainless steel galvanic couple in a chloride solution. Wear 2010, 270, 39–45. [Google Scholar] [CrossRef]
  9. Guo, H.X.; Lu, B.T.; Luo, J.L. Non-Faraday material loss in flowing corrosive solution. Electrochim. Acta 2006, 51, 5341–5348. [Google Scholar] [CrossRef]
  10. Guo, H.X.; Lu, B.T.; Luo, J.L. Interaction of mechanical and electrochemical factors in erosion–corrosion of carbon steel. Electrochim. Acta 2005, 51, 315–323. [Google Scholar] [CrossRef]
  11. Tang, X.; Xu, L.Y.; Cheng, Y.F. Electrochemical corrosion behavior of X-65 steel in the simulated oil–sand slurry II: Synergism of erosion and corrosion. Corros. Sci. 2008, 50, 1469–1474. [Google Scholar] [CrossRef]
  12. Li, Y.; Burstein, G.T.; Hutchings, I.M. The influence of corrosion on the erosion of aluminium by aqueous silica slurries. Wear 1995, 186, 515–522. [Google Scholar] [CrossRef]
  13. Zhang, G.A.; Xu, L.Y.; Cheng, Y.F. Investigation of erosion–corrosion of 3003 aluminum alloy in ethylene glycol–water solution by impingement jet system. Corros. Sci. 2009, 51, 283–290. [Google Scholar] [CrossRef]
  14. Malka, R.; Nešić, S.; Gulino, D.A. Erosion–corrosion and synergistic effects in disturbed liquid-particle flow. Wear 2007, 262, 791–799. [Google Scholar] [CrossRef] [Green Version]
  15. Lu, B.T.; Luo, J.L.; Mohammadi, F.; Wang, K.; Wan, X.M. Correlation between repassivation kinetics and corrosion rate over a passive surface in flowing slurry. Electrochim. Acta 2008, 53, 7022–7031. [Google Scholar] [CrossRef]
  16. Hu, X.; Neville, A. CO2 erosion–corrosion of pipeline steel (API X65) in oil and gas conditions—A systematic approach. Wear 2009, 267, 2027–2032. [Google Scholar] [CrossRef]
  17. Owen, J.; Ramsey, C.; Barker, R.; Neville, A. Erosion-corrosion interactions of X65 carbon steel in aqueous CO2 environments. Wear 2018, 414–415, 376–389. [Google Scholar] [CrossRef]
  18. Barik, R.C.; Wharton, J.A.; Wood, R.J.K.; Tan, K.S.; Stokes, K.R. Erosion and erosion–corrosion performance of cast and thermally sprayed nickel–aluminium bronze. Wear 2005, 259, 230–242. [Google Scholar] [CrossRef]
  19. Tan, K.S.; Wharton, J.A.; Wood, R.J.K. Solid particle erosion–corrosion behaviour of a novel HVOF nickel aluminium bronze coating for marine applications—Correlation between mass loss and electrochemical measurements. Wear 2005, 258, 629–640. [Google Scholar] [CrossRef]
  20. ASTM Standard Guide for Determining Synergism between Wear and Corrosion: G119-09; ASTM International: West Conshohocken, PA, USA, 2009.
  21. Lu, B.T.; Luo, J.L.; Ma, H.Y. A theoretical model on electrochemical response of passivated metals to solid particle impingement. J. Electrochem. Soc. 2007, 154, C159. [Google Scholar] [CrossRef]
  22. Stack, M.M.; Stott, F.H. An approach to modeling erosion-corrosion of alloys using erosion-corrosion maps. Corros. Sci. 1993, 35, 1027–1034. [Google Scholar] [CrossRef]
  23. Saha, G.C.; Khan, T.I.; Zhang, G.A. Erosion–corrosion resistance of microcrystalline and near-nanocrystalline WC–17Co high velocity oxy-fuel thermal spray coatings. Corros. Sci. 2011, 53, 2106–2114. [Google Scholar] [CrossRef]
  24. Stack, M.M.; Abdulrahman, G.H. Mapping erosion–corrosion of carbon steel in oil–water solutions: Effects of velocity and applied potential. Wear 2012, 274–275, 401–413. [Google Scholar] [CrossRef] [Green Version]
  25. Stack, M.M.; Chi, K. Mapping sliding wear of steels in aqueous conditions. Wear 2003, 255, 456–465. [Google Scholar] [CrossRef]
  26. Stack, M.M.; Corlett, N.; Zhou, S. Impact angle effects on the transition boundaries of the aqueous erosion–corrosion map. Wear 1999, 225, 190–198. [Google Scholar] [CrossRef]
  27. Stack, M.M.; Corlett, N.; Zhou, S. A methodology for the construction of the erosion-corrosion map in aqueous environments. Wear 1997, 203, 474–488. [Google Scholar] [CrossRef]
  28. Stack, M.M.; Peña, D. Mapping erosion of Ni–Cr/WC-based composites at elevated temperatures: Some recent advances. Wear 2001, 251, 1433–1443. [Google Scholar] [CrossRef]
  29. Stack, M.M.; Pungwiwat, N. Erosion–corrosion mapping of Fe in aqueous slurries: Some views on a new rationale for defining the erosion–corrosion interaction. Wear 2004, 256, 565–576. [Google Scholar] [CrossRef]
  30. Stack, M.M.; Wang, H.W. Simplifying the erosion–corrosion mechanism map for erosion of thin coatings in aqueous slurries. Wear 1999, 233, 542–551. [Google Scholar] [CrossRef]
  31. Finnie, I. Erosion of surfaces by solid particles. Wear 1960, 3, 87–103. [Google Scholar] [CrossRef]
  32. Bitter, J.G.A. A study of erosion phenomena Part I. Wear 1962, 6, 5–21. [Google Scholar] [CrossRef]
  33. Hutchings, I.M. A model for the erosion of metals by spherical particles at normal incidence. Wear 1981, 70, 269–281. [Google Scholar] [CrossRef] [Green Version]
  34. McLaury, B.S. A Model to Predict Solid Particle Erosion in Oilfield Geometries. Ph.D. Thesis, The University of Tulsa, Tulsa, OK, USA, 1993. [Google Scholar]
  35. Oka, Y.I.; Okamura, K.; Yoshida, T. Practical estimation of erosion damage caused by solid particle impact. Wear 2005, 259, 95–101. [Google Scholar] [CrossRef]
  36. Javaheri, V.; Porter, D.; Kuokkala, V. Slurry erosion of steel—Review of tests, mechanisms and materials. Wear 2018, 408–409, 248–273. [Google Scholar] [CrossRef]
  37. Lu, B.; Luo, J. A phenomenological model for non-Faradaic material loss in flowing electrolyte without solid particle. Electrochim. Acta 2010, 56, 559–565. [Google Scholar] [CrossRef]
  38. Lu, B.T.; Mao, L.C.; Luo, J.L. Hydrodynamic effects on erosion-enhanced corrosion of stainless steel in aqueous slurries. Electrochim. Acta 2010, 56, 85–92. [Google Scholar] [CrossRef]
  39. Xie, J.; Alpas, A.T.; Northwood, D.O. Mechano-electrochemical effect between erosion and corrosion. J. Mater. Sci. 2003, 38, 4849–4856. [Google Scholar] [CrossRef]
  40. Xie, J.; Alpas, A.T.; Northwood, D.O. The effect of erosion on the electrochemical properties of AISI 1020 steel. J. Mater. Eng. Perform. 2003, 12, 77–86. [Google Scholar] [CrossRef]
  41. Naz, M.Y.; Sulaiman, S.A.; Shukrullah, S.; Ghaffar, A.; Ibrahim, K.A.; AbdEl-Salam, N.M. Development of erosion-corrosion mechanisms for the study of steel surface behavior in a sand slurry. Measurement 2017, 106, 203–210. [Google Scholar] [CrossRef]
  42. Lu, B.T.; Luo, J.L.; Guo, H.X.; Mao, L.C. Erosion-enhanced corrosion of carbon steel at passive state. Corros. Sci. 2011, 53, 432–440. [Google Scholar] [CrossRef]
  43. Zeng, L.; Guo, X.P.; Zhang, G.A. Inhibition of the erosion-corrosion of a 90° low alloy steel bend. J. Alloy Compd. 2017, 724, 827–840. [Google Scholar] [CrossRef]
  44. Eisenberg, M.; Tobias, C.W.; Wilke, C.R. Ionic mass transfer and concentration polarization at rotating electrodes. J. Electrochem. Soc. 1954, 101, 306. [Google Scholar] [CrossRef]
  45. Walsh, F.C.; Kear, G.; Nahlé, A.H.; Wharton, J.A.; Arenas, L.F. The rotating cylinder electrode for studies of corrosion engineering and protection of metals—An illustrated review. Corros. Sci. 2017, 123, 1–20. [Google Scholar] [CrossRef] [Green Version]
  46. Rajahram, S.S.; Harvey, T.J.; Wood, R.J.K. Electrochemical investigation of erosion–corrosion using a slurry pot erosion tester. Tribol. Int. 2011, 44, 232–240. [Google Scholar] [CrossRef]
  47. Efird, K.D.; Wright, E.J.; Boros, J.A.; Hailey, T.G. Correlation of steel corrosion in pipe flow with jet impingement and rotating cylinder tests. Corrosion 1993, 49, 992–1003. [Google Scholar] [CrossRef]
  48. Jiang, X.; Zheng, Y.G.; Ke, W. Effect of flow velocity and entrained sand on inhibition performances of two inhibitors for CO2 corrosion of N80 steel in 3% NaCl solution. Corros. Sci. 2005, 47, 2636–2658. [Google Scholar] [CrossRef]
  49. Choi, Y.; Nesic, S.; Ling, S. Effect of H2S on the CO2 corrosion of carbon steel in acidic solutions. Electrochim. Acta 2011, 56, 1752–1760. [Google Scholar] [CrossRef]
  50. Zhang, G.A.; Cheng, Y.F. Electrochemical corrosion of X65 pipe steel in oil/water emulsion. Corros. Sci. 2009, 51, 901–907. [Google Scholar] [CrossRef]
  51. Paolinelli, L.D.; Brown, B.; Simison, S.N.; Nesic, S. Inhibition of CO2 corrosion of carbon steel with 1% Cr. Mater. Chem. Phys. 2012, 136, 1092–1102. [Google Scholar] [CrossRef]
  52. Lu, B.T.; Luo, J.L. Correlation between surface-hardness degradation and erosion resistance of carbon steel-Effects of slurry chemistry. Tribol. Int. 2015, 83, 146–155. [Google Scholar] [CrossRef]
  53. Xu, Y.; Tan, M.Y. Probing the initiation and propagation processes of flow accelerated corrosion and erosion corrosion under simulated turbulent flow conditions. Corros. Sci. 2019, 151, 163–174. [Google Scholar] [CrossRef]
  54. Ayyagari, A.; Hasannaeimi, V.; Grewal, H.S.; Arora, H.; Mukherjee, S. Corrosion, Erosion and wear behavior of complex concentrated alloys: A Review. Metals 2018, 8, 603. [Google Scholar] [CrossRef] [Green Version]
  55. Alegría-Ortega, J.A.; Ocampo-Carmona, L.M.; Suárez-Bustamante, F.A.; Olaya-Flórez, J.J. Erosion–corrosion wear of Cr/CrN multi-layer coating deposited on AISI-304 stainless steel using the unbalanced magnetron (UBM) sputtering system. Wear 2012, 290–291, 149–153. [Google Scholar] [CrossRef]
  56. Li, Y.Y.; Wang, Z.Z.; Guo, X.P.; Zhang, G.A. Galvanic corrosion between N80 carbon steel and 13Cr stainless steel under supercritical CO2 conditions. Corros. Sci. 2019, 147, 260–272. [Google Scholar] [CrossRef]
  57. Haider, G.; Arabnejad, H.; Shirazi, S.A.; Mclaury, B.S. A mechanistic model for stochastic rebound of solid particles with application to erosion predictions. Wear 2017, 376–377, 615–624. [Google Scholar] [CrossRef]
  58. Arabnejad, H.; Mansouri, A.; Shirazi, S.A.; McLaury, B.S. Development of mechanistic erosion equation for solid particles. Wear 2015, 332–333, 1044–1050. [Google Scholar] [CrossRef]
  59. Mansouri, A.; Arabnejad, H.; Shirazi, S.A.; McLaury, B.S. A combined CFD/experimental methodology for erosion prediction. Wear 2015, 332–333, 1090–1097. [Google Scholar] [CrossRef]
  60. Toor, I.U.; Irshad, H.M.; Badr, H.M.; Samad, M.A. The effect of impingement velocity and angle variation on the erosion corrosion performance of API 5L-X65 carbon steel in a flow loop. Metals 2018, 8, 402. [Google Scholar] [CrossRef] [Green Version]
  61. Zhao, W.; Wang, C.; Zhang, T.; Yang, M.; Han, B.; Neville, A. Effects of laser surface melting on erosion–corrosion of X65 steel in liquid–solid jet impingement conditions. Wear 2016, 362–363, 39–52. [Google Scholar] [CrossRef] [Green Version]
  62. Zhang, G.A.; Cheng, Y.F. Electrochemical characterization and computational fluid dynamics simulation of flow-accelerated corrosion of X65 steel in a CO2-saturated oilfield formation water. Corros. Sci. 2010, 52, 2716–2724. [Google Scholar] [CrossRef]
  63. Zhao, Y.; Zhou, F.; Yao, J.; Dong, S.; Li, N. Erosion–corrosion behavior and corrosion resistance of AISI 316 stainless steel in flow jet impingement. Wear 2015, 328–329, 464–474. [Google Scholar] [CrossRef]
  64. Aribo, S.; Barker, R.; Hu, X.; Neville, A. Erosion–corrosion behaviour of lean duplex stainless steels in 3.5% NaCl solution. Wear 2013, 302, 1602–1608. [Google Scholar] [CrossRef]
  65. Ukpai, J.I.; Barker, R.; Hu, X.; Neville, A. Exploring the erosive wear of X65 carbon steel by acoustic emission method. Wear 2013, 301, 370–382. [Google Scholar] [CrossRef]
  66. Karimi, S.; Shirazi, S.A.; McLaury, B.S. Predicting fine particle erosion utilizing computational fluid dynamics. Wear 2017, 376–377, 1130–1137. [Google Scholar] [CrossRef]
  67. Pasha, A.; Ghasemi, H.M.; Neshati, J. Study of the pitting corrosion of superduplex stainless steel and X-65 carbon steel during erosion-corrosion by cyclic polarization technique. Corros. Eng. Sci. Technol. 2016, 51, 463–471. [Google Scholar] [CrossRef]
  68. Azarian, N.S.; Ghasemi, H.M.; Monshi, M.R. Synergistic erosion and corrosion behavior of AA5052 aluminum alloy in 3.5 wt% nacl solution under various impingement angles. J. Bio-Tribo-Corros. 2015, 1, 1–10. [Google Scholar] [CrossRef] [Green Version]
  69. Mohammadi, F.; Luo, J.; Lu, B.; Afacan, A. Single particle impingement current transients for prediction of erosion-enhanced corrosion on 304 stainless steel. Corros. Sci. 2010, 52, 2331–2340. [Google Scholar] [CrossRef]
  70. Yi, J.Z.; Hu, H.X.; Wang, Z.B.; Zheng, Y.G. On the critical flow velocity for erosion-corrosion in local eroded regions under liquid-solid jet impingement. Wear 2019, 422–423, 94–99. [Google Scholar] [CrossRef]
  71. Zhang, G.A.; Zeng, L.; Huang, H.L.; Guo, X.P. A study of flow accelerated corrosion at elbow of carbon steel pipeline by array electrode and computational fluid dynamics simulation. Corros. Sci. 2013, 77, 334–341. [Google Scholar] [CrossRef]
  72. Zeng, L.; Guo, X.P.; Zhang, G.A.; Chen, H.X. Semiconductivities of passive films formed on stainless steel bend under erosion-corrosion conditions. Corros. Sci. 2018, 144, 258–265. [Google Scholar] [CrossRef]
  73. Zeng, L.; Shuang, S.; Guo, X.P.; Zhang, G.A. Erosion-corrosion of stainless steel at different locations of a 90° elbow. Corros. Sci. 2016, 111, 72–83. [Google Scholar] [CrossRef]
  74. Li, Q.; Hu, H.; Cheng, Y.F. Corrosion of pipelines in CO2-saturated oil-water emulsion flow studied by electrochemical measurements and computational fluid dynamics modeling. J. Petrol Sci. Eng. 2016, 147, 408–415. [Google Scholar] [CrossRef]
  75. Owen, J.; Ducker, E.; Huggan, M.; Ramsey, C.; Neville, A.; Barker, R. Design of an elbow for integrated gravimetric, electrochemical and acoustic emission measurements in erosion-corrosion pipe flow environments. Wear 2019, 428–429, 76–84. [Google Scholar] [CrossRef]
  76. Liu, L.; Xu, Y.; Xu, C.; Wang, X.; Huang, Y. Detecting and monitoring erosion-corrosion using ring pair electrical resistance sensor in conjunction with electrochemical measurements. Wear 2019, 428–429, 328–339. [Google Scholar] [CrossRef]
  77. Orlikowski, J.; Darowicki, K.; Mikołajski, S. Multi-sensor monitoring of the corrosion rate and the assessment of the efficiency of a corrosion inhibitor in utility water installations. Sens. Actuators B: Chem. 2013, 181, 22–28. [Google Scholar] [CrossRef]
  78. Ryl, J.; Darowicki, K. Impedance monitoring of carbon steel cavitation erosion under the influence of corrosive factors. J. Electrochem. Soc. 2008, 155, 44. [Google Scholar] [CrossRef]
  79. Vieira, R.E.; Parsi, M.; Zahedi, P.; McLaury, B.S.; Shirazi, S.A. Electrical resistance probe measurements of solid particle erosion in multiphase annular flow. Wear 2017, 382–383, 15–28. [Google Scholar] [CrossRef]
  80. Fan, C.L.; Mclaury, B.S. Evaluation of electrical resistance probes to detect pipeline erosion and sand production in low liquid loading flow conditions. In Proceedings of the SPE International Conference, Columbus, OH, USA, 17–19 August 2011. [Google Scholar]
  81. Gan, F.; Tian, G.; Wan, Z.; Liao, J.; Li, W. Investigation of pitting corrosion monitoring using field signature method. Measurement 2016, 82, 46–54. [Google Scholar] [CrossRef]
  82. Huang, Y.; Xu, Y.; Li, B.; Ying, L.; Yang, F.; Wang, X. Novel electrical resistance method to measure underdeposit corrosion and its inhibition in pipeline steels. Corros. Eng. Sci. Technol. 2016, 51, 211–222. [Google Scholar] [CrossRef]
  83. Xu, Y.; Huang, Y.; Wang, X.; Lin, X. Experimental study on pipeline internal corrosion based on a new kind of electrical resistance sensor. Sens. Actuators B Chem. 2016, 224, 37–47. [Google Scholar] [CrossRef]
  84. Zhang, Y.; Reuterfors, E.P.; McLaury, B.S.; Shirazi, S.A.; Rybicki, E.F. Comparison of computed and measured particle velocities and erosion in water and air flows. Wear 2007, 263, 330–338. [Google Scholar] [CrossRef]
  85. Prosek, T.; Taube, M.; Dubois, F.; Thierry, D. Application of automated electrical resistance sensors for measurement of corrosion rate of copper, bronze and iron in model indoor atmospheres containing short-chain volatile carboxylic acids. Corros. Sci. 2014, 87, 376–382. [Google Scholar] [CrossRef]
  86. Xu, Y.; Li, K.; Liu, L.; Yang, L.; Wang, X.; Huang, Y. Experimental study on rebar corrosion using the galvanic sensor combined with the electronic resistance technique. Sensors 2016, 16, 1451. [Google Scholar] [CrossRef] [PubMed]
  87. Yang, Y.; Cheng, Y.F. Parametric effects on the erosion–corrosion rate and mechanism of carbon steel pipes in oil sands slurry. Wear 2012, 276–277, 141–148. [Google Scholar] [CrossRef]
  88. Birkin, P.R.; Barber, J.L. Particle induced surface erosion–Tumbling and direct impact; a high-speed electrochemical, acoustic and visual study. Wear 2019, 428–429, 147–153. [Google Scholar] [CrossRef] [Green Version]
  89. Droubi, M.G.; Reuben, R.L. Monitoring acoustic emission (AE) energy of abrasive particle impacts in a slurry flow loop using a statistical distribution model. Appl. Acoust. 2016, 113, 202–209. [Google Scholar] [CrossRef] [Green Version]
  90. Stern, M. Electrochemical polarization 2. Ferrous-Ferric electrode kinetics on stainless steel. J. Electrochem. Soc. 1957, 104, 559–563. [Google Scholar] [CrossRef]
  91. Sasaki, K.; Burstein, G.T. Erosion–corrosion of stainless steel under impingement by a fluid jet. Corros. Sci. 2007, 49, 92–102. [Google Scholar] [CrossRef]
  92. Burstein, G.T.; Organ, R.M. Repassivation and pitting of freshly generated aluminium surfaces in acidic nitrate solution. Corros. Sci. 2005, 47, 2932–2955. [Google Scholar] [CrossRef]
  93. Wang, Y.; Xing, Z.Z.; Luo, Q.; Rahman, A.; Jiao, J.; Qu, S.J.; Zheng, Y.G.; Shen, J. Corrosion and erosion–corrosion behaviour of activated combustion high-velocity air fuel sprayed Fe-based amorphous coatings in chloride-containing solutions. Corros. Sci. 2015, 98, 339–353. [Google Scholar] [CrossRef]
  94. Zheng, Z.B.; Zheng, Y.G.; Zhou, X.; He, S.Y.; Sun, W.H.; Wang, J.Q. Determination of the critical flow velocities for erosion–corrosion of passive materials under impingement by NaCl solution containing sand. Corros. Sci. 2014, 88, 187–196. [Google Scholar] [CrossRef]
  95. Zheng, Z.B.; Zheng, Y.G.; Sun, W.H.; Wang, J.Q. Effect of applied potential on passivation and erosion–corrosion of a Fe-based amorphous metallic coating under slurry impingement. Corros. Sci. 2014, 82, 115–124. [Google Scholar] [CrossRef]
  96. Zheng, Z.B.; Zheng, Y.G. Effects of surface treatments on the corrosion and erosion-corrosion of 304 stainless steel in 3.5% NaCl solution. Corros. Sci. 2016, 112, 657–668. [Google Scholar] [CrossRef]
  97. Wang, Z.B.; Zheng, Y.G.; Yi, J.Z. The role of surface film on the critical flow velocity for erosion-corrosion of pure titanium. Tribol. Int. 2019, 133, 67–72. [Google Scholar] [CrossRef]
  98. Yi, J.Z.; Hu, H.X.; Wang, Z.B.; Zheng, Y.G. Comparison of critical flow velocity for erosion-corrosion of six stainless steels in 3.5 wt% NaCl solution containing 2 wt% silica sand particles. Wear 2018, 416–417, 62–71. [Google Scholar] [CrossRef]
  99. Burstein, G.T.; Sasaki, K. The birth of corrosion pits as stimulated by slurry erosion. Corros. Sci. 2000, 42, 841–860. [Google Scholar] [CrossRef]
  100. Laleh, M.; Hughes, A.E.; Xu, W.; Gibson, I.; Tan, M.Y. Unexpected erosion-corrosion behaviour of 316L stainless steel produced by selective laser melting. Corros. Sci. 2019, 155, 67–74. [Google Scholar] [CrossRef]
  101. Poulson, B. Electrochemical measurements in flowing solutions. Corros. Sci. 1983, 23, 391–430. [Google Scholar] [CrossRef]
  102. Hoseinieh, S.M.; Homborg, A.M.; Shahrabi, T.; Mol, J.M.C.; Ramezanzadeh, B. A novel approach for the evaluation of under deposit corrosion in marine environments using combined analysis by electrochemical impedance spectroscopy and electrochemical noise. Electrochim. Acta 2016, 217, 226–241. [Google Scholar] [CrossRef]
  103. Wu, J.W.; Bai, D.; Baker, A.P.; Li, Z.H.; Liu, X.B. Electrochemical techniques correlation study of on-line corrosion monitoring probes. Mater. Corros. 2015, 66, 143–151. [Google Scholar] [CrossRef]
  104. Xu, Y.; Tan, M.Y. Visualising the dynamic processes of flow accelerated corrosion and erosion corrosion using an electrochemically integrated electrode array. Corros. Sci. 2018, 139, 438–443. [Google Scholar] [CrossRef]
  105. Xu, Y.Z.; Liu, L.; Zhou, Q.P.; Wang, X.N.; Huang, Y. Understanding the influences of pre-corrosion on the erosion-corrosion performance of pipeline steel. Wear 2020, 442–443, 203151. [Google Scholar] [CrossRef]
  106. Xie, J.; Alpas, A.T.; Northwood, D.O. The role of heat treatment on the erosion–corrosion behavior of AISI 52100 steel. Mater. Sci. Eng. A 2005, 393, 42–50. [Google Scholar] [CrossRef]
  107. Islam, M.A.; Farhat, Z.N. Effect of impact angle and velocity on erosion of API X42 pipeline steel under high abrasive feed rate. Wear 2014, 311, 180–190. [Google Scholar] [CrossRef]
  108. Islam, M.A.; Alam, T.; Farhat, Z.N.; Mohamed, A.; Alfantazi, A. Effect of microstructure on the erosion behavior of carbon steel. Wear 2015, 332–333, 1080–1089. [Google Scholar] [CrossRef]
  109. Xie, Y.; Jiang, J.J.; Islam, M.A. Elastomers and plastics for resisting erosion attack of abrasive/erosive slurries. Wear 2019, 426–427, 612–619. [Google Scholar] [CrossRef]
  110. Islam, M.A.; Farhat, Z. Erosion-corrosion mechanism and comparison of erosion-corrosion performance of API steels. Wear 2017, 376–377, 533–541. [Google Scholar] [CrossRef]
  111. Aminul Islam, M.; Farhat, Z.N.; Ahmed, E.M.; Alfantazi, A.M. Erosion enhanced corrosion and corrosion enhanced erosion of API X-70 pipeline steel. Wear 2013, 302, 1592–1601. [Google Scholar] [CrossRef]
  112. Islam, M.A.; Jiang, J.J.; Xie, Y.; Fiala, P. Investigation of erosion-corrosion behavior of (WTi)C based weld overlays. Wear 2017, 390–391, 155–165. [Google Scholar] [CrossRef]
  113. Islam, M.A.; Farhat, Z.N. The influence of porosity and hot isostatic pressing treatment on wear characteristics of cast and P/M aluminum alloys. Wear 2011, 271, 1594–1601. [Google Scholar] [CrossRef]
  114. Haseeb, A.S.M.A.; Islam, M.A.; Bepari, M.M.A. Tribological behaviour of quenched and tempered, and austempered ductile iron at the same hardness level. Wear 2000, 244, 15–19. [Google Scholar] [CrossRef]
  115. Islam, M.A. Erosion, Corrosion and Erosion-Corrosion of Oil and Gas Pipeline Steels. Ph.D. Thesis, Dalhousie University, Halifax, NS, Canada, 2015. [Google Scholar]
  116. Islam, M.A.; Farhat, Z.N. Mechanical and electrochemical synergism of API X42 pipeline steel during erosion–corrosion. J. Bio-Tribo-Corros. 2015, 1, 1–26. [Google Scholar]
  117. Burstein, G.T.; Liu, C. Depassivation current transients measured between identical twin microelectrodes in open circuit. Corros. Sci. 2008, 50, 2–7. [Google Scholar] [CrossRef]
  118. Wharton, J.A.; Wood, R.J.K. Influence of flow conditions on the corrosion of AISI 304L stainless steel. Wear 2004, 256, 525–536. [Google Scholar] [CrossRef]
  119. Xu, Y.Z.; He, L.M.; Yang, L.J.; Wang, X.N.; Huang, Y. Electrochemical study of steel corrosion in saturated calcium hydroxide solution with chloride ions and sulfate ions. Corrosion 2018, 74, 1063–1082. [Google Scholar] [CrossRef]
  120. Burstein, G.T.; Sasaki, K. Effect of impact angle on the slurry erosion–corrosion of 304L stainless steel. Wear 2000, 240, 80–94. [Google Scholar] [CrossRef]
  121. Wei, L.; Pang, X.; Gao, K. Effect of flow rate on localized corrosion of X70 steel in supercritical CO2 environments. Corros. Sci. 2018, 136, 339–351. [Google Scholar] [CrossRef]
  122. Song, G.D.; Jeon, S.; Son, Y.; Kim, J.G.; Hur, D.H. Galvanic effect of magnetite on the corrosion behavior of carbon steel in deaerated alkaline solutions under flowing conditions. Corros. Sci. 2018, 131, 71–80. [Google Scholar] [CrossRef]
  123. Sasaki, K.; Burstein, G.T. Observation of a threshold impact energy required to cause passive film rupture during slurry erosion of stainless steel. Phil. Mag. Lett. 2000, 80, 489–493. [Google Scholar] [CrossRef]
  124. Hu, X.; Neville, A. An examination of the electrochemical characteristics of two stainless steels (UNS S32654 and UNS S31603) under liquid–solid impingement. Wear 2004, 256, 537–544. [Google Scholar] [CrossRef]
  125. Lindsley, B.A.; Marder, A.R. The effect of velocity on the solid particle erosion rate of alloys. Wear 1999, 225, 510–516. [Google Scholar] [CrossRef]
  126. Guo, H.; Lu, B.; Luo, J. Response of surface mechanical properties to electrochemical dissolution determined by in situ nanoindentation technique. Electrochem. Commun. 2006, 8, 1092–1098. [Google Scholar] [CrossRef]
Figure 1. The metal loss is dominated by (a) erosion and (b) corrosion.
Metals 10 00180 g001
Figure 2. Typical rotating disc/cylinder electrode systems used for erosion-corrosion (a) with the electrode acting as the rotating cylinder [9], adapted from [9], with permission from Elsevier, 2006 and (b) with the electrode being arranged at the edge of the disc [55], adapted from [55], with permission from Elsevier, 2012.
Metals 10 00180 g002
Figure 3. Schematic diagram of the slurry jet impingement rig system.
Metals 10 00180 g003
Figure 4. The typical flow distribution below a slurry jet rig: (a) computational fluid dynamics (CFD) simulation results of the velocity counter of the water flow beneath the jet (14 m/s); (b) liquid flow streamlines under the nozzle; (c) particle trajectories corresponding to the liquid flow [59], adapted from [59], with permission from Elsevier, 2015.
Metals 10 00180 g004
Figure 5. The photo of a steel sample with observed different wear morphologies at three regions in combination with the CFD predictions of particle motion [61], adapted from [61], with permission from Elsevier, 2016.
Metals 10 00180 g005
Figure 6. A test flow loop used for the erosion-corrosion behavior around of the pipe circle and the CFD simulation results of the flow velocity, wall shear stress, and sand concentration distribution around the pipe circle under 1.5 m/s flow rate [76], adapted from [76], with permission from Elsevier, 2019.
Metals 10 00180 g006
Figure 7. Schematic diagram of a test flow loop used for the erosion-corrosion study of the elbow (a), and the arrangement of the sensor system at the elbow (b) [75], adapted from [75], with permission from Elsevier, 2019.
Metals 10 00180 g007
Figure 8. The erosion-corrosion probe using electrical resistance (ER) measurement (a), and the schematic diagram of the ER technique (b).
Metals 10 00180 g008
Figure 9. The arrangement of ER probes for erosion-corrosion measurement at different pipe locations.
Metals 10 00180 g009
Figure 10. The modified electrical resistance technique used for localized corrosion monitoring in pipeline working conditions: (a) field signature method (FSM) [81], adapted from [81], with permission from Elsevier, 2016; (b) ring pair electrical resistance sensor (RPERS) [82] adapted from [82], with permission from Taylor & Francis, 2016.
Metals 10 00180 g010
Figure 11. The anodic transitions induced by sand impingements.
Metals 10 00180 g011
Figure 12. Ring form electrode sensor system used for the study of erosion-corrosion in a test flow loop (a), the protrusion in the pipe (b), and the two-electrode system used for linear polarization resistance (LPR) measurement (c) [14], adapted from [14], with permission from Elsevier, 2007.
Metals 10 00180 g012
Figure 13. The design of the ring form ER sensor array (a) and the measurement circuit of the sensor system (b) [76], adapted from [76], with permission from Elsevier, 2019.
Metals 10 00180 g013
Figure 14. The arrangement of the electrodes at different locations of the elbow (a), and the three-dimensional contour of erosion rate (b) and sand concentration calculated by CFD (c) [6], adapted from [6], with permission from Elsevier, 2014.
Metals 10 00180 g014
Figure 15. Photos of the wire beam electrodes (WBEs) and coupons after 20 h of exposure to different flow-accelerated corrosion (FAC) (a,b) and erosion-corrosion (c) conditions, and local three-dimensional (3D) surface profilometry images of typical coupon areas [104], adapted from [104], with permission from Elsevier, 2019.
Metals 10 00180 g015
Figure 16. SEM micrographs of API X100: (a) surface morphology after erosion-corrosion; (b) micro-forging due to abrasive particle impact; (c) preferential dissolution of matrix around an embedded particle; (d) pitting corrosion due to the breakdown of corrosion film [110], adapted from [110], with permission from Elsevier, 2017.
Metals 10 00180 g016
Figure 17. Potentiodynamic polarization curves for commercial and selective laser melting (SLM)-produced 316L SS, recorded in 0.6 M NaCl solution (a), and the erosion-corrosion performance of commercial and SLM-produced 316L SS under +100 mV anodic polarization in slurries with different flow rates (b) [100], adapted from [100], with permission from Elsevier, 2019.
Metals 10 00180 g017
Figure 18. Schematic illustration of the electrochemical response to multi-particle impingements.
Metals 10 00180 g018
Figure 19. Comparison of the hardness of iron tested by in situ and ex situ methods: (a) load-depth curves, and (b) hardness vs. contact depth [126], adapted from [126], with permission from Elsevier, 2006.
Metals 10 00180 g019
Figure 20. Focused ion beam (FIB) SEM images of cross-sections measured after (a) 30-min erosion tests, (b) 30-min erosion-corrosion tests, (c) 240-min erosion tests, and (d) 240-min erosion-corrosion tests [17], adapted from [17], with permission from Elsevier, 2018.
Metals 10 00180 g020
Figure 21. The current distribution maps measured from WBE exposed to electrolytes under different flowing conditions: (a) electrolyte under 1000 rpm stirring, (b) electrolyte under 2000 rpm stirring, and (c) electrolyte under 2000 rpm stirring with 10% sand addition [53], adapted from [53], with permission from Elsevier, 2019.
Metals 10 00180 g021
Figure 22. Schematic diagram of the erosion-corrosion propagation and the local SEM image in the flowing conditions (a) without sand particles and (b) with sand particles [53], adapted from [53], with permission from Elsevier, 2019.
Metals 10 00180 g022
Table 1. Critical flow velocity measured by potentiostatic test (Vp), mass loss measurement (Vm), and surface roughness measurement (Vr) under impingement by 3.5 wt.% NaCl solution with 2 wt.% silica sand particles [98].
MaterialsVp (m/s)Vr (m/s)Vm (m/s)
2Cr13 SS1211–1311–13
304 SS1211–1311–13
316 SS1212–1412–14
2205 DSS1312–1412–14
2507 DSS1312–1412–14
254 SMO SS1413–1513–15

