Low-Cost Carbon Fibre Derived from Sustainable Coal Tar Pitch and Polyacrylonitrile: Fabrication and Characterisation

 , , ,
, , ,
Abstract
:1. Introduction
2. Materials and Methods
2.1. Materials
2.2. Extraction of CTP
2.3. Preparation of Electrospinning Solutions
2.4. Electrospinning of the Solutions
2.5. Stabilisation and Carbonisation of the Fibres
2.6. Characterisations
3. Results
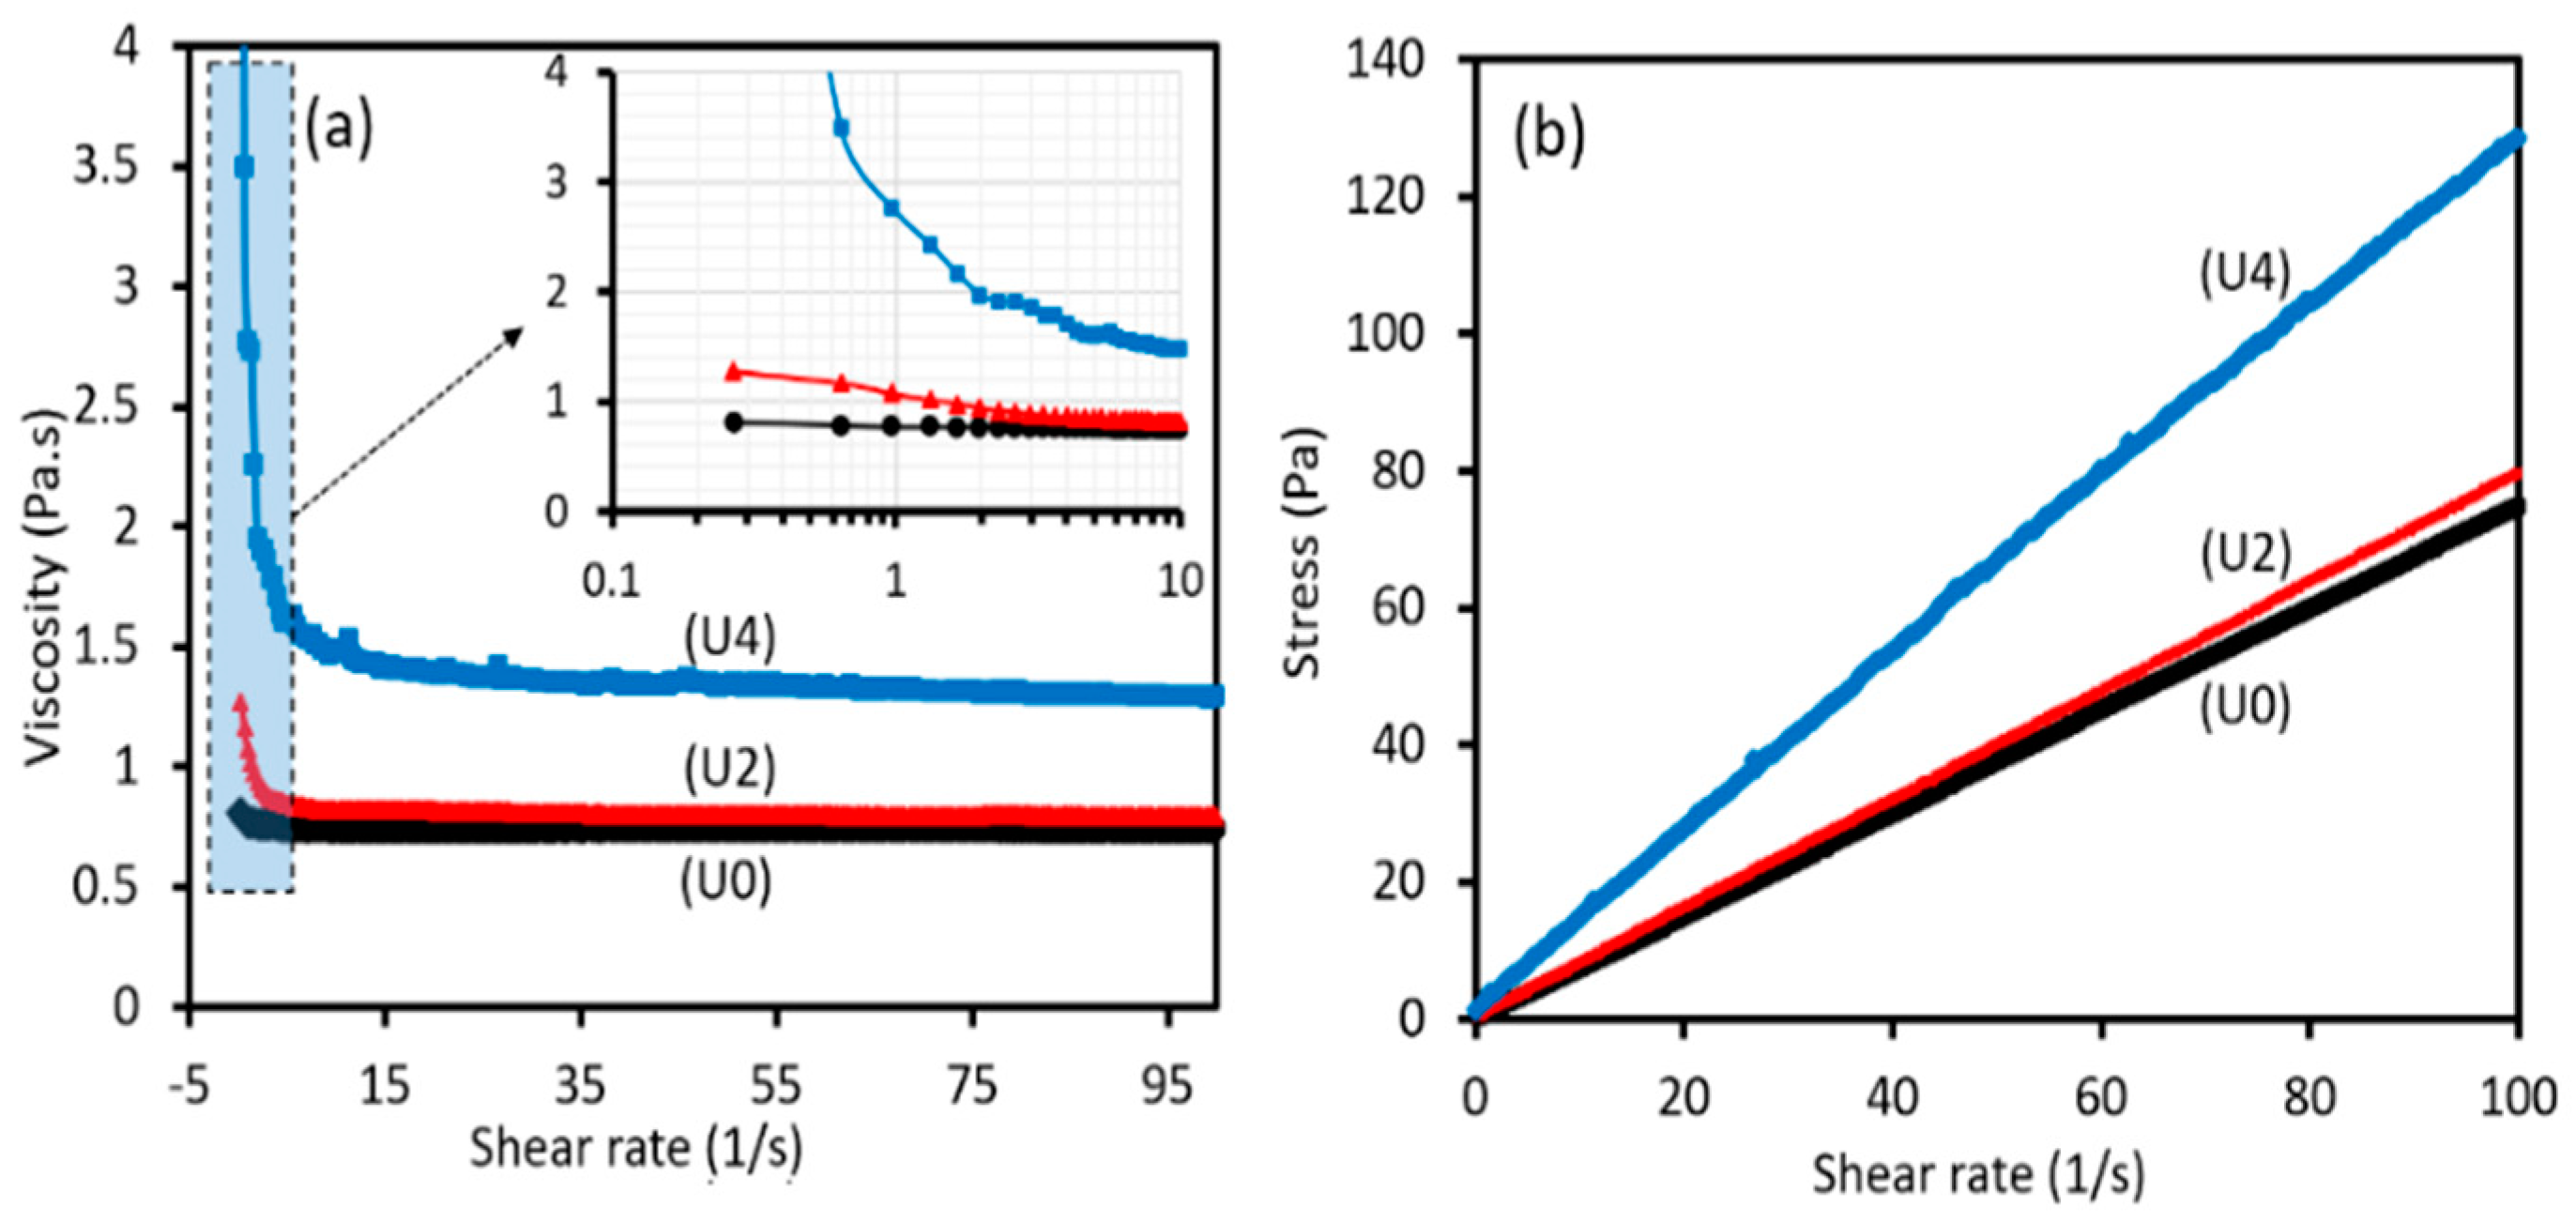
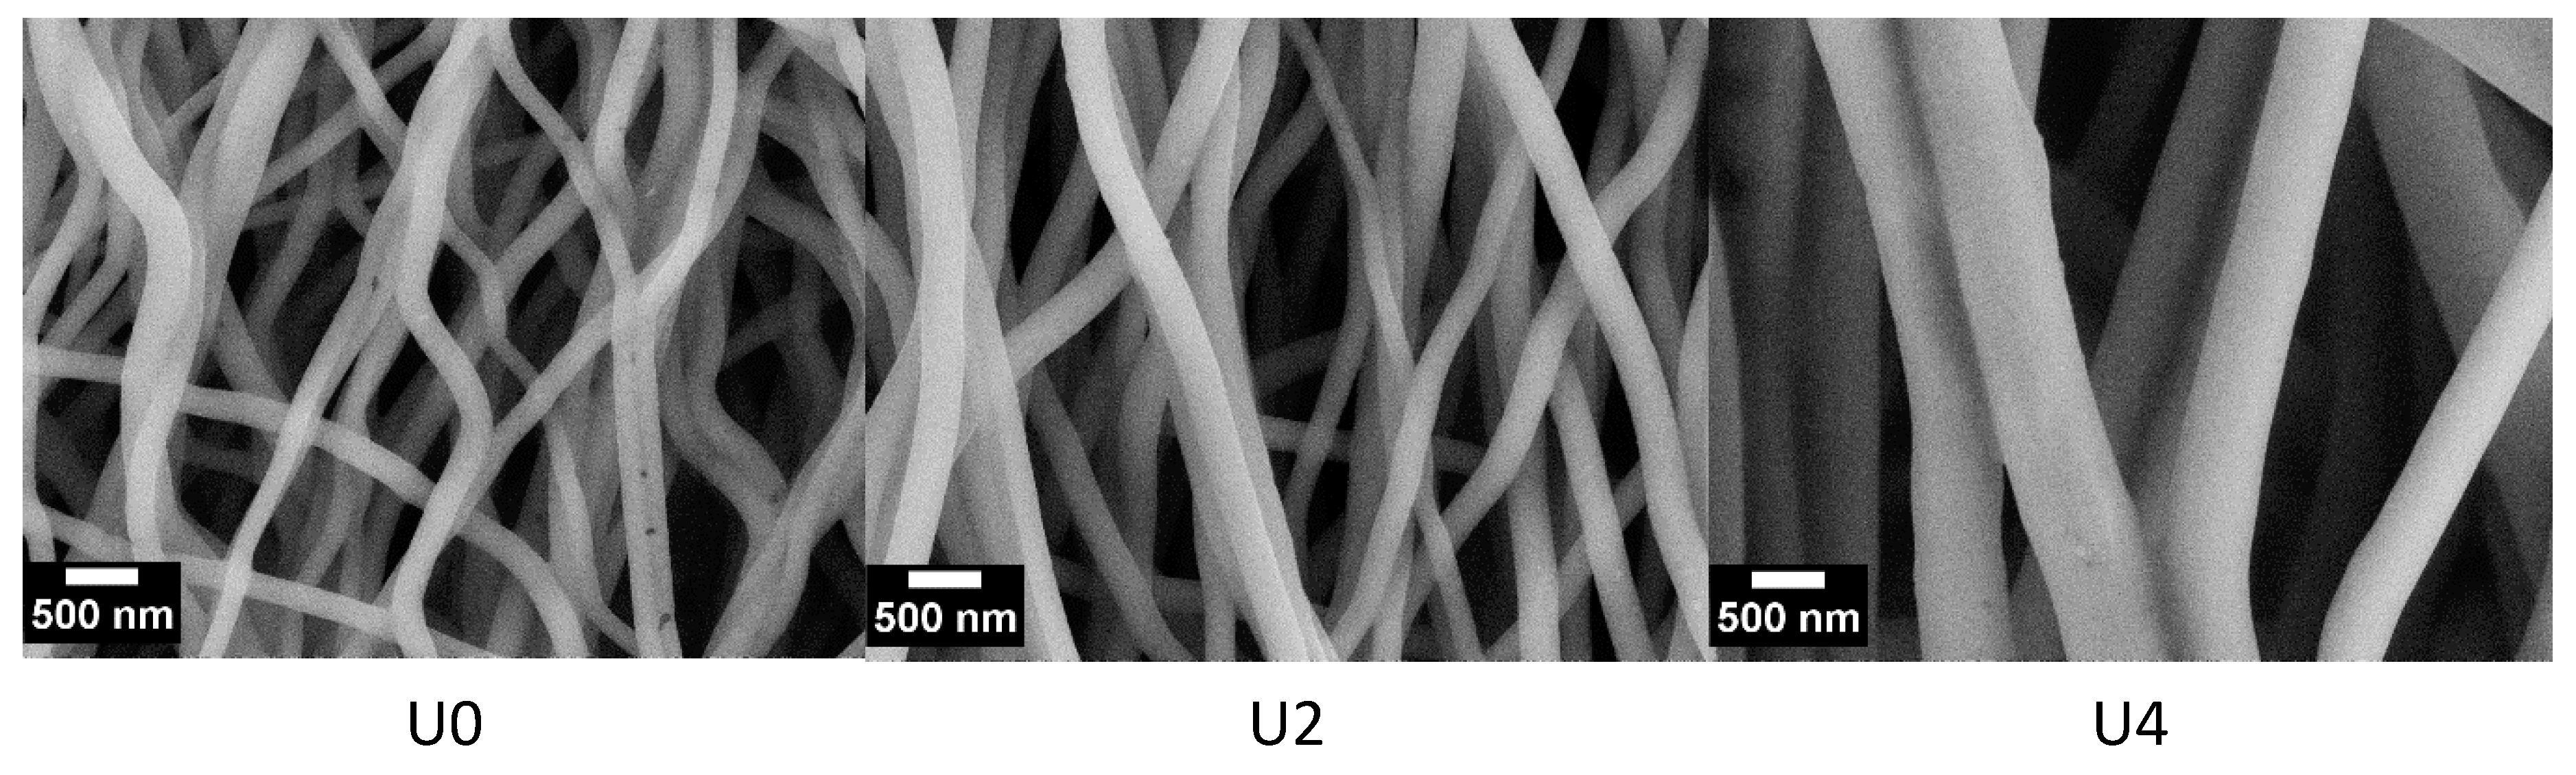
3.1. Spinnability
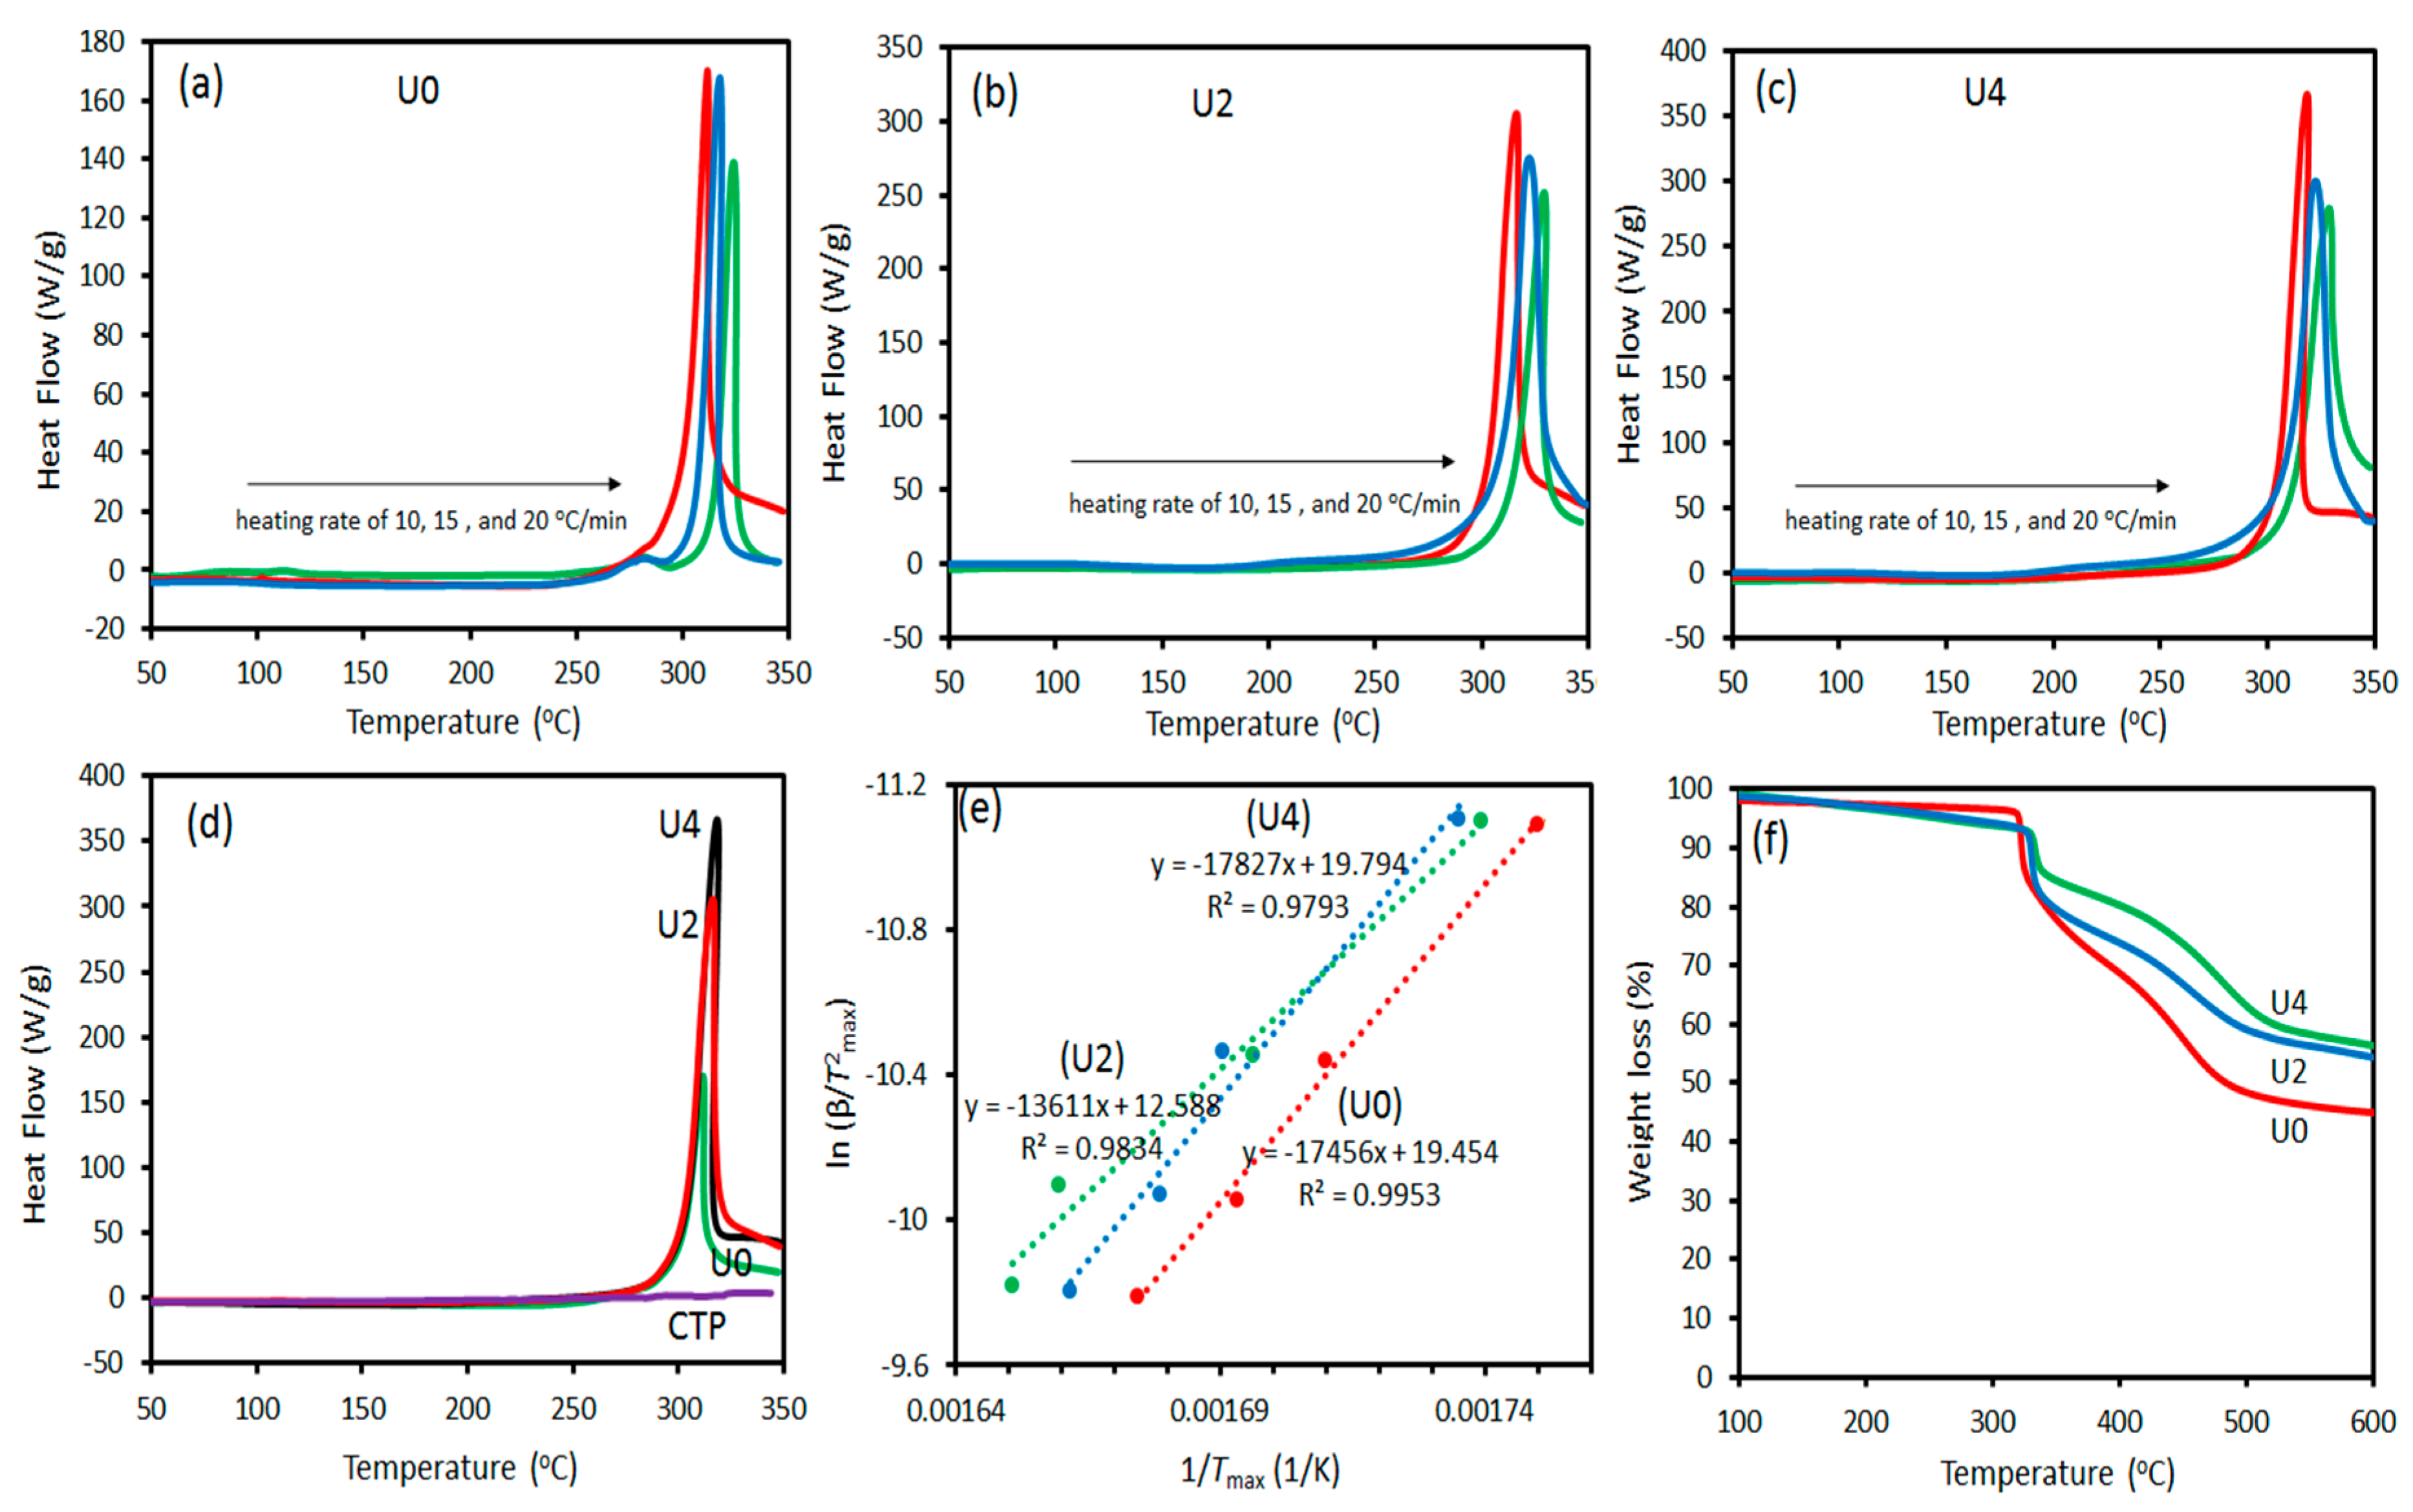
3.2. Thermal Analyses
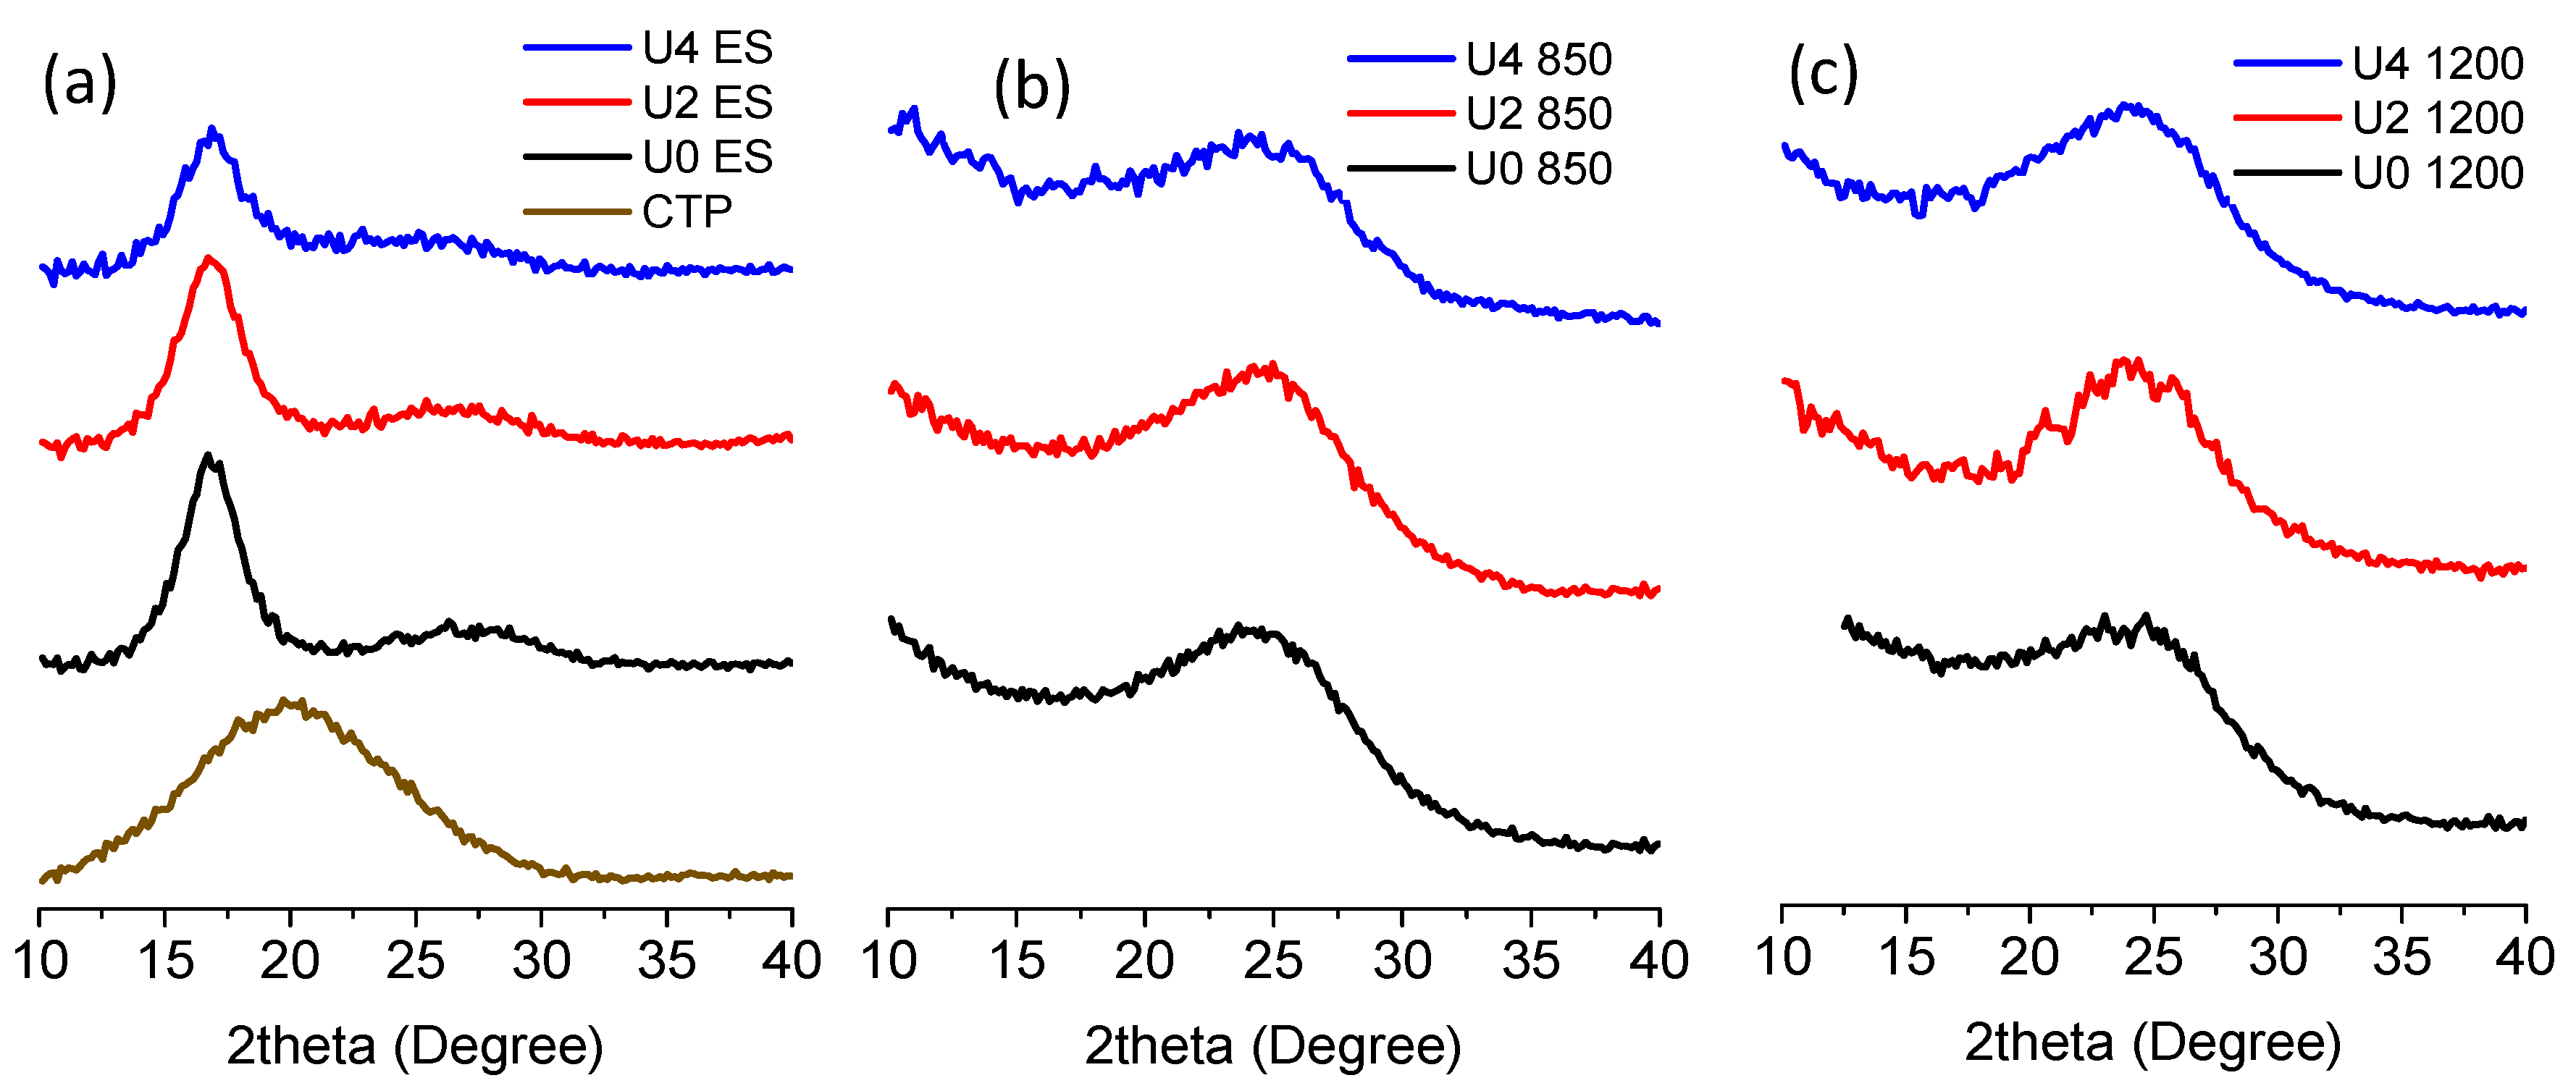
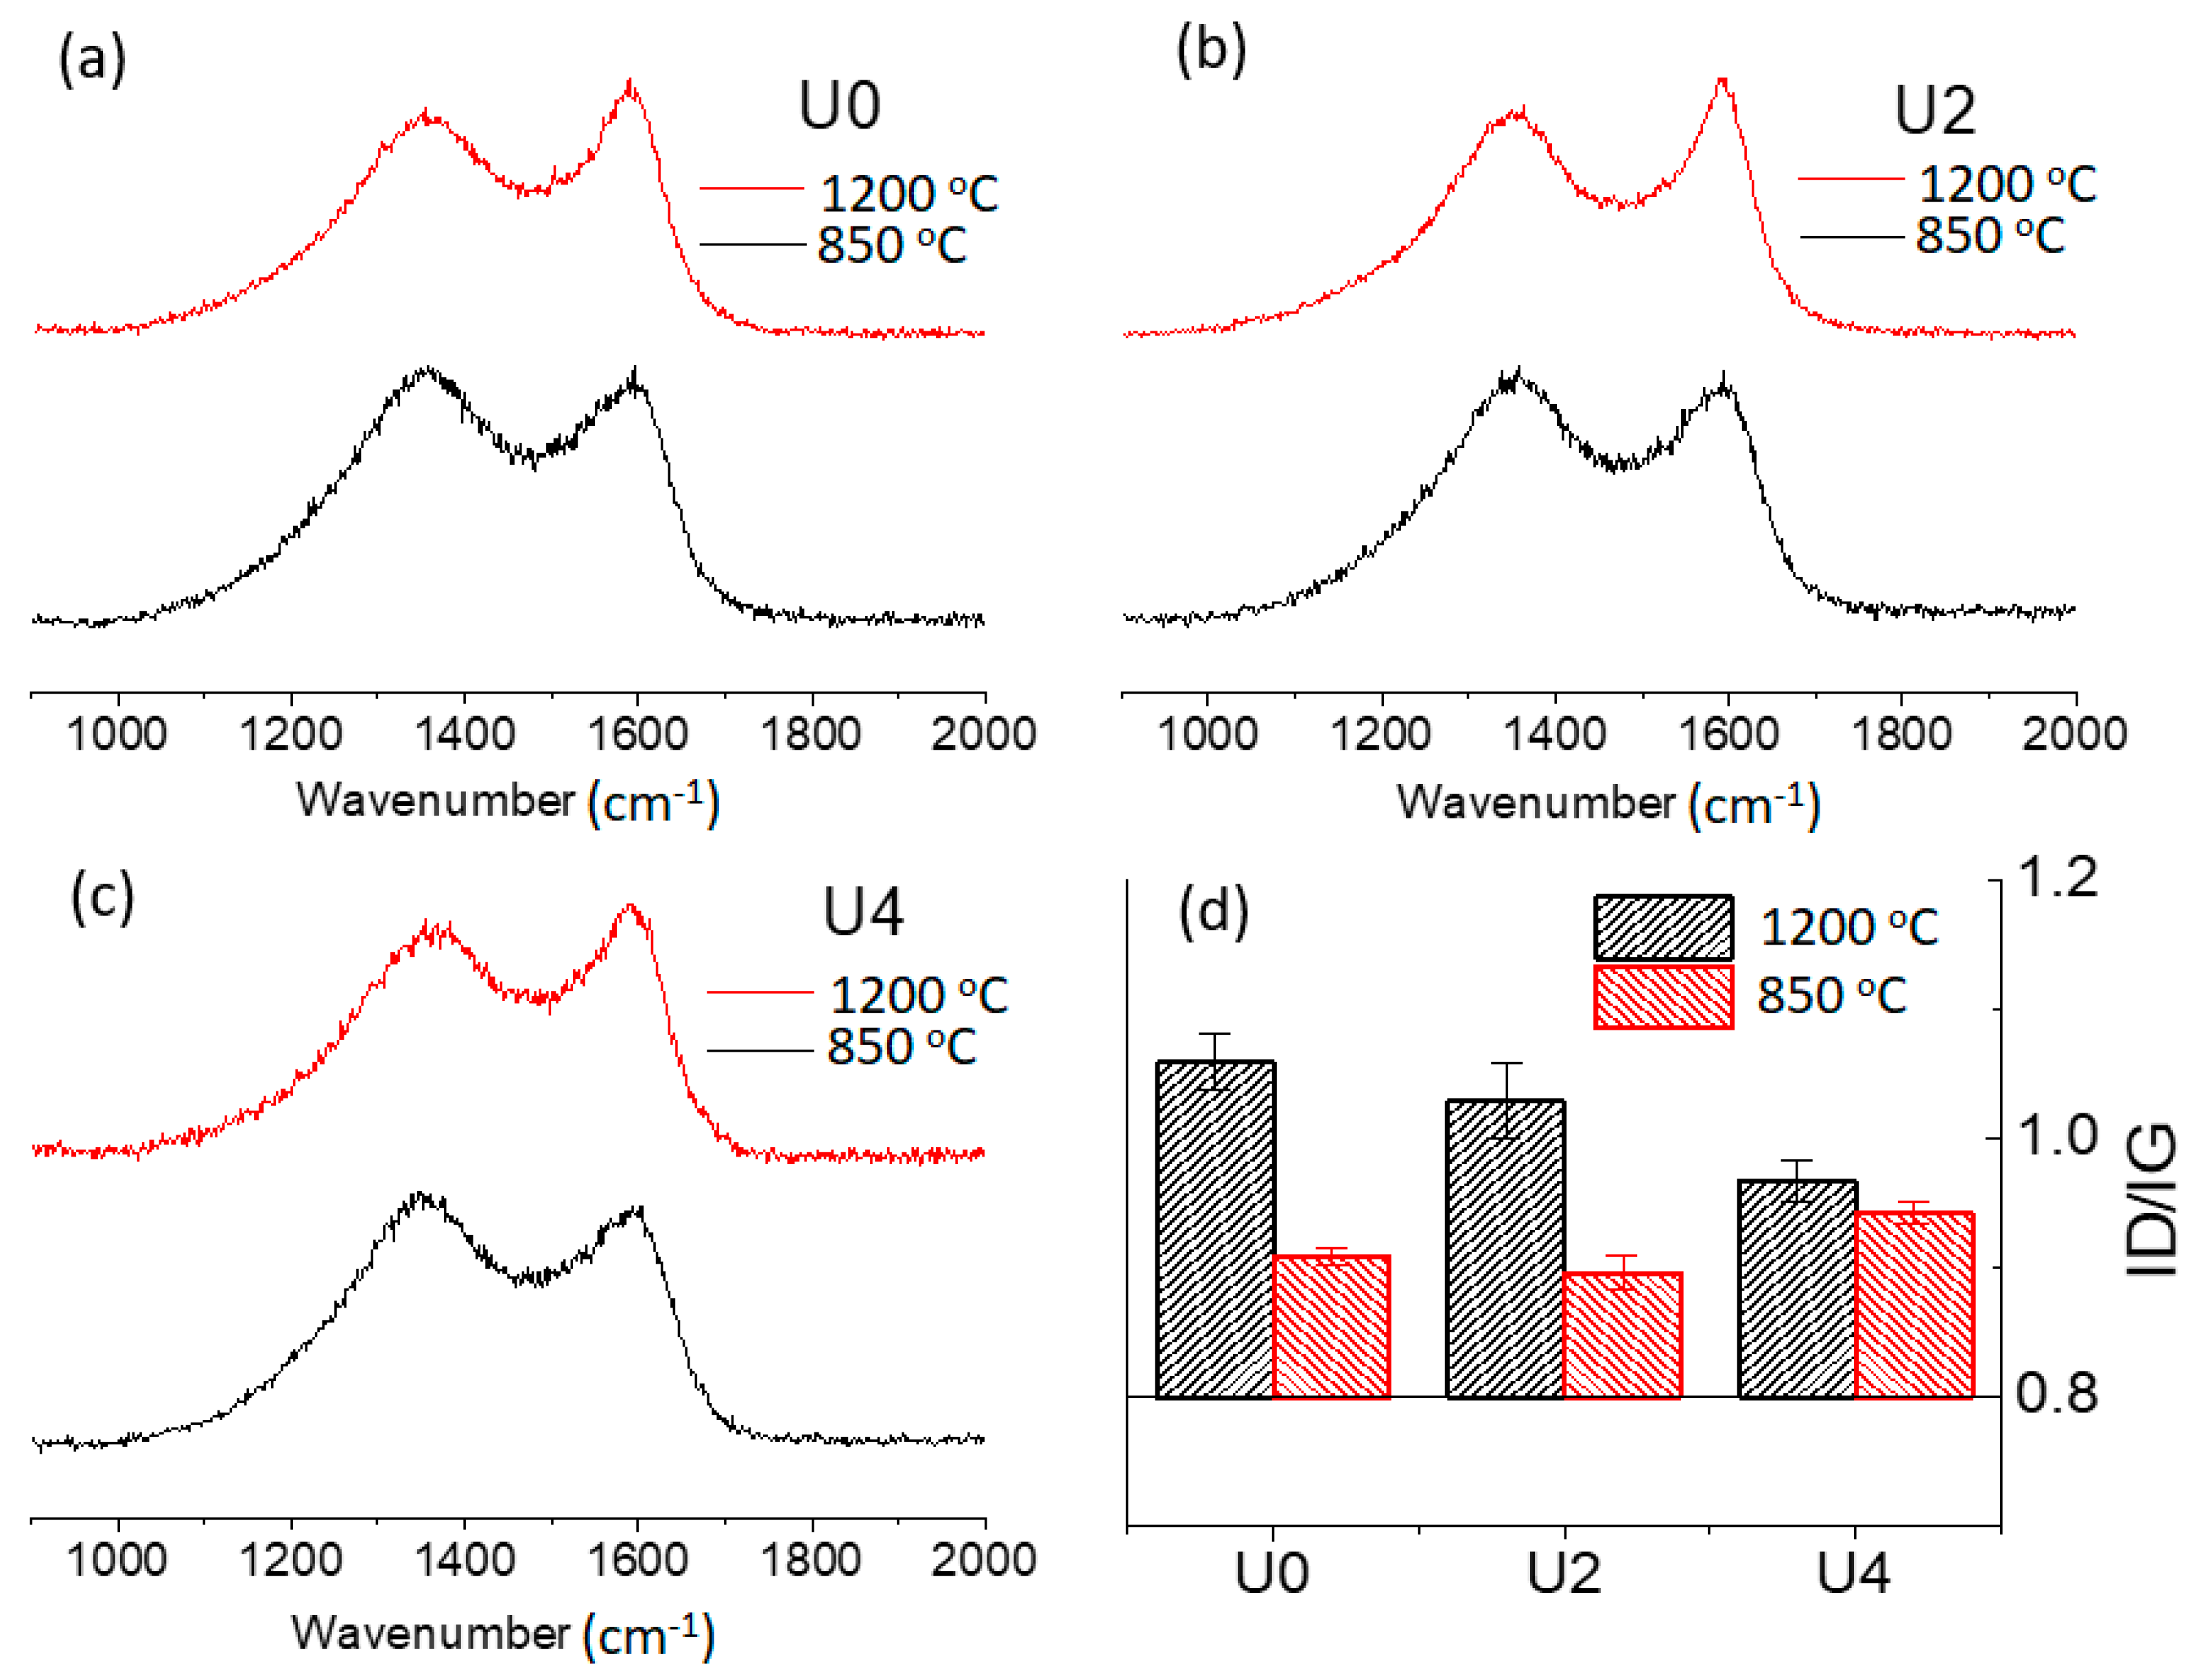
3.3. Crystallographic Structures
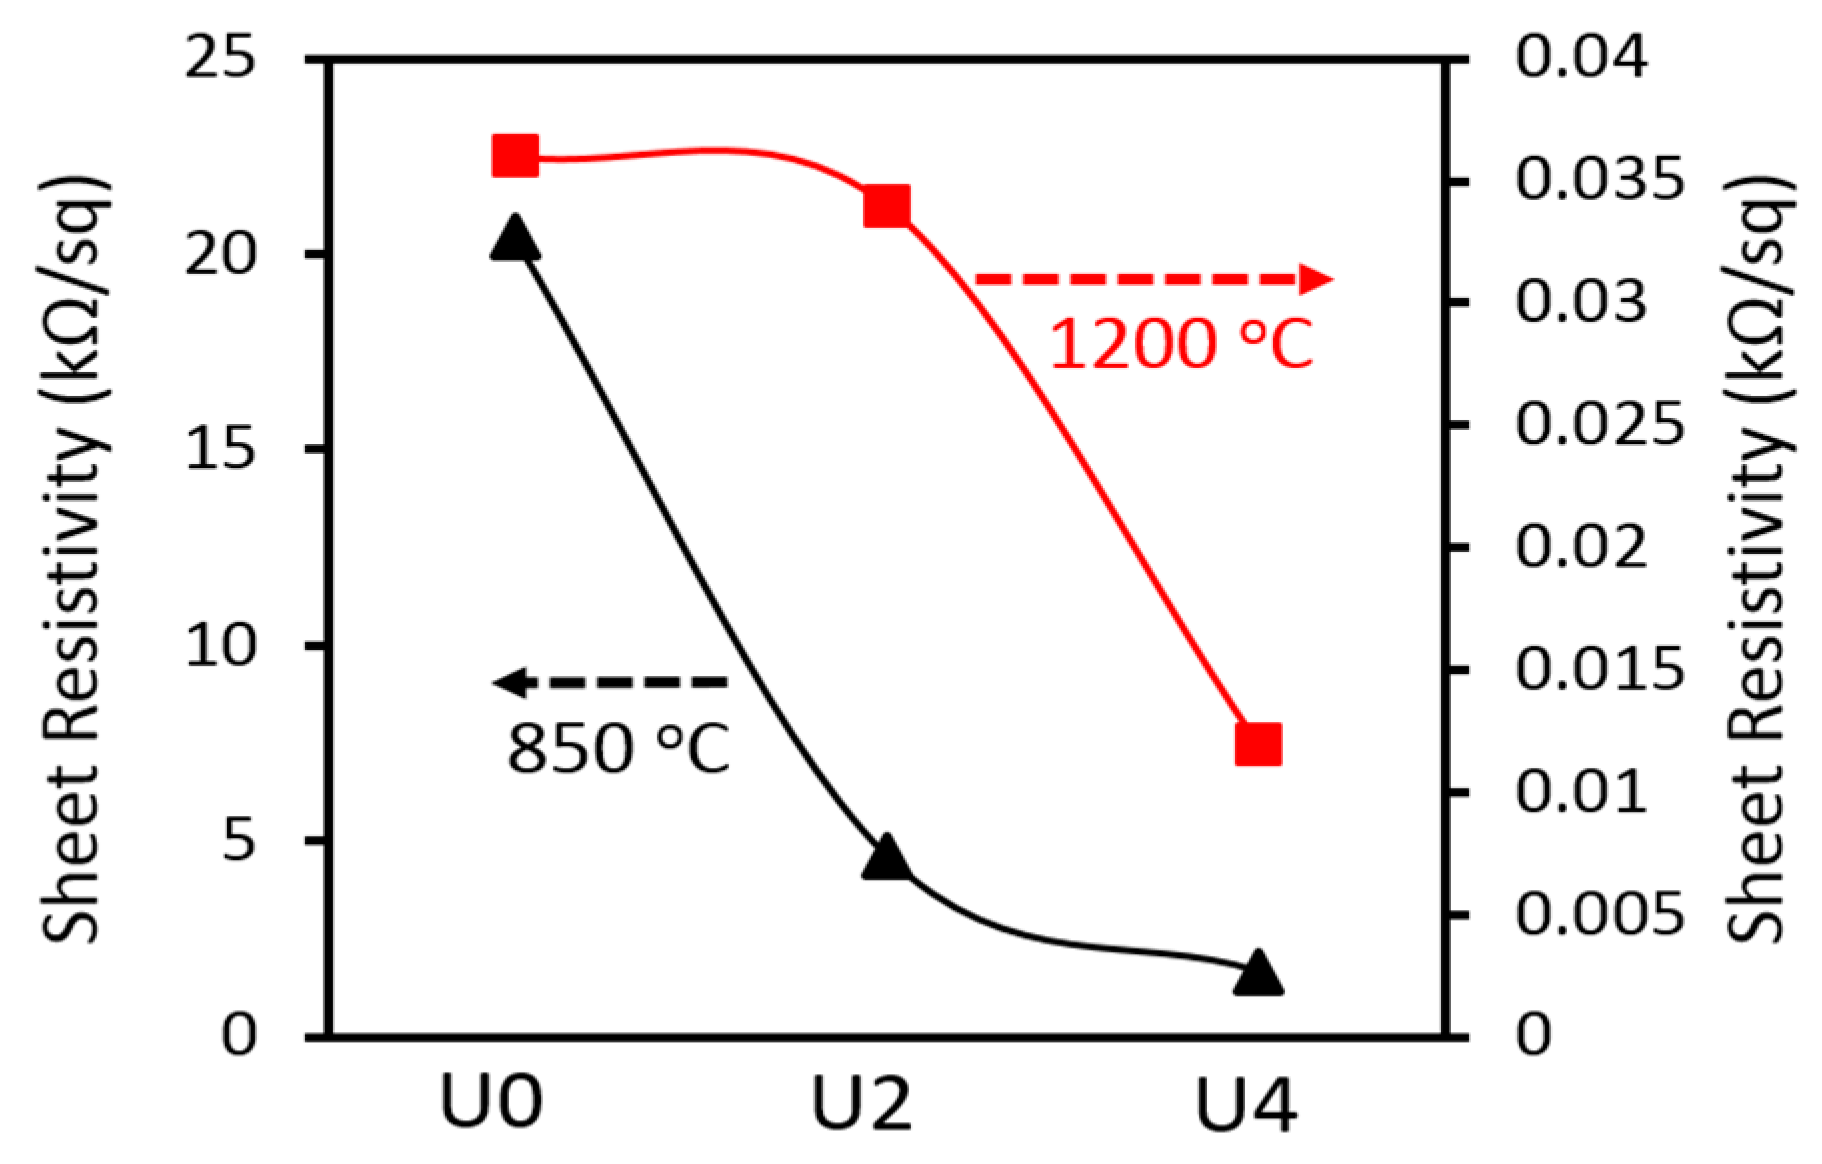
3.4. Electrical Resistivity
4. Conclusions
Author Contributions
Funding
Acknowledgments
Conflicts of Interest
References
- Huson, M.G. 3-High-performance pitch-based carbon fibers. In Structure and Properties of High-Performance Fibers; Bhat, G., Ed.; Woodhead Publishing: Oxford, UK, 2017; pp. 31–78. [Google Scholar]
- Hiremath, N.; Evora, M.C.; Naskar, A.K.; Mays, J.; Bhat, G. Polyacrylonitrile nanocomposite fibers from acrylonitrile-grafted carbon nanofibers. Compos. Part B Eng. 2017, 130, 64–69. [Google Scholar] [CrossRef]
- Hiremath, N.; Mays, J.; Bhat, G. Recent Developments in Carbon Fibers and Carbon Nanotube-Based Fibers: A Review. Polym. Rev. 2017, 57, 339–368. [Google Scholar] [CrossRef]
- Ogale, A.A.; Zhang, M.; Jin, J. Recent advances in carbon fibers derived from biobased precursors. J. Appl. Polym. Sci. 2016, 133. [Google Scholar] [CrossRef] [Green Version]
- Holmes, M. Lowering the cost of carbon fiber. Reinf. Plast. 2017, 61, 279–283. [Google Scholar] [CrossRef]
- Baker, D.A.; Rials, T.G. Recent advances in low-cost carbon fiber manufacture from lignin. J. Appl. Polym. Sci. 2013, 130, 713–728. [Google Scholar] [CrossRef] [Green Version]
- Bermudez, V.; Lukubira, S.; Ogale, A.A. 1.3 Pitch Precursor-Based Carbon Fibers. In Comprehensive Composite Materials II; Beaumont, P.W.R., Zweben, C.H., Eds.; Elsevier: Oxford, UK, 2018; pp. 41–65. [Google Scholar]
- Wazir, A.H.; Kakakhel, L. Preparation and characterization of pitch-based carbon fibers. New Carbon Mater. 2009, 24, 83–88. [Google Scholar] [CrossRef]
- Stojanovska, E.; Pampal, E.S.; Kilic, A.; Quddus, M.; Candan, Z. Developing and characterization of lignin-based fibrous nanocarbon electrodes for energy storage devices. Compos. Part B Eng. 2019, 158, 239–248. [Google Scholar] [CrossRef]
- Oroumei, A.; Fox, B.; Naebe, M. Thermal and Rheological Characteristics of Biobased Carbon Fiber Precursor Derived from Low Molecular Weight Organosolv Lignin. ACS Sustain. Chem. Eng. 2015, 3, 758–769. [Google Scholar] [CrossRef]
- Chatterjee, S.; Saito, T. Lignin-Derived Advanced Carbon Materials. ChemSusChem 2015, 8, 3941–3958. [Google Scholar] [CrossRef]
- Oroumei, A.; Naebe, M. Mechanical property optimization of wet-spun lignin/polyacrylonitrile carbon fiber precursor by response surface methodology. Fibers Polym. 2017, 18, 2079–2093. [Google Scholar] [CrossRef]
- Das, S.; Warren, J.A.; West, D.; Schexnayder, S.M. Global Carbon Fiber Composites. Supply Chain Competitiveness Analysis; Oak Ridge National Laboratory (ORNL): Oak Ridge, TN, USA, 2016.
- Park, S.H.; Kim, C.; Yang, K.S. Preparation of carbonized fiber web from electrospinning of isotropic pitch. Synth. Met. 2004, 143, 175–179. [Google Scholar] [CrossRef]
- Liu, C.; Lafdi, K. Fabrication and characterization of carbon nanofibers from polyacrylonitrile/pitch blends. J. Appl. Polym. Sci. 2017, 134, 45388. [Google Scholar] [CrossRef]
- Heo, Y.-J.; Lee, H.I.; Lee, J.W.; Park, M.; Rhee, K.Y.; Park, S.-J. Optimization of the pore structure of PAN-based carbon fibers for enhanced supercapacitor performances via electrospinning. Compos. Part B Eng. 2019, 161, 10–17. [Google Scholar] [CrossRef]
- Bui, N.-N.; Kim, B.-H.; Yang, K.S.; Cruz, M.E.D.; Ferraris, J.P. Activated carbon fibers from electrospinning of polyacrylonitrile/pitch blends. Carbon 2009, 47, 2538–2539. [Google Scholar] [CrossRef]
- Liu, C.-K.; Lai, K.; Liu, W.; Yao, M.; Sun, R.-J. Preparation of carbon nanofibres through electrospinning and thermal treatment. Polym. Int. 2009, 58, 1341–1349. [Google Scholar] [CrossRef]
- Inagaki, M.; Yang, Y.; Kang, F. Carbon Nanofibers Prepared via Electrospinning. Adv. Mater. 2012, 24, 2547–2566. [Google Scholar] [CrossRef]
- Park, S.H.; Kim, C.; Choi, Y.O.; Yang, K.S. Preparations of pitch-based CF/ACF webs by electrospinning. Carbon 2003, 41, 2655–2657. [Google Scholar] [CrossRef]
- Yang, J.; Nakabayashi, K.; Miyawaki, J.; Yoon, S.-H. Preparation of pitch based carbon fibers using Hyper-coal as a raw material. Carbon 2016, 106, 28–36. [Google Scholar] [CrossRef]
- Stanger, R.; Tran, Q.A.; Browne, M.; Lucas, J.; Naebe, M.; Height, M.; Wall, T. Evaluating the Thermal Extrusion Behavior of a Coking Coal for Direct Carbon Fiber Production. Energy Fuels 2018, 32, 4528–4537. [Google Scholar] [CrossRef]
- Xiong, X.; Luo, W.; Hu, X.; Chen, C.; Qie, L.; Hou, D.; Huang, Y. Flexible membranes of MoS2/C nanofibers by electrospinning as binder-free anodes for high-performance sodium-ion batteries. Sci. Rep. 2015, 5, 9254. [Google Scholar] [CrossRef]
- Miao, Y.-E.; Huang, Y.; Zhang, L.; Fan, W.; Lai, F.; Liu, T. Electrospun porous carbon nanofiber@ MoS2 core/sheath fiber membranes as highly flexible and binder-free anodes for lithium-ion batteries. Nanoscale 2015, 7, 11093–11101. [Google Scholar] [CrossRef]
- Jeong, J.H.; Kim, B.-H. Electrospun porous carbon nanofibers with controllable pore sizes by boron trioxide for electrochemical capacitor electrodes. J. Taiwan Inst. Chem. Eng. 2018, 84, 179–187. [Google Scholar] [CrossRef]
- Lai, C.-C.; Lo, C.-T. Preparation of nanostructural carbon nanofibers and their electrochemical performance for supercapacitors. Electrochim. Acta 2015, 183, 85–93. [Google Scholar] [CrossRef]
- Faccini, M.; Borja, G.; Boerrigter, M.; Martín, D.M.; Crespiera, S.M.; Vázquez-Campos, S.; Aubouy, L.; Amantia, D. Electrospun carbon nanofiber membranes for filtration of nanoparticles from water. J. Nanomater. 2015, 2015, 247471. [Google Scholar] [CrossRef]
- Zhang, P.; Shao, C.; Zhang, Z.; Zhang, M.; Mu, J.; Guo, Z.; Liu, Y. In situ assembly of well-dispersed Ag nanoparticles (AgNPs) on electrospun carbon nanofibers (CNFs) for catalytic reduction of 4-nitrophenol. Nanoscale 2011, 3, 3357–3363. [Google Scholar] [CrossRef]
- Deitzel, J.M.; Kleinmeyer, J.; Harris, D.; Tan, N.C.B. The effect of processing variables on the morphology of electrospun nanofibers and textiles. Polymer 2001, 42, 261–272. [Google Scholar] [CrossRef]
- Baumgarten, P.K. Electrostatic spinning of acrylic microfibers. J. Colloid Interface Sci. 1971, 36, 71–79. [Google Scholar] [CrossRef]
- Fang, W.; Yang, S.; Yuan, T.-Q.; Charlton, A.; Sun, R.-C. Effects of Various Surfactants on Alkali Lignin Electrospinning Ability and Spun Fibers. Ind. Eng. Chem. Res. 2017, 56, 9551–9559. [Google Scholar] [CrossRef]
- Morris, E.A.; Weisenberger, M.C. Solution Spinning of PAN-Based Polymers for Carbon Fiber Precursors. Polym. Precursor Deriv. Carbon Am. Chem. Soc. 2014, 1173, 189–213. [Google Scholar]
- Zhang, D.; Karki, A.B.; Rutman, D.; Young, D.P.; Wang, A.; Cocke, D.; Ho, T.H.; Guo, Z. Electrospun polyacrylonitrile nanocomposite fibers reinforced with Fe3O4 nanoparticles: Fabrication and property analysis. Polymer 2009, 50, 4189–4198. [Google Scholar] [CrossRef]
- Giray, D.; Balkan, T.; Dietzel, B.; Sarac, A.S. Electrochemical impedance study on nanofibers of poly(m-anthranilic acid)/polyacrylonitrile blends. Eur. Polym. J. 2013, 49, 2645–2653. [Google Scholar] [CrossRef]
- Kriegel, C.; Kit, K.M.; McClements, D.J.; Weiss, J. Electrospinning of chitosan–poly(ethylene oxide) blend nanofibers in the presence of micellar surfactant solutions. Polymer 2009, 50, 189–200. [Google Scholar] [CrossRef]
- Kissinger, H.E. Reaction Kinetics in Differential Thermal Analysis. Anal. Chem. 1957, 29, 1702–1706. [Google Scholar] [CrossRef]
- Zabihi, O. Modeling of phenomenological mechanisms during thermal formation and degradation of an epoxy-based nanocomposite. Thermochim. Acta 2012, 543, 239–245. [Google Scholar] [CrossRef]
- Mousa, F.S.; Hamid, K.; Minoo, N. Chemically Enhanced Wet-Spinning Process to Accelerate Thermal Stabilization of Polyacrylonitrile Fibers. Macromol. Mater. Eng. 2018, 303, 1700557–1700565. [Google Scholar]


| Sample Code | Viscosity (Pa.s) | Flow Behaviour Index (n) | Diameter (µm) | Electrical Conductivity (mS/cm) |
|---|---|---|---|---|
| U0 | 0.768 | 0.99 | 0.38 ± 0.13 | 127.8 |
| U2 | 0.848 | 0.95 | 0.45 ± 0.07 | 116.4 |
| U4 | 1.63 | 0.92 | 0.72 ± 0.13 | 104.9 |
| Sample | Ts (°C) | ΔHs (J/g) | Es (kJ/mol) | Tc (°C) | Carbon Yield at 600 °C (%) |
|---|---|---|---|---|---|
| U0 | 311 | 1047 | 145 | 323 | 43 |
| U2 | 316 | 2106 | 113 | 331 | 54 |
| U4 | 318 | 2232 | 148 | 334 | 56 |
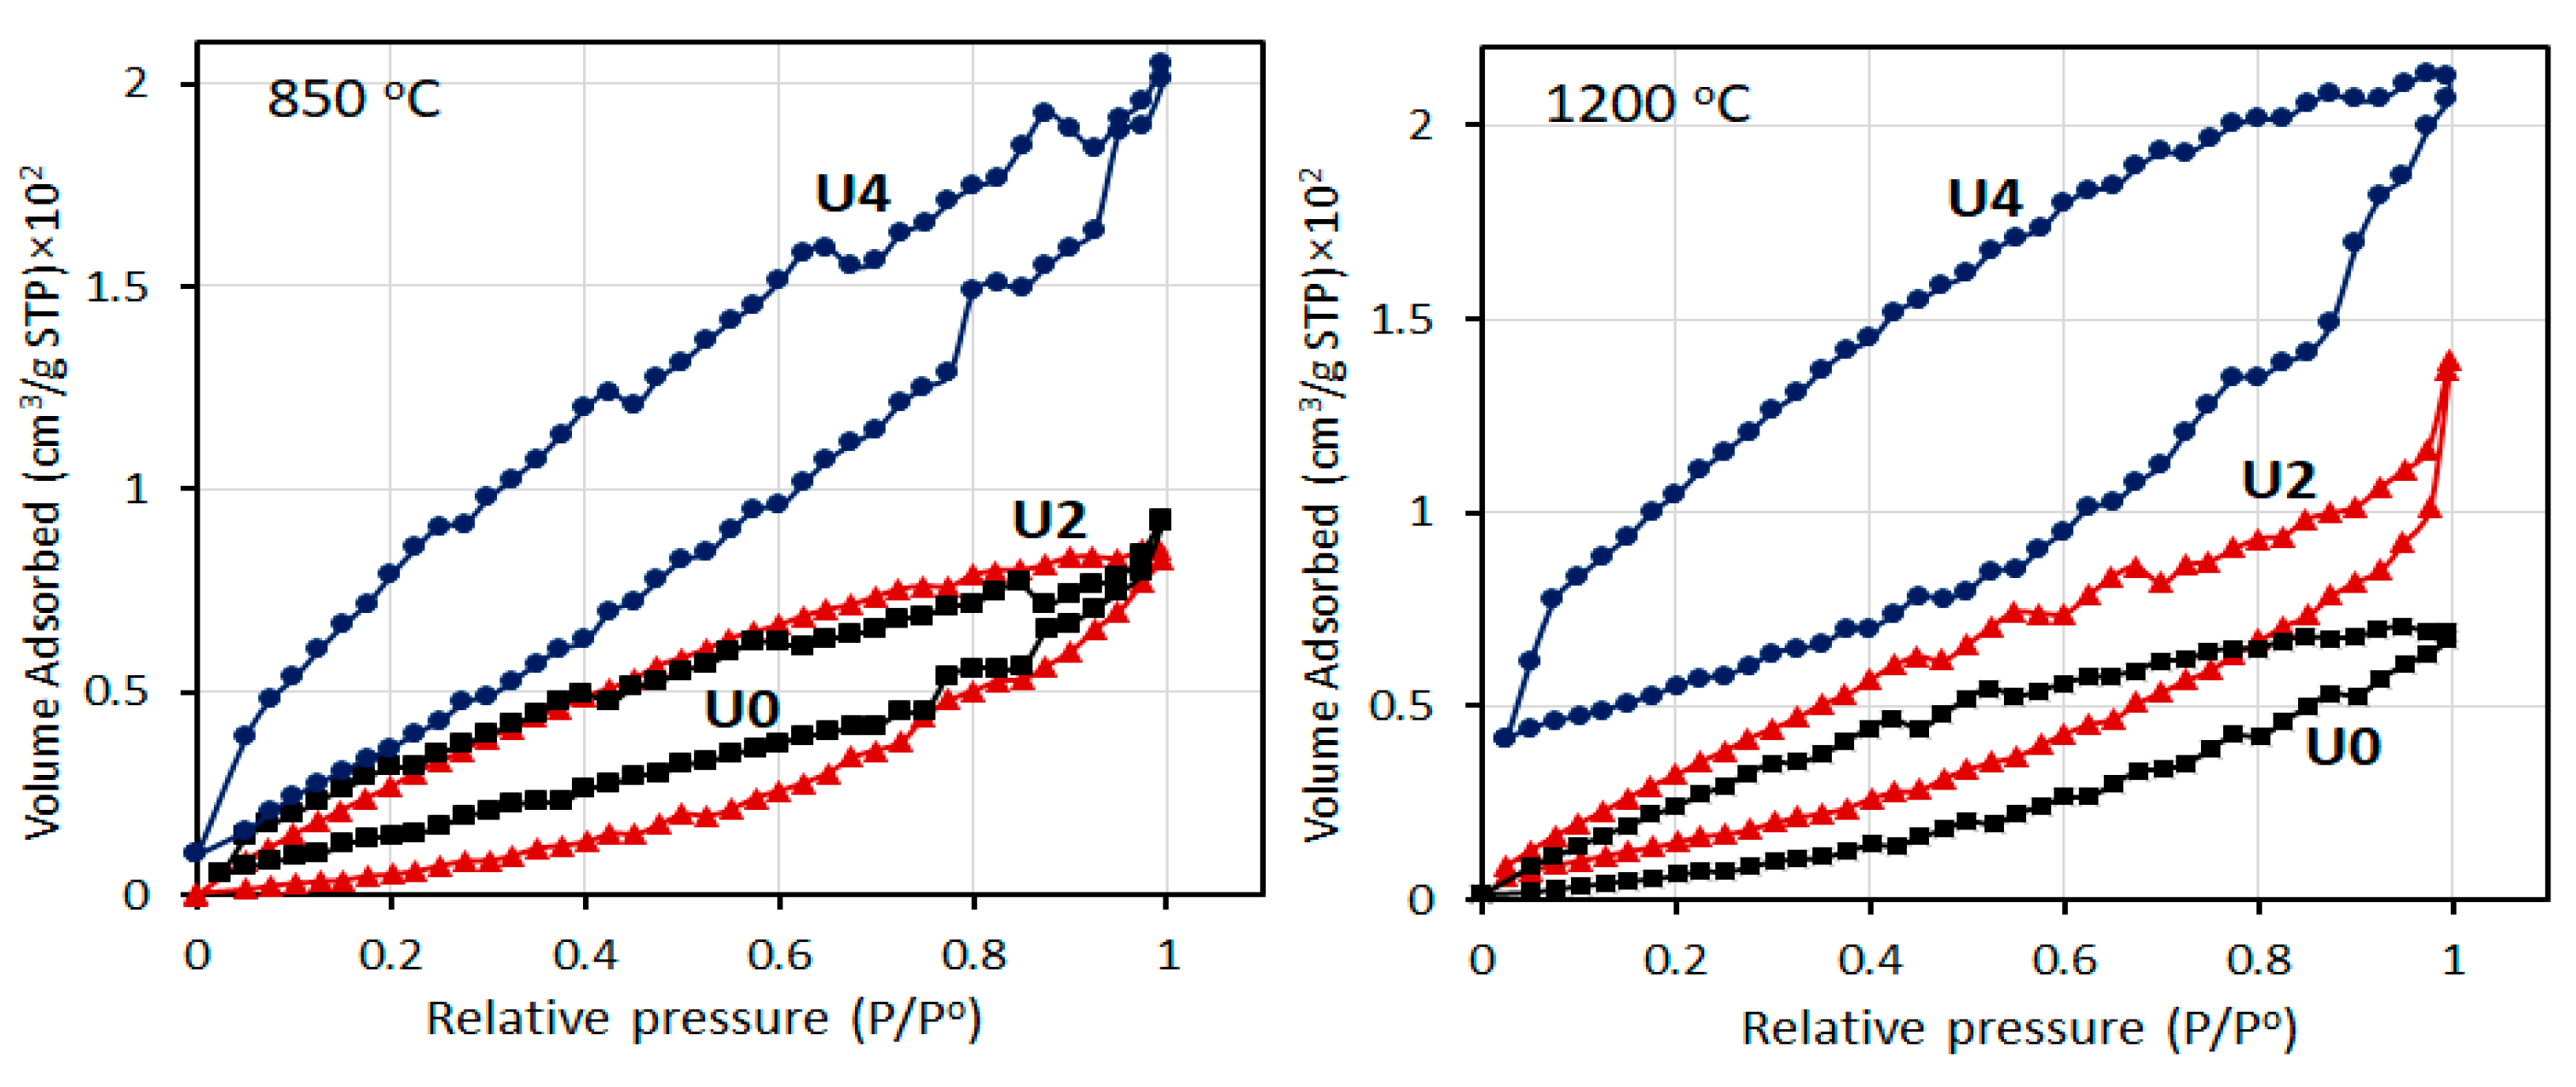
| Carbonisation Temperature | 850 °C | 1200 °C | ||||
|---|---|---|---|---|---|---|
| Sample | U0 | U2 | U4 | U0 | U2 | U4 |
| Specific surface area (m2/g) | 87.33 | 110.45 | 142.86 | 104.28 | 134.41 | 145.12 |
| Pore size (nm) | 1.4054 | 1.6571 | 3.138 | 1.5680 | 1.7491 | 3.409 |
| Samples | 2ϴ (Degree) | FWHM (Degree) | Lc (nm) | |
|---|---|---|---|---|
| CTP | 20.15 | 9.36 | N/A | |
| Precursor | U0 | 16.83 | 3.06 | 2.59 |
| U2 | 16.81 | 3.01 | 2.63 | |
| U4 | 16.82 | 2.90 | 2.74 | |
| Carbonised @850 °C | U0 | 24.43 | 7.55 | 1.07 |
| U2 | 24.41 | 7.47 | 1.07 | |
| U4 | 24.41 | 7.51 | 1.07 | |
| Carbonised @1200 °C | U0 | 24.24 | 7.48 | 1.07 |
| U2 | 24.33 | 7.49 | 1.07 | |
| U4 | 24.05 | 7.71 | 1.04 |
© 2019 by the authors. Licensee MDPI, Basel, Switzerland. This article is an open access article distributed under the terms and conditions of the Creative Commons Attribution (CC BY) license (http://creativecommons.org/licenses/by/4.0/).
Share and Cite
Zabihi, O.; Shafei, S.; Fakhrhoseini, S.M.; Ahmadi, M.; Ajdari Nazarloo, H.; Stanger, R.; Anh Tran, Q.; Lucas, J.; Wall, T.; Naebe, M. Low-Cost Carbon Fibre Derived from Sustainable Coal Tar Pitch and Polyacrylonitrile: Fabrication and Characterisation. Materials 2019, 12, 1281. https://doi.org/10.3390/ma12081281
Zabihi O, Shafei S, Fakhrhoseini SM, Ahmadi M, Ajdari Nazarloo H, Stanger R, Anh Tran Q, Lucas J, Wall T, Naebe M. Low-Cost Carbon Fibre Derived from Sustainable Coal Tar Pitch and Polyacrylonitrile: Fabrication and Characterisation. Materials. 2019; 12(8):1281. https://doi.org/10.3390/ma12081281
Chicago/Turabian StyleZabihi, Omid, Sajjad Shafei, Seyed Mousa Fakhrhoseini, Mojtaba Ahmadi, Hossein Ajdari Nazarloo, Rohan Stanger, Quang Anh Tran, John Lucas, Terry Wall, and Minoo Naebe. 2019. "Low-Cost Carbon Fibre Derived from Sustainable Coal Tar Pitch and Polyacrylonitrile: Fabrication and Characterisation" Materials 12, no. 8: 1281. https://doi.org/10.3390/ma12081281