Electrolytic Surface Treatment for Improved Adhesion between Carbon Fibre and Polycarbonate


 , ,
, ,
Abstract
:1. Introduction
2. Materials and Methods
2.1. Inverse Gas Chromatography (IGC)—Surface Free Energy Analysis (SEA)
2.2. Tensile Testing
2.3. Tensiometer: Contact Angle and Surface Free Energy
2.4. Single Fibre Pull-Out Test (SFPO)
2.5. X-ray Photoelectron Spectroscopy (XPS)
2.6. Statistical Evaluation
3. Results
3.1. Fibre Surface Treatment Results and Differences Observed
3.2. Treatment Impact on Surface Energy and Functional Groups, Matching with PC
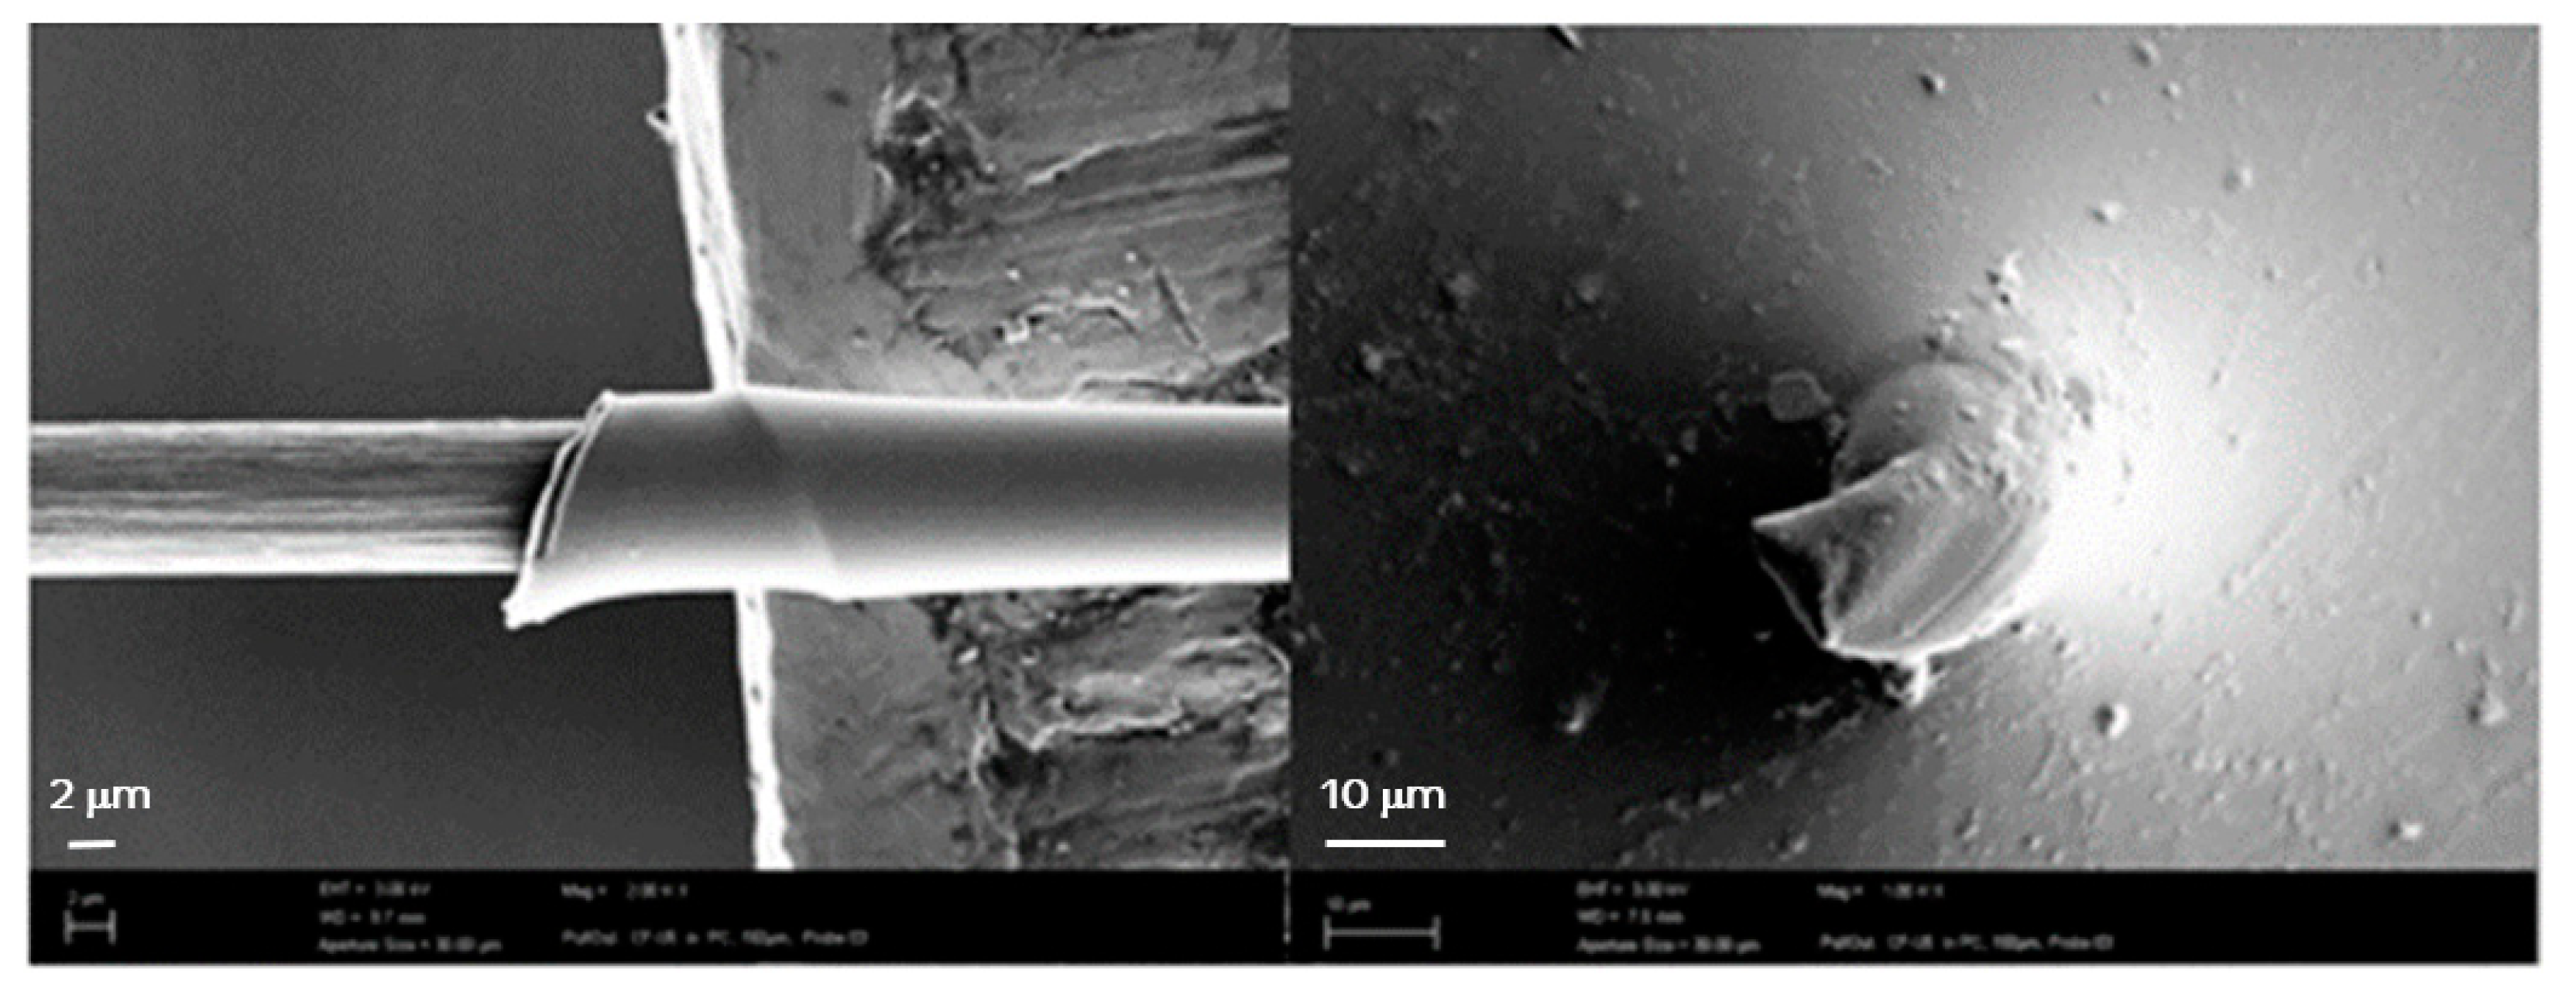
3.3. Single Fibre Pull-Out Test (SFPO)
3.4. Correlations
4. Discussion
5. Conclusions
6. Patents
Author Contributions
Acknowledgments
Conflicts of Interest
References
- Cogswell, F.N. Thermoplastic Aromatic Polymer Composites: A Study of the Structure, Processing and Properties of Carbon Fibre Reinforced Polyetheretherketone and Related Materials; Elsevier: Amsterdam, The Netherlands, 2013; ISBN 9781483164762. [Google Scholar]
- Fu, S.Y.; Lauke, B.; Mäder, E.; Yue, C.Y.; Hu, X. Tensile properties of short-glass-fibre-and short-carbon-fibre-reinforced polypropylene composites. Compos. Part A Appl. Sci. Manuf. 2000, 31, 1117–1125. [Google Scholar] [CrossRef]
- Botelho, E.C.; Rezende, M.C.; Lauke, B. Mechanical behavior of carbon fibre reinforced polyamide composites. Compos. Sci. Technol. 2003, 63, 1843–1855. [Google Scholar] [CrossRef]
- Karger-Kocsis, J.; Mahmood, H.; Pegoretti, A. Recent advances in fibre/matrix interphase engineering for polymer composites. Prog. Mater. Sci. 2015, 73, 1–43. [Google Scholar] [CrossRef] [Green Version]
- Sharma, M.; Gao, S.; Mäder, E.; Sharma, H.; Wei, L.Y.; Bijwe, J. Carbon fibre surfaces and composite interphases. Compos. Sci. Technol. 2014, 102, 35–50. [Google Scholar] [CrossRef]
- Yao, S.S.; Jin, F.-L.; Rhee, K.Y.; Hui, D.; Park, S.J. Recent advances in carbon-fibre-reinforced thermoplastic composites: A review. Compos. Part B Eng. 2018, 142, 241–250. [Google Scholar] [CrossRef]
- Montes-Morán, M.A.; Martınez-Alonso, A.; Tascón, J.M.D.; Paiva, M.C.; Bernardo, C.A. Effects of plasma oxidation on the surface and interfacial properties of carbon fibres/polycarbonate composites. Carbon 2001, 39, 1057–1068. [Google Scholar] [CrossRef]
- Bascom, W.D.; Chen, W.-J. Effect of Plasma Treatment on the Adhesion of Carbon Fibres to Thermoplastic Polymers. J. Adhes. 1991, 34, 99–119. [Google Scholar] [CrossRef]
- Bismarck, A.; Richter, D.; Wuertz, C.; Kumru, M.E.; Song, B.; Springer, J. Adhesion: Comparison Between Physico-chemical Expected and Measured Adhesion of Oxygen-plasma-treated Carbon Fibres and Polycarbonate. J. Adhes. 2000, 73, 19–42. [Google Scholar] [CrossRef]
- Bismarck, A.; Kumru, M.E.; Song, B.; Springer, J.; Moos, E.; Karger-Kocsis, J. Study on surface and mechanical fibre characteristics and their effect on the adhesion properties to a polycarbonate matrix tuned by anodic carbon fibre oxidation. Compos. Part A Appl. Sci. Manuf. 1999, 30, 1351–1366. [Google Scholar] [CrossRef]
- Yao, T.T.; Wu, G.P.; Song, C. Interfacial adhesion properties of carbon fibre/polycarbonate composites by using a single-filament fragmentation test. Compos. Sci. Technol. 2017, 149, 108–115. [Google Scholar] [CrossRef]
- Lee, J.; Drzal, L.T. Surface characterization and adhesion of carbon fibres to epoxy and polycarbonate. Int. J. Adhes. 2005, 25, 389–394. [Google Scholar] [CrossRef]
- Raghavendran, V.K.; Drzal, L.T.; Askeland, P. Effect of surface oxygen content and roughness on interfacial adhesion in carbon fibre–polycarbonate composites. J. Adhes. Sci. Technol. 2002, 16, 1283–1306. [Google Scholar] [CrossRef]
- Lorca, J.L.; Gonzalez, C.; Molina-Aldarequia, J.M.; Segurado, J.; Seltzer, R.; Sket, F.; Rodriguez, M.; Sadaba, S.; Munoz, R.; Canal, L.P. Multiscale Modeling of composite materials: A Roadmap towards virtual testing. Adv. Mater. 2011, 23, 5130–5147. [Google Scholar] [CrossRef] [PubMed]
- Pisanova, E.V.; Zhandarov, S.F.; Dovgyalo, V.A. Interfacial adhesion and failure modes in single filament thermoplastic composites. Polym. Compos. 1994, 15, 147–155. [Google Scholar] [CrossRef]
- Mäder, E.; Pisanova, E. Interfacial design in fibre reinforced polymers. Macromol. Symp. 2001, 163, 189–212. [Google Scholar] [CrossRef]
- Kim, J.-K.; Mai, Y.-M. Engineered Interfaces in Fibre Reinforced Composites; Elsevier: Amsterdam, The Netherlands, 1998. [Google Scholar]
- Zhandarov, S.; Mäder, E. Characterization of fibre/matrix interface strength: Applicability of different tests, approaches and parameters. Compos. Sci. Technol. 2005, 65, 149–160. [Google Scholar] [CrossRef]
- Kamps, J.H.; Scheffler, C.; Simon, F.; van der Heijden, R.; Verghese, N. Functional polycarbonates for improved adhesion to carbon fibre. Compos. Sci. Technol. 2018, 167, 448–455. [Google Scholar] [CrossRef]
- Jones, M.D.; Hooton, J.C.; Dawson, M.L.; Ferrie, A.R.; Price, R. An investigation into the dispersion mechanisms of ternary dry powder inhaler formulations by the quantification of interparticulate forces. Pharm. Res. 2008, 25, 337–348. [Google Scholar] [CrossRef] [PubMed]
- Good, R.J.; Srivatsa, N.R.; Islam, M.; Huang, H.T.L.; van Oss, C.J. Theory of the acid-base hydrogen bonding interactions, contact angles, and the hysteresis of wetting: Application to coal and graphite surfaces. J. Adhes. Sci. Technol. 1990, 4. [Google Scholar] [CrossRef]
- Rulison, C. So You Want to Measure Surface Energy?—A Tutorial Designed to Provide Basic Understanding of the Concept of Solid Surface Energy, and Its Many Complications; Krüss Technical Note #306; KRÜSS GmbH: Hamburg, Germany, 1999. [Google Scholar]
- Mäder, E.; Grundke, K.; Jacobasch, H.J.; Wachinger, G. Surface, interphase and composite property relation in fibre-reinforced polymers. Composites 1994, 25, 739–744. [Google Scholar] [CrossRef]
- Miller, B.; Muri, P.; Rebenfeld, L. A microbond method for determination of the shear strength of a fibre–resin interface. Compos. Sci. Technol. 1987, 28, 17–32. [Google Scholar] [CrossRef]
- Zhandarov, S.; Mäder, E. An alternative method of determining the local interfacial shear strength from force-displacement curves in the pull-out and microbond tests. Int. J. Adhes. 2014, 55, 37–42. [Google Scholar] [CrossRef]
- Donnet, J.-B.; Bansal, R.C. Carbon Fibers, 2nd ed.; Marcel Dekker: New York, NY, USA; Basel, Switzerland, 1990; pp. 17–32. [Google Scholar]
- Tripathi, B.; Das, P.; Simon, F.; Stamm, M. Ultralow fouling membranes by surface modification with functional polydopamine. Eur. Polym. J. 2018, 99, 80–89. [Google Scholar] [CrossRef]
- Beamson, G.; Briggs, D. High resolution of organic polymers. In The Scienta ESCA 300 Database; J. Wiley & Sons: Chichester, NY, USA; Brisbane: Toronto, ON, Canada; Singapore, 1992; pp. 184–187. ISBN 0-471-93592-1. [Google Scholar]
- Rulison, C. Adhesion Energy and Interfacial Tension—Two Related Coating/Substrate Interfacial Properties—Which Is More Important for Your Application, and Why? Krüss Application Note #232e; KRÜSS GmbH: Hamburg, Germany, 2003. [Google Scholar]


| Fibre | Treatment | Matrix | Testing Method | IFSS ± SD ** | Ref. |
|---|---|---|---|---|---|
| PAN-based unmodified, unsized CF (Idemitsu Kosan, Tokyo, Japan) | Anodic oxidation (electrolyte solution: K2CO3/KOH; KNO3/KOH) | PC (Makrofol®, Bayer, Leverkusen, Germany) | Microdroplet pull-off test | 9.6 ± 1.1 MPa (not oxidized); 14.7 ± 3.1 MPa (2.5 min in KNO3/KOH) | [10] |
| PAN-based CF with unknown sizing (12K, HTS40, Toho Inc. Corp., Tokyo, Japan) and self-prepared CF with epoxy sizing | Electrochemical oxidation using a 0.1 mol/L NaOH electrolyte | PC (Dongguang Plastic Film Corporation, Dongguang, China), focusing on polycarbonate backbone transesterification | Single fibre fragmentation test | 25.04 ± 1.08 MPa (not oxidized); 47.53 ± 1.23 MPa (15 min treatment time) | [11] |
| PAN-based unmodified (UT) and oxidized (ST) CF (Toray Industries Inc., Tokyo, Japan) | Electrochemical oxidation | Bisphenol-A based PC with varying Mw * PC1 Mw 25,000 g/mol PC2 Mw 32,000–36,000 g/mol (consolidation temperature 230–310 °C) | Single fibre fragmentation test | PC 1: (230/310 °C) UT: 30.2/41.0 MPa ST: 43.8/56.5 MPa PC 2: UT: 42.8/48.4 MPa ST: 59.3/67.9 MPa | [12] |
| UHM pitch-based CF; HT PAN-based CF; both untreated and unsized | Microwave O2-plasma oxidation | PC Makrolon® 2805 (Bayer, Leverkusen, Germany) | Single fibre fragmentation test | HT: 24.0 ± 2 MPa HT-ox.: 27.7 ± 2 MPa UHM: 12.2 ± 1 MPa UHM-ox: 46.7 ± 3 MPa | [7] |
| PAN-based CF (Hexcel Magnamite® IM7, Stamford, CT, USA) | Commercial oxidative surface treatment at different grades | linear amorphous thermoplastic, Bisphenol-A based PC (GE Plastics, Inc., Pittsfield, MA, USA), Mw 31,000 g/mol | Microindentation test | 100% ox.: 27.0 ± 1.9 MPa 400% ox.: 28.6 ± 3.2 MPa | [13] |
| PAN-based CF, Magnamite AS1 and AS4 (Hercules Aerospace, Wilmington, NC, USA) | Plasma treatment with ammonia, argon, nitrogen and oxygen | Polycarbonate LEXAN™ 101, (SABIC, Bergen op Zoom, The Netherlands) | Single fibre fragmentation test | lc/d 102% for ammonia treated lc/d 100% for ammonia treated lc/d 90% for argon treated lc/d 65% for oxygen treated | [8] |
| PAN-based CF, C320.00A, Sigri SGL Carbon, Wiesbaden, Germany | Low pressure oxygen plasma | PC Macrofol® DE 1-1 (Bayer AG, Leverkusen, Gerrmany) | Single fibre fragmentation test | 11.1 ± 1.2 MPa (no treatment) 9.8 ± 1.4 MPa (20 min treatment) | [9] |
| PAN-based CF, unsized | Commercial process, undisclosed | Functionalized polycarbonate (SABIC, Bergen op Zoom, The Netherlands) | Single fibre pull-out | 33.9 ± 9.1 MPa (reference) 42.2 ± 9.0 MPa (functionalized PC) | [19] |
| Sample Number | Current (A) | Potential (V) | Conductivity (mS/cm) |
|---|---|---|---|
| 1 | - | - | - |
| 2 | 8 | 5.8 | 17.5 |
| 3 | 14 | 8 | 17.5 |
| 4 | 26 | 13.5 | 17 |
| 5 | 26 | 12.5 | 31.3 |
| 6 | 14 | 8.1 | 31.4 |
| 7 | 8 | 5.7 | 31.2 |
| Sample Number | 1 | 2 | 3 | 4 | 5 | 6 | 7 | Testing Method |
|---|---|---|---|---|---|---|---|---|
| Current (A) | 0 | 8 | 14 | 26 | 26 | 14 | 8 | - |
| Potential (V) | 0 | 5.8 | 8 | 13.5 | 12.5 | 8.1 | 5.7 | - |
| Conductivity (mS/cm) | 0 | 17.5 | 17.5 | 17 | 31.3 | 31.4 | 31.2 | - |
| Elongation at Break (%) | 1.58 | 1.60 | 1.63 | 1.64 | 1.70 | 1.79 | 1.63 | Favimat |
| Standard deviation (n = 25) | 0.24 | 0.29 | 0.24 | 0.28 | 0.32 | 0.23 | 0.24 | - |
| Modulus (GPa) | 259.85 | 261.44 | 266.24 | 262.06 | 261.81 | 263.09 | 264.22 | Favimat |
| Standard deviation (n = 25) | 3.59 | 4.58 | 11.36 | 3.26 | 5.20 | 4.73 | 4.26 | - |
| Tensile strength (GPa) | 3.84 | 3.88 | 4.05 | 4.02 | 4.13 | 4.38 | 4.00 | Favimat |
| Standard deviation (n = 25) | 0.61 | 0.72 | 0.62 | 0.71 | 0.80 | 0.58 | 0.62 | - |
| Diameter (µm) | 6.54 | 6.54 | 6.5 | 6.55 | 6.59 | 6.52 | 6.56 | Favimat |
| Standard deviation (n = 25) | 0.14 | 0.15 | 0.13 | 0.13 | 0.11 | 0.19 | 0.15 | - |
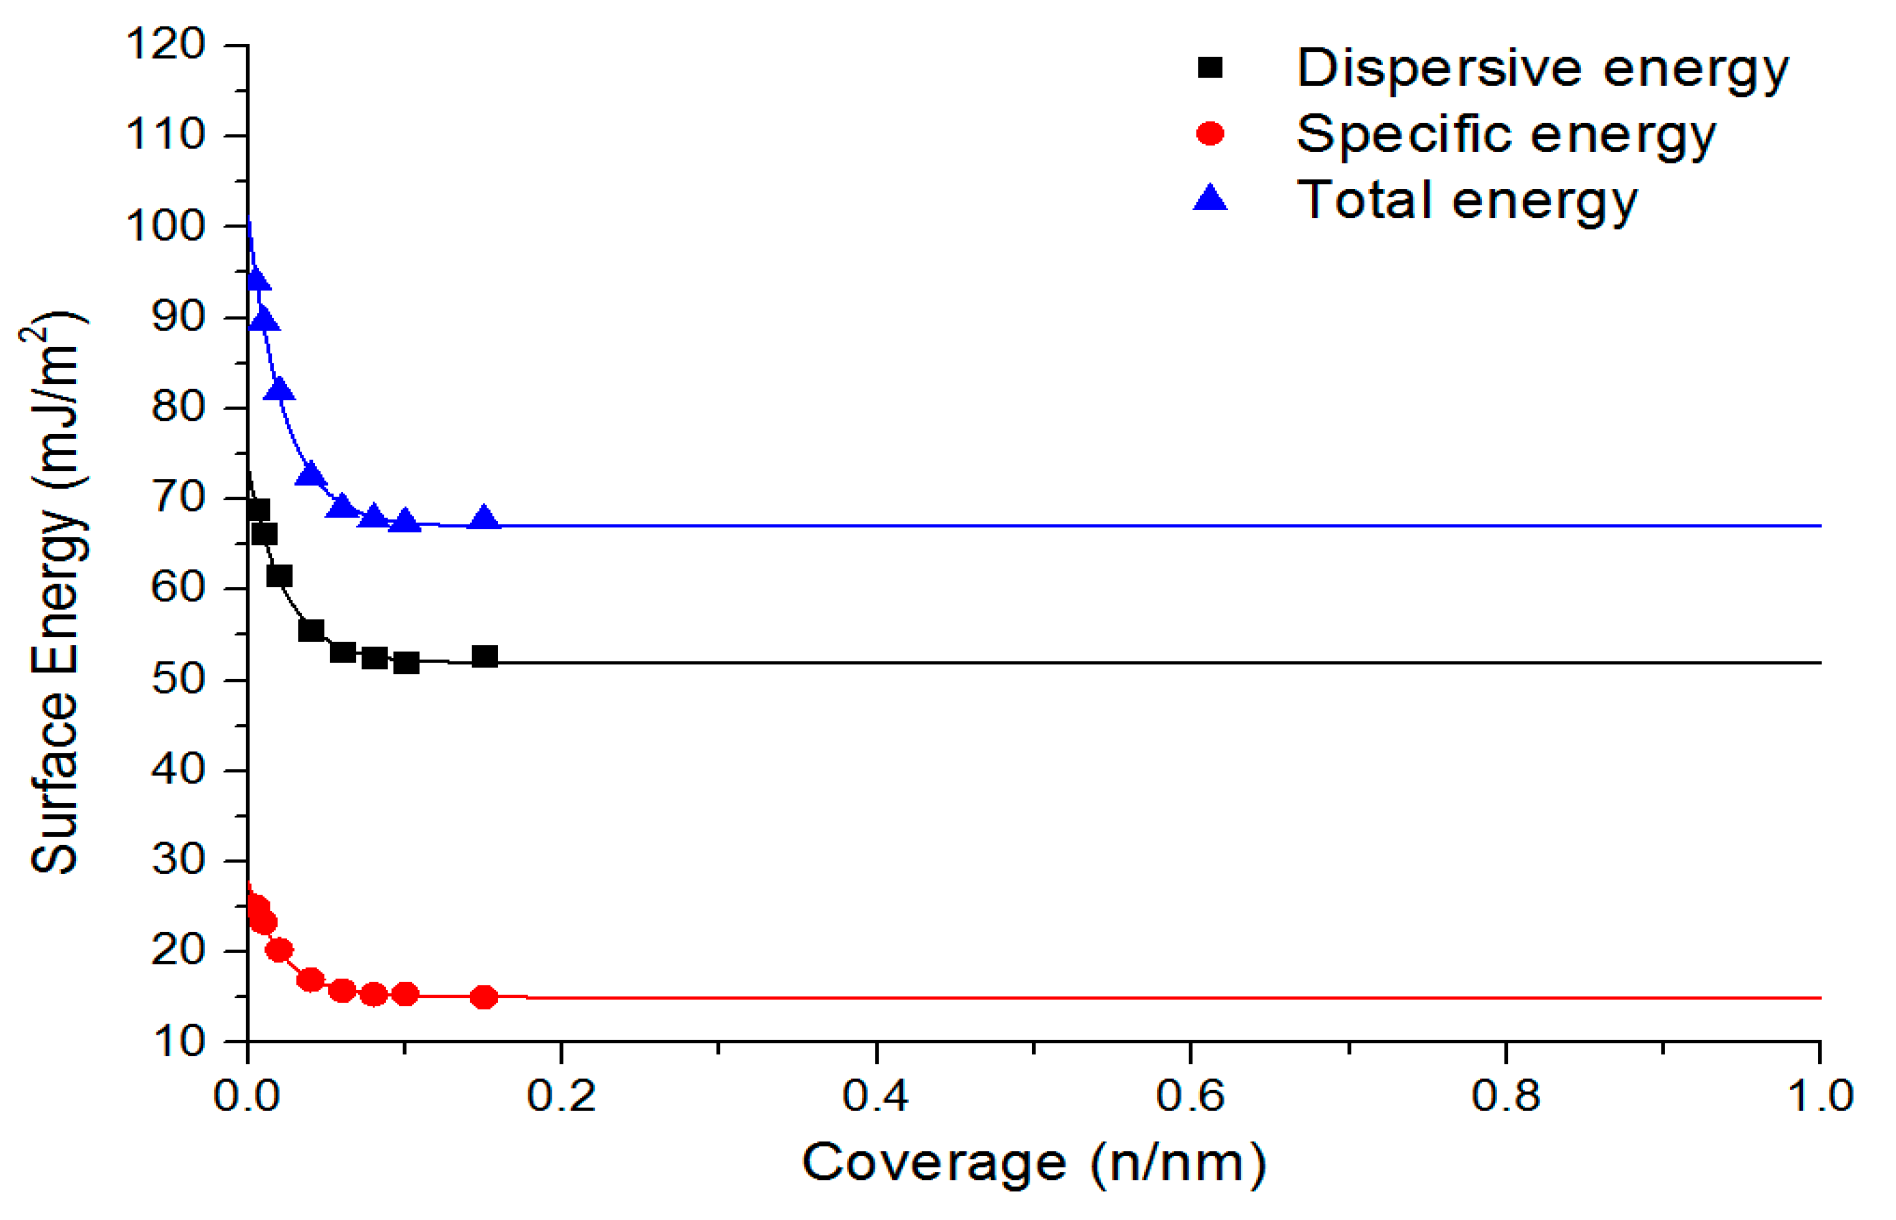
| Total surface energy (mJ/m2) | 67.0 | 68.1 | 72.2 | 75.7 | 73.2 | 72.7 | 70.5 | IGC |
| Dispersive surface energy (mJ/m2) | 51.9 | 47.4 | 46.1 | 47.8 | 46.9 | 46.4 | 47.4 | IGC |
| Specific surface energy (mJ/m2) | 15.0 | 20.6 | 26.0 | 27.5 | 26.0 | 26.1 | 22.7 | IGC |
| Atomic Conc. Hydroxyl (%) | 1.50 | 1.90 | 2.15 | 3.68 | 3.24 | 3.36 | 3.10 | XPS |
| Atomic Conc. Carboxyl (%) | 1.10 | 1.51 | 1.62 | 2.93 | 3.05 | 2.15 | 1.80 | XPS |
| Atomic Conc. Nitrile (%) | 2.07 | 4.79 | 4.48 | 5.75 | 7.17 | 6.52 | 6.70 | XPS |
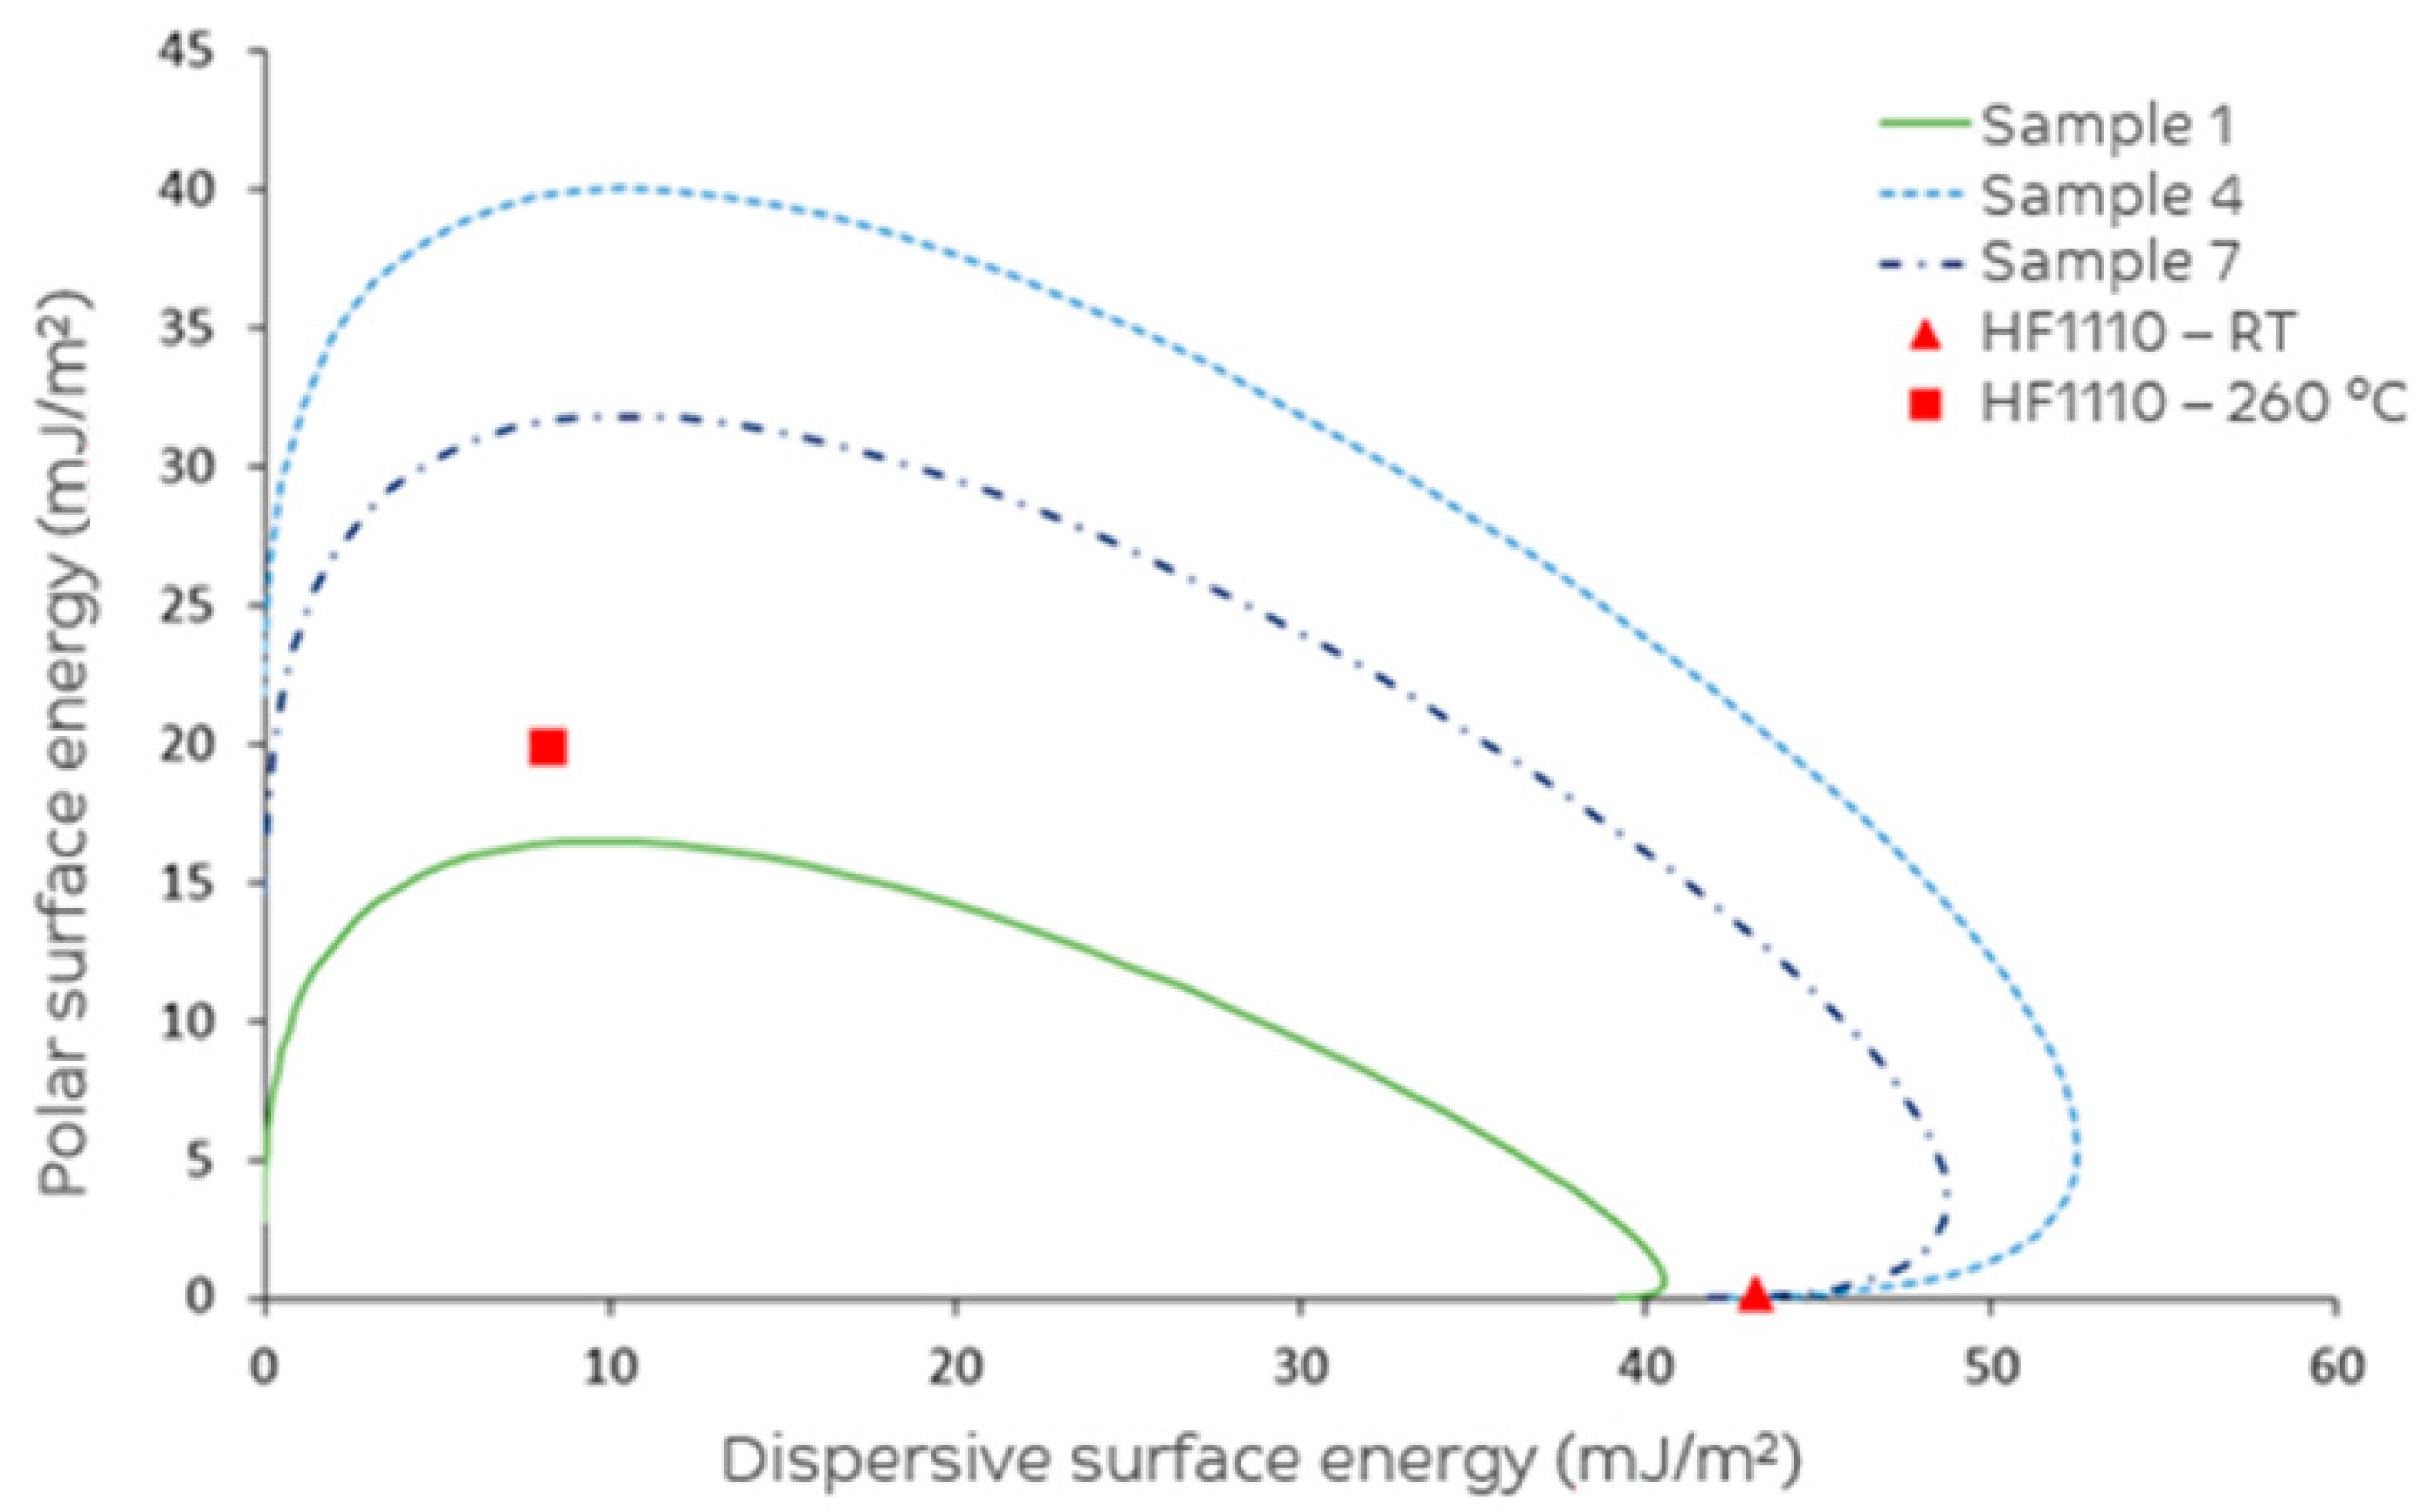
| Total surface energy (mJ/m2) | 41.9 | 55.9 | 56.0 | 64.0 | 56.5 | 58.4 | 56.2 | CA |
| Polar surface energy (mJ/m2) | 2.7 | 14.8 | 17.2 | 21.8 | 20.3 | 18.2 | 14.4 | CA |
| Dispersive surface energy (mJ/m2) | 39.2 | 41.1 | 38.8 | 42.2 | 36.2 | 40.3 | 41.8 | CA |
| Polarity (%) | 6.5 | 26.4 | 30.7 | 34.0 | 35.9 | 31.1 | 25.6 | CA |
| Adhesion energy ambient (mJ/m2) | 83.7 | 87.6 | 85.5 | 89.5 | 83.1 | 87.2 | 88.3 | CA |
| Interfacial tension ambient (mN/m) | 1.6 | 11.6 | 13.9 | 17.9 | 16.8 | 14.7 | 11.3 | CA |
| Adhesion energy 260 °C (mJ/m2) | 50.6 | 71.0 | 72.6 | 78.8 | 74.6 | 74.4 | 70.9 | CA |
| Interfacial tension 260 °C (mN/m) | 19.4 | 13.0 | 11.4 | 13.3 | 9.9 | 12.2 | 13.4 | CA |
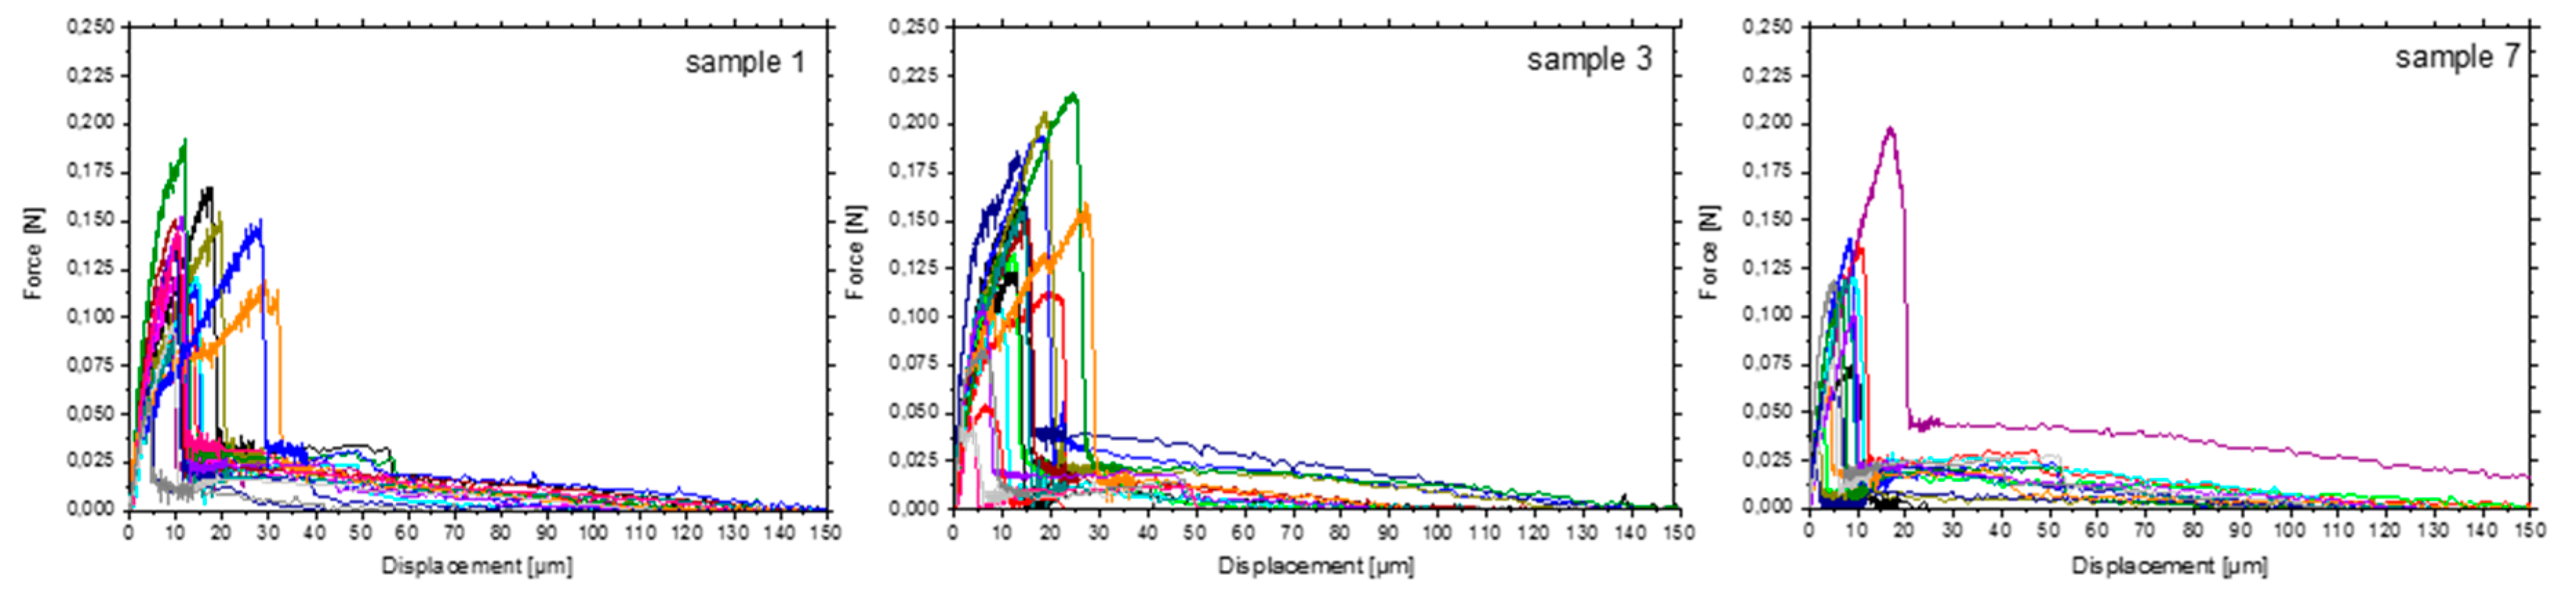
| τapp (N/mm2) | 48.8 | 50.1 | 55.2 | 43.2 | 54.7 | 49.5 | 33.3 | SFPO |
| Standard deviation (n = 25) | 12.4 | 14.0 | 11.5 | 11.1 | 6.5 | 18.9 | 15.1 | - |
| Wdebond (mN mm) | 1.5 | 1.2 | 1.8 | 0.7 | 0.9 | 0.7 | 0.6 | SFPO |
| Standard deviation (n = 25) | 0.9 | 0.6 | 1.3 | 0.9 | 0.6 | 0.5 | 0.6 | - |
| Wpullout (mN mm) | 2.1 | 1.6 | 1.5 | 2.9 | 2.2 | 1.3 | 2.0 | SFPO |
| Standard deviation (n = 25) | 0.9 | 0.6 | 0.7 | 2.7 | 2.8 | 0.7 | 1.1 | - |
| Sample Number | Dispersive Energy (mJ/m2) | Specific (Acid-Base) (mJ/m2) | Total (mJ/m2) | Ratio of Dispersive and Specific Energies a |
|---|---|---|---|---|
| 1 | 51.94 (77.5%) | 15.04 (22.5%) | 66.98 | 3.45:1.0 |
| 2 | 47.41 (69.8%) | 20.55 (30.2%) | 68.14 | 2.31:1.0 |
| 3 | 46.06 (63.9%) | 26.02 (36.1%) | 72.19 | 1.77:1.0 |
| 4 | 47.83 (63.5%) | 27.45 (36.5%) | 75.72 | 1.74:1.0 |
| 5 | 46.88 (64.4%) | 25.97 (35.6%) | 73.23 | 1.81:1.0 |
| 6 | 46.40 (64.0%) | 26.09 (36.0%) | 72.65 | 1.78:1.0 |
| 7 | 47.38 (67.5%) | 22.73 (32.5%) | 70.49 | 2.08:1.0 |
| Sample Number | [N]:[C] | [O]:[C] | [B] | [C] | [D] | [F] |
|---|---|---|---|---|---|---|
| 1 | 0.011 | 0.022 | 0.021 | 0.015 | 0.008 | 0.011 |
| 2 | 0.030 | 0.084 | 0.048 | 0.019 | 0.017 | 0.015 |
| 3 | 0.028 | 0.105 | 0.045 | 0.022 | 0.021 | 0.016 |
| 4 | 0.036 | 0.163 | 0.058 | 0.037 | 0.034 | 0.029 |
| 5 | 0.045 | 0.142 | 0.072 | 0.032 | 0.038 | 0.031 |
| 6 | 0.042 | 0.107 | 0.065 | 0.034 | 0.032 | 0.022 |
| 7 | 0.042 | 0.087 | 0.067 | 0.031 | 0.025 | 0.018 |
| Sample Number | θa [Water] a (°) | θa 1-[Bromonaphthalene] a (°) | Total SFE (mJ/m2) | Surface Polarity (%) |
|---|---|---|---|---|
| 1 | 82.6 ± 3.2 b | 28.7 ± 5.1 | 41.9 | 6.5 |
| 2 | 54.7 ± 3.9 | 22.2 ± 6.9 | 55.9 | 26.4 |
| 3 | 52.2 ± 3.8 | 29.1 ± 8.2 | 56.0 | 30.7 |
| 4 | 41.4 ± 3.7 | 17.8 ± 7.1 | 64.0 | 34.0 |
| 5 | 48.9 ± 4.5 | 35.8 ± 8.8 | 56.5 | 35.9 |
| 6 | 49.3 ± 4.4 | 24.4 ± 8.7 | 58.4 | 31.1 |
| 7 | 54.9 ± 4.5 | 19.7 ± 6.4 | 56.2 | 25.6 |
| Sample Number | Adhesion Energy (mJ/m2) | Interfacial Tension (mN/m) | ||
|---|---|---|---|---|
| Ambient | 260 °C | Ambient | 260 °C | |
| 1 | 83.7 | 50.6 | 1.6 | 19.4 |
| 2 | 87.6 | 71.0 | 11.6 | 13.0 |
| 3 | 85.5 | 72.6 | 13.8 | 11.4 |
| 4 | 89.5 | 78.8 | 17.9 | 13.3 |
| 5 | 83.0 | 74.6 | 16.8 | 9.9 |
| 6 | 87.2 | 74.4 | 14.7 | 12.2 |
| 7 | 88.3 | 70.9 | 11.3 | 13.4 |
| Factors | Elongation at Break | Modulus | Tensile Strength | Total Surface Energy | Dispersive Surface Energy | Atomic Conc. Hydroxyl | Atomic Conc. Carboxyl | Atomic Conc. Nitrile | Total Surface Energy | Polar Surface Energy | Dispersive Surface Energy | Polarity | Interfacial Tens. (Ambient) | Interfacial Tens. (260 °C) | τapp | Wdebond | Wpullout |
|---|---|---|---|---|---|---|---|---|---|---|---|---|---|---|---|---|---|
| Favimat | IGC | XPS | CA | SFPO | |||||||||||||
| Current (A) | 0.46 | 0.17 | 0.61 | 0.92 | −0.56 | 0.77 | 0.96 | 0.67 | 0.77 | 0.89 | −0.21 | 0.86 | −0.73 | 0.20 | −0.40 | 0.45 | 0.46 |
| Potential (V) | 0.47 | 0.26 | 0.57 | 0.93 | −0.66 | 0.80 | 0.93 | 0.73 | 0.87 | 0.95 | −0.09 | 0.92 | −0.79 | 0.13 | −0.44 | 0.39 | 0.47 |
| Conductivity (mS/cm) | 0.72 | 0.45 | 0.16 | 0.51 | −0.79 | 0.73 | 0.56 | 0.96 | 0.64 | 0.70 | −0.06 | 0.75 | −0.80 | −0.18 | −0.66 | −0.21 | 0.72 |
| Elongation at Break | - | 0.20 | −0.09 | 0.54 | −0.56 | 0.66 | 0.52 | 0.67 | 0.45 | 0.55 | −0.20 | 0.56 | −0.55 | 0.18 | −0.50 | −0.32 | 1.00 |
| Modulus | 0.20 | - | −0.39 | 0.38 | −0.73 | 0.21 | 0.01 | 0.35 | 0.43 | 0.44 | 0.06 | 0.48 | −0.56 | −0.04 | 0.13 | −0.39 | 0.20 |
| Tensile strength | 0.98 | 0.36 | - | 0.60 | −0.63 | 0.67 | 0.50 | 0.66 | 0.50 | 0.59 | −0.17 | 0.60 | −0.59 | 0.17 | −0.44 | −0.34 | 0.98 |
| Total surface energy (IGC) | 0.54 | 0.38 | 0.60 | - | −0.60 | 0.86 | 0.87 | 0.66 | 0.83 | 0.88 | 0.01 | 0.83 | −0.65 | 0.01 | −0.44 | 0.39 | 0.54 |
| Dispersive surface energy (IGC) | −0.56 | −0.73 | −0.63 | −0.60 | - | −0.53 | −0.45 | −0.76 | −0.79 | −0.85 | 0.02 | −0.90 | 0.94 | −0.14 | 0.24 | 0.35 | −0.56 |
| Atomic conc. Hydroxyl (XPS) | 0.66 | 0.21 | 0.67 | 0.86 | −0.53 | - | 0.86 | 0.85 | 0.80 | 0.79 | 0.17 | 0.74 | −0.57 | −0.33 | −0.83 | 0.37 | 0.66 |
| Atomic conc. Carboxyl (XPS) | 0.52 | 0.01 | 0.50 | 0.87 | −0.45 | 0.86 | - | 0.74 | 0.72 | 0.82 | −0.17 | 0.79 | −0.64 | 0.04 | −0.60 | 0.53 | 0.52 |
| Atomic conc. Nitrile (XPS) | 0.67 | 0.35 | 0.66 | 0.66 | −0.76 | 0.85 | 0.74 | - | 0.76 | 0.81 | −0.01 | 0.83 | −0.81 | −0.22 | −0.76 | 0.04 | 0.67 |
| Total surface energy (CA) | 0.45 | 0.43 | 0.50 | 0.83 | −0.79 | 0.80 | 0.72 | 0.76 | - | 0.95 | 0.34 | 0.91 | −0.76 | −0.15 | −0.56 | 0.19 | 0.45 |
| Polar surface energy (CA) | 0.55 | 0.44 | 0.59 | 0.88 | −0.85 | 0.79 | 0.82 | 0.81 | 0.95 | - | 0.03 | 0.99 | −0.89 | 0.08 | −0.46 | 0.15 | 0.55 |
| Dispersive surface energy (CA) | −0.20 | 0.06 | −0.17 | 0.01 | 0.02 | 0.17 | −0.17 | −0.01 | 0.34 | 0.03 | - | −0.06 | 0.25 | −0.73 | −0.39 | 0.16 | −0.20 |
| Polarity (CA) | 0.56 | 0.48 | 0.60 | 0.83 | −0.90 | 0.74 | 0.79 | 0.83 | 0.91 | 0.99 | −0.06 | - | −0.95 | 0.14 | −0.41 | 0.05 | 0.56 |
| Interfacial tension (ambient) (CA) | 0.55 | 0.42 | 0.59 | 0.89 | −0.84 | 0.79 | 0.83 | 0.81 | 0.94 | 1.00 | 0.01 | 0.99 | - | 0.10 | −0.46 | 0.16 | 0.55 |
| Interfacial tension (260 °C) (CA) | −0.55 | −0.56 | −0.59 | −0.65 | 0.94 | −0.57 | −0.64 | −0.81 | −0.76 | −0.89 | 0.25 | −0.95 | −0.89 | - | 0.26 | 0.18 | −0.55 |
| Factors | Elongation at Break | Modulus | Tensile Strength | Total Surface Energy | Dispersive Surface Energy | Atomic Conc. Hydroxyl | Atomic Conc. Carboxyl | Atomic Conc. Nitrile | Total Surface Energy | Polar Surface Energy | Dispersive Surface Energy | Polarity | Interfacial Tens. (Ambient) | Interfacial Tens. (260°) | τapp | Wdebond | Wpullout |
|---|---|---|---|---|---|---|---|---|---|---|---|---|---|---|---|---|---|
| Favimat | IGC | XPS | CA | SFPO | |||||||||||||
| Current (A) | 0.30 | 0.72 | 0.29 | 0.00 | 0.19 | 0.04 | 0.00 | 0.10 | 0.04 | 0.01 | 0.65 | 0.01 | 0.01 | 0.06 | 0.67 | 0.38 | 0.31 |
| Potential (V) | 0.29 | 0.58 | 0.27 | 0.00 | 0.10 | 0.03 | 0.00 | 0.06 | 0.01 | 0.00 | 0.85 | 0.00 | 0.00 | 0.04 | 0.79 | 0.32 | 0.39 |
| Conductivity (mS/cm) | 0.07 | 0.31 | 0.07 | 0.24 | 0.03 | 0.06 | 0.19 | 0.00 | 0.12 | 0.08 | 0.90 | 0.05 | 0.08 | 0.03 | 0.70 | 0.11 | 0.65 |
| Elongation at Break | - | 0.67 | 0.00 | 0.21 | 0.19 | 0.11 | 0.23 | 0.10 | 0.31 | 0.20 | 0.66 | 0.19 | 0.20 | 0.20 | 0.70 | 0.25 | 0.49 |
| Modulus | 0.67 | - | 0.42 | 0.41 | 0.06 | 0.65 | 0.99 | 0.44 | 0.33 | 0.32 | 0.90 | 0.27 | 0.34 | 0.19 | 0.93 | 0.79 | 0.39 |
| Tensile strenght | 0.00 | 0.42 | - | 0.15 | 0.13 | 0.10 | 0.26 | 0.11 | 0.26 | 0.17 | 0.71 | 0.15 | 0.17 | 0.17 | 0.72 | 0.33 | 0.45 |
| Total surface energy (IGC) | 0.21 | 0.41 | 0.15 | - | 0.16 | 0.01 | 0.01 | 0.11 | 0.02 | 0.01 | 0.98 | 0.02 | 0.01 | 0.11 | 0.98 | 0.32 | 0.39 |
| Dispersive surface energy (IGC) | 0.19 | 0.06 | 0.13 | 0.16 | - | 0.22 | 0.31 | 0.05 | 0.03 | 0.02 | 0.96 | 0.01 | 0.02 | 0.00 | 0.77 | 0.60 | 0.44 |
| Atomic conc. Hydroxyl (XPS) | 0.11 | 0.65 | 0.10 | 0.01 | 0.22 | - | 0.01 | 0.01 | 0.03 | 0.03 | 0.71 | 0.06 | 0.03 | 0.18 | 0.47 | 0.02 | 0.41 |
| Atomic conc. Carboxyl (XPS) | 0.23 | 0.99 | 0.26 | 0.01 | 0.31 | 0.01 | - | 0.06 | 0.07 | 0.02 | 0.71 | 0.04 | 0.02 | 0.12 | 0.93 | 0.15 | 0.22 |
| Atomic conc. Nitrile (XPS) | 0.10 | 0.44 | 0.11 | 0.11 | 0.05 | 0.01 | 0.06 | - | 0.05 | 0.03 | 0.99 | 0.02 | 0.03 | 0.03 | 0.63 | 0.05 | 0.93 |
| Total surface energy (CA) | 0.31 | 0.33 | 0.26 | 0.02 | 0.03 | 0.03 | 0.07 | 0.05 | - | 0.00 | 0.46 | 0.00 | 0.00 | 0.05 | 0.74 | 0.20 | 0.69 |
| Polar surface energy (CA) | 0.20 | 0.32 | 0.17 | 0.01 | 0.02 | 0.03 | 0.02 | 0.03 | 0.00 | - | 0.95 | 0.00 | 0.00 | 0.01 | 0.87 | 0.30 | 0.76 |
| Dispersive surface energy (CA) | 0.66 | 0.90 | 0.71 | 0.98 | 0.96 | 0.71 | 0.71 | 0.99 | 0.46 | 0.95 | - | 0.89 | 0.99 | 0.59 | 0.06 | 0.39 | 0.73 |
| Polarity (CA) | 0.19 | 0.27 | 0.15 | 0.02 | 0.01 | 0.06 | 0.04 | 0.02 | 0.00 | 0.00 | 0.89 | - | 0.00 | 0.00 | 0.77 | 0.36 | 0.91 |
| Interfacial tension (ambient) (CA) | 0.20 | 0.34 | 0.17 | 0.01 | 0.02 | 0.03 | 0.02 | 0.03 | 0.00 | 0.00 | 0.99 | 0.00 | - | 0.01 | 0.84 | 0.30 | 0.73 |
| Interfacial tension (260 °C) (CA) | 0.20 | 0.19 | 0.17 | 0.11 | 0.00 | 0.18 | 0.12 | 0.03 | 0.05 | 0.01 | 0.59 | 0.00 | 0.01 | - | 0.57 | 0.57 | 0.70 |
© 2018 by the authors. Licensee MDPI, Basel, Switzerland. This article is an open access article distributed under the terms and conditions of the Creative Commons Attribution (CC BY) license (http://creativecommons.org/licenses/by/4.0/).
Share and Cite
Kamps, J.H.; Henderson, L.C.; Scheffler, C.; Van der Heijden, R.; Simon, F.; Bonizzi, T.; Verghese, N. Electrolytic Surface Treatment for Improved Adhesion between Carbon Fibre and Polycarbonate. Materials 2018, 11, 2253. https://doi.org/10.3390/ma11112253
Kamps JH, Henderson LC, Scheffler C, Van der Heijden R, Simon F, Bonizzi T, Verghese N. Electrolytic Surface Treatment for Improved Adhesion between Carbon Fibre and Polycarbonate. Materials. 2018; 11(11):2253. https://doi.org/10.3390/ma11112253
Chicago/Turabian StyleKamps, Jan Henk, Luke C. Henderson, Christina Scheffler, Ruud Van der Heijden, Frank Simon, Teena Bonizzi, and Nikhil Verghese. 2018. "Electrolytic Surface Treatment for Improved Adhesion between Carbon Fibre and Polycarbonate" Materials 11, no. 11: 2253. https://doi.org/10.3390/ma11112253