Review

Performance Evaluation of Maximum Power Point Tracking Approaches and Photovoltaic Systems

1
Power Electronics and Renewable Energy Research Laboratory (PEARL), Department of Electrical Engineering, University of Malaya, Kuala Lumpur 50603, Malaysia
2
Department of Electrical, Engineering, University of Malaya, Kuala Lumpur 50603, Malaysia
3
Department of Computer System & Technology, Faculty of Computer Science & Information Technology, University of Malaya, Kuala Lumpur 50603, Malaysia
4
School of Engineering, Deakin University, Waurn Ponds, Victoria 3216, Australia
*
Authors to whom correspondence should be addressed.
Energies 2018, 11(2), 365; https://doi.org/10.3390/en11020365
Submission received: 5 January 2018 / Revised: 27 January 2018 / Accepted: 29 January 2018 / Published: 4 February 2018
(This article belongs to the Section A: Sustainable Energy)

Abstract

:
This paper elaborates a comprehensive overview of a photovoltaic (PV) system model, and compares the attributes of various conventional and improved incremental conductance algorithms, perturbation and observation techniques, and other maximum power point tracking (MPPT) algorithms in normal and partial shading conditions. Performance evaluation techniques are discussed on the basis of the dynamic parameters of the PV system. Following a discussion of the MPPT algorithms in each category, a table is drawn to summarize their key specifications. In the performance evaluation section, the appropriate PV module technologies, atmospheric effects on PV panels, design complexity, and number of sensors and internal parameters of the PV system are outlined. In the last phase, a comparative table presents performance-evaluating parameters of MPPT design criterion. This paper is organized in such a way that future researchers and engineers can select an appropriate MPPT scheme without complication.

1. Introduction

Energy is a necessity in our lives, contributing to the development of economies, and social growth [1,2]. Fossil fuels such as coal, gas, and oil contribute nearly 87% of the total global energy production, whereas nuclear power plants generate approximately 6% of the energy. Renewable-energy, such as solar, geothermal, wind, hydro, and biofuels, produce the remaining 7% of the total energy demand [3,4]. In the last couple of decades, many studies on solar energy have been conducted because of its abundance, renewability and clean nature [5,6]. Photovoltaic technology (PV) is an important technology that can convert solar irradiance directly to electrical energy through a PV panel [5,7]. However, solar PV panels have drawbacks, such as very low energy conversion efficiency (less than 22.5%), the high manufacturing cost of energy, and high dependence on environmental factors [5,7,8,9]. The power of a PV array is unstable, and the current and voltage characteristics curve of a PV cell is non-linear at different solar irradiations, temperatures, and loads [10,11]. Conventional maximum power point-tracking (MPPT) algorithms are designed for uniform environmental conditions where the P-V curve generates only one maximum power point (MPP) [12,13]. Cloud cover, trees, buildings, and bypass diodes cause numerous power peaks on the PV string [12,14]. One of the main challenges of designing MPPT schemes is to the need to quickly detect global MPPs (GMPPs) instead of searching for other local MPPs (LMPPs) under partial shading conditions (PSCs) [15]. Numerous MPPT techniques for investigating the performance of an overall PV system will be reviewed, and their advantages and drawbacks will be identified. Based on their implementation complexity, flexibility, reliability, and cost, the MPPT methods can be evaluated on the basis of the speed and accuracy of GMPP tracking under PSCs. The performance evaluation of MPPT schemes is imperative because of their sensitivity to various dynamics. This paper is organized as follows. Section 2 presents PV array modeling and its normal and shading conditions. Section 3.1 compares the dynamic parameters of incremental conductance (INC) algorithms. Section 3.2 presents perturbation and observation (P&O) techniques. Section 3.3 presents other MPPT schemes. Section 4 discusses the standard evaluating parameters to select a suitable MPPT. Section 5 discusses the performance-evaluation parameters of a PV system and diverse MPPT techniques.

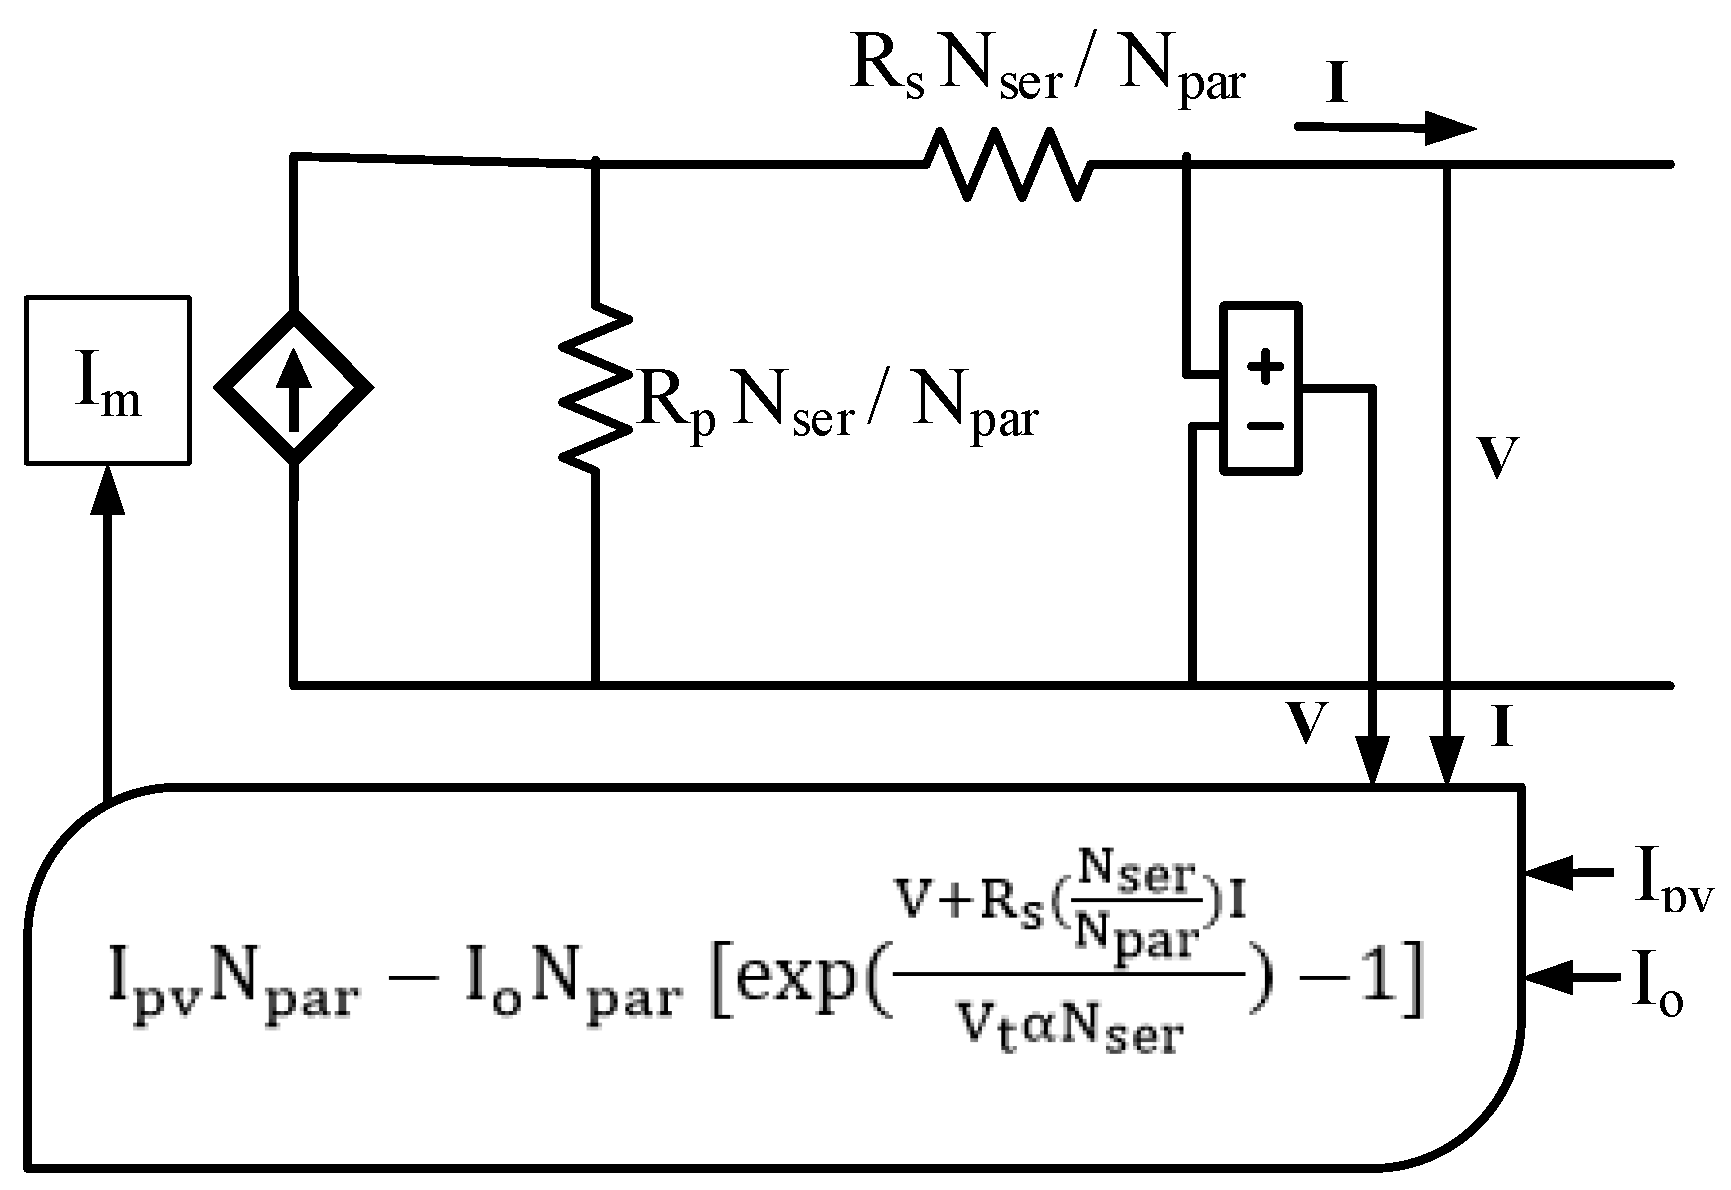
2. PV Array Modeling

Modeling PV arrays for different atmospheric conditions is a vital issue in designing the size of a PV plant and its MPPT controllers [16]. Selecting accurate parameters for the model to achieve precise matching between simulated results and the characteristics of the PV array under PSCs is a challenging task [17]. A PV array behaves as a hybrid device in the current and voltage source, based on the nature of tracking [18].
I = I p v N p a r I o N p a r   [ exp ( V + R s ( N s e r N p a r ) I V t α N s e r ) 1 ]   V + R s ( N s e r N p a r ) I R p ( N s e r N p a r )  
where,
  • IPV: current generated by the incident light (A)
  • Io: reverse saturation or leakage current of a diode (A)
  • q: electron charge (1.60217 × 10 19 C)
  • k: boltzmann constant (1.38065 × 10 23 J/k)
  • α: diode ideality constant (1< α < 1.5).
  • Rs: equivalent series resistance of the array (Ω)
  • RP: equivalent parallel resistance of the array (Ω)
  • Nser: number of cells in series.
  • Npar: number of cells in parallel.
  • T: temperature of a P-N junction (k), and.
  • Vt: the thermal voltage of an array (V)
Figure 1 shows a circuit diagram of a PV array. Figure 2 depicts the characteristics of a PV array under different solar insolation conditions, and Figure 3 shows the PV array characteristics under different temperatures, namely (25 °C, 50 °C and 75 °C). Figure 4 and Figure 5 demonstrate the P-V and I-V curves in four PSC conditions with an ambient temperature of 25 °C. Two LMMPs and a GMPP are shown at the PSCs in Figure 4.

3. Assessment of Common MPPT Strategies

3.1. INC Algorithms

The conventional fixed step size (FSS) INC algorithm is based on an idea that its slope or the sum of the instantaneous and INC of the P-V curve is zero at MPP, positive at the left of MPP and negative at the right of MPP [19,20]. This algorithm is confused when detecting MPP during the steady-state conditions and transient stages [21]. As an alternative, an adaptive step size INC approach is employed in the PV system to increase convergence speed and tracking accuracy by reducing the number of iterations of searching reference voltage [22]. Subsequently, a low-cost adaptive algorithm is used to exclude manual perturbation to increase tracking efficiency, improve transient behaviour and reduce the steady-state oscillations around MPP [23]. The variable step size (VSS) INC approach optimizes the large step size of a duty cycle at the farthest locus of the MPP. This approach produces fast tracking speed but creates additional oscillations and vice versa [14,24]. Therefore, a modified variable step INC scheme is required to create a trade-off between the dynamics and the steady-state oscillations [21]. The performance of the VSS-INC algorithm is lower in dynamics due to a deviation in the step size of the duty cycle under PSCs. A current controlled variable step size incremental resistance (INR) MPPT algorithm is implemented to concurrently boost the tracking speed in the dynamics and the accuracy at the steady-state [25]. The power increment (PI) aided INC MPPT is then introduced to improve the slow tracking speed on the left side of the MPP due to the confusing flat-low values of current change (ΔI) in a PV panel with almost zero I-V slope [26]. To attain maximum power transfer from a PV array, this method includes the frequency and duty cycle control variables (VFCD and CFVD) [26,27].
Several hybrid INC techniques are described in this paper. First, a solar tracker (ST) is combined with the improved INC and constant voltage (CV) method to guarantee the rapid computation of MPP with limited searching space for a reference voltage during non-uniform weather conditions. This limited searching space provides less computation in searching for required parameters, the best tracking scope and an increased convergence speed [5]. The fractional open circuit voltage (FOCV) and fractional short circuit current (FSSC) algorithms have been merged with the INC technique to avoid extra control loop and intermittent disconnection. However, a periodic tuning of a duty cycle is required to operate a PV array at its optimum expected power. To operate the PV system at GMPP with swift convergence speed, the permitted error in the duty cycle is predicted to be approximately 6% [28].This algorithm is used to differentiate between GMMPs and LMPPs extracted from the PV characteristic curves under partial shading conditions [29]. A regulated duty cycle enhances an overall system efficiency by diminishing the power oscillations during the steady-state conditions [30]. The main purpose of a hybrid Fuzzy Logic Controller (FLC) with INC system is to track the MPP precisely and speedily in the dynamic and equilibrium conditions. The system can overcome the drawbacks of a fixed conventional INC MPPT. The FLC has a considerable effect in reducing power fluctuations near MPP under PSCs [6,31]. Table 1 shows a comparison of the main INC MPPT parameters.

3.2. P&O MPPTs

The conventional P&O scheme is part of a hill climbing (HC) algorithm. When the difference between instant power P(k) and actual power P(k−1) is positive (dP/dV > 0), the direction of an operating point is located toward the MPP and vice versa. To achieve the MPP locus, the perturbation of a PV voltage and current continues in both directions [32,33,34]. The drawbacks of the algorithm are the occasional tracking deviation from the MPP, slow tracking speed, and steady-state oscillation at the vicinity of the MPP under PSCs [34]. Improved performance is expected upon accelerating the PV system into a steady-state level prior to the next perturbation, when the frequency of a perturbation is small enough [35]. A modified fixed-step P&O algorithm is then introduced to reduce the trade-off between steady-state oscillations and tracking speed by selecting a proper scaling factor [36]. To overcome this trade-off, a conventional adaptive P&O is introduced, however, the same difficulty is encountered due to its dependency on a pre-determined step size and fluctuating open circuit voltage (Voc) under PSCs [37]. Moreover, an adaptive variable step-size P&O is developed to improve tracking efficiency and convergence speed where an adaptive perturbation of a duty cycle change (ΔD) and periods (T) are determined to observe a load current [38]. The adaptive perturbation brings an operating point close to MPP based on the estimation of a fractional short circuit current (Isc) [39,40], and the variable perturbation reduces power oscillations toward the MPP [39]. The performances of the conventional and adaptive P&O algorithms are diminished due to a drift that occurs from the incorrect selection of a duty ratio (ΔD), and the large change in perturbation [41]. The P&O algorithm searches for an optimal power point consistently toward the front and back of a P-V curve even after detecting MPP, thereby resulting in several oscillations around the MPP [42,43]. The oscillations can be reduced by selecting the smallest step size, but the tracking speed will be decelerated. However, the transient response is overcome due to delayed time in perturbation [43,44].
An offline FSCC is combined with an online P&O to disconnect a PV array solely at PSCs and at the inaugurating moment of the steady-state conditions. FSCC measures an operating point and sends it to the online P&O algorithm. This method exhibits high tracking speed and less oscillations around the MPP in PSCs [43]. Moreover, a modified hybrid drift avoidance P&O strategy with a fixed and adaptive technique is applied to obtain the best decision for the duty ratio. Consequently, the PSCs in this method solve the drift problem by moving an operating point adjacent to the MPP by increasing the duty cycle (D) and positive values of dV and dI [41]. To improve tracking efficiency, convergence speed, and steady-state response as well as reduce the searching space, a particle swarm optimization (PSO) scheme is integrated with P&O. In this method, the P&O scheme consistently searches for a unique MPP under uniform environmental conditions to track a current LMPP at non-uniform environmental conditions [45,46]. Then, the PSO technique is employed to regulate the perturbation size of the P&O method at an instant of the PSCs [45,47]. An adaptive P&O algorithm is merged with FLC to obtain a high tracking accuracy and reduced computational time without requiring PIC. This hybrid technique improves system performance in steady-state and dynamic conditions by reducing the step-size of the MPP in an incorrect direction and increasing the step size in the true direction of the MPP [48]. To guarantee rapid convergence speed, an ant colony optimization (ACO) approach is merged with the P&O method, which occasionally detects GMPP in the form of LMPPs regardless of variations in the duty ratio (ΔD). Oscillations are observed during the ACO search period but they are removed by the P&O algorithm [49]. An artificial neural network (ANN) method is incorporated with the P&O algorithm to sample the position of an operating point by measuring currents and classifying the output reference voltage from partially shaded I-V curves. At each change in irradiance, the ANN algorithm predicts a new area of GMPP in which the tracking position as a voltage value is measured by the P&O technique. Then, the P&O algorithm searches for the GMPP by perturbing the direct duty cycle into the pre-approximated zone left by the ANN algorithm [50]. The hybrid model based (MB) and heuristic P&O algorithms are implemented without direct temperature and irradiance measurements to enhance tracking and dynamic performances with less computational time and complexity [51]. In the hybrid gray wolf optimization (GWO) and P&O methods, the offline GWO brings the operating point nearest to the obvious MPP by reducing the searching space. Then, the online P&O method is executed to track the best wolf position when the wolves are closest to one another. This combined technique can reduce the computational load at every transition period of the atmospheric conditions, consequently accelerating the convergence speed around GMPP at PSCs. In this combined method, only three animals have been assumed to scale down computational complexity, although a larger number of animals produce a more precise MPP [52]. Table 2 describes all the parameters of the P&O algorithms.

3.3. Other MPPT Techniques

In this technique, the search skip judge (SSJ) and rapid GMPPT algorithms are integrated to skip unimportant voltage intermissions (LMPPs) from a P-V curve at PSC, which yields a high tracking accuracy with the best possibility of tracking the GMPP [12]. The gaussian arctangent algorithm (GAF) generates an adaptive perturbation step size using the variations of error (E) and error change (ΔE) to overcome a trade-off between tracking speed and the oscillations around MPP. This system has rapid dynamic performance, less oscillations around MPP, is robust in harsh atmospheric conditions, and any similar function can be applied to it [53]. A double integral sliding mode controller (DISMC) is developed to remove steady-state error (SSE) by being integrated twice at the error section of the tracking voltage on its sliding exterior. A converter can be operated with an accurate voltage regulation at PSCs and load variations because this adds one more integral part into the sliding surface of a controller [54]. The main advantage of this technique is that the system stability is retained over the parameters, input values, and load variations within the PV system [54,55].
The nature-inspired unconventional flower pollination algorithm (FPA) is designed to use a search space with flexibility in parameter adjustment. It also has faster convergence speed at PSCs than the PSO technique because of the continuous adaptation of the duty cycle in each iteration. The FPA can successfully locate the LMPPs and GMPP precisely in zero, low and high shading conditions, even in the second iteration out of 25 iteration numbers [56]. The model-less extremum seeking control (ESC) method is an alternative application of the P&O algorithm at PSCs to improve transient response and convergence speed. However, its validation is limited near the MPP because an assumed function is used to test the stability performance [57]. To confirm high tracking speed during the transient period and minimum power oscillations in the steady state with less complexity, a modified beta method is designed. This method is more accurate in tracking GMPP compared with conventional hill climbing (HC) algorithms, when its scaling factor N is selected correctly during the changes of β at PSCs [58]. Auto tuning of the parameters, such as scaling factor N, is applied to accelerate tracing speed during the transient stage at PSCs. To validate β parameters for the PV system, the meteorological data in a year are taken from two different places [59]. A brief comparison between the parameters of other MPPT algorithms is presented in Table 3.

4. Performance Evaluation Parameters

Figure 2 shows the non-linear characteristics of P-V and I-V curves under different solar insolation levels. The maximum output power of a PV system is obtained when the impedance between the panel output and load is equal. Under different illumination and temperature values, the MPPT controllers can match a load impedance to an output impedance of the PV cell [60]. The output energy can be increased by 56% using a MPP tracker with a three-positioned one-axis system [61]. Selecting the best MPPT technique can be difficult because many MPPT trackers exist. Therefore, several criteria, such as PV technologies, implementation techniques, the number of sensors used, output power efficiency, cost effectiveness and system applications are considered in selecting the best MPP tracker [8,62]. Thus, many of the performance evaluation parameters of a PV system and the MPPT trackers are outlined in the following section.

4.1. PV Module Technologies

PV cell technologies are categorized into four systems, namely, mono-crystalline (m-Si), poly-crystalline (p-Si), thin film and hybrid systems. A black-colored m-Si and a blue-colored p-Si are considered traditional-type PV cells, which are highly efficient and reliable, but costly. Thin films consist of amorphous silicon (a-Si), copper indium gallium selenide (CIGS), cadmium telluride (CdTe), copper indium selenium (CIS) and dye-sensitized solar cells (DSSC). The main advantage of thin film is its low voltage temperature coefficients that reduce power losses against hot temperature profiles. The production cost of the thin films is lower than that of the traditional technologies [63,64]. A hybrid PV cell with an intrinsic thin layer (HIT) is called heterojunction. It performs well in extremely hot temperature zones because of an increased open-circuit voltage across the cell, in which the temperature coefficient is less than that of m-Si silicon. Another low-cost hybrid PV cell with merits of thin-film and crystalline modules is called a Smart Silicon. HIT and Smart Silicon are highly suitable for high-temperature climates due to their high-power density and hard-glass-back-sheet, respectively. The selection of commercial PV technology for a specific location has to consider several factors, such as ambient temperature, shading, space constraints (dirt), user affordability, and profitability in primary investment, maintenance, and operation. Research has been conducted to evaluate the performance of PV plants with different technologies, monitored by MPP trackers in different environmental conditions and site locations. Rainfall, occasional cleaning of the cell and the wrong inclination of the PV module can reduce the power of the PV cell from 2% to 7%. In Egypt, power loss was found to be almost 50% in the installed PV technology due to a huge soiling spot on the module even though it was cleaned every day compared with only 1–7% power losses observed in Italy [65].
A total of 14 months of data from five PV technologies, namely, p-Si, m-Si, CIGS, CdTe and CIS, all operating in a mountainous climate zone, was analysed to investigate their conversion efficiency and relative losses. The result of the analysis indicates that p-Si, m-Si, and the CIGS thin-films are the most efficient modules in high-temperature climates with hot and sunny summers as well as cold, snowy winters. However, low efficiency is observed in thin film, especially in CdTe technology. CIGS has 15% efficiency losses compared with the CdTe and the CIS. Another investigation was conducted on eight different PV technologies for 18 months. The analysis showed that in the scope of MPP tracking, the p-Si type consistently produced higher energy each month than the thin-films. In autumn and winter, energy yield is the same for HIT, p-Si, cdTe, and a-Si/uc-Si type cells, but in summer, the results varied over time. Moreover, HIT, p-Si and a-Si/uc-Si are the most profitable technologies and suitable for a grid-connected PV system for residential and industrial applications [65]. During the winter season, m-Si and p-Si modules cease to access solar irradiance because their glass surface becomes too rough due to snow retention. However, these two technologies produced high-output power during the day when used with MPP trackers at direct solar insolation level. In particular, the p-Si module does not have rough surface issues when used in continental weather climate zones. In a typical climate zone, the CIGS technology is preferable due to its cost effectiveness. These PV modules are not recommended to be used in windy or rapid air-circulated areas because snow takes a longer time to melt [66].

4.2. PV Module Connections

A single-diode PV cell generates extremely small current and voltage but is used in many PV applications due to its high accuracy and performance under uniform solar insolation. To increase the voltage and current through the PV cells, interconnections between cells should exist to form a module or an array [67]. An increased cell current and output voltage are obtained from series and parallel-connected cells, respectively [68]. The encapsulated configurations, usually among 36 cells can be connected in series (SC), series-parallel (SP), total cross-tied (TCT), bridge linked (BL) and honey comb (HC). TCT, HC and BL are categorized on the basis of their power extraction capability [67]. Power mismatches can occur in the cells when they are exposed to dissimilar shading patterns. If a short circuit occurs in the module terminals, the non-uniform irradiance creates different voltages, which are negatively biased in some PV cells [67]. Piece-wise linear parallel branches model (PLPB) and the Newton Raphson method are introduced to solve this mismatch problem in the PV modules [67].
In the SC module, a bus connection has ohmic losses and the SP module treats each module as a single unit and tracks MPP separately. Thus, the degraded modules do not hamper the performance at non-ideal atmospheric conditions on other modules. In every SP cell, MPP voltages are identical with independent illumination, output power is slightly affected by a small deviation in the MPP voltages, and the temperature fluctuation within 20 K is slightly sensitive for MPP voltages. Therefore, MPP can be accurately tracked from the SP connection because it has a common reference voltage for each cell regardless of the differences in the current caused by the shading patterns. In portable applications, a shaded cell in the SC connection reduces desired operating voltage at non-ideal solar illumination conditions [69].

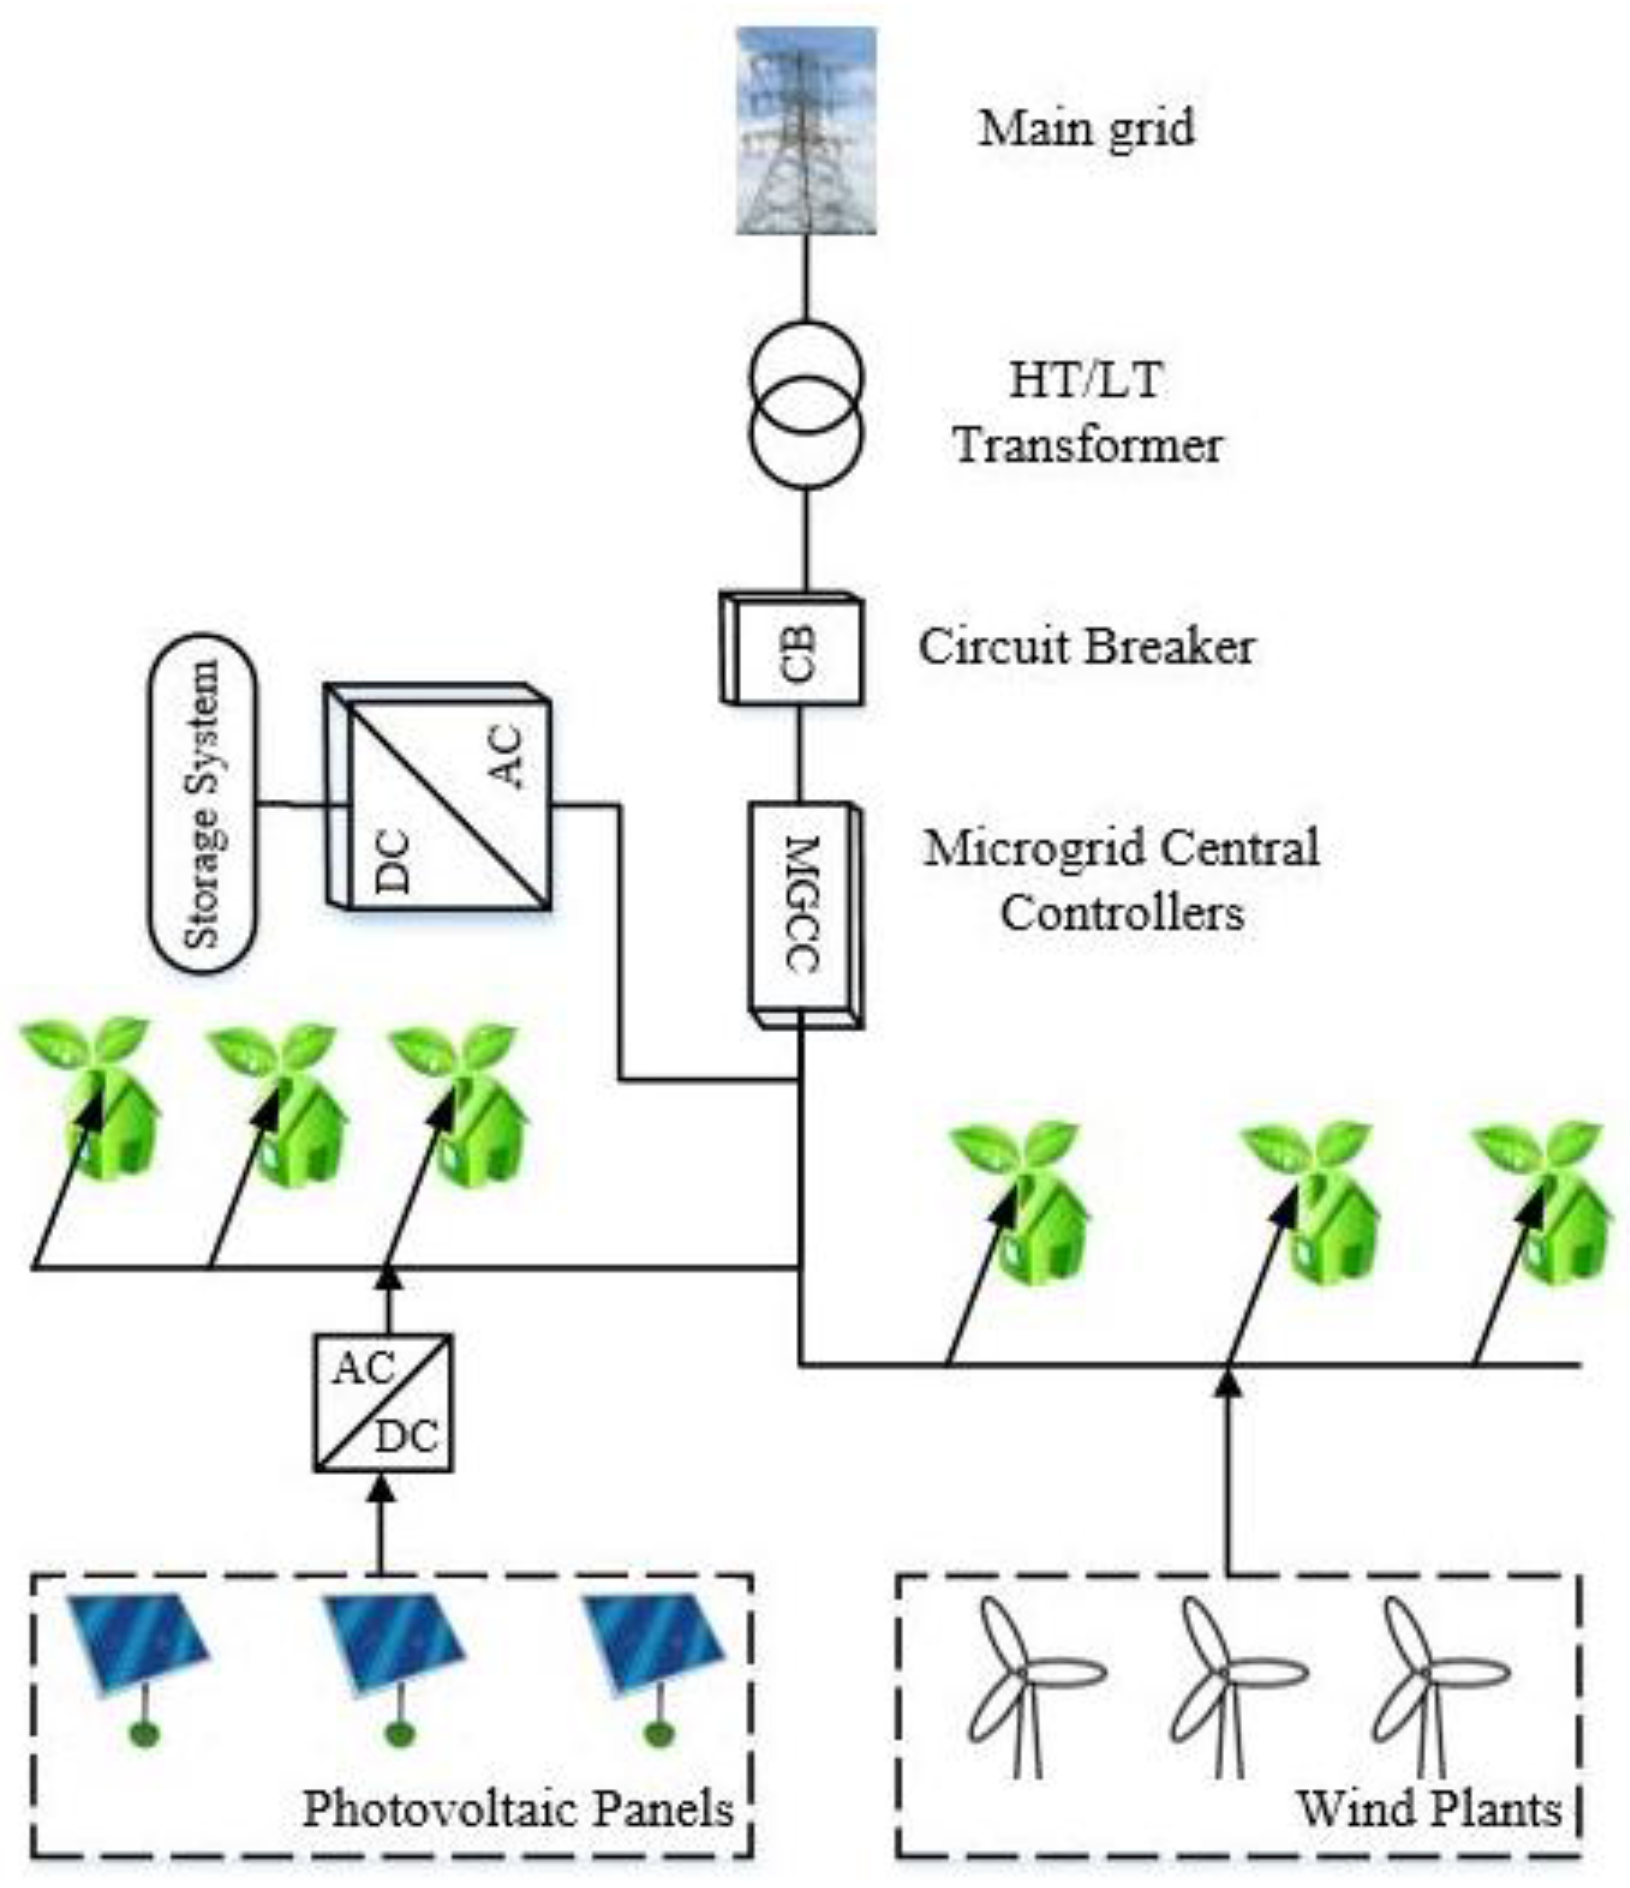
4.3. Grid-Connected PV Stability and Island Mode

PV plants are first characterized by small rated power and connected to the low-tension distribution networks. Subsequently, a large plant (10 MWp) is designed from many small plants and interconnected with medium distribution lines or high-voltage electrical networks (115 kV, 60 Hz). The purpose of this procedure is to estimate an approximated reliable active power, reactive power, and voltage regulation at the point of interconnection (POI). This procedure introduces new aspects to improve the operations of the transmission and distribution networks while an interconnection between newer PV plants and the electricity grid is formed [70,71]. An investigation conducted by the International Energy Agency (IEA) in 2013 found that the installation of GCPV systems exceeded off-grid PV systems by 99%. This resulted in a mean power loss from GCPV systems of between 5.7% and 10% in transmission and distribution networks in California in the United States [72]. The following parameters should be addressed for stability analysis: impedance to a grid line; DC voltage and current control; and the reactive power control, store energy and frequency regulation in the inverters [72,73]. The stability of the GCPV output power is affected by highly penetrated grid generators. Thus, dynamic stability analysis is essential for faults that might occur in a grid network system [73].
During grid failure, a PV system continuously delivers power into the grid line. This system is called an island mode. The voltage fluctuates and causes disruption between the PV station and the grid line that deteriorates grid efficiency. Islanding is dangerous because utility workers may not notice the existence of power supply in the grid line. An automated mechanism in an inverter is required to counter the islanding problem caused by the matching phase, frequency, and voltage across the grid network [74]. Establishing balanced power and stability using micro-grid (MG) operation is the most difficult issue [75]. A self-controlled MG can be used to isolate the grid network from powering and to let a distributed generator (DG) deliver supply into a regional circuit in island mode, as shown in Figure 6 [76,77]. Island detection methods have disadvantages, such as the pollution caused by the utility method, dead zones caused by the passive method, and the time requirements of the active method. Harmonic voltage detection is an example of a passive method. A wavelet analysis has been adopted to detect or diminish increased harmonic blind marks of the voltage in the islanding stage [74].

4.4. Seasons and Locations of PV Installation

The most influential factors in achieving optimal efficiency are the seasonal climate and the geographical location of the PCV system. Excessive heating of a PV panel located in hot-climate zones degrades the performance of the PV system. An investigation of crystalline silicon modules was conducted using solar tracker (ST) MPPT. This investigation indicated that energy production is more than 39% in Berlin, Germany, 16.8% in Stuttgart, Germany, 30% in Turkey and nearly 8% in Aswan, Egypt [61]. Rooftop technologies, such as green or white roofs, are popular in hot rural areas to achieve the best performance of a PV system. However, a study of the roofs in cold cities with their thermal profiles has been conducted. Vancouver, Calgary, and Toronto in Canada, showed that cost-effective white roofs (cool roofs) with optimal solar reflection have worsened the effects on the environment due to an overheating penalty in warm climates, thus, these types of roofs are not recommended in the aforementioned regions. Moreover, an expensive green or grassy roof is suitable for rich countries because less energy is required in the heating and cooling processes [78].

4.5. PV Panel Tilts and Orientations

A moveable sun tracker (ST) used with the PV panel can increase daily energy production by 43.87% compared with a fixed system. This rate may vary between 10% and 100%, depending on the different time frames and site locations [79]. The use of dual-positioned ST method (morning and afternoon) in a solar panel can improve energy production by 10–20%. However, the ST tracker is not recommended for use in small solar collectors, especially in residential applications or in hot climate zones due to its high design cost and high internal energy consumption (5–10%) [61,79]. For the fixed installation of a PV plant without ST, deviation of the tilt angles throughout the year reduces gross output power, notably, at non-uniform solar insolation levels. The surface of the installed PV panel can be adjusted to be perpendicular to the sunlight to reduce the fluctuating trends of the output electricity of the PV due to earth and sun dynamics and moving cloud coverage. For an additional cost, an optimum tilt angle can be set for summer and winter, and the azimuth angle can vary from east to west throughout the day [79,80].
A 2015 report investigated the cost-effectiveness of installed PV panels in 23 sites in Germany and Austria for various tilt angles and adaptations. The cost impact of the electricity generation after the adjustments of the tilt and azimuth angles is low in the short and medium term, respectively, except for a plant size of approximately 70 GW [80]. Another study found that the power yield increased monthly and seasonally in five cities in Malaysia. The seasonal and monthly increments in Kuala Lumpur, Johor Bahru, Ipoh, Kuching, and Alor Setar are 5.03%, 5.02%, 5.65%, 7.96% and 6.13%, respectively. The seasonal increments for the same cities are 4.54%, 4.58%, 5.70%, 4.11% and 5.85%, respectively [81]. Another study conducted in Belgrade, Serbia found that the optimum tilt angle was 44.47° north for each square meter of the solar panel mounted on a building. Compared to a fixed system, the amount of the energy gained annually, seasonally, and monthly is 5.98%, 13.55% and 15.42%, respectively. No significant distinguishable difference in collected energy is found when the optimum tilt angles are regulated daily, monthly, or every two weeks. For maximum performance, adjusting the angles is not necessary for every season (spring, summer, autumm, and winter), only at the beginning of spring and autumn [79].

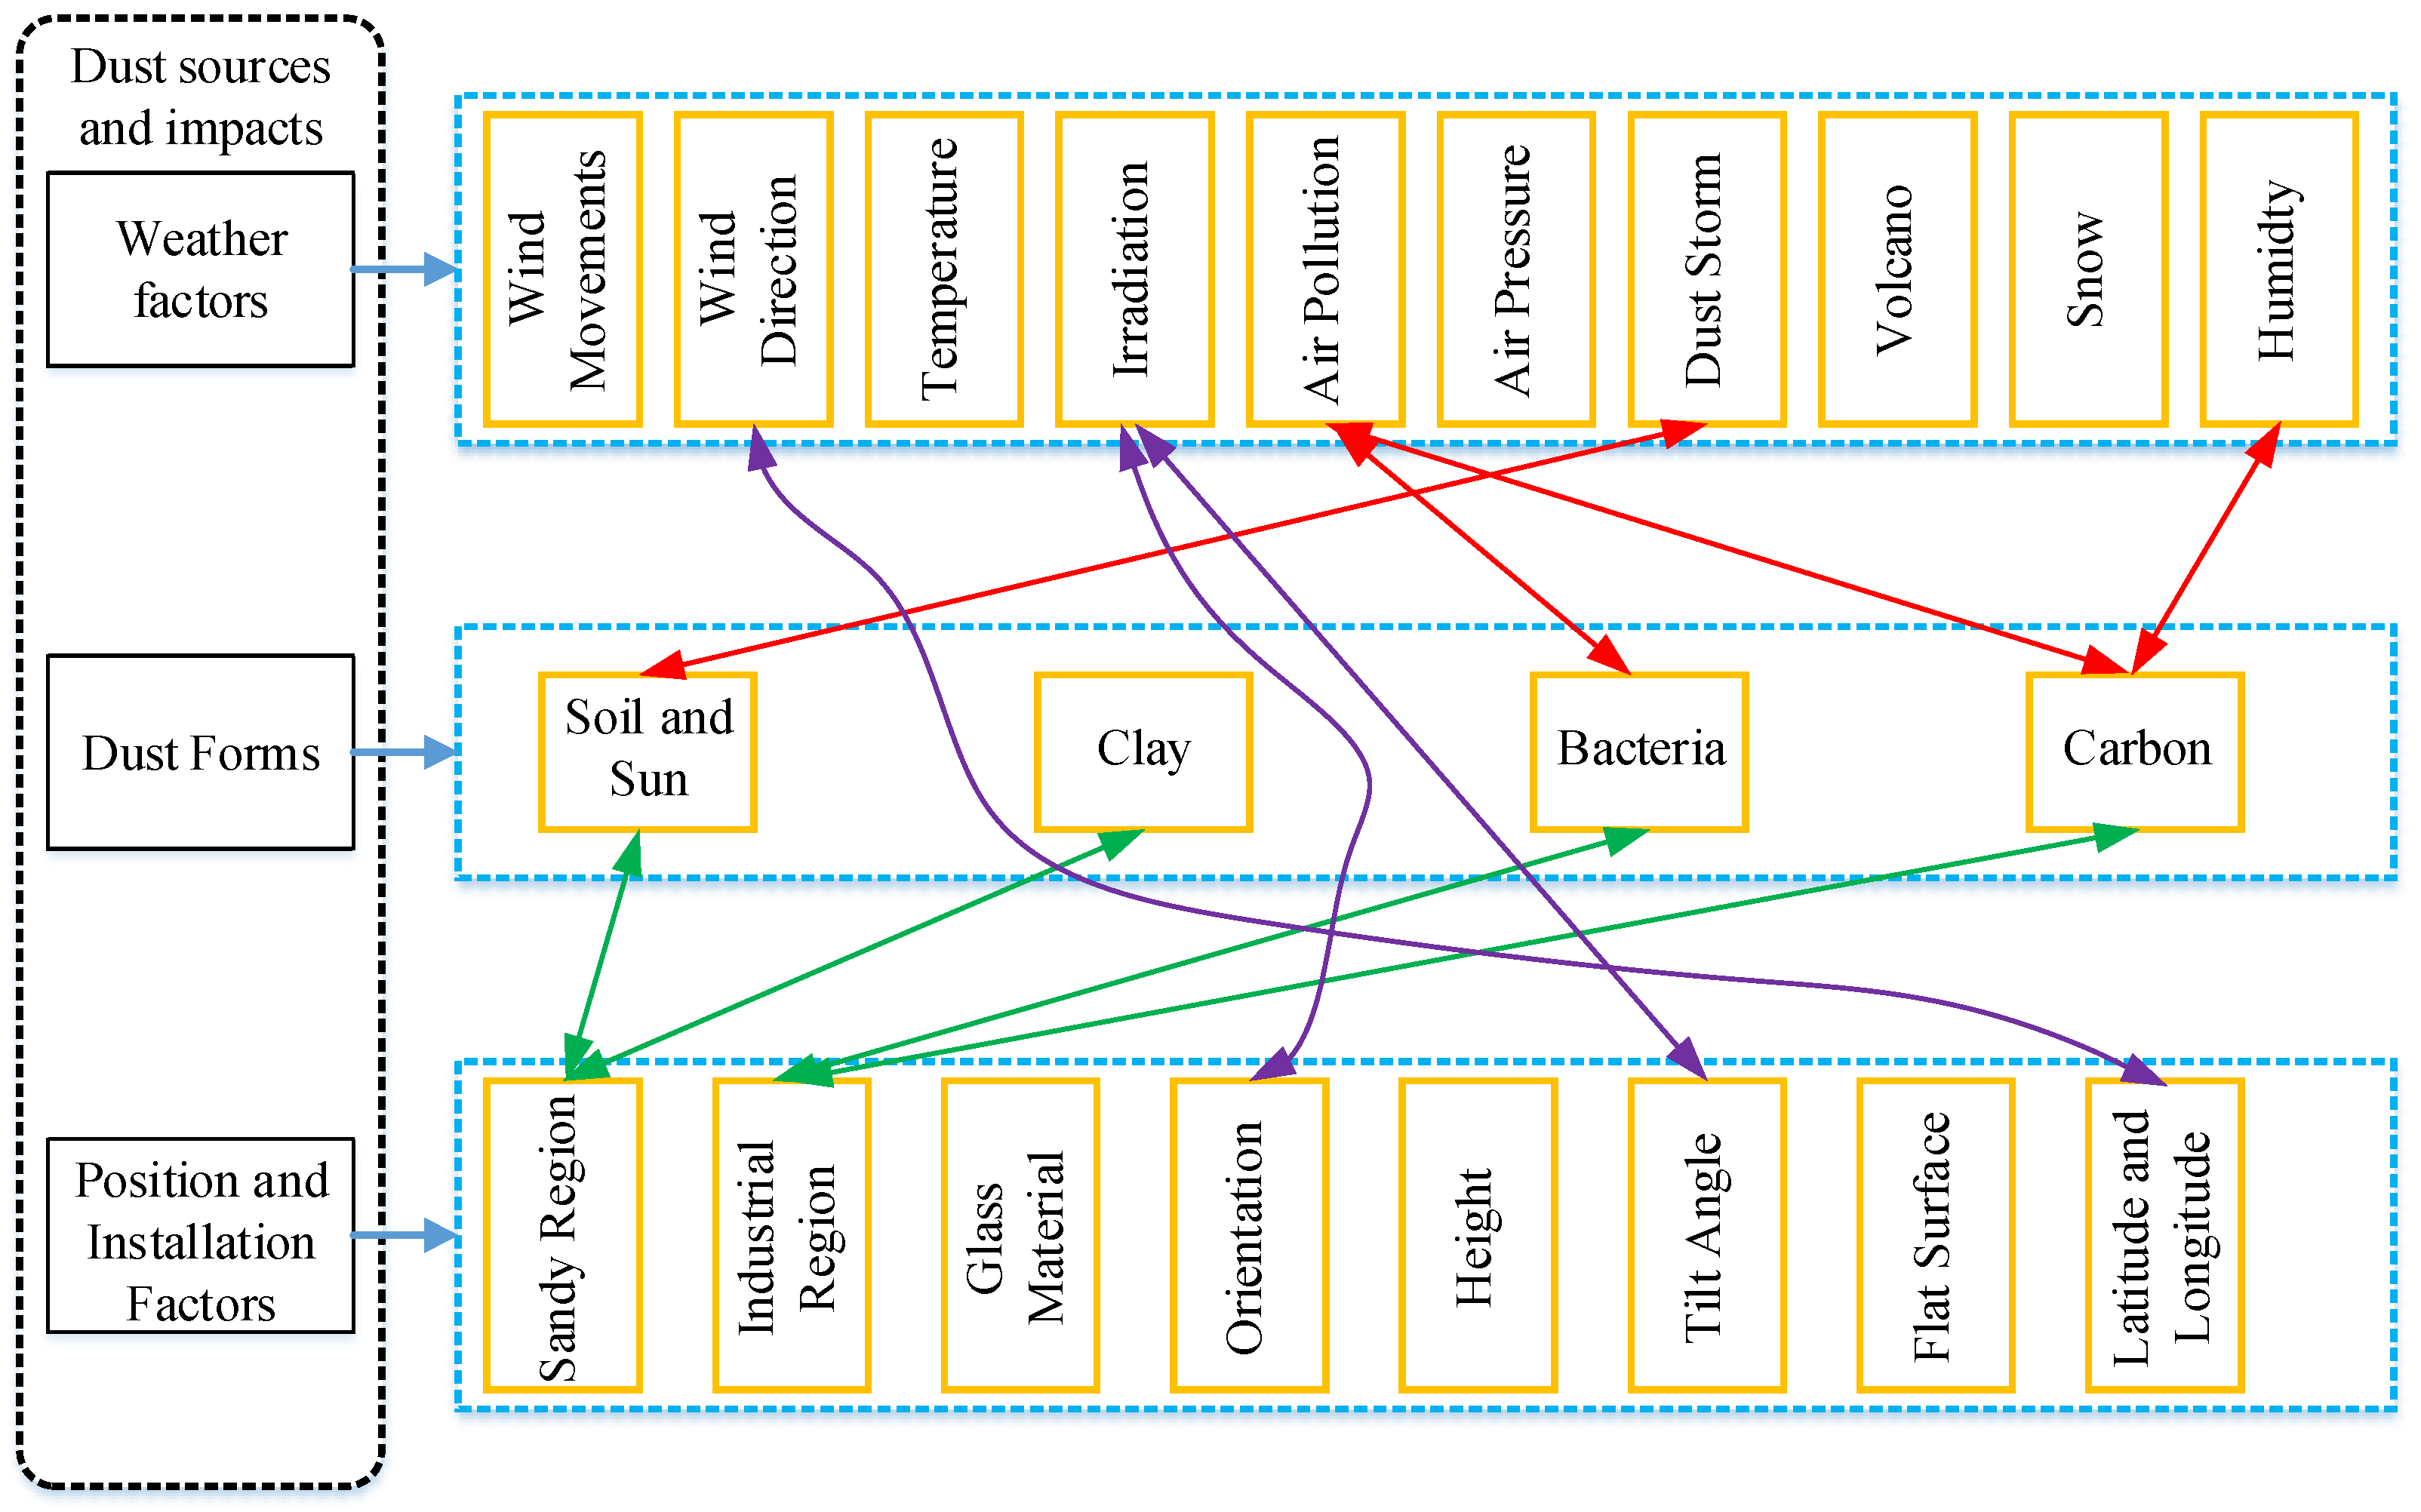
4.6. PV Module Soiling Effects

Soiling consists of debris, such as dirt, tree leaves, bird droppings, and dust from vehicular exhaust, airflows, building construction, pedestrians, and volcanic eruptions. Figure 7 shows a chart consisting of the causes of dust accumulation on the surface of PV arrays. The worst dust materials are desert sand and polluted soil, which are mostly found in Middle Eastern and North African countries. Libya has the highest dust deposits from the Sahara Desert [82,83]. The performance of the PV module is negatively affected by environmental factors, especially soiling (which causes a 2–50% power loss), due to the scattering effects of the sun on its irradiance [83,84] and blocked sunlight. The PV cells were shaded by the two types of soiling, namely, soft shading due to air pollution, and hard shading due to dust blocks and bird droppings (typically 10 um) [83].
In soft shading, the voltage in the PV panel was unchanged, but the current was affected [82,83]. In hard shading, the output power of the PV panel was reduced when the voltage decreased. Various studies have been conducted on the effect of soiling on PV cells. In Massachusetts, USA, dust analysis showed 1% solar radiation loss in three months, and 4.7% instantaneous power loss was also recorded which was the most noticeable degradation during the period. Another study conducted on 204 sites in California found that efficiency degradations during normal weather with no rainfall were 0.2% daily and 1.5–6.2% annually [83]. Moreover, an investigation of three dusty PV modules located in Baghdad, Iraq found that the average monthly, weekly, and daily percentage of performance degradation was 18.74, 11.8 and 6.24 respectively [84]. A five-month analysis in the Canary Islands, Morocco found a −20% reduction in PV efficiency due to soiling on the PV array from building construction [85].
A set of artificial cleaning methods has been proposed to protect the surface of PV modules from dust accumulation and natural processes, such as volatile rainfall and unpredictable winds. In the manual cleaning process, brushes with special bristles can be used to remove the soil and protect the module from scratches when washing. Furthermore, washing and scrubbing can be performed with brushes combined with a water supply. Mobile cleaning is another pragmatic process in which a machine is used to clean the module surface with the reserved water or a sprinkler system. Cleaning is recommended weekly during dry seasons and daily during sudden dust accumulations [83].

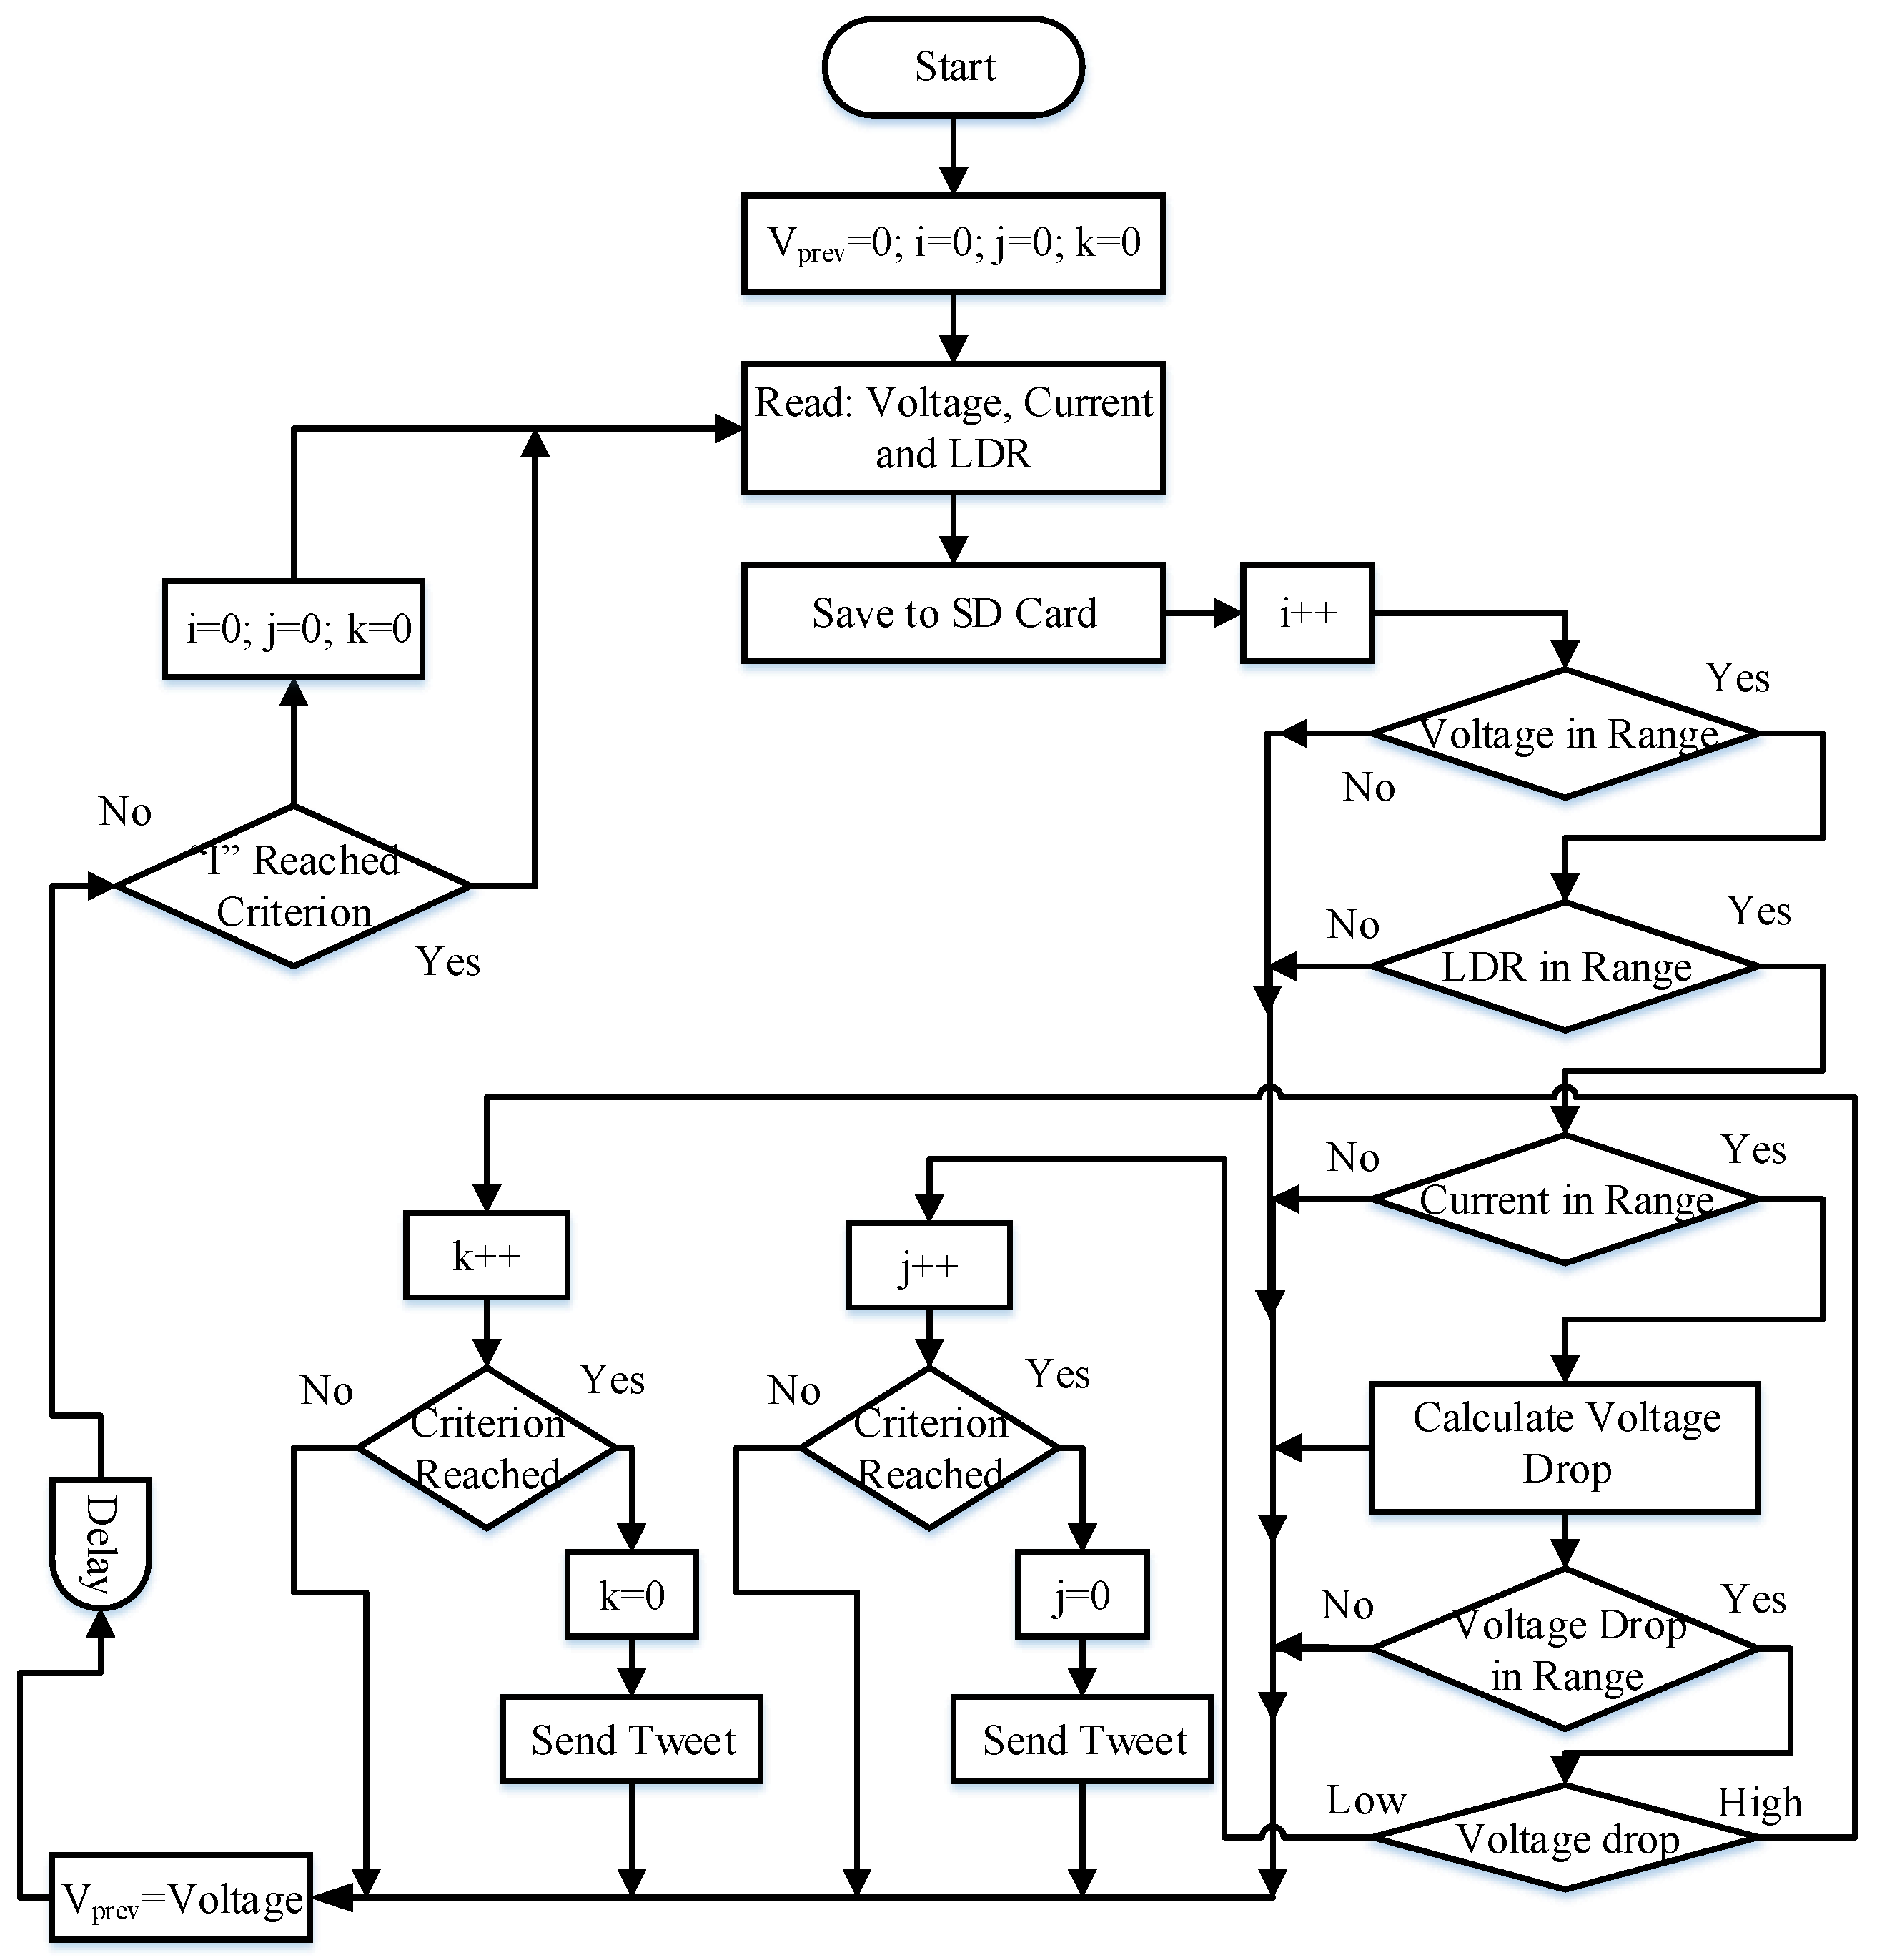
4.7. PV Panel Snow Effects

PV systems are well-developed for use in temperate regions regardless of their low solar illumination, especially in Northern European countries, and frequent snowfall in Northern America, Canada, Japan and Germany [86]. Snow degrades the PV generated power in three ways; through wave diffusion, albedo reflection to the neighboring module and conduction with snowless modules [87]. Power loss due to the snowfall is directly influenced by the tilt angles of PV modules and the level of ground interference [86,88].
A study found that power losses in a year due to snowfall was more than 15% on low tilted PV modules. In Germany, power loss was from 0.3% to 2.7% for an unshaded rooftop module at a 28° angle. Another study was conducted on 209 snowfall samples in Calumet, IT, USA for one year. The samples were composed of four flat monocrystalline modules without ground clearance at 15°, 30°, and 45° tilt angles and three modules mounted with 1.5 m ground clearance at 15°, 30°, and 45°. The power loss in the obstructed module varied from 29% to 34% with no change in tilt angles, and it decreased from 34% to 5% in the unobstructed module by changing the angles between 0° and 45°. On the contrary, the Energy loss at low tilt angles was the same in the obstructed and unobstructed modules. The gross energy losses calculated by subtracting from the obstructed modules to the unobstructed modules were 26.1%, 18.8%, 18.8% and 34% at 45°, 30°, 15° and 0° tilt angles, respectively. These results indicate that the severe-case loss of 34% occurred for the lowest tilt angle, as predicted [86].
A cost-effective snow detection method was applied to a solar PV module for three months in St. John’s, Newfoundland, Canada. The module was composed of an Arduino controller connected with a Wi-Fi system combined with a light dependent resistor (LDR) to measure the output voltage, current, and solar insolation. A Twitter message is sent to the owner if the snow accumulation is more than 5 cm, based on the algorithm shown in Figure 8 [87]. To maximize efficiency during the winter season, modules mounted on the ground should be plowed intermittently, and rooftop modules require active cleaning. The active washing techniques for dissolving the snow blocks from the modules include chemical coatings, pressured hot air and soft squeegees [86].

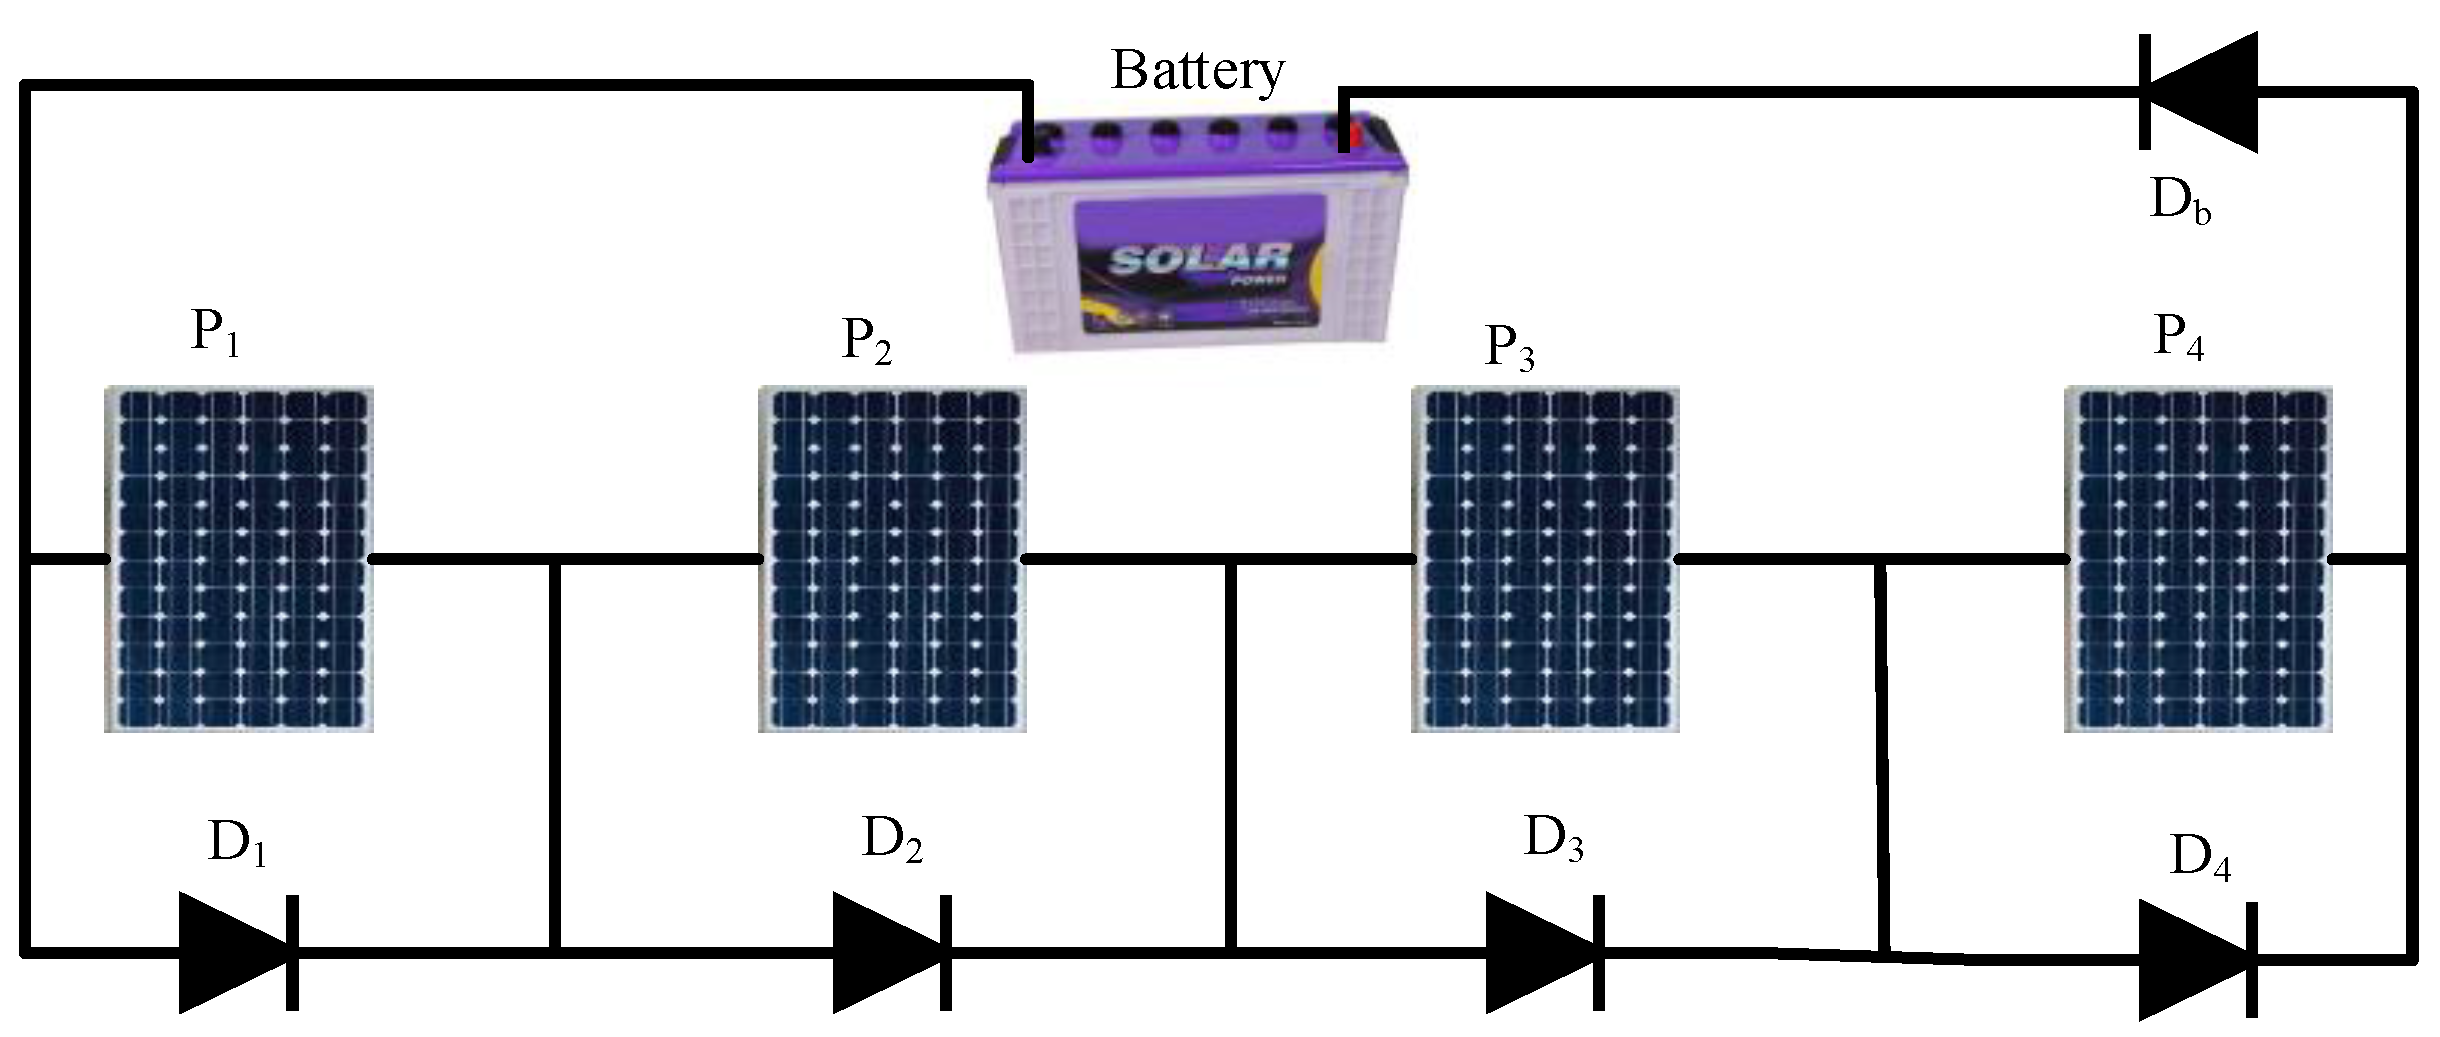
4.8. Bypass and Blocking Diodes

In conventional MPPT configurations, the energy produced by the shaded cell as complete power extraction from the PV array can be preserved because it is inhibited by the cell [69]. A cell will be open circuited or fully damaged if it dissipates more than the maximum tolerated power in the hot-spot stage of non-uniform irradiation [89]. Figure 9 shows that the bypass diodes (D1 to D4) are connected in parallel with the panels, and a blocking diode (Db) is in series with the battery. A bypass diode in reverse biased condition acts as a generator with small internal voltage and leakage current, and the panels are in normal mode operation. However, the bypass diode can sustain a sudden increase in power and temperature [90]. A bypass switch (Mosfet) or a bypass diode is also used in satellite stems to mitigate hot-spotting damage in the PV strings [91]. A bypass diode starts functioning if 20% of the panel is shaded. When the shaded portion of a module exceeds 20%, the power loss is alleviated due to a huge current flowing through the bypass diode [92].
When one cell is shaded, its bypass diode behaves as a load and allows current to flow through it from the rest of the cells, which maximizes the performance of the system [90]. By contrast, a shaded cell can be excluded by using a bypass diode to avoid impediment in power collection from the remaining cells, which results in energy loss from the shaded cell [69,93]. In thin-film CIGS, the bypass diode cannot protect the modules from damage [92]. The bypass diode in the panel produces multiple power peaks on the P-V curve. A power loss can be minimized if a blocking diode (Db) is used to stop current flow from the battery to the panels at night when the voltage across the cells reaches zero [90].

4.9. Implementation Complexity

The PV system is complex in terms of hardware and software implementation. Extra circuitry that provides a single MPP in conventional MPPT algorithms increases the system complexity due to hardware compensation and reconfiguration techniques [12]. The implementation simplicity is a significant factor in selecting the right MPPT algorithm. The level of complexity depends on the measurement of position and weather conditions of the PV system. The proper implementation of MPPT using microcontrollers utilizes the dynamic changes in PV voltages and currents [8]. current and voltage feedback methods are relatively simple to implement due to their minimal complex circuits [94]. Hill climbing and P&O methods are designed with simplicity and implementation flexibility, but recent modifications and developments have increased their complexity [95,96]. Mathematical complexities in hill climbing techniques can be reduced by using DSP or other controllers at the expense of increased system cost [97]. Intelligent MPPT algorithms experience significant complexity in implementation if the primary point is incorrectly selected. However, Rapid-GMPPT is simple to operate because it does not require information on the output electrical features of the PV panel or voltage and current sensors [12]. Complex MPPT algorithms, such as PSO, ANN, RCC, and FLC techniques, are used in PV systems to identify a precise MPP, but their complexity level increases due to the use of microcontrollers [98].

4.10. Effect of Sensors, Switches, and Passive Components

Sensors are used to detect input and output variables that are required to track the maximum power from PV arrays. These sensors measure the solar irradiance, ambient temperature, output voltage and output current of the PV panel. However, many improved MPPT techniques have been designed to reduce the number of sensors in a particular application, which reduces the overall costs. For example, the conventional offline open circuit voltage (OCV) method requires only one voltage sensor [8]. In hybrid FSCC & P&O, the irradiance sensor is excluded to decrease the system cost [43], and the power angle-based algorithm is implemented without the current sensor in the grid-connected PV system [99].

4.11. Cost

The cost of the MPPT algorithm depends on the type of control technique (digital or analogue), number of sensors, computational process, circuitry and extra power component [100]. The cost of a digitally designed system depends on the various types of analogue controllers used and the complex programming required [8,101]. An inexpensive MPPT system contains only a single sensor and is sufficient for a design with constant voltage or current methods. The average cost of P&O and INC methods increases because they require large computational steps and a minimum of two sensors to reach MPP. Expensive MPPTs are those that involve artificial intelligence techniques due to their hardware complexity [100]. A single sensor is used in a P&O technique, which results in lower costs compared with the INC algorithm [101].

4.12. Photovoltaic Array Size

A study was conducted on an off-grid in a rural area in Pakistan, with an average daily household electricity demand of approximately 5.9 KWh. The equation for calculating the PV array size is shown in Equation (2) [102]. The size of the PV array is classified into three categories: below 1 kW, which requires a cheap MPPT; medium (1 KW to 1 MW) for the average cost techniques; and large (exceeds 1 MW), which is the most expensive [100].
A p v = Demanded   Load   ( KWh ) G a g v × η p v × η B a t t e r y × η I n v e r t e r × T C F   m 2

4.13. PV Converter Selection

MPPT schemes drive a controller at maximum power to maximize the load power of a PV system. This process is achieved by adjusting the duty cycle or switching nature of a converter (analyzing its current or voltage). The direct duty-cycle regulation of a converter or a closed-loop method is used to measure the MPP [103]. DC/DC converters are connected between the PV panel and load [28,104] so that the load line falls on the I-V curve at MPP [28]. They are particularly used to maintain the output voltage of PV panel as constant in any weather conditions [33]. When a converter with fixed duty cycle experiences PSCs or load changes, variations occur in its PV output voltage and current. The duty cycle of the converter is only regulated by the controller once solar insolation and load variations are detected [28]. To ensure constant maximum power supply in PV panels and robust MPPT techniques with few ripples, the input and output of converters should remain continuous. However, this process creates negative output power, such as electrical resonance, device heaviness, expenses, and unreliability. These effects are due to the requirement of connecting a filter circuit or large electrolytic capacitors (with 1000 h lifetime) to store energy and reduce the ripples of primary current and secondary voltage of the converter. An operating point close to MPP might not be attainable due to the ripple current where a controller has less bandwidth than the converter switching frequency. The efficiency of a uniform PV array can drop to 5% if the ripple in RMS MPP voltage is approximately 8% [104].
The popular converters used in solar MPPT applications, namely, the single ended primary inductor converter (SEPIC), Cuk and buck-boost are used to increase or decrease the input voltage. Only the buck or boost converter is unsuitable for PV systems because it provides limited output voltage. The buck and buck-boost converters have discontinuous current input flow, and SEPIC has a discontinuous output current with many components [104,105]. A single buck converter can be applied in dc MG for distributed and stand-alone PV systems due to its simple construction and high efficiency [103].
The buck-boost converter is cost effective compared with Cuk, but is less applied in MPPT due to its discontinuity in input current, excessive peak currents through power elements, and poor transient response. These buck-boost converters increase the output voltage at opposite polarity [6,95]. However, Cuk is superior because of its continuous input and output currents, few circuit components, collective voltage step up and down, flexibility in inverted output, less switching losses and high-efficiency [95,104]. However, the requirement of bulky filters to overcome an input ripple current with a high switching frequency and large inductors lead to high costs, large sizes, and switching losses. Furthermore, a new buck-boost-D converter does not require a coupling inductor or an electrolytic filter capacitor and is designed to reduce the input ripple current [104].

4.14. PV Controller Selection

To sense the voltage and current of PV modules and operate an MPPT algorithm, a PIC is used between PV panels and DC/DC converters [28]. Proportional integral derivative control is used to generate duty cycle in pulse width modulation (PWM) after sensing and optimizing the voltage and current of PV modules, as demonstrated in Figure 10 [106]. Real-time control or computing should be investigated to control the operation of hardware and software systems. The implementation facility of a controller effects the MPPT selection technique, which highly depends on the expertise and experience of the user. A real-time control system should be updated continuously to guarantee its calculation accuracy and produce immediate results. For example, a digital signal processor (DSP) is designed to implement PWM signals and digitize DC/DC converters and DC/AC inverters. DSP is a popular microprocessor controller with high computing power, flexibility, reliability, reduced cost and high execution speed [107].

4.15. Load Effect

Load nonlinearity occurs in a PV system, and load impedance is changed by panel voltage. Considering that the voltage source is sinusoidal, the variation in impedance produces nonlinear load current that contains several harmonic components. This process affects the devices and loads connected to the distributed power system. The harmonic distortion levels are small when using switching components and large with electrical machine loads. Nonlinear loads can also be identified during the transition period of active switches and in the nonlinear V-I curve [108].
The performance of a PV system is deemed detrimental when a change in the amount of solar insolation and loads occurs, especially in fixed step size MPPT schemes. The schemes have slow convergence speed in a single perturbation, which can be corrected swiftly by using the modified variable step size techniques. dV and dI in the I-V curve are positive and negative due to the increase in load resistance. Thus, the operating point shifts away from the MPP. A new duty cycle should be selected after the load variation to carry the operating point close to the MPP and for the voltage and current of the I-V curve to remain unchanged. Conventional MPPT techniques are not allowed to be executed in the system unless the power difference is (dP < 0.06). Equation (3) shows that a new duty cycle should to be calculated over the period of load variations [28]. In the modified INC MPPT technique, the load variation is detected if the paths of voltage and current fluctuations are different. Thus, a load-variant subroutine should be started functioning to carry the operating point of PV array close to GMPP. Conventional MPPT requires a long period of time to return to LMPP, once the load resistance is decreased (10 Ω to 5 Ω) [109].
  R l o a d = D 2 ( 1 D ) 2 .   V p v I p v ;   D = α 1 + α  

4.16. PSC Handling

PV systems can be completely or partially shaded by flying objects, large trees, and tall buildings, which results in many localized maximum points on P-V curves. This process causes the system to track undesired LMPPs rather than GMPP, which results in significant power losses [101]. In a PV string under PSCs, voltage mismatches can occur between the shaded and unshaded modules, which leads to power losses. To handle partial shading in a PV system, voltage equalizers, DC/DC converters and micro-inverters are introduced along with MPPT techniques. The micro-inverters are usually interconnected in each module to accurately regulate PSC. However, this process results in an increase in cost and complexity because many stages of power conversion are required. By contrast, a two-switch voltage equalizer with LLC resonant converters in series connected modules is used to reduce switching complexity, maintain equal voltage between the modules, and to bypass undesired LMPP [110].

4.17. Oscillation Near MPP

In most online MPPT schemes, power losses are mainly due to steady-state oscillations in the vicinity of the MPP [43]. The use of a large step size in a fixed duty cycle to increase tracking speed causes many oscillations around the MPP of PV panels [43,111]. These power oscillations can be extreme if the conventional algorithm (P&O) continues to search for the operating point on the P-V curve, although the MPP is tracked in advance [43]. A function-based modified MPPT method is implemented to track a current MPP with less steady-state oscillations to remain close to the MPP compared with the variable step size INC algorithm [53]. All improved and hybrid MPPT algorithms are employed to curb the oscillations adjacent the maximum power point in the dynamics.

4.18. Tracking Performance

In conventional algorithms, the tracking accuracy is found to be higher when using soft computing, moderate with P&O algorithms and lower when used with constant voltage or current methods. In the P&O technique, tracking accuracy is reduced if the tracking speed and perturbation size are increased to track the MPP [100]. In the conventional INC MPPT method, the fixed step size is the main constraint in achieving high tracking performance for the PV system. Thus, the variable INC algorithm is introduced to improve the tracking efficiency, but it has an inversely proportional effect on steady-state oscillations and tracking speed. Fast and accurate tracking speed is attainable by calculating the distance from the operating point to MPP in combination with an automated tuning of the duty cycle step size [8].
In the hybrid ANN based fuzzy logic controller, the tracking accuracy is found to be better than the conventional INC algorithm [112]. Many improved MPPT methods have attained high tracking speed in the dynamics. For example, a modified firefly algorithm has higher tracking precision than the ordinary PSO algorithm [9]. Noises due to measurement error can reduce the tracking accuracy of an MPPT algorithm. In several MPPT applications, the reduction in periodic perturbation size produces a low signal-to-noise ratio. This process rarely decreases the output power of a PV panel, although the actual MPP is tracked by the algorithm [113].

4.19. Convergence Speed

Convergence speed is the time required to obtain the maximum power point. The position and shape of a P-V curve can change due to excessive instant solar insolation on the PV system. Thus, the potential energy is fixed in the system rather than going over the load side and algorithm delays in tracking an original MPP [114]. The convergence speed in offline MPPT techniques is generally high. By contrast, the convergence speed in online schemes is slow to track MPPs when an operating point reaches close to the peak of the PV curve. The convergence time of an expected operating current or voltage should be as short as possible in designing an efficient MPPT [101]. When the convergence speed is high, the operating point moves around the MPP, which leads to many power oscillations in the PV panel [101,115]. The high cost is the main barrier in designing an accurate and fast convergent MPPT scheme [101].

4.20. PV Power Efficiency

Accurate tracking of the maximum power point in fast dynamics improves the PV system efficiency, as shown in Equation (4) [116]. However, aggregated efficiency is decreased once the operating point swings throughout the MPP because the trial process is used to search the global maximum power point [8]. For example, a boost converter in the conventional FSCC method is replaced by a switch that measures the short circuit current. The efficiency of a boost converter is low during a sudden change of atmospheric conditions due to the continuous periodic tuning process in the converter switch to track the MPP. The maximum power efficiency is attainable if a scaling factor is used to compensate for a change in weather conditions and a periodical sweep operation during partial shading conditions. In the PSO technique, the system efficiency is higher due to the high convergence accuracy between the particle positions and zero steady-state oscillations under the PSC [116].
η = Power   Tracked V m p p   I m p p  

4.21. Applications of MPPTs

MPPT charge controllers are used in many applications to correct the variations in I-V curves and maximize the current propagating toward the battery from the PV panel. They also ensure that the PV module operates at a higher voltage than the rated value of the battery. These techniques are mainly applied for charging and discharging the specified batteries [8]. FLC and ANN algorithms are used to control solar powered vehicles due to their convergence speed in finding MPPs. Simple CV and OCV methods are employed to power LED street lights by charging the battery during daytime and releasing it at night [117,118]. The INC and P&O algorithms are suitable for use in the PV system [101].

5. Discussion and Conclusions

This study reviewed three categories of MPPT schemes considering thirteen parameters, including their advantages and disadvantages, tracking performance, cost effectiveness, and implementation complexity. The classification of MPPT approaches in addressing the transient and steady-state errors are made based on their input variables, sensor numbers, tracking speed and tuning process. The digitally implemented P&O and INC algorithms with their simple circuitry provided good performance because they are based on maximum value theory. However, they suffered from oscillations near MPP, and finding an approximated variable in the PV panel is challenging. The modified INC techniques overcome the oscillations across MPP. However, the control of modified techniques is complex and costly in practice. The improved P&O techniques are considered the best selection in terms of their simple circuitry and low cost, but are inferior to INC due to the increasing oscillations near the MPP. Table 4 shows a summary of the comparison of nine important points for each evaluating parameter of the PV system.
In evaluating the performance of PV systems, 21 parameters for MPPT approaches are discussed. The thin-film PV technologies, especially p-Si, m-Si, and CIGS, are inexpensive to build and are highly recommended for use in hot temperature climate zones due to their low-voltage temperature coefficient. Similarly, the hybrid HIT and Smart Silicon technologies are applicable due to their high-power density and hard covered glass. In the grid-connected PV system, the islanding problem can be eliminated by analyzing the phase, frequency and the voltage of an inverter. An automated stability analysis should be conducted when a grid line experiences a fault. In cold cities, rooftop PV systems are not profitable because they are severely affected by cold weather, which causes significant energy degradation. ST-MPPT is not recommended for a typical climate profile and a low-cost PV system because its internal power consumption is from 10% to 20% of the total energy production. However, nearly 45% more energy is produced by rotating PV panels during cold weather in cold cities. The highest annual power loss due to the natural soiling effect on PV panels was found to be from 4.7% to 6.2% in the US and 6.24% in Iraq. In Morocco, artificial soiling from building construction contributed to a 20% power loss during a six-month observation. The complexity of MPPT algorithms can be minimized by using powerful but expensive digital controllers. The modified MPPT techniques are designed to limit the number of sensors and reduce the total costs of the PV system. The overall costs will be high if the following components are applied to PV technology: a difficult to control technique, bulky circuitry, a complex algorithm, many sensors, and a complex computational technique. The higher the power rating of a PV array is, the more complex and expensive the operation. A Cuk converter is well suited for implementation in several PV systems, due to its continuous operating capability, flexibility, and switching frequency. Considering the variation in the loads, the harmonic components of PV current are increased, which causes the operating point to move away from the MPP. Thus, a new duty cycle should be selected to maintain the tracking accuracy. PSC creates a voltage mismatch between the shaded and unshaded modules. Thus, the use of a micro-inverter in each module is the optimal solution to protect PV panels from significant power losses, but its implementation cost is high. The oscillations near MPP increase if the operating point is continuously searched, although MPPs are tracked in advance. The oscillations can be mitigated by using a proper MPPT scheme with a variable step duty cycle technique. For any MPPT scheme in dynamics, a fair tracking speed is desirable if an automated tuning of the duty cycle holds the operating point continuously close to MPP. Increased cost is the main hindrance in implementing a PV system with high convergence speed once the operating point moves away from MPP. The efficiency of a PV system can be improved with an accurate tracking operation and fast convergence toward GMPP for each weather condition. MPPT algorithms are widely used in many applications, such as solar vehicles, street lighting, and other PV systems. A well-performed selection of the right MPPT scheme can be completed by reviewing all of the specifications and limitations discussed in this study. Future improvements on the existing and hybrid MPPT techniques could obtain optimum performance under the partial shading conditions of PV modules. For commercial applications, a balance should be observed between the costs of implementing a PV system, its performance, and profit.

Acknowledgments

The authors would like to acknowledge the financial support received from the University of Malaya, Malaysia, through Frontier Research Grant No. FG007-17AFR and Innovative Technology Grant No. RP043B-17AET. Part of this research was also funded by University Malaya’s BKP Grant No. BK052-2016.

Author Contributions

MD Haidar Islam has contributed to generate idea, accumulate information and preparing the article; Saad Mekhilef, Noraisyah Binti Mohamed Shah and Tey Kook Soon have contributed to generate idea and preparing the article; Seyedmahmoudia, Ben Horan and Alex Stojcevski have contributed to assist in preparing the article.

Conflicts of Interest

The authors declare no conflict of interest.

References

  1. Azman, A.Y.; Rahman, A.A.; Bakar, N.A.; Hanaffi, F.; Khamis, A. Study of renewable energy potential in Malaysia. In Proceedings of the 2011 IEEE First Conference on Clean Energy and Technology (CET), Kuala Lumpur, Malaysia, 27–29 June 2011; pp. 170–176. [Google Scholar]
  2. Tan, S.T.; Ho, W.S.; Hashim, H.; Lee, C.T. A feasibility study of renewable energy and carbon emission reduction in Iskandar Malaysia. In Proceedings of the 2014 International Conference and Utility Exhibition on Green Energy for Sustainable Development (ICUE), Pattaya, Thailand, 19–21 March 2014; pp. 1–6. [Google Scholar]
  3. Bose, B.K. Global warming: Energy, environmental pollution, and the impact of power electronics. IEEE Ind. Electron. Mag. 2010, 4, 6–17. [Google Scholar] [CrossRef]
  4. Bull, S.R. Renewable energy today and tomorrow. Proc. IEEE 2001, 89, 1216–1226. [Google Scholar] [CrossRef]
  5. Huynh, D.C.; Dunnigan, M.W. Development and Comparison of an Improved Incremental Conductance Algorithm for Tracking the MPP of a Solar PV Panel. IEEE Trans. Sustain. Energy 2016, 7, 1421–1429. [Google Scholar] [CrossRef]
  6. Radjai, T.; Rahmani, L.; Mekhilef, S.; Gaubert, J.P. Implementation of a modified incremental conductance MPPT algorithm with direct control based on a fuzzy duty cycle change estimator using dSPACE. Sol. Energy 2014, 110, 325–337. [Google Scholar] [CrossRef]
  7. Blazev, A.S. Photovoltaics for Commercial and Utilities Power Generation; Lulu Press, Inc.: Morrisville, NC, USA, 2013. [Google Scholar]
  8. Karami, N.; Moubayed, N.; Outbib, R. General review and classification of different MPPT Techniques. Renew. Sustain. Energy Rev. 2017, 68, 1–18. [Google Scholar] [CrossRef]
  9. Seyedmahmoudian, M.; Horan, B.; Soon, T.K.; Rahmani, R.; Oo, A.M.T.; Mekhilef, S.; Stojcevski, A. State of the art artificial intelligence-based MPPT techniques for mitigating partial shading effects on PV systems—A review. Renew. Sustain. Energy Rev. 2016, 64, 435–455. [Google Scholar] [CrossRef]
  10. Faranda, R.; Leva, S. Energy comparison of MPPT techniques for PV Systems. WSEAS Trans. Power Syst. 2008, 3, 446–455. [Google Scholar]
  11. Liu, Y.-H.; Huang, S.-C.; Huang, J.-W.; Liang, W.-C. A particle swarm optimization-based maximum power point tracking algorithm for PV systems operating under partially shaded conditions. IEEE Trans. Energy Convers. 2012, 27, 1027–1035. [Google Scholar] [CrossRef]
  12. Wang, Y.; Li, Y.; Ruan, X. High-Accuracy and Fast-Speed MPPT Methods for PV String Under Partially Shaded Conditions. IEEE Trans. Ind. Electron. 2016, 63, 235–245. [Google Scholar] [CrossRef]
  13. Ji, Y.-H.; Jung, D.-Y.; Kim, J.-G.; Kim, J.-H.; Lee, T.-W.; Won, C.-Y. A real maximum power point tracking method for mismatching compensation in PV array under partially shaded conditions. IEEE Trans. Power Electron. 2011, 26, 1001–1009. [Google Scholar] [CrossRef]
  14. Carannante, G.; Fraddanno, C.; Pagano, M.; Piegari, L. Experimental performance of MPPT algorithm for photovoltaic sources subject to inhomogeneous insolation. IEEE Trans. Ind. Electron. 2009, 56, 4374–4380. [Google Scholar] [CrossRef]
  15. Lyden, S.; Haque, M.; Gargoom, A.; Negnevitsky, M. Review of maximum power point tracking approaches suitable for PV systems under partial shading conditions. In Proceedings of the 2013 Australasian Universities Power Engineering Conference (AUPEC), Hobart, Australia, 9 September–3 Octorber 2013; pp. 1–6. [Google Scholar]
  16. Mohamed, M.A.-E.-H. Efficient approximation of photovoltaic model using dependent thevenin equivalent circuit based on exponential sums function. In Proceedings of the 2015 IEEE 42nd Photovoltaic Specialist Conference (PVSC), New Orleans, LA, USA, 14–19 June 2015; pp. 1–6. [Google Scholar]
  17. Hejri, M.; Mokhtari, H. On the Comprehensive Parametrization of the Photovoltaic (PV) Cells and Modules. IEEE J. Photovolt. 2017, 7, 250–258. [Google Scholar] [CrossRef]
  18. Villalva, M.G.; Gazoli, J.R.; Ruppert Filho, E. Modeling and circuit-based simulation of photovoltaic arrays. In Proceedings of the 2009 Brazilian Power Electronics Conference, Bonito-Mato Grosso do Sul, Brazil, 27 September–1 Octorber 2009; pp. 1244–1254. [Google Scholar]
  19. Hussein, K.H.; Muta, I.; Hoshino, T.; Osakada, M. Maximum photovoltaic power tracking: An algorithm for rapidly changing atmospheric conditions. IEE Proc. Gener. Transm. Distrib. 1995, 142, 59–64. [Google Scholar] [CrossRef]
  20. Elgendy, M.A.; Zahawi, B.; Atkinson, D.J. Evaluation of incremental conductance MPPT algorithm at low perturbation rates. In Proceedings of the 7th IET International Conference on Power Electronics, Machines and Drives (PEMD 2014), Manchester, UK, 8–10 April 2014; pp. 1–6. [Google Scholar]
  21. Lee, J.-G.; Ko, J.-S.; Jeong, D.-E.; Jeong, H.-G.; Kim, D.-K.; Chung, D.-H. High performance MPPT control of photovoltaic using VSSIC method. In Proceedings of the 2012 IEEE Vehicle Power and Propulsion Conference (VPPC), Seoul, Korea, 9–12 Octorber 2012; pp. 1371–1374. [Google Scholar]
  22. Hossain, M.J.; Tiwari, B.; Bhattacharya, I. An adaptive step size incremental conductance method for faster maximum power point tracking. In Proceedings of the 2016 IEEE 43rd Photovoltaic Specialists Conference (PVSC), Portland, OR, USA, 5–10 June 2016; pp. 3230–3233. [Google Scholar]
  23. Jedari, M.; Gharehpetian, G.; Fathi, S.H.; Vahids, S. An adaptive InCon MPPT algorithm considering irradiance slope tracking for PV application. In Proceedings of the 2016 4th International Symposium on Environment Friendly Energies and Applications (EFEA), Belgrade, Serbia, 14–16 September 2016; pp. 1–6. [Google Scholar]
  24. Liu, F.; Duan, S.; Liu, F.; Liu, B.; Kang, Y. A variable step size INC MPPT method for PV systems. IEEE Trans. Ind. Electron. 2008, 55, 2622–2628. [Google Scholar]
  25. Mei, Q.; Shan, M.; Liu, L.; Guerrero, J.M. A novel improved variable step-size incremental-resistance MPPT method for PV systems. IEEE Trans. Ind. Electron. 2011, 58, 2427–2434. [Google Scholar] [CrossRef]
  26. Hsieh, G.-C.; Hsieh, H.-I.; Tsai, C.-Y.; Wang, C.-H. Photovoltaic power-increment-aided incremental-conductance MPPT with two-phased tracking. IEEE Trans. Power Electron. 2013, 28, 2895–2911. [Google Scholar] [CrossRef]
  27. Hsieh, G.-C.; Tsai, C.-Y.; Hsieh, H.-I. Photovoltaic power-increment-aided incremental-conductance maximum power point tracking using variable frequency and duty controls. In Proceedings of the 2012 3rd IEEE International Symposium on Power Electronics for Distributed Generation Systems (PEDG), Aalborg, Denmark, 25–28 June 2012; pp. 542–549. [Google Scholar]
  28. Soon, T.K.; Mekhilef, S. A fast-converging MPPT technique for photovoltaic system under fast-varying solar irradiation and load resistance. IEEE Trans. Ind. Inform. 2015, 11, 176–186. [Google Scholar] [CrossRef]
  29. Patel, H.; Agarwal, V. Maximum power point tracking scheme for PV systems operating under partially shaded conditions. IEEE Trans. Ind. Electron. 2008, 55, 1689–1698. [Google Scholar] [CrossRef]
  30. Xiao, W.; Dunford, W.G.; Palmer, P.R.; Capel, A. Application of centered differentiation and steepest descent to maximum power point tracking. IEEE Trans. Ind. Electron. 2007, 54, 2539–2549. [Google Scholar] [CrossRef]
  31. Radianto, D.; Dousouky, G.M.; Shoyama, M. MPPT based on incremental conductance-fuzzy logic algorithm for photovoltaic system under variable climate conditions. In Proceedings of the 2015 IEEE International Telecommunications Energy Conference (INTELEC), Osaka, Japan, 18–22 Octorber 2015; pp. 1–5. [Google Scholar]
  32. Deshpande, A.; Patil, S.; Deopare, H. Comparative simulation of conventional maximum power point tracking methods. In Proceedings of the 2016 International Conference on Computing, Communication and Automation (ICCCA), Noida, India, 29–30 April 2016; pp. 1025–1028. [Google Scholar]
  33. Saravanan, S.; Babu, N.R. Performance analysis of boost & Cuk converter in MPPT based PV system. In Proceedings of the 2015 International Conference on Circuit, Power and Computing Technologies (ICCPCT), Nagercoil, India, 19–20 March 2015; pp. 1–6. [Google Scholar]
  34. Bendib, B.; Belmili, H.; Krim, F. A survey of the most used MPPT methods: Conventional and advanced algorithms applied for photovoltaic systems. Renew. Sustain. Energy Rev. 2015, 45, 637–648. [Google Scholar] [CrossRef]
  35. Saidi, A.; Benachaiba, C. Comparison of IC and P&O algorithms in MPPT for grid connected PV module. In Proceedings of the 2016 8th International Conference on Modelling, Identification and Control (ICMIC), Algiers, Algeria, 15–17 November 2016; pp. 213–218. [Google Scholar]
  36. Ashique, R.H.; Salam, Z.; Ahmed, J. An adaptive P&O MPPT using a sectionalized piece-wise linear PV curve. In Proceedings of the 2015 IEEE Conference on Energy Conversion (CENCON), Johor Bahru, Malaysia, 19–20 Octorber 2015; pp. 474–479. [Google Scholar]
  37. Abdelsalam, A.K.; Massoud, A.M.; Ahmed, S.; Enjeti, P.N. High-performance adaptive perturb and observe MPPT technique for photovoltaic-based microgrids. IEEE Trans. Power Electron. 2011, 26, 1010–1021. [Google Scholar] [CrossRef]
  38. Jiang, Y.; Qahouq, J.A.A.; Haskew, T.A. Adaptive step size with adaptive-perturbation-frequency digital MPPT controller for a single-sensor photovoltaic solar system. IEEE Trans. Power Electron. 2013, 28, 3195–3205. [Google Scholar] [CrossRef]
  39. Kollimalla, S.K.; Mishra, M.K. Variable perturbation size adaptive P&O MPPT algorithm for sudden changes in irradiance. IEEE Trans. Sustain. Energy 2014, 5, 718–728. [Google Scholar]
  40. Kollimalla, S.K.; Mishra, M.K. A novel adaptive P&O MPPT algorithm considering sudden changes in the irradiance. IEEE Trans. Energy Convers. 2014, 29, 602–610. [Google Scholar]
  41. Killi, M.; Samanta, S. Modified perturb and observe MPPT algorithm for drift avoidance in photovoltaic systems. IEEE Trans. Ind. Electron. 2015, 62, 5549–5559. [Google Scholar] [CrossRef]
  42. Ahmad, S.; Rashid, M.T.; Ferdowsy, C.S.; Islam, S.; Mahmood, A.H. A technical comparison among different PV-MPPT algorithms to observe the effect of fast changing solar irradiation. In Proceedings of the 2015 IEEE International WIE Conference on Electrical and Computer Engineering (WIECON-ECE), Dhaka, Bangladesh, 19–20 December 2015; pp. 155–158. [Google Scholar]
  43. Sher, H.A.; Murtaza, A.F.; Noman, A.; Addoweesh, K.E.; Al-Haddad, K.; Chiaberge, M. A New sensorless hybrid MPPT algorithm based on fractional short-circuit current measurement and P&O MPPT. IEEE Trans. Sustain. Energy 2015, 6, 1426–1434. [Google Scholar]
  44. Shebani, M.M.; Iqbal, T.; Quaicoe, J.E. Comparing bisection numerical algorithm with fractional short circuit current and open circuit voltage methods for MPPT photovoltaic systems. In Proceedings of the 2016 IEEE Electrical Power and Energy Conference (EPEC), Ottawa, ON, Canada, 12–14 Octorber 2016; pp. 1–5. [Google Scholar]
  45. Manickam, C.; Raman, G.R.; Raman, G.P.; Ganesan, S.I.; Nagamani, C. A Hybrid Algorithm for Tracking of GMPP Based on P&O and PSO With Reduced Power Oscillation in String Inverters. IEEE Trans. Ind. Electron. 2016, 63, 6097–6106. [Google Scholar]
  46. Sebtahmadi, S.S.; Azad, H.B.; Kaboli, S.H.A.; Islam, M.D.; Mekhilef, S. A PSO-DQ current control scheme for performance enhancement of Z-source matrix converter to drive IM Fed by abnormal voltage. IEEE Trans. Power Electron. 2018, 33, 1666–1681. [Google Scholar] [CrossRef]
  47. Teo, K.T.K.; Lim, P.Y.; Chua, B.L.; Goh, H.H.; Tan, M.K. Maximum Power Point Tracking of Partially Shaded Photovoltaic Arrays Using Particle Swarm Optimization. In Proceedings of the 2014 4th International Conference on Artificial Intelligence with Applications in Engineering and Technology (ICAIET), Kota Kinabalu, Malaysia, 3–5 December 2014; pp. 247–252. [Google Scholar]
  48. Radjai, T.; Gaubert, J.P.; Rahmani, L.; Mekhilef, S. Experimental verification of P&O MPPT algorithm with direct control based on Fuzzy logic control using CUK converter. Int. Trans. Electr. Energy Syst. 2015, 25, 3492–3508. [Google Scholar]
  49. Sundareswaran, K.; Vigneshkumar, V.; Sankar, P.; Simon, S.P.; Nayak, P.S.R.; Palani, S. Development of an improved P&O algorithm assisted through a colony of foraging ants for MPPT in PV system. IEEE Trans. Ind. Inform. 2016, 12, 187–200. [Google Scholar]
  50. Jiang, L.L.; Nayanasiri, D.; Maskell, D.L.; Vilathgamuwa, D. A hybrid maximum power point tracking for partially shaded photovoltaic systems in the tropics. Renew. Energy 2015, 76, 53–65. [Google Scholar] [CrossRef]
  51. Mahmoud, Y.; Abdelwahed, M.; El-Saadany, E.F. An Enhanced MPPT Method Combining Model-Based and Heuristic Techniques. IEEE Trans. Sustain. Energy 2016, 7, 576–585. [Google Scholar] [CrossRef]
  52. Mohanty, S.; Subudhi, B.; Ray, P.K. A Grey Wolf Assisted Perturb &Observe MPPT Algorithm for a Photovoltaic Power System. IEEE Trans. Energy Convers. 2016, 32, 340–347. [Google Scholar]
  53. Tousi, S.R.; Moradi, M.H.; Basir, N.S.; Nemati, M. A function-based maximum power point tracking method for photovoltaic systems. IEEE Trans. Power Electron. 2016, 31, 2120–2128. [Google Scholar] [CrossRef]
  54. Pradhan, R.; Subudhi, B. Double integral sliding mode MPPT control of a photovoltaic system. IEEE Trans. Control Syst. Technol. 2016, 24, 285–292. [Google Scholar] [CrossRef]
  55. Montoya, D.G.; Ramos-Paja, C.A.; Giral, R. Improved design of sliding-mode controllers based on the requirements of MPPT techniques. IEEE Trans. Power Electron. 2016, 31, 235–247. [Google Scholar] [CrossRef]
  56. Ram, J.P.; Rajasekar, N. A novel Flower Pollination based Global Maximum Power Point method for Solar Maximum Power Point Tracking. IEEE Trans. Power Electron. 2016, 32, 8486–8499. [Google Scholar]
  57. Krstic, M.; Ghaffari, A.; Seshagiri, S. Extremum seeking for wind and solar energy applications. In Proceedings of the 2014 11th World Congress on Intelligent Control and Automation (WCICA), Shenyang, China, 29 June–4 July 2014; pp. 6184–6193. [Google Scholar]
  58. Li, X.; Wen, H.; Jiang, L.; Lim, E.G.; Du, Y.; Zhao, C. Photovoltaic Modified β-Parameter-based MPPT Method with Fast Tracking. J. Power Electron. 2016, 16, 9–17. [Google Scholar] [CrossRef]
  59. Li, X.; Wen, H.; Jiang, L.; Hu, Y.; Zhao, C. An Improved Beta Method with Autoscaling Factor for Photovoltaic System. IEEE Trans. Ind. Appl. 2016, 52, 4281–4291. [Google Scholar] [CrossRef]
  60. Duan, S.; Yan, G.; Jin, L.; Ren, J.; Wu, W. Design of photovoltaic power generation mppt controller based on SIC MOSFET. In Proceedings of the TENCON 2015-2015 IEEE Region 10 Conference, Macao, China, 1–4 November 2015; pp. 1–5. [Google Scholar]
  61. Eldin, S.S.; Abd-Elhady, M.; Kandil, H. Feasibility of solar tracking systems for PV panels in hot and cold regions. Renew. Energy 2016, 85, 228–233. [Google Scholar] [CrossRef]
  62. Esram, T.; Chapman, P.L. Comparison of photovoltaic array maximum power point tracking techniques. IEEE Trans. Energy Convers. 2007, 22, 439–449. [Google Scholar] [CrossRef]
  63. Elbaset, A.A.; Ali, H.; El Sattar, M.A. New seven parameters model for amorphous silicon and thin film PV modules based on solar irradiance. Sol. Energy 2016, 138, 26–35. [Google Scholar] [CrossRef]
  64. Kahoul, N.; Chenni, R.; Cheghib, H.; Mekhilef, S. Evaluating the reliability of crystalline silicon photovoltaic modules in harsh environment. Renew. Energy 2017, 109, 66–72. [Google Scholar] [CrossRef]
  65. Bianchini, A.; Gambuti, M.; Pellegrini, M.; Saccani, C. Performance analysis and economic assessment of different photovoltaic technologies based on experimental measurements. Renew. Energy 2016, 85, 1–11. [Google Scholar] [CrossRef]
  66. Visa, I.; Burduhos, B.; Neagoe, M.; Moldovan, M.; Duta, A. Comparative analysis of the infield response of five types of photovoltaic modules. Renew. Energy 2016, 95, 178–190. [Google Scholar] [CrossRef]
  67. Wang, Y.-J.; Hsu, P.-C. An investigation on partial shading of PV modules with different connection configurations of PV cells. Energy 2011, 36, 3069–3078. [Google Scholar] [CrossRef]
  68. Villalva, M.G.; Gazoli, J.R.; Ruppert Filho, E. Comprehensive approach to modeling and simulation of photovoltaic arrays. IEEE Trans. Power Electron. 2009, 24, 1198–1208. [Google Scholar] [CrossRef]
  69. Gao, L.; Dougal, R.A.; Liu, S.; Iotova, A.P. Parallel-connected solar PV system to address partial and rapidly fluctuating shadow conditions. IEEE Trans. Ind. Electron. 2009, 56, 1548–1556. [Google Scholar]
  70. Bonfiglio, A.; Delfino, F.; Invernizzi, M.; Labella, A.; Mestriner, D.; Procopio, R.; Serra, P. Approximate characterization of large Photovoltaic power plants at the Point of Interconnection. In Proceedings of the 2015 50th International Universities Power Engineering Conference (UPEC), Stoke on Trent, UK, 1–4 September 2015; pp. 1–5. [Google Scholar]
  71. Hasan, R.; Mekhilef, S.; Seyedmahmoudian, M.; Horan, B. Grid-connected isolated PV microinverters: A review. Renew. Sustain. Energy Rev. 2017, 67, 1065–1080. [Google Scholar] [CrossRef]
  72. Obi, M.; Bass, R. Trends and challenges of grid-connected photovoltaic systems—A review. Renew. Sustain. Energy Rev. 2016, 58, 1082–1094. [Google Scholar] [CrossRef]
  73. Liu, S.; Liu, P.X.; Wang, X. Stochastic small-signal stability analysis of grid-connected photovoltaic systems. IEEE Trans. Ind. Electron. 2016, 63, 1027–1038. [Google Scholar] [CrossRef]
  74. Yao, X.; Tan, B.; Hu, C. Islanding detection for PV plant using instantaneous power theory. In Proceedings of the 2016 IEEE Advanced Information Management, Communicates, Electronic and Automation Control Conference (IMCEC), Xi’an, China, 3–5 Octorber 2016; pp. 1495–1498. [Google Scholar]
  75. Palizban, O.; Kauhaniemi, K. Microgrid control principles in island mode operation. In Proceedings of the 2013 IEEE Grenoble PowerTech (POWERTECH), Grenoble, France, 16–20 June 2013; pp. 1–6. [Google Scholar]
  76. Liu, Z.; Dong, X.; Wu, Z.; Chen, L.; Yu, C.; Zhang, B.; Liu, W. Typical island micro-grid operation analysis. In Proceedings of the 2016 China International Conference on Electricity Distribution (CICED), Xi’an, China, 10–13 August 2016; pp. 1–4. [Google Scholar]
  77. Wang, Z.; Chen, B.; Wang, J. Decentralized energy management system for networked microgrids in grid-connected and islanded modes. IEEE Trans. Smart Grid 2016, 7, 1097–1105. [Google Scholar] [CrossRef]
  78. Cubi, E.; Zibin, N.F.; Thompson, S.J.; Bergerson, J. Sustainability of rooftop technologies in cold climates: Comparative life cycle assessment of white roofs, green roofs, and photovoltaic panels. J. Ind. Ecol. 2016, 20, 249–262. [Google Scholar] [CrossRef]
  79. Despotovic, M.; Nedic, V. Comparison of optimum tilt angles of solar collectors determined at yearly, seasonal and monthly levels. Energy Convers. Manag. 2015, 97, 121–131. [Google Scholar] [CrossRef]
  80. Hartner, M.; Ortner, A.; Hiesl, A.; Haas, R. East to west–The optimal tilt angle and orientation of photovoltaic panels from an electricity system perspective. Appl. Energy 2015, 160, 94–107. [Google Scholar] [CrossRef]
  81. Khatib, T.; Mohamed, A.; Mahmoud, M.; Sopian, K. Optimization of the tilt angle of solar panels for Malaysia. Energy Sources. Part A Recovery Util. Environ. Eff. 2015, 37, 606–613. [Google Scholar] [CrossRef]
  82. Darwish, Z.A.; Kazem, H.A.; Sopian, K.; Al-Goul, M.; Alawadhi, H. Effect of dust pollutant type on photovoltaic performance. Renew. Sustain. Energy Rev. 2015, 41, 735–744. [Google Scholar] [CrossRef]
  83. Maghami, M.R.; Hizam, H.; Gomes, C.; Radzi, M.A.; Rezadad, M.I.; Hajighorbani, S. Power loss due to soiling on solar panel: A review. Renew. Sustain. Energy Rev. 2016, 59, 1307–1316. [Google Scholar] [CrossRef]
  84. Saidan, M.; Albaali, A.G.; Alasis, E.; Kaldellis, J.K. Experimental study on the effect of dust deposition on solar photovoltaic panels in desert environment. Renew. Energy 2016, 92, 499–505. [Google Scholar] [CrossRef]
  85. Schill, C.; Brachmann, S.; Koehl, M. Impact of soiling on IV-curves and efficiency of PV-modules. Sol. Energy 2015, 112, 259–262. [Google Scholar] [CrossRef]
  86. Heidari, N.; Gwamuri, J.; Townsend, T.; Pearce, J.M. Impact of Snow and ground interference on photovoltaic electric system performance. IEEE J. Photovolt. 2015, 5, 1680–1685. [Google Scholar] [CrossRef]
  87. Meghdadi, S.; Iqbal, T. A low cost method of snow detection on solar panels and sending alerts. J. Clean Energy Technol. 2015, 3, 393–397. [Google Scholar] [CrossRef]
  88. Myong, S.Y.; Park, Y.-C.; Jeon, S.W. Performance of Si-based PV rooftop systems operated under distinct four seasons. Renew. Energy 2015, 81, 482–489. [Google Scholar] [CrossRef]
  89. Hasan, M.; Parida, S. An overview of solar photovoltaic panel modeling based on analytical and experimental viewpoint. Renew. Sustain. Energy Rev. 2016, 60, 75–83. [Google Scholar] [CrossRef]
  90. Chellaswamy, C.; Ramesh, R. Parameter extraction of solar cell models based on adaptive differential evolution algorithm. Renew. Energy 2016, 97, 823–837. [Google Scholar] [CrossRef]
  91. Kim, K.A.; Seo, G.-S.; Cho, B.-H.; Krein, P.T. Photovoltaic hot-spot detection for solar panel substrings using ac parameter characterization. IEEE Trans. Power Electron. 2016, 31, 1121–1130. [Google Scholar] [CrossRef]
  92. Lee, J.E.; Bae, S.; Oh, W.; Park, H.; Kim, S.M.; Lee, D.; Nam, J.; Mo, C.B.; Kim, D.; Yang, J. Investigation of damage caused by partial shading of CuInxGa (1-x) Se2 photovoltaic modules with bypass diodes. Prog. Photovolt. Res. Appl. 2016, 24, 1035–1043. [Google Scholar] [CrossRef]
  93. Daliento, S.; Di Napoli, F.; Guerriero, P.; d’Alessandro, V. A modified bypass circuit for improved hot spot reliability of solar panels subject to partial shading. Sol. Energy 2016, 134, 211–218. [Google Scholar] [CrossRef]
  94. Kumar, K.K.; Bhaskar, R.; Koti, H. Implementation of MPPT algorithm for solar photovoltaic cell by comparing short-circuit method and incremental conductance method. Procedia Technol. 2014, 12, 705–715. [Google Scholar] [CrossRef]
  95. Safari, A.; Mekhilef, S. Simulation and hardware implementation of incremental conductance MPPT with direct control method using cuk converter. IEEE Trans. Ind. Electron. 2011, 58, 1154–1161. [Google Scholar] [CrossRef]
  96. Loukriz, A.; Haddadi, M.; Messalti, S. Simulation and experimental design of a new advanced variable step size Incremental Conductance MPPT algorithm for PV systems. ISA Trans. 2016, 62, 30–38. [Google Scholar] [CrossRef] [PubMed]
  97. Scarpa, V.V.; Buso, S.; Spiazzi, G. Low-complexity MPPT technique exploiting the PV module MPP locus characterization. IEEE Trans. Ind. Electron. 2009, 56, 1531–1538. [Google Scholar] [CrossRef]
  98. Kotti, R.; Shireen, W. Efficient MPPT control for PV systems adaptive to fast changing irradiation and partial shading conditions. Sol. Energy 2015, 114, 397–407. [Google Scholar] [CrossRef]
  99. Dousoky, G.M.; Shoyama, M. New parameter for current-sensorless MPPT in grid-connected photovoltaic VSIs. Sol. Energy 2017, 143, 113–119. [Google Scholar] [CrossRef]
  100. Verma, D.; Nema, S.; Shandilya, A.; Dash, S.K. Maximum power point tracking (MPPT) techniques: Recapitulation in solar photovoltaic systems. Renew. Sustain. Energy Rev. 2016, 54, 1018–1034. [Google Scholar] [CrossRef]
  101. Ezinwanne, O.; Zhongwen, F.; Zhijun, L. Energy Performance and Cost Comparison of MPPT Techniques for Photovoltaics and other Applications. Energy Procedia 2017, 107, 297–303. [Google Scholar] [CrossRef]
  102. Roy, A.; Kabir, M.A. Relative life cycle economic analysis of stand-alone solar PV and fossil fuel powered systems in Bangladesh with regard to load demand and market controlling factors. Renew. Sustain. Energy Rev. 2012, 16, 4629–4637. [Google Scholar] [CrossRef]
  103. Espinoza-Trejo, D.R.; Bárcenas-Bárcenas, E.; Campos-Delgado, D.U.; De Angelo, C.H. Voltage-oriented input–output linearization controller as maximum power point tracking technique for photovoltaic systems. IEEE Trans. Ind. Electron. 2015, 62, 3499–3507. [Google Scholar]
  104. El Khateb, A.H.; Rahim, N.A.; Selvaraj, J.; Williams, B.W. DC-to-DC converter with low input current ripple for maximum photovoltaic power extraction. IEEE Trans. Ind. Electron. 2015, 62, 2246–2256. [Google Scholar] [CrossRef] [Green Version]
  105. Tey, K.S.; Mekhilef, S.; Seyedmahmoudian, M.; Horan, B.; Oo, A.M.T.; Stojcevski, A. Improved Differential Evolution-based MPPT Algorithm using SEPIC for PV Systems under Partial Shading Conditions and Load Variation. IEEE Trans. Ind. Inform. 2018. [Google Scholar] [CrossRef]
  106. Harrag, A.; Messalti, S. Variable step size modified P&O MPPT algorithm using GA-based hybrid offline/online PID controller. Renew. Sustain. Energy Rev. 2015, 49, 1247–1260. [Google Scholar]
  107. Farhat, M.; Barambones, O.; Sbita, L. Efficiency optimization of a DSP-based standalone PV system using a stable single input fuzzy logic controller. Renew. Sustain. Energy Rev. 2015, 49, 907–920. [Google Scholar] [CrossRef]
  108. Sivakumar, P.; Kader, A.A.; Kaliavaradhan, Y.; Arutchelvi, M. Analysis and enhancement of PV efficiency with incremental conductance MPPT technique under non-linear loading conditions. Renew. Energy 2015, 81, 543–550. [Google Scholar] [CrossRef]
  109. Tey, K.S.; Mekhilef, S. Modified incremental conductance MPPT algorithm to mitigate inaccurate responses under fast-changing solar irradiation level. Sol. Energy 2014, 101, 333–342. [Google Scholar] [CrossRef]
  110. Uno, M.; Kukita, A. Two-Switch Voltage Equalizer Using an LLC Resonant Inverter and Voltage Multiplier for Partially Shaded Series-Connected Photovoltaic Modules. IEEE Trans. Ind. Appl. 2015, 51, 1587–1601. [Google Scholar] [CrossRef]
  111. Babu, T.S.; Rajasekar, N.; Sangeetha, K. Modified particle swarm optimization technique based maximum power point tracking for uniform and under partial shading condition. Appl. Soft Comput. 2015, 34, 613–624. [Google Scholar] [CrossRef]
  112. Messalti, S.; Harrag, A.; Loukriz, A. A new variable step size neural networks MPPT controller: Review, simulation and hardware implementation. Renew. Sustain. Energy Rev. 2017, 68, 221–233. [Google Scholar] [CrossRef]
  113. Latham, A.M.; Sullivan, C.R.; Odame, K.M. Performance of photovoltaic maximum power point tracking algorithms in the presence of noise. In Proceedings of the 2010 IEEE Energy Conversion Congress and Exposition (ECCE), Atlanta, GA, USA, 12–16 September 2010; pp. 632–639. [Google Scholar]
  114. Walker, S.; Sooriyaarachchi, N.; Liyanage, N.; Abeynayake, P.; Abeyratne, S. Comparative analysis of speed of convergence of MPPT techniques. In Proceedings of the 2011 6th IEEE International Conference on Industrial and Information Systems (ICIIS), Kandy, Sri Lanka, 16–19 August 2011; pp. 522–526. [Google Scholar]
  115. Li, X.; Wen, H.; Jiang, L.; Xiao, W.; Du, Y.; Zhao, C. An Improved MPPT Method for PV System with Fast-Converging Speed and Zero Oscillation. IEEE Trans. Ind. Appl. 2016, 52, 5051–5064. [Google Scholar] [CrossRef]
  116. Husain, M.A.; Tariq, A.; Hameed, S.; Arif, M.S.B.; Jain, A. Comparative assessment of maximum power point tracking procedures for photovoltaic systems. Green Energy Environ. 2017, 2, 5–17. [Google Scholar] [CrossRef]
  117. Ling, L.; Wu, X.; Liu, M.; Zhu, Z.; Li, Y.; Shang, B. Development of photovoltaic hybrid LED street lighting system. In Proceedings of the 2016 IEEE Advanced Information Management, Communicates, Electronic and Automation Control Conference (IMCEC), Xi’an, China, 3–5 Octorber 2016; pp. 729–732. [Google Scholar]
  118. Bora, S.A.; Pol, P.V. Development of solar street lamp with energy management algorithm for ensuring lighting throughout a complete night in all climatic conditions. In Proceedings of the International Conference on Inventive Computation Technologies (ICICT), Coimbatore, India, 26–27 August 2016; Volume 2, pp. 1–5. [Google Scholar]
Figure 1. Circuit diagram of a photovoltaic (PV) array model [18].
Energies 11 00365 g001
Figure 2. PV cell characteristics curves under different solar insolation.
Energies 11 00365 g002
Figure 3. PV cell characteristics curves under different temperatures.
Energies 11 00365 g003
Figure 4. P-V curves in many shading conditions.
Energies 11 00365 g004
Figure 5. I-V curves in several shading conditions.
Energies 11 00365 g005
Figure 6. Micro grid system [75].
Energies 11 00365 g006
Figure 7. Causes of dust accumulation on the surface of PV arrays [83].
Energies 11 00365 g007
Figure 8. An algorithm to detect snowfall [87].
Energies 11 00365 g008
Figure 9. Bypass and blocking diodes in PV module.
Energies 11 00365 g009
Figure 10. Offline and online mode of the controller [106].
Energies 11 00365 g010
Table 1. Comparison of INC algorithms.
Parameters/INC MPPTsAdaptive INCINR-Based INC [25]ST-Based INC [5]FC-Based INC [28]PI-Based INC [26]FLC-Based INC [6]
Input variables V p v , I p v V p v , I p v V p v , I p v V p v , I p v V p v , I p v V p v , I p v
Control variablesD I r e f V r e f R l o a d , DD R l o a d , D
Implementation costLowLowLowLowLowLow
Controller typesPICMicro controllerMicroprocessorPICDSPdSPACE
Converter typesBoostBoostBuck-BoostSEPICFly BackCUK
ComplexitySimpleSimpleComplexSimpleComplexAverage
System independenceHighHighHighHighHighHigh
Reliability in PSCsLessHighHighHighHighHigh
Convergence speedAverageFastFastFastMediumFast
Oscillation around MPPNoLessNoNoNoLess
Periodic tuningYesNoYesYesYesYes
Power efficiencyAverageHighHighHighHighHigh
Tracking speedSlowFasterFastFastFastFaster
Table 2. Comparison table of P&O methods.
Parameters/P&O MPPTsAdaptive P&O [40]FSCC P&O [43]DA P&O [41]PSO P&O [45]FLC P&O [48]ACO P&O [49]ANN P&O [50]MB P&O [51]GWO P&O [52]
Input variables V p v , I p v V p v , I p v V p v , I p v V p v , I p v V p v , I p v V p v , I p v V p v , I p v V p v , I p v V p v , I p v
Control variables I r e f I r e f , DD, ΔIVrefD, LoadDVref, DVrefD
Implementation costLowLowLowLowLowLowLowLowLow
Controller typesdSPACEdSPACEMicro-controllerMicro-controllerdSPACEPICDSPPICdSPACE
Converter typesBoostBuck-BoostSEPICBoostCukBoostBuckBoostBoost
ComplexitySimpleAverageAverageSimpleSimpleSimpleSimpleSimpleSimple
System IndependencePoorHighHighHighAverageHighHighHighHigh
Reliability in PSCsAverageHighHighHighHighHighHighHighhigh
Convergence speedFastFastFastFasterFastVery FastFastFastFast
Oscillation around MPPLessLessLessLessLessNolessLessLess
Periodic tuningYesYesNoYesNoNoYesNoNo
Power efficiencyMediumHighHighHighHighHighHighHighHigh
Tracking speedFasterFastFastFastFastFasterFastFasterFaster
Table 3. Comparison of other algorithms.
Parameters/Other MPPTsSSJ GMPPT [12]GAF [53] DISMC [54] FPA [56]ESC [57]Beta Method [59]
Inputs V p v , I p v E, ΔE V p v , I p v V p v , I p v V p v , I p v V p v , I p v
Control variablesVrefDD, VrefDDN, β
Implementation cost LessHigh LessLessLessLess
ControllerMicrocontrollerDSPFPGAArduinoArduinodSPACE
ConverterBoost BoostBoost BoostBuck -
Algorithm complexitySimple Simple Simple Simple SimpleModerate
System independencyHighHighHigh HighHighHigh
Tracking to PSCsYesYesYesFastFasterFaster
Convergence speed HighHighHighHighHighHigh
Oscillation around MPPNoLessLessNoLessNo
Periodic tuningNoNoNoNoNoYes
Power efficiencyHighHigh HighHighHighHigh
Tracking speed Very fastFasterFaster FastFasterHigh
Table 4. Comparison among several evaluating parameters of the PV system.
Parameters/Evaluations Certain TypeClimate ZoneReliabilityEfficiencyComplexityInstallation CostOcillationsTracking SpeedSystem Accuracy
PV Technologies [63,65,66]Thin-FilmHotHighHighSimpleCheaper--Best
Mono-CrystallineAllHighLowSimpleHigh--Average
Poli-CrystallineAllHighHighSimpleHigh--Better
HybridHotHighHighHighLow--Best
PV Array Size [100]Bulky Size-LessLowHighHighHigh-Average
Medium-HighAverageMediumLowMedium-High
Small-HighHighLessLowLess-High
PV Module Connections [67,69]Series-Parallel-HighHighSimpleCheaperLess-High
Series-LessLowHighCheapHigh-Less
Panel tilt and Orientation [80]Bulky PVModerateHighHighSimpleCheapNoHighHigh
PV Installation Conditions [82,83,86]SoilHotLessLowHigh-HighLowLess
SnowColdLessLowHigh-HighLowAverage
DustHotLessLowHigh-HighLowLess
Bypass Diode [90,91]In shaded Cell-LessLowHighHighHighLowAverage
PV Installation Complexities [8,12]Sensors-HighHighSimpleHigh--High
Switches-HighHighSimpleAverage--High
Passive Component-AverageHighSimpleAverage--High
PV Converter Selection [95,103,104]CUK-HighHighLessHighLess-Best
Buck Boost-LessLowHighLowLess-Less
SEPIC-LessLowHighLowLesser-Average
PV controller Selection [107]Arduino-LessAverageSimpleLow--Less
dSPACE-HighMediumAverageHigh--Average
DSP-HighMediumMediumMedium--Medium
FPGA-HighHighHighHigh--High
Load Impact [28,108]Non-Linear-LessLowHighHighHighlowLess

