You Better Repeat It: Complex CO2 × Temperature Effects in Atlantic Silverside Offspring Revealed by Serial Experimentation


Department of Marine Sciences, University of Connecticut Avery Point, 1080 Shennecossett Road, Groton, CT 06340, USA
*
Author to whom correspondence should be addressed.
Diversity 2018, 10(3), 69; https://doi.org/10.3390/d10030069
Submission received: 31 March 2018
/
Revised: 10 July 2018
/
Accepted: 17 July 2018
/
Published: 20 July 2018
(This article belongs to the Special Issue Impacts of Ocean Acidification on Marine Fishes)
Abstract
:Concurrent ocean warming and acidification demand experimental approaches that assess biological sensitivities to combined effects of these potential stressors. Here, we summarize five CO2 × temperature experiments on wild Atlantic silverside, Menidia menidia, offspring that were reared under factorial combinations of CO2 (nominal: 400, 2200, 4000, and 6000 µatm) and temperature (17, 20, 24, and 28 °C) to quantify the temperature-dependence of CO2 effects in early life growth and survival. Across experiments and temperature treatments, we found few significant CO2 effects on response traits. Survival effects were limited to a single experiment, where elevated CO2 exposure reduced embryo survival at 17 and 24 °C. Hatch length displayed CO2 × temperature interactions due largely to reduced hatch size at 24 °C in one experiment but increased length at 28 °C in another. We found no overall influence of CO2 on larval growth or survival to 9, 10, 15 and 13–22 days post-hatch, at 28, 24, 20, and 17 °C, respectively. Importantly, exposure to cooler (17 °C) and warmer (28 °C) than optimal rearing temperatures (24 °C) in this species did not appear to increase CO2 sensitivity. Repeated experimentation documented substantial inter- and intra-experiment variability, highlighting the need for experimental replication to more robustly constrain inherently variable responses. Taken together, these results demonstrate that the early life stages of this ecologically important forage fish appear largely tolerate to even extreme levels of CO2 across a broad thermal regime.
1. Introduction
The current anthropogenic increase in atmospheric and therefore oceanic carbon dioxide (CO2) concentrations has been unparalleled over the past 66 million years [1]. Resultant changes in ocean pH and carbon chemistry (ocean acidification, OA) are likely to have major impacts on marine ecosystems [2] by changing species abundances, interactions and trophic dynamics, all of which depend ultimately on the CO2 sensitivities of individual organisms [3,4,5]. Laboratory experiments have played an important role in quantifying these CO2 sensitivities, suggesting that they are greater in sessile, calcifying invertebrates than in active, non-calcifying vertebrates, and greater in early life stages than adults [6,7,8]. The latter has been particularly well documented for marine fish, where adults are largely tolerant of acute high-CO2 levels far exceeding predicted OA conditions [9,10]. By contrast, fish early life-stages (embryos and early larvae) that are still developing effective acid-base regulation have exhibited reduced survival [11,12], reduced growth [13,14], defective development [14,15], otolith over-calcification [16,17], and behavioral abnormalities in response to high-CO2 conditions in the laboratory [18,19]. Experiments showing no discernible CO2 effects are also common [20,21,22,23,24]. This complexity of empirical evidence remains challenging to reconcile [25], but is consistent with the emerging consensus of species- and population-specific CO2 sensitivities, particularly for fish adapted to high CO2 and pH variability in their habitats [26].
To date, experimental approaches have largely been guided by open-ocean predictions for administering CO2 treatments (see [27]). It is now recognized, however, that many marine organisms experience considerable diel and seasonal pH/CO2 fluctuations in their habitats [26,28,29,30]. Short-term pH/CO2 variability can be attributed to ephemeral upwelling [31], river input [32], and metabolic processes that dominate CO2 variability in coastal habitats [33] and in oxygen minimum zones [34]. The seasonal intensification of community respiration in highly productive coastal systems (e.g., saltmarshes and mangrove lagoons) can increase both average and extreme CO2 levels to nearly double the open-ocean OA predictions for the next 300 years [35]. Given the thermal sensitivity of microbial respiration rates, metabolically driven acidification is generally most extreme during peak summer temperatures [36]. Hence, to better understand climate change effects on coastal species, experiments should implement CO2 and temperature conditions that reflect the range of modern and predicted conditions of their source ecosystems, rather than relying on average global predictions.
While single-factor CO2 experiments are a necessary initial step, it is now widely recognized that OA proceeds in concert with ocean warming and deoxygenation. Experiments are needed to address species sensitivities to multiple stressors of marine climate change [37,38]. Warming may be the primary driver of ecological disruption, as there is already evidence of shifting fish distributions and phenologies [39,40], which likely reflect the need for ectotherms to maintain environments within their scope of physiological optima [41]. The capacity of organisms to maintain performance at temperatures approaching or exceeding their thermal tolerance is a key metric in determining climate sensitivity [42]. Elevated environmental CO2 may increase energetic costs associated with acid-base regulation [43] and could compromise the functional capacity of other vital processes [44] and therefore increase an organisms’ sensitivity to thermal extremes [38]. Thus, CO2 × temperature experiments are not only more realistic, they may also discover important stressor interactions that elude single-stressor approaches [45].
The majority of studies evaluating CO2 × temperature effects in fish have focused on stenothermal taxa from polar [46,47,48,49,50] or tropical habitats [51,52,53,54]. These fish are presumably adapted to their relatively stable thermal environments and may thus show limited acclimation capacity to combined climate stressors [55,56]. By contrast, temperate species are often eurythermal, i.e., capable of acclimating to broad seasonal temperature fluctuations. However, they are still adapted to specific thermal regimes [41] and often show narrower thermal requirements during CO2 sensitive early life stages [14,57].
Many fitness-relevant traits such as growth or survival are highly variable in nature during fish early life stages, thus producing variable outcomes even under most meticulously controlled experimental conditions [58,59]. Variations in offspring due to parentage, food quality and quantity, or water sources can introduce additional variability, hence underscoring the risks of generalizing results from single experiments to population or species characteristic such as CO2 or temperature sensitivity. More robust depictions of CO2 and temperature sensitivity are likely to emerge if experiments are replicated and analyzed together, but this approach is still underutilized in studies of climate change effects on marine organisms.
Here we report on five factorial CO2 × temperature experiments conducted on offspring of wild Atlantic silversides, Menidia menidia, an ecologically important and abundant coastal forage fish with a broad distribution along the east coast of North America [60]. Wild silverside offspring are amenable to experimental manipulations and have thus become a widely used model in OA experiments [58,61,62,63,64,65,66]. Over the course of three years, we repeatedly reared Atlantic silverside offspring at different factorial combinations of CO2 and temperature to quantify the temperature-dependence of CO2 effects in growth and survival. We hypothesized that negative responses to high-CO2 levels would largely occur at the species lower and upper thermal limits, while predicting fewer or no CO2 effects at optimal thermal conditions.
2. Methods
2.1. Field Sampling and Experimental Designs
Collections of wild, spawning ripe Atlantic silverside were made during high tide 1–3 days prior to full or new moons following the species’ semi-lunar spawning periodicity during spring and early summer [61]. Adults were caught with a 30 × 2 m beach seine from local salt marshes and transported live to our laboratory facilities. For the 2014 experiment (experiment 1), adults were collected from Poquot Beach (40°56.85′ N, 73°6.15′ W), and the experiment took place at Stony Brook University’s Flax Pond Marine Laboratory. During 2016 and 2017 (experiments 2–5), spawning adults were collected from Mumford Cove (41°19′25′′ N 72°01′07′′ W), and experiments were conducted in the Rankin Seawater Facility at University of Connecticut’s Avery Point campus. Ripe adults were held overnight at 20 °C in aerated tanks at low densities with no food and strip-spawned the next day. Fertilization dates for each experiment are reported in Table 1.
Strip-spawning protocols maximized fertilization success, while enabling random distribution of embryos across replicates [61,63]. For each experiment, eggs from 12+ running-ripe females were gently mixed into shallow plastic dishes lined with 1-mm plastic window screening. Milt from each of 20+ males was collected and pooled into 500-mL glass beakers, mixed with seawater, stirred, then gently poured into spawning dishes and mixed with eggs for ~15 min. The number of spawners used for each experiment and their length measurements are reported in Table S1. In this species, fertilized embryos uncoil chorionic filaments, which readily attach to screening. Window screens were cut into smaller sections where embryos were counted under low magnification with high accuracy.
Experiments were initiated within 2 h of fertilization when replicate rearing-containers (20-L cylindrical polyethylene buckets) received precisely 100 embryos. Rearing-containers were filled with clean seawater (filtered to 1 µm and UV sterilized). Optimal salinity (27–31) and light conditions (15 h light:9 h dark) for rearing M. menidia were maintained across experiments [60]. The number of CO2 × temperature treatments and replicates varied between experiments (see Table 1). For actual CO2 × temperature treatments administered see Table 2. Starting four days post-fertilization (dpf), each rearing-container was checked for hatched larvae. On the morning of first observed hatch, larvae were immediately provided with equal rations of powdered weaning diet (Otohime Marine Fish Diet, size A1, Reed Mariculture®, Campbell, CA, USA) to stimulate feeding and ad libitum levels of newly hatched brine shrimp nauplii (Artemia salina, San Francisco strain, brineshrimpdirect.com, Ogden, UT, USA). Larvae were fed daily ad libitum rations of newly hatched nauplii for the remainder of the experiment. To quantify survival to hatch, one day post-hatch larvae were counted by gently scooping small groups into replacement rearing-containers. For initial hatch standard length (SL, nearest 0.01 mm) measurements, larvae were randomly sub-sampled (N = 10) from each replicate were preserved in 5% formaldehyde/freshwater solution buffered with saturated sodium tetraborate. The timing of hatch sub-samples varied slightly between experiments and temperatures (see Table 3). Rearing-containers were siphoned of waste daily, and treatment water was partially exchanged with new seawater every other day. Levels of ammonia waste were monitored daily (Saltwater Ammonia Test Kit, API®, Chalfont, PA, USA) to maintain uncritical levels below 0.25 ppm. All experiments were terminated when larvae reached ~10 mm SL within temperature treatments (determined by visual estimates). Using body size rather than set time intervals allowed comparing CO2 effects on offspring during the same developmental period (i.e., fertilization to ~10 mm SL) across temperature treatments. Experiment durations ranged from 14 to 36 days (Table 3). At termination, all survivors were counted and measured for SL (nearest 0.01 mm) via calibrated digital images (Image Pro Premier V9.0, Media Cybernetics®, Rockville, MD, USA).
2.2. CO2 and Temperature Levels
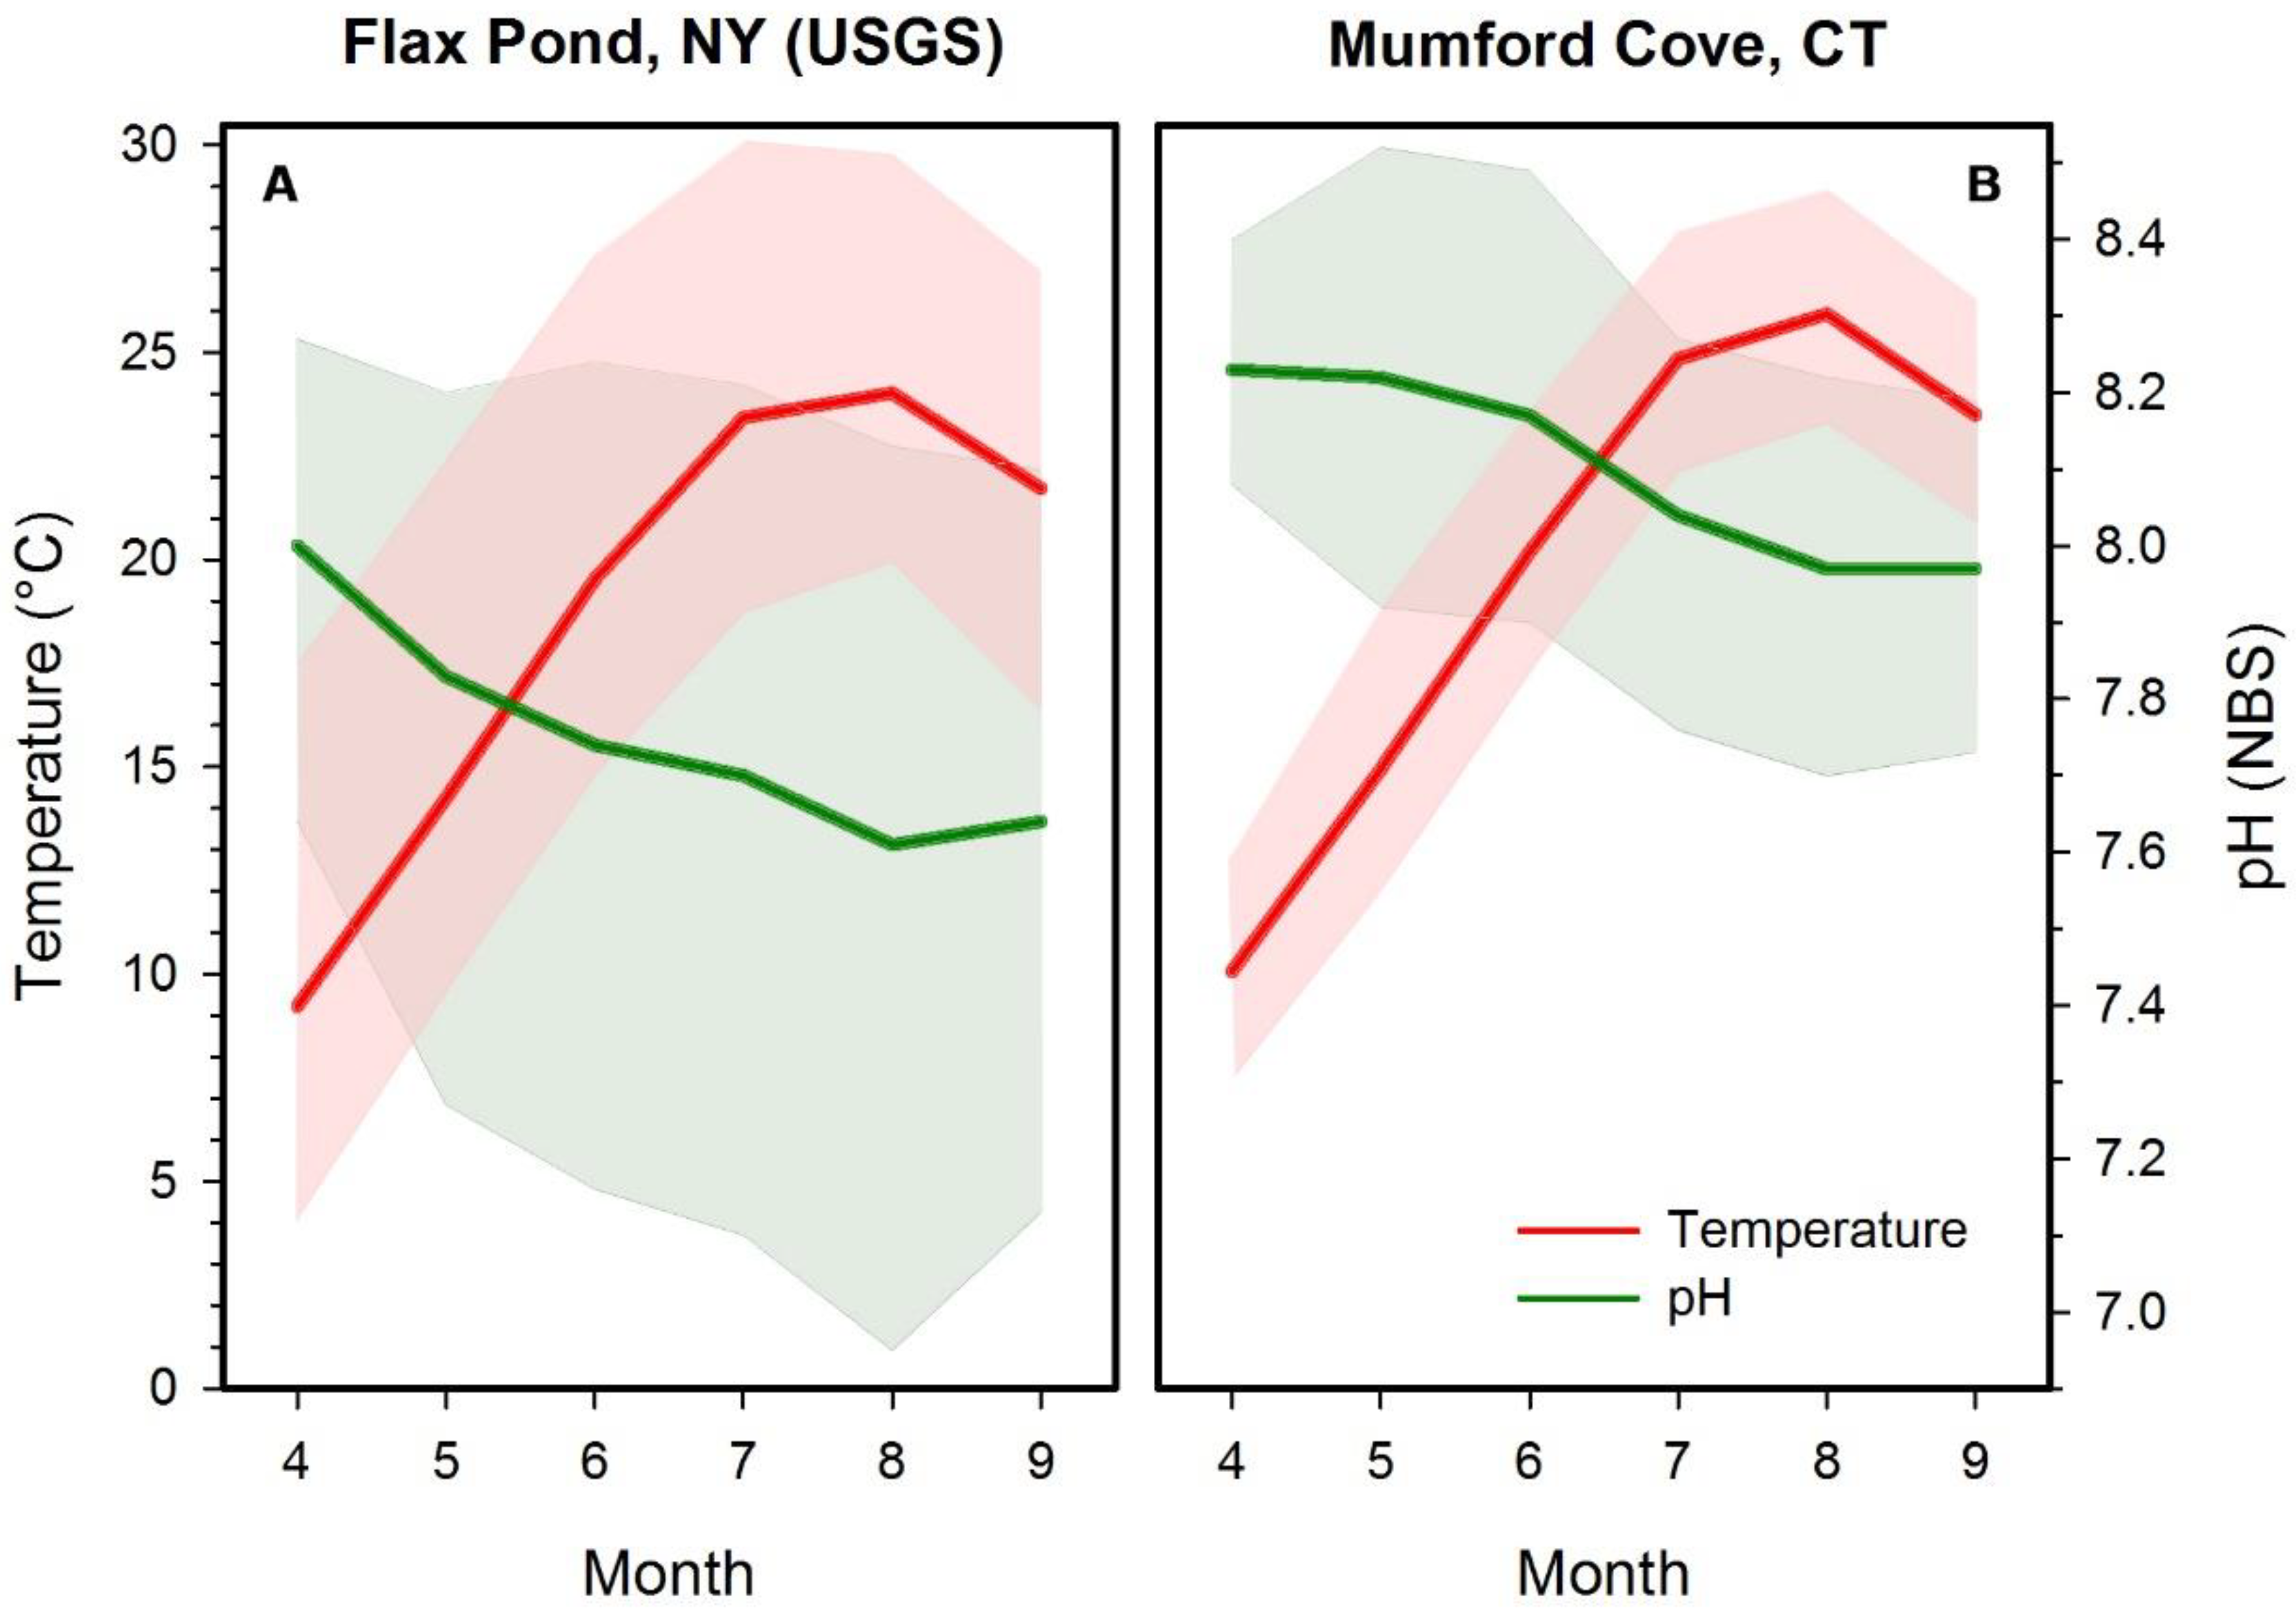
We applied a target CO2 level of 400 µatm (~8.15 pH) for control treatments, a level characteristic of the open ocean and of coastal systems at the onset of the silverside spawning season (spawning typically begins early April and extends through July) (Figure 1 [61]). The target level for high CO2 was 2200 µatm (~7.50 pH), a level that is commonly experienced by silverside offspring in late spring and summer (Figure 1), but also represents the maximum prediction of average OA for the next 300 years [67] and therefore a common benchmark in many OA studies [61,62,63]. The target level for the extreme CO2 treatment was 6000 µatm (~7.15 pH) during experiment 1, but was reduced to 4200 µatm (~7.20 pH) for experiments 3 and 5. These represent extreme CO2 conditions rarely reached in contemporary coastal systems, but may become more common under future climate and eutrophication scenarios [33].
We administered four temperature treatments over the course of the five experiments; 17, 20, 24 and 28 °C. The first three temperatures represent local conditions found during the onset (late-April), peak (early-June), and end (July) of the silverside spawning season, respectively (Figure 1). At the latitude of our source populations (~41° N), silverside spawning habitats rarely reach temperatures of 28 °C, however, these conditions may become more common given projected increases of 2–3 °C in global mean ocean temperature [68]. The optimal culturing temperature for M. menidia from northern latitudes is ~24 °C; thus, 20 °C and 24 °C treatments were considered near-optimal temperatures, while 17 °C and 28 °C treatments represented sub-optimal thermal conditions [60].
2.3. CO2 × Temperature Manipulations and Measurements
All experiments followed established best practices and guidelines for seawater acidification in OA research [27]. For 2 × 2 and 3 × 2 factorial designs (see Table 1 for overview of experiments and designs), replicate rearing-containers were placed into large temperature-controlled water baths. Elevated CO2 levels were achieved via gas proportioners (ColeParmer®, Vernon Hills, IL, USA) mixing air with 100% CO2 (bone dry grade) that was delivered continuously to the bottom of each replicate rearing-container via airstone. To counteract metabolic CO2 accumulation, control CO2 conditions were achieved by forcing compressed laboratory air through a series of CO2-stripping units containing granular soda lime (AirGas®, Waterford, CT, USA), a particle filter (1 µm), and then to each rearing-container via airstone. Target pH levels were monitored daily using a handheld pH probe (Orion Ross Ultra pH/ATC Triode with Orion Star A121 pH Portable Meter (Thermo Fisher Scientific®, Waltham, MA, USA); Intellical PHC281 pH Electrode with HQ11D Handheld pH/ORP Meter (Hach®, Loveland, CO, USA) calibrated bi-weekly with National Institute of Standards and Technology (NIST) certified 2-point pH references. Continuous bubbling maintained dissolved oxygen (DO) saturation (>8 mg/L) in rearing vessels. Target treatment temperatures were controlled by thermostats (Aqualogic®, San Diego, CA, USA) which powered chillers (DeltaStar®, Lynchburg, VA, USA) or glass submersible heaters to maintain water bath temperatures.
For 3 × 3 factorial experiments, we constructed an automated acidification system composed of nine discrete recirculation-units designed for larval fish rearing. Each recirculating-unit consists of a sump (90 L), a header tank (40 L) and a main tank (240 L) that holds up to five replicate rearing-containers (20 L) fitted with screened overflow holes (100 µm). In these units, seawater continuously circulates from the sump through a UV sterilizer into the header tank, where it is gravity fed to the bottom of each rearing-container, from which it overflows in the main tank and back into the sump. We designed a LabView (National Instruments®, Austin, TX, USA) based program to fully automate the control of seawater chemistry. The software interfaces with the recirculating-units via a data-acquisition module (NI cDAQ-9184, National Instruments®), which controls nine sampling-pumps (one per tank) and a series of gas and water solenoid valves, while receiving input from a central pH electrode (Hach pHD® digital electrode calibrated weekly using NIST 2-point pH references) and DO probe (Hach LDO® Model 2). The software sequentially assesses the pH conditions in each recirculating-unit (once per hour) by pumping water for ~7.5 min through the housing of the central pH probe, comparing measured pH levels to set-points and then adjusting levels by bubbling standardized amounts of 100% CO2 (bone dry grade, AirGas®) or CO2-stripped air into the sump of each tank. The software also maintains DO saturation (>8 mg/L) by bubbling in CO2-stripped air. LabView logs current pH, temperature, and DO conditions before cycling to the next unit. Temperatures were controlled by thermostats (Aqualogic®) that powered submersible heaters or in-line chillers (DeltaStar®).
Actual treatment CO2 levels were determined based on measurements of pH, temperature, salinity, and total alkalinity (AT). Treatment tanks were sampled three times per experiment for measurements of AT (μmol kg−1). Seawater was siphoned and filtered (to 10 µm) into 300-mL borosilicate bottles. Salinity was measured at the time of sampling using a refractometer. Bottles were stored at 3 °C and measured for AT within two weeks of sampling using an endpoint titration (G20 Potentiometric Titrator, Mettler Toledo®, Columbus, OH, USA). Methodological accuracy (within ±1%) of alkalinity titrations were verified and calibrated using Dr. Andrew Dickson’s (University of California San Diego, Scripps Institution of Oceanography, https://www.nodc.noaa.gov/ocads/oceans/Dickson_CRM/batches.html) certified reference material for AT in seawater. The partial pressure and fugacity of CO2 (pCO2, fCO2; μatm) as well as dissolved inorganic carbon (CT; μmol kg−1) and carbonate ion concentration (CO32−; μmol kg−1) were calculated in CO2SYS (V2.1, http://cdiac.ornl.gov/ftp/co2sys) based on measured AT, pH, temperature, and salinity using K1 and K2 constants from Mehrbach et al. [69] refitted by Dickson and Millero [70] and Dickson [71] for KHSO4. An overview of pH and carbonate chemistry measurements for each experiment is given in Table 2.
2.4. Response Traits and Statistical Analysis
For all replicates in each experiment we quantified time (d) to first-hatch (day of fertilization to day of first-hatch), the % of embryo survival (fertilization to hatch), the % of larval survival (hatch to end of experiment), SL at hatch, and post-hatch growth rate ((mean final SL − mean hatch SL)/number days reared post-hatch). For experiment 1, only survival traits were quantified. Time to first-hatch was invariant between CO2 levels and thus was not analyzed statistically. Proportional survival data were logit transformed [=log10(survival/(1 − survival))] prior to analysis [72]. Grubb’s test [73] was used to identify potential outlying replicates, resulting in the removal of three replicates throughout the dataset for low embryo survival (Grubb’s test, p < 0.05).
Statistical analyses were computed using SPSS (V20, IBM). As a first step, we used linear mixed effects models incorporating data from all experiments to test for significant effects (α < 0.05) of CO2, temperature, their interaction (fixed factors) and experiment (random factor) for each response trait:
Response trait data were checked for variance homogeneity and assumption of normality using Levene’s and Shapiro-Wilk tests (α < 0.05), respectively. If linear mixed effects models identified traits with significant CO2 or CO2 × temperature effects, we used two-way analysis of variance (ANOVA) to test for significant effects of CO2, temperature, and their interaction within each experiment:
This approach was implemented to characterize how CO2 effects differed between experiments. If two-way ANOVAs detected significant (α < 0.05) CO2 or CO2 × temperature interactive effects, we used one-way ANOVAs to test for significant CO2 effects within temperature treatments. Where necessary, least-significant-difference (LSD) post-hoc tests were used for multiple comparisons. We conducted two- and one-way ANOVAs on experiment 1 separately because the extreme CO2 level implemented there (~6000 µatm) was higher than in experiments 3 and 5 (~4200 µatm). ANOVA groups were checked for variance homogeneity and assumption of normality using Levene’s and Shapiro-Wilk tests (α < 0.05), respectively.
Response trait = CO2 + temperature + CO2 × temperature + experiment + error.
Response trait = CO2 + temperature + CO2 × temperature + error.
Linear mixed effects models indicated that response traits were highly variable between experiments. Hence, we implemented an additional approach to better describe CO2 effects across temperature treatments. We quantified the temperature-specific CO2 effect sizes for each trait (T) for each experiment by calculating the log-transformed CO2 response ratio (lnRR) to high and extreme levels of CO2 exposure. LnRRs evaluate the average proportional change in a trait relative to control treatments, with negative lnRRs indicating negative CO2 effects. LnRRs have become a common metric for evaluating CO2 effects in meta-analyses when comparing variable responses across studies [6,25,74]. LnRRs were calculated as:
Overall temperature-specific CO2 responses were calculated as the mean lnRR(T) across experiments.
lnRR(T) = ln(Thigh or extreme CO2) − ln(Tcontrol CO2).
3. Results
3.1. Embryo Survival
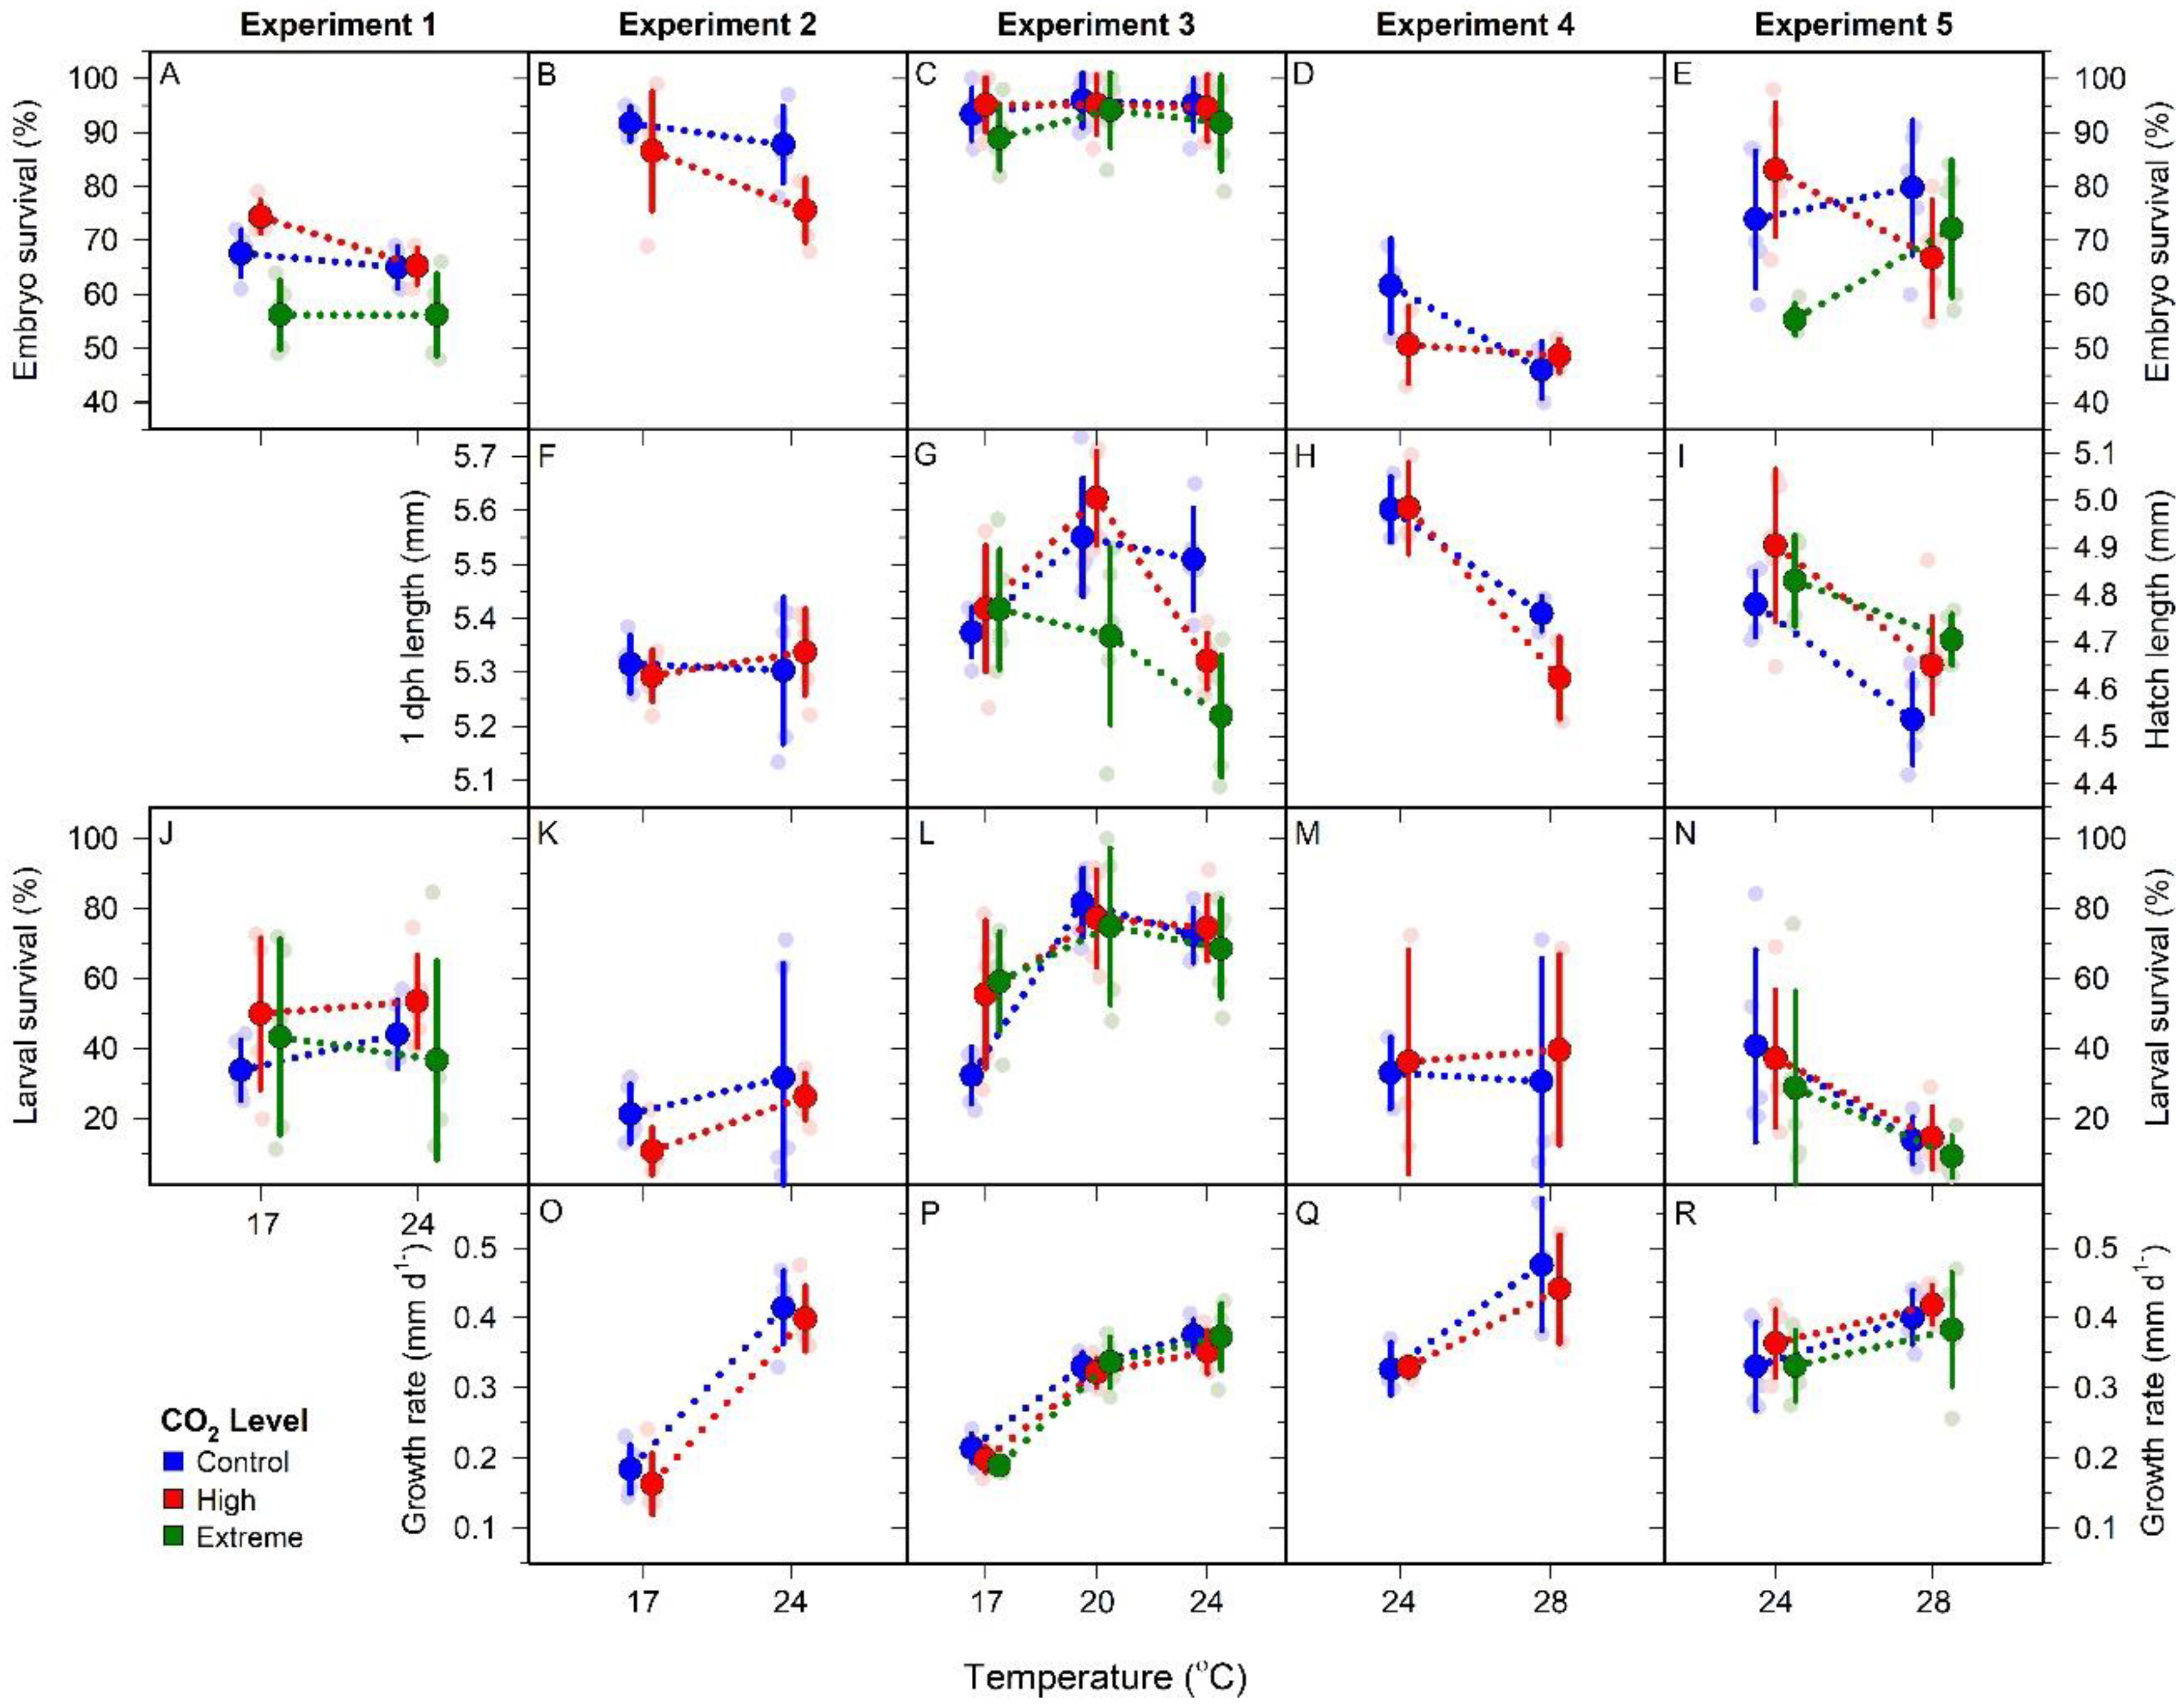
Among-replicate time to first hatch was 5, 6, 10, and 13 dpf at 28, 24, 20, and 17 °C, respectively. CO2 level had no influence on time to hatch (Table 3). Across experiments, mean embryo survival ranged from 46–96% (mean 76%, Figure 2A–D, Table 3). A linear mixed effect model found no influence of CO2, temperature, or their interaction on embryo survival (Table 4). However, there was a significant effect of experiment (F(4, 118) = 33.581, p < 0.001), because in experiment 1, high CO2 reduced embryo survival (two-way ANOVA, F(2, 28) = 18.965, p < 0.001) by 11% at 17 °C (LSD, p = 0.003) and 24 °C (LSD, p = 0.027) relative to control treatments. This effect was not observed in subsequent experiments with less extreme CO2 treatments.
3.2. Hatch Length
Across experiments mean hatch SL ranged from 4.54–5.62 mm, but within experiment variation was small (±0.4 mm) (Figure 2F–I, Table 3). A linear mixed effects model indicated significant temperature (F(3, 90) = 19.518, p < 0.001), CO2 × temperature (F(6, 90) = 3.021, p = 0.010), and experiment effects (F(3, 90) = 75.361, p < 0.001) (Table 4). The CO2 × temperature interaction was driven by divergent CO2 × temperature responses between experiments 3 and 5. During experiment 3, a two-way ANOVA found hatch lengths were significantly affected by CO2 (F(2, 44) = 7.600, p = 0.002), temperature (F(2, 44) = 14.857, p < 0.001), and their interaction (F(4, 44) = 5.522, p = 0.001). Hatch lengths were similar at 17 °C, but exposure to extreme CO2 significantly reduced offspring size at 20 °C relative to the control treatment (one-way ANOVA, F(2, 14) = 5.947, p = 0.016). The CO2-induced reduction in hatch length was largest at 24 °C (one-way ANOVA, F(2, 14) = 13.342, p = 0.001), with exposure to high and extreme CO2 reducing larval size by 3% (LSD, p = 0.006) and 5% (LSD, p < 0.001), respectively, compared to controls. During experiment 5, a two-way ANOVA found hatch lengths were significantly affected by CO2 (F(2, 28) = 5.222, p = 0.013) and temperature (F(1, 28) = 25.544, p < 0.001). Contrary to experiment 3, there was no influence of CO2 at 24 °C. However, at 28 °C, high and extreme CO2 significantly increased hatch length (one-way ANOVA, F(2, 14) = 5.942, p = 0.016) by 3% (LSD, p = 0.014) and 4% (LSD, p = 0.010), respectively, compared to the control treatment.
3.3. Larval Survival
Larval survival was highly variable both within and between experiments, with treatment means ranging from 9–82% (mean 42%, Figure 2J–N, Table 3 Across all experiments, a linear mixed effects model found significant effects of temperature (F(31, 21) = 9.918, p < 0.001) and experiment (F(41, 21) = 12.798, p < 0.001), but no influence of CO2 or CO2 × temperature (Table 4). Within temperature mean (±SD) larval survival was highest at 20 °C (78 ± 14%), with reduced survival observed at 24 °C (46 ± 25%), 17 °C (38 ± 22%), and 28 °C (19 ± 19%).
3.4. Larval Growth Rate
Growth rates ranged from 0.16–0.48 mm d1− (mean 0.33 mm d1−, Figure 2O–R, Table 3). A linear mixed effects model identified significant temperature (F(3, 92) = 80.189, p < 0.001) and experiment (F(3, 92) = 3.838, p = 0.012) effects, but no influence of CO2 or CO2 × temperature (Table 4). Across experiments, growth rates increased similarly across CO2 levels with increasing temperatures. Within-temperature means (±SD) ranged from 0.19 ± 0.03, 0.33 ± 0.02, 0.36 ± 0.05, and 0.42 ± 0.06 mm d1− at 17, 20, 24, and 28 °C, respectively.
3.5. Overall CO2 Effect Size (LnRR)
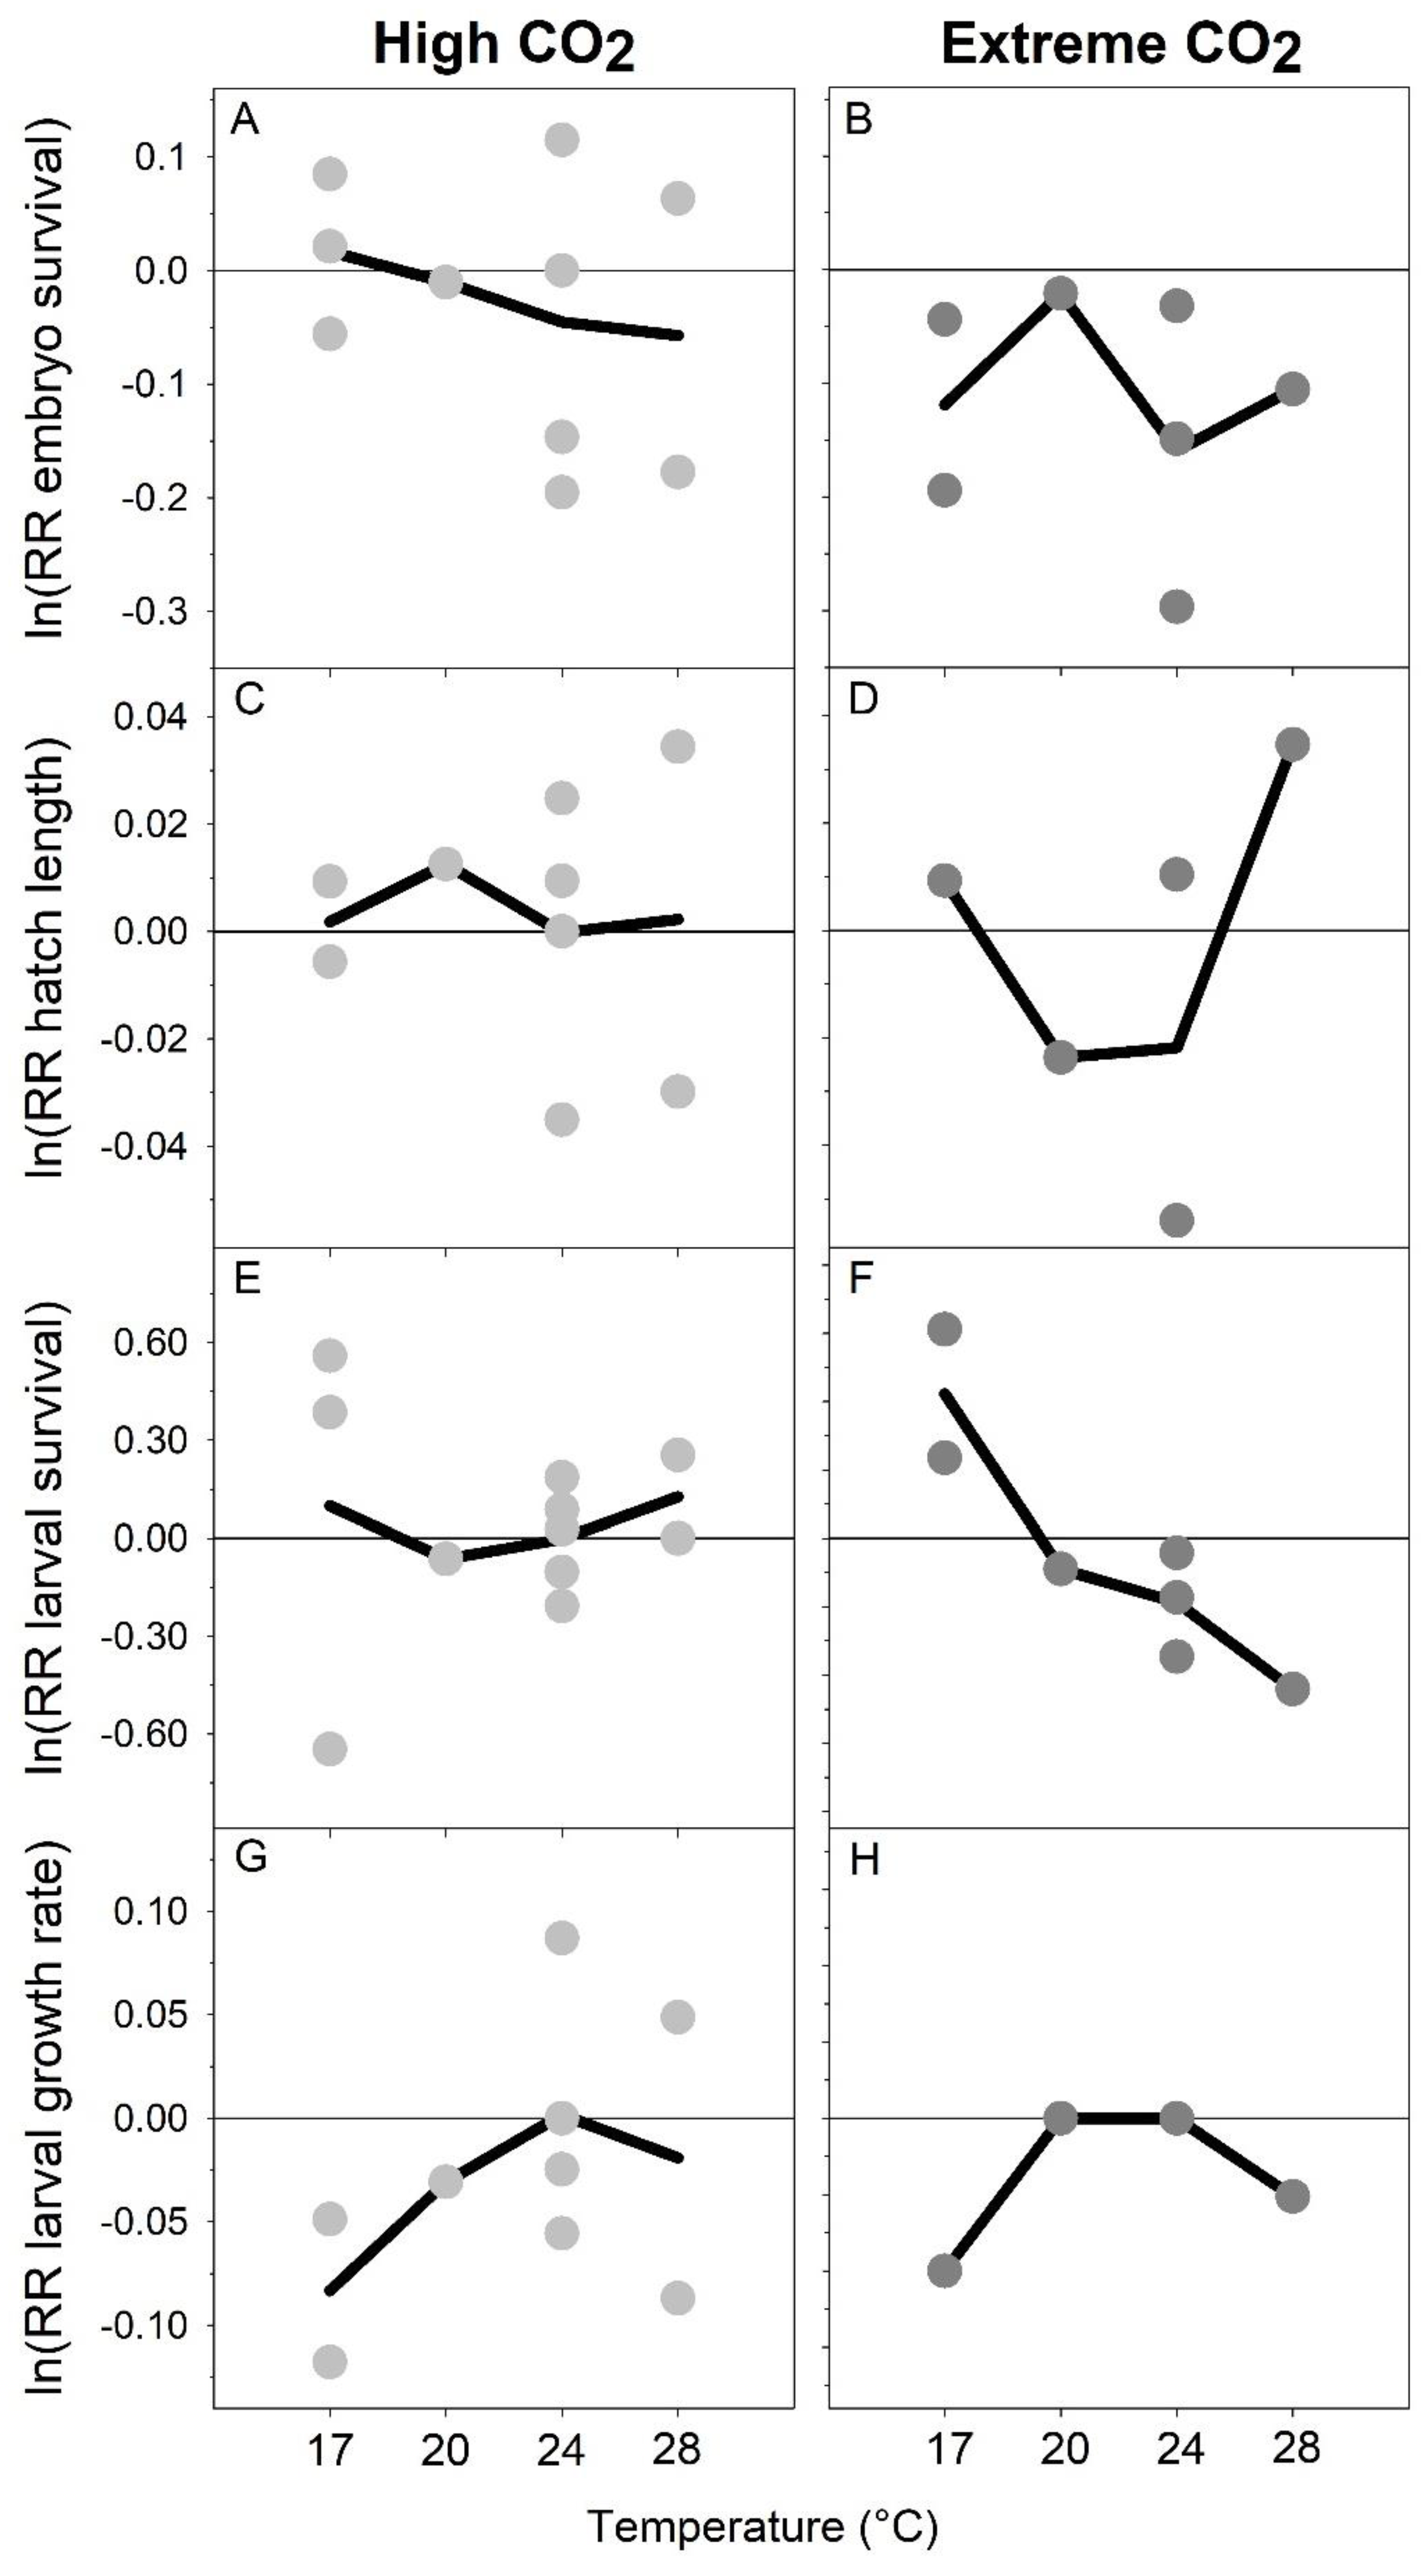
The overall CO2 effect on embryo survival was small in response to high CO2 conditions (within ±0.06) and similar across temperature treatments (Figure 3A). For offspring exposed to extreme CO2, all responses were negative (−0.04 to −0.30), but there was no apparent trend with temperature (Figure 3B). For hatch size, overall effects were small both at high and extreme CO2 treatments (±0.03), again with no apparent temperature dependency (Figure 3C,D). The overall effect of high CO2 conditions on larval survival was highly variable (−0.64 to 0.55) and overall neutral across temperatures (Figure 3E). Interestingly, the effect of extreme CO2 conditions on larval survival was positive at 17 °C (0.42) but became increasingly negative with increasing temperatures (−0.18 at 24 °C and −0.44 at 28 °C, Figure 3F). Average CO2 effects for growth rate were small (within ± 0.10), but exhibited a dome-shaped response across temperatures at both CO2 levels, with negative growth responses at sub-optimal rearing temperatures (Figure 3G,H).
4. Discussion
We conducted five factorial experiments to evaluate the sensitivity of M. menidia early life traits to high (2000–2800 µatm) and extreme CO2 conditions (4000–6200 µatm) across four temperatures (17, 20, 24, and 28 °C) that encompassed contemporary and potential future conditions in nearshore silverside spawning habitats. The experiments showed few significant CO2 effects on response traits. Significant reductions in embryo survival occurred at 17 and 24 °C in a single experiment and at the most extreme CO2 treatment (~6000 µatm). Effects on hatch length showed evidence for CO2 × temperature interactions, given that elevated CO2 reduced hatch length at 24 °C during one experiment, while increasing hatch length at 28 °C during another. There were no significant effects of CO2 on larval survival or growth rate. Together, these findings suggest that M. menidia offspring can tolerate high to extreme CO2 levels across most of the species’ thermal range.
The apparent CO2 resilience of M. menidia offspring may reflect the pH/CO2 variability typical of their nursery habitat. Atlantic silversides spawn in shallow subtropical to temperate estuaries [75] where seasonal acidfication elicits increasingly large diel pH fluctuations while progressively reducing daily mean and minimum pH levels [35]. Such patterns of seasonal pH/CO2 variation appear to be common in shallow nearshore habitats [36]. As a batch-spawning fish, silversides spawn fortnightly from late April to early July (at ~41° N) which coincides with the period of most rapid habitat acidification [61] Thus, a single female will deposit subsequent batches of embryos into a progressively more pH variable and acidic environment. In a previous study, we found offspring CO2 tolerance closely tracked temporal trends in habitat acidification [61]. Transgenerational plasticity is a possible explanation for this rapid shift, by which adults experiencing a progressively more acidic environment augment offspring phenotypes to better match current environmental conditions [76]. An additional source of CO2 tolerance may arise from local adaptation. Despite being an annual fish with high population connectivity, Atlantic silversides exhibit local adaptation for traits involved in growth and environmental sex determination [77], which are likely maintained through the continuous selection of locally suited genotypes [78]. As previously demonstrated, early life survival under high CO2 conditions is a heritable trait in this species, suggesting that CO2 tolerance could evolve [63]. Local adaptation to acidified habitats through the selection and maintenance of CO2-tolerant traits has been demonstrated in other taxa [29]. For Atlantic silversides that spawn in habitats prone to acidification, adaptations that enable high-CO2 tolerance are likely well represented in wild populations and would explain the observed CO2 tolerance. Importantly, we found that exposure to ~6000 µatm pCO2 did reduce embryo survival during experiment 1, while offspring were largely tolerant to ~4200 µatm in subsequent experiments. While 6000 µatm is an extreme, likely unrealistic CO2 level for silverside spawning habitats, it may represent a tolerance threshold for M. menidia. Identifying such thresholds are necessary to accurately assign an organisms’ sensitivity to future climate change [79].
Maternal provisioning of eggs through modifications of energy content or fatty acid composition may further influence offspring CO2 sensitivity [58]. Such differences may have contributed to CO2 effects on hatch length documented during experiments 3 and 5. In Atlantic cod, CO2 induced reductions in hatch size were not accompanied by increased utilization of yolk reserves during embryogenesis [80]. The authors suggest that yolk utilization was already maximized, and increased demands on acid/base regulation resulted in a shift of endogenous energy use away from somatic growth. Conceivably, CO2 reductions in hatch size during experiment 3 were the result of a similar mechanism. Conversely, differences in maternal provisioning of embryos from experiment 5 may have stimulated yolk utilization under elevated CO2, leading to increased embryonic growth and hatch size [13]. Fish embryos passively experience their environment with fixed energy reserves [81] but are likely most sensitive to elevated CO2 [11]. Further investigations are needed into how CO2 × temperature combinations influence embryo energetics.
The apparent tolerance of M. menidia offspring to combined climate stressors contrasts with the growing evidence for compounding effects of near future OA and warming in the early life stages of other fish species. For example, combined treatments synergistically decreased embryo survival in Antarctic dragon fish (Gymnodraco acuticeps) [48] and compromised temperature acclimation and aerobic performance in emerald rockcod (Trematomus bemacchii) [49]. As extreme stenotherms, polar species appear particularly vulnerable to combined climate effects [82], but eurythermal temperate species have demonstrated similar sensitivities. For example, exposure to acidification and warming reduced hatch size and larval survival in the Senegalese sole (Solea senegalensis) [14] and Atlantic cod (Gadus morhua) [80]. In the congeneric M. beryllina, a large reduction in survival was found when simultaneously exposed to high-CO2 and 29 °C [59]. The CO2 × temperature tolerance demonstrated by M. menidia offspring is likely a manifestation of conditions widely experienced by wild silverside early life stages. The acidification of their near shore nursery habitat is largely driven by seasonal changes in community respiration that generally peak with seasonally maximum water temperatures [36]. Thus, simultaneous occurrence of potentially stressful temperature and CO2 levels are a regular feature of M. menidia spawning habitat. Furthermore, because seasonal habitat changes are of the same direction and similar magnitude to climate projections, existing phenotypic or genetic variation already present in silverside populations may confer some degree of tolerance to future marine climate change [83].
While M. menidia early life stages appear resistant to elevated CO2 across a broad thermal regime, the addition of other stressors could potentially be detrimental. For example, temperature-dependent metabolic processes that drive coastal acidification simultaneously consume oxygen; hence, warming, acidification, and hypoxia co-occur in M. menidia nursery habitats [36,84]. Given their co-occurrence in nature, physiological responses to elevated CO2 and low DO are likely connected. Intermediate CO2 exposure can elicit important adaptive responses which may mediate sublethal effects of low DO [84], yet more extreme exposures may act synergistically to elevate stressor sensitivity [85]. Thus, factorial CO2 × DO × temperature experiments would be insightful for more robust characterizations of coastal climate effects on fish early life stages.
Whole lifecycle effects of elevated CO2 exposure remain critically understudied in fish [25]. While acclimation to chronic hypercapnia likely has small metabolic costs [86], over longer timescales tradeoffs associated with increased acid/base regulation could compromise other physiological processes [43]. In a previous study, we documented small but significant size reductions in M. menidia reared under ~2200 µatm CO2 and 17 °C for approximately a third of their lifespan [62]. Importantly, differences in length were only detected after two months of continuous high-CO2 exposure. In the present study, CO2 effect sizes calculated for growth rates displayed dome-shaped response curves, with more negative responses at sub-optimal rearing temperatures. For offspring reared under 17 °C and high CO2, the average growth effect size was −0.08 (i.e., −8%), a response of similar magnitude to previously documented growth reductions under the same conditions after four months [62]. Importantly, that study used large sample populations (>2000 individuals) providing the necessary power to statistically confirm a CO2 effect. Arguably, many early-life experiments with smaller sample sizes lack the power to robustly detect small effects [87]. Thus, it is possible that small or undetectable CO2 reductions in early-life growth accrue and become detectable during long-term exposures. Even minor changes to early life development may have important carry-over effects to later life stages and ultimately impact fitness [88]. As an annual fish, juvenile growth during summer is critically important for M. menidia, as larger individuals have higher overwintering survival [89]. How warming temperatures may interact with CO2 over longer time-scales is presently unknown and represents a serious gap in our understanding of how combined climate stressors will impact fish [90].
Across experiments, CO2 responses were highly complex, consistent with previous OA studies on silverside offspring [58,59,61]. Experiments produced functionally different outcomes within equivalent treatment conditions despite meticulously controlled experimental conditions. For all traits but growth rate, inter-experiment variation was more substantial than variability driven by CO2 or temperature level. A portion of this variability could be elicited by small differences in food quantity or quality, water source, or realized CO2 levels, but parentage likely constitutes the largest source of variation in offspring, mediated through genetic or phenotypic inheritance and maternal provisioning. A limitation of the present study was the use of embryos from a single group of spawning adults for each experiment. This precluded the incorporation of parentage into the statistical analysis, thereby potentially underestimating this source of variation as previously reported in M. menidia [58]. Plastic offspring responses to CO2 × temperatures conditions are likely adaptive in species like M. menidia that spawn in highly dynamic systems [91]. Thus, this inherent plasticity precludes broad generalizations based on single, short-term experiments, but understanding such plasticity is fundamental in assigning potential risks to ongoing climate change [83,92]. Highly variable CO2 × temperature responses are common across taxonomic groups [90,93], thus experimental replication and inter-experiment statistical comparisons are necessary for robust evaluations of climate sensitivities in marine organisms.
In summary, we analyzed five CO2 × temperature experiments together to robustly characterize CO2 × temperature responses of important fitness related traits in M. menidia offspring. While individual experiments demonstrated some negative CO2 effects, overall responses were largely neutral. Importantly, we found sub-optimal rearing temperatures did not increase sensitivity to even extreme CO2 levels. Repeated experimentation documented substantial inter- and intra-experiment variability, highlighting the need for experimental replication to accurately describe inherently variable response traits.
Supplementary Materials
The following are available online at https://www.mdpi.com/1424-2818/10/3/69/s1, Table S1: Adult spawner counts and length measurements.
Author Contributions
C.S.M. and H.B. designed the experiments, C.S.M. carried out the experiments, C.S.M. and H.B. wrote the manuscript.
Funding
This study was funded by a National Science Foundation grant to H.B. (NSF-OCE 1536165).
Acknowledgments
We are grateful to J. Snyder, M. Hughes, E. Karamavros, J. Pringle, and C. Woods for assistance in the lab. This work was funded by NSF OCE #1536165.
Conflicts of Interest
The authors declare no conflicts of interest.
References
- Zeebe, R.E.; Ridgwell, A.; Zachos, J.C. Anthropogenic carbon release rate unprecedented during the past 66 million years. Nat. Geosci. 2016, 9, 325–329. [Google Scholar] [CrossRef] [Green Version]
- Doney, S.C.; Fabry, V.J.; Feely, R.A.; Kleypas, J.A. Ocean acidification: The other CO2 problem. Mar. Sci. 2009, 1, 169–192. [Google Scholar] [CrossRef] [PubMed]
- Fabry, V.J.; Seibel, B.A.; Feely, R.A.; Orr, J.C. Impacts of ocean acidification on marine fauna and ecosystem processes. ICES J. Mar. Sci. 2008, 65, 414–432. [Google Scholar] [CrossRef] [Green Version]
- Harley, C.D.; Randall Hughes, A.; Hultgren, K.M.; Miner, B.G.; Sorte, C.J.; Thornber, C.S.; Rodriguez, L.F.; Tomanek, L.; Williams, S.L. The impacts of climate change in coastal marine systems. Ecol. Lett. 2006, 9, 228–241. [Google Scholar] [CrossRef] [PubMed] [Green Version]
- Wootton, J.T.; Pfister, C.A.; Forester, J.D. Dynamic patterns and ecological impacts of declining ocean pH in a high-resolution multi-year dataset. Proc. Natl. Acad. Sci. USA 2008, 105, 18848–18853. [Google Scholar] [CrossRef] [PubMed] [Green Version]
- Kroeker, K.J.; Kordas, R.L.; Crim, R.N.; Singh, G.G. Meta analysis reveals negative yet variable effects of ocean acidification on marine organisms. Ecol. Lett. 2010, 13, 1419–1434. [Google Scholar] [CrossRef] [PubMed]
- Wittmann, A.C.; Pörtner, H.-O. Sensitivities of extant animal taxa to ocean acidification. Nat. Clim. Chang. 2013, 3, 995–1001. [Google Scholar] [CrossRef]
- Dupont, S.; Dorey, N.; Thorndyke, M. What meta-analysis can tell us about vulnerability of marine biodiversity to ocean acidification? Estuar. Coast. Shelf Sci. 2010, 89, 182–185. [Google Scholar] [CrossRef]
- Melzner, F.; Gutowska, M.; Langenbuch, M.; Dupont, S.; Lucassen, M.; Thorndyke, M.C.; Bleich, M.; Pörtner, H.O. Physiological basis for high CO2 tolerance in marine ectothermic animals: Pre-adaptation through lifestyle and ontogeny? Biogeosciences 2009, 6, 2313–2331. [Google Scholar] [CrossRef] [Green Version]
- Ishimatsu, A.; Hayashi, M.; Kikkawa, T. Fishes in high-CO2, acidified oceans. Mar. Ecol. Prog. Ser. 2008, 373, 295–302. [Google Scholar] [CrossRef]
- Baumann, H.; Talmage, S.C.; Gobler, C.J. Reduced early life growth and survival in a fish in direct response to increased carbon dioxide. Nat. Clim. Chang. 2012, 2, 38–41. [Google Scholar] [CrossRef]
- Stiasny, M.H.; Mittermayer, F.H.; Sswat, M.; Voss, R.; Jutfelt, F.; Chierici, M.; Puvanendran, V.; Mortensen, A.; Reusch, T.B.H.; Clemmesen, C. Ocean acidification effects on atlantic cod larval survival and recruitment to the fished population. PLoS ONE 2016, 11, e0155448. [Google Scholar] [CrossRef] [PubMed]
- Chambers, R.; Candelmo, A.; Habeck, E.; Poach, M.; Wieczorek, D.; Cooper, K.; Greenfield, C.; Phelan, B. Ocean acidification effects in the early life-stages of summer flounder, Paralichthys dentatus. Biogeosciences 2014, 10, 13897–13929. [Google Scholar] [CrossRef]
- Pimentel, M.S.; Faleiro, F.; Dionísio, G.; Repolho, T.; Pousão-Ferreira, P.; Machado, J.; Rosa, R. Defective skeletogenesis and oversized otoliths in fish early stages in a changing ocean. J. Exp. Biol. 2014, 217, 2062–2070. [Google Scholar] [CrossRef] [PubMed] [Green Version]
- Frommel, A.Y.; Maneja, R.; Lowe, D.; Malzahn, A.M.; Geffen, A.J.; Folkvord, A.; Piatkowski, U.; Reusch, T.B.H.; Clemmesen, C. Severe tissue damage in Atlantic cod larvae under increasing ocean acidification. Nat. Clim. Chang. 2012, 2, 42–46. [Google Scholar] [CrossRef]
- Checkley, D.M.; Dickson, A.G.; Takahashi, M.; Radich, J.A.; Eisenkolb, N.; Asch, R. Elevated CO2 enhances otolith growth in young fish. Science 2009, 324, 1683. [Google Scholar] [CrossRef] [PubMed]
- Bignami, S.; Enochs, I.C.; Manzello, D.P.; Sponaugle, S.; Cowen, R.K. Ocean acidification alters the otoliths of a pantropical fish species with implications for sensory function. Proc. Natl. Acad. Sci. USA 2013, 110, 7366–7370. [Google Scholar] [CrossRef] [PubMed] [Green Version]
- Munday, P.L.; Dixson, D.L.; Donelson, J.M.; Jones, G.P.; Pratchett, M.S.; Devitsina, G.V.; Døving, K.B. Ocean acidification impairs olfactory discrimination and homing ability of a marine fish. Proc. Natl. Acad. Sci. USA 2009, 106, 1848–1852. [Google Scholar] [CrossRef] [PubMed] [Green Version]
- Nilsson, G.E.; Dixson, D.L.; Domenici, P.; McCormick, M.I.; Sorensen, C.; Watson, S.-A.; Munday, P.L. Near-future carbon dioxide levels alter fish behaviour by interfering with neurotransmitter function. Nat. Clim. Chang. 2012, 2, 201–204. [Google Scholar] [CrossRef]
- Frommel, A.Y.; Schubert, A.; Piatkowski, U.; Clemmesen, C. Egg and early larval stages of baltic cod, Gadus morhua, are robust to high levels of ocean acidification. Mar. Biol. 2013, 160, 1825–1834. [Google Scholar] [CrossRef]
- Lonthair, J.; Ern, R.; Esbaugh, A.J. The early life stages of an estuarine fish, the red drum (Sciaenops ocellatus), are tolerant to high pCO2. ICES J. Mar. Sci. 2017, 74, 1042–1050. [Google Scholar] [CrossRef]
- Hurst, T.P.; Fernandez, E.R.; Mathis, J.T. Effects of ocean acidification on hatch size and larval growth of walleye pollock (Theragra chalcogramma). ICES J. Mar. Sci. 2013, 70, 812–822. [Google Scholar] [CrossRef]
- Franke, A.; Clemmesen, C. Effect of ocean acidification on early life stages of Atlantic herring (Clupea harengus L.). Biogeosciences 2011, 8, 3697–3707. [Google Scholar] [CrossRef] [Green Version]
- Crespel, A.; Zambonino-Infante, J.-L.; Mazurais, D.; Koumoundouros, G.; Fragkoulis, S.; Quazuguel, P.; Huelvan, C.; Madec, L.; Servili, A.; Claireaux, G. The development of contemporary European sea bass larvae (Dicentrarchus labrax) is not affected by projected ocean acidification scenarios. Mar. Biol. 2017, 164, 155. [Google Scholar] [CrossRef] [PubMed]
- Cattano, C.; Claudet, J.; Domenici, P.; Milazzo, M. Living in a high CO2 world: A global meta-analysis shows multiple trait-mediated responses of fish to ocean acidification. Ecol. Monogr. 2018. [Google Scholar] [CrossRef]
- Vargas, C.A.; Lagos, N.A.; Lardies, M.A.; Duarte, C.; Manríquez, P.H.; Aguilera, V.M.; Broitman, B.; Widdicombe, S.; Dupont, S. Species-specific responses to ocean acidification should account for local adaptation and adaptive plasticity. Nat. Ecol. Evol. 2017, 1, 0084. [Google Scholar] [CrossRef] [PubMed] [Green Version]
- Riebesell, U.; Fabry, V.J.; Hansson, L.; Gattuso, J.-P. Guide to Best Practices for Ocean Acidification Research and Data Reporting; Publications Office of the European Union Luxembourg: Luxembourg, 2010; Volume 260. [Google Scholar]
- Hofmann, G.; Evans, T.; Kelly, M.; Padilla-Gamiño, J.; Blanchette, C.; Washburn, L.; Chan, F.; McManus, M.; Menge, B.; Gaylord, B. Exploring local adaptation and the ocean acidification seascape–studies in the california current large marine ecosystem. Biogeosciences 2014, 11, 1053–1064. [Google Scholar] [CrossRef] [Green Version]
- Pespeni, M.; Chan, F.; Menge, B.; Palumbi, S. Signs of adaptation to local pH conditions across an environmental mosaic in the California current ecosystem. Integr. Comp. Biol. 2013, 53, 857–870. [Google Scholar] [CrossRef] [PubMed]
- Maas, A.E.; Wishner, K.F.; Seibel, B.A. The metabolic response of pteropods to acidification reflects natural CO2-exposure in oxygen minimum zones. Biogeosciences 2012, 9, 747–757. [Google Scholar] [CrossRef]
- Feely, R.A.; Sabine, C.L.; Hernandez-Ayon, J.M.; Ianson, D.; Hales, B. Evidence for upwelling of corrosive" acidified" water onto the continental shelf. Science 2008, 320, 1490–1492. [Google Scholar] [CrossRef] [PubMed]
- Salisbury, J.; Green, M.; Hunt, C.; Campbell, J. Coastal acidification by rivers: A threat to shellfish? Eos Trans. Am. Geophys. Union 2008, 89, 513. [Google Scholar] [CrossRef]
- Wallace, R.B.; Baumann, H.; Grear, J.S.; Aller, R.C.; Gobler, C.J. Coastal ocean acidification: The other eutrophication problem. Estuar. Coast. Shelf Sci. 2014, 148, 1–13. [Google Scholar] [CrossRef]
- Paulmier, A.; Ruiz-Pino, D.; Garçon, V. CO2 maximum in the oxygen minimum zone (OMZ). Biogeosciences 2011, 8, 239–252. [Google Scholar] [CrossRef]
- Baumann, H.; Wallace, R.; Tagliaferri, T.; Gobler, C. Large natural pH, CO2 and O2 fluctuations in a temperate tidal salt marsh on diel, seasonal, and interannual time scales. Estuar. Coasts 2015, 38, 220–231. [Google Scholar] [CrossRef]
- Baumann, H.; Smith, E.M. Quantifying metabolically driven pH and oxygen fluctuations in us nearshore habitats at diel to interannual time scales. Estuar. Coasts 2018, 41, 1102–1117. [Google Scholar] [CrossRef]
- Bopp, L.; Resplandy, L.; Orr, J.; Doney, S.; Dunne, J.; Gehlen, M.; Halloran, P.; Heinze, C.; Ilyina, T.; Séférian, R. Multiple stressors of ocean ecosystems in the 21st century: Projections with CMIP5 models. Biogeosciences 2013, 10, 3627–3676. [Google Scholar] [CrossRef]
- Pörtner, H.-O. Integrating climate-related stressor effects on marine organisms: Unifying principles linking molecule to ecosystem-level changes. Mar. Ecol. Prog. Ser. 2012, 470, 273–290. [Google Scholar] [CrossRef]
- Perry, A.L.; Low, P.J.; Ellis, J.R.; Reynolds, J.D. Climate change and distribution shifts in marine fishes. Science 2005, 308, 1912–1915. [Google Scholar] [CrossRef] [PubMed]
- Poloczanska, E.S.; Brown, C.J.; Sydeman, W.J.; Kiessling, W.; Schoeman, D.S.; Moore, P.J.; Brander, K.; Bruno, J.F.; Buckley, L.B.; Burrows, M.T.; et al. Global imprint of climate change on marine life. Nat. Clim. Chang. 2013, 3, 919–925. [Google Scholar] [CrossRef] [Green Version]
- Pörtner, H.-O. Climate variations and the physiological basis of temperature dependent biogeography: Systemic to molecular hierarchy of thermal tolerance in animals. Comp. Biochem. Physiol. Part A Mol. Integr. Physiol. 2002, 132, 739–761. [Google Scholar] [CrossRef]
- Pörtner, H.O.; Knust, R. Climate change affects marine fishes through the oxygen limitation of thermal tolerance. Science 2007, 315, 95–97. [Google Scholar] [CrossRef] [PubMed]
- Heuer, R.M.; Grosell, M. Elevated CO2 increases energetic cost and ion movement in the marine fish intestine. Sci. Rep. 2016, 6, 34480. [Google Scholar] [CrossRef] [PubMed]
- Pörtner, H.O.; Langenbuch, M.; Michaelidis, B. Synergistic effects of temperature extremes, hypoxia, and increases in CO2 on marine animals: From earth history to global change. J. Geophys. Res. Oceans 2005, 110. [Google Scholar] [CrossRef]
- Pörtner, H.O.; Farrell, A.P. Physiology and climate change. Science 2008, 322, 690–692. [Google Scholar] [CrossRef] [PubMed]
- Strobel, A.; Bennecke, S.; Leo, E.; Mintenbeck, K.; Pörtner, H.O.; Mark, F.C. Metabolic shifts in the antarctic fish Notothenia rossii in response to rising temperature and pCO2. Front. Zool. 2012, 9, 28. [Google Scholar] [CrossRef] [PubMed] [Green Version]
- Enzor, L.A.; Zippay, M.L.; Place, S.P. High latitude fish in a high CO2 world: Synergistic effects of elevated temperature and carbon dioxide on the metabolic rates of Antarctic notothenioids. Comp. Biochem. Physiol. Part A Mol. Integr. Physiol. 2013, 164, 154–161. [Google Scholar] [CrossRef] [PubMed]
- Flynn, E.E.; Bjelde, B.E.; Miller, N.A.; Todgham, A.E. Ocean acidification exerts negative effects during warming conditions in a developing antarctic fish. Conserv. Physiol. 2015, 3, cov033. [Google Scholar] [CrossRef] [PubMed]
- Davis, B.E.; Flynn, E.E.; Miller, N.A.; Nelson, F.A.; Fangue, N.A.; Todgham, A.E. Antarctic emerald rockcod have the capacity to compensate for warming when uncoupled from CO2-acidification. Glob. Chang. Biol. 2018, 24, e655–e670. [Google Scholar] [CrossRef] [PubMed]
- Leo, E.; Kunz, K.L.; Schmidt, M.; Storch, D.; Pörtner, H.-O.; Mark, F.C. Mitochondrial acclimation potential to ocean acidification and warming of polar cod (Boreogadus saida) and Atlantic cod (Gadus morhua). Front. Zool. 2017, 14, 21. [Google Scholar] [CrossRef] [PubMed]
- Munday, P.L.; Crawley, N.E.; Nilsson, G.E. Interacting effects of elevated temperature and ocean acidification on the aerobic performance of coral reef fishes. Mar. Ecol. Prog. Ser. 2009, 388, 235–242. [Google Scholar] [CrossRef] [Green Version]
- Nowicki, J.P.; Miller, G.M.; Munday, P.L. Interactive effects of elevated temperature and CO2 on foraging behavior of juvenile coral reef fish. J. Exp. Mar. Biol. Ecol. 2012, 412, 46–51. [Google Scholar] [CrossRef]
- Bignami, S.; Sponaugle, S.; Hauff, M.; Cowen, R.K.; Browman, H.e.H. Combined effects of elevated pCO2, temperature, and starvation stress on larvae of a large tropical marine fish. ICES J. Mar. Sci. 2016, 74, 1220–1229. [Google Scholar]
- Domenici, P.; Allan, B.J.; Watson, S.-A.; McCormick, M.I.; Munday, P.L. Shifting from right to left: The combined effect of elevated CO2 and temperature on behavioural lateralization in a coral reef fish. PLoS ONE 2014, 9, e87969. [Google Scholar] [CrossRef] [PubMed]
- Tewksbury, J.J.; Huey, R.B.; Deutsch, C.A. Putting the heat on tropical animals. Sci. N. Y. Wash. 2008, 320, 1296. [Google Scholar] [CrossRef] [PubMed]
- Peck, L. Prospects for survival in the southern ocean: Vulnerability of benthic species to temperature change. Antarct. Sci. 2005, 17, 497–507. [Google Scholar] [CrossRef]
- Pörtner, H.-O.; Peck, M. Climate change effects on fishes and fisheries: Towards a cause-and-effect understanding. J. Fish Biol. 2010, 77, 1745–1779. [Google Scholar] [CrossRef] [PubMed]
- Snyder, J.T.; Murray, C.S.; Baumann, H. Potential for maternal effects on offspring CO2 sensitivities in the Atlantic silverside (Menidia menidia). J. Exp. Mar. Biol. Ecol. 2018, 499, 1–8. [Google Scholar] [CrossRef]
- Gobler, C.J.; Merlo, L.R.; Morell, B.K.; Griffith, A.W. Temperature, acidification, and food supply interact to negatively affect the growth and survival of the forage fish, Menidia beryllina (Inland silverside) and Cyprinodon variegatus (Sheepshead minnow). Front. Mar. Sci. 2018, 5, 86. [Google Scholar] [CrossRef]
- Middaugh, D.P.; Hemmer, M.J.; Goodman, L. Methods for Spawning, Culturing and Conducting Toxicity-Tests with Early Life Stages of four Atherinid Fishes: The Inland Silverside,' Menidia beryllina, Atlantic silverside, M. menidia, Tidewater silverside, M. peninsulae and California grunion, Leuresthes tenuis; EPA: Gulf Breeze, FL, USA, 1987.
- Murray, C.S.; Malvezzi, A.; Gobler, C.J.; Baumann, H. Offspring sensitivity to ocean acidification changes seasonally in a coastal marine fish. Mar. Ecol. Prog. Ser. 2014, 504, 1–11. [Google Scholar] [CrossRef] [Green Version]
- Murray, C.S.; Fuiman, L.A.; Baumann, H. Consequences of elevated CO2 exposure across multiple life stages in a coastal forage fish. ICES J. Mar. Sci. 2017, 74, 1051–1061. [Google Scholar]
- Malvezzi, A.J.; Murray, C.S.; Feldheim, K.A.; DiBattista, J.D.; Garant, D.; Gobler, C.J.; Chapman, D.D.; Baumann, H. A quantitative genetic approach to assess the evolutionary potential of a coastal marine fish to ocean acidification. Evol. Appl. 2015, 8, 352–362. [Google Scholar] [CrossRef] [PubMed]
- De Pasquale, E.; Baumann, H.; Gobler, C.J. Vulnerability of early life stage northwest atlantic forage fish to ocean acidification and low oxygen. Mar. Ecol. Prog. Ser. 2015, 523, 145–156. [Google Scholar] [CrossRef]
- Lopes, A.F.; Morais, P.; Pimentel, M.; Rosa, R.; Munday, P.L.; Gonçalves, E.J.; Faria, A.M. Behavioural lateralization and shoaling cohesion of fish larvae altered under ocean acidification. Mar. Biol. 2016, 163, 243. [Google Scholar] [CrossRef]
- Miller, S.H.; Breitburg, D.L.; Burrell, R.B.; Keppel, A.G. Acidification increases sensitivity to hypoxia in important forage fishes. Mar. Ecol. Prog. Ser. 2016, 549, 1–8. [Google Scholar] [CrossRef] [Green Version]
- Caldeira, K.; Wickett, M.E. Ocean model predictions of chemistry changes from carbon dioxide emissions to the atmosphere and ocean. J. Geophys. Res. 2005, 110, C09S04. [Google Scholar] [CrossRef]
- Stocker, T.F.; Qin, D.; Plattner, G.-K.; Tignor, M.; Allen, S.K.; Boschung, J.; Nauels, A.; Xia, Y.; Bex, V.; Midgley, P.M. Climate Change 2013: The Physical Science Basis; Cambridge University Press: Cambridge, UK; New York, NY, USA, 2014. [Google Scholar]
- Mehrbach, C.; Culberson, C.H.; Hawley, J.E.; Pytkowicx, R.M. Measurements of the apparent dissociation constants of carbonic acid in seawater at atmospheric pressure. Limnol. Oceanogr. 1973, 18, 897–907. [Google Scholar] [CrossRef]
- Dickson, A.; Millero, F. A comparison of the equilibrium constants for the dissociation of carbonic acid in seawater media. Deep Sea Res. Part A Oceanogr. Res. Pap. 1987, 34, 1733–1743. [Google Scholar] [CrossRef]
- Dickson, A.G. Standard potential of the reaction: AgCl(s) + 12H2(g) = Ag(s) + HCl(aq), and and the standard acidity constant of the ion HSO4− in synthetic sea water from 273.15 to 318.15 K. J. Chem. Thermodyn. 1990, 22, 113–127. [Google Scholar] [CrossRef]
- Warton, D.I.; Hui, F.K. The arcsine is asinine: The analysis of proportions in ecology. Ecology 2011, 92, 3–10. [Google Scholar] [CrossRef] [PubMed]
- Grubbs, F.E. Procedures for detecting outlying observations in samples. Technometrics 1969, 11, 53. [Google Scholar] [CrossRef]
- Hedges, L.V.; Gurevitch, J.; Curtis, P.S. The meta-analysis of response ratios in experimental ecology. Ecology 1999, 80, 1150–1156. [Google Scholar] [CrossRef]
- Conover, D.O.; Ross, M.R. Patterns in seasonal abundance, growth and biomass of the Atlantic silverside, Menidia menidia, in a New England estuary. Estuaries 1982, 5, 275–286. [Google Scholar] [CrossRef]
- Salinas, S.; Brown, S.C.; Marc, M.; Munch, S.B. Non-genetic inheritance and changing environments. Non Genet. Inherit. 2013, 1, 38–50. [Google Scholar] [CrossRef]
- Conover, D.O. Local adaptation in marine fishes: Evidence and implications for stock enhancement. Bull. Mar. Sci. 1998, 62, 477–493. [Google Scholar]
- Clarke, L.M.; Munch, S.B.; Thorrold, S.R.; Conover, D.O. High connectivity among locally adapted populations of a marine fish (Menidia menidia). Ecology 2010, 91, 3526–3537. [Google Scholar] [CrossRef] [PubMed]
- Pörtner, H.O. Ecosystem effects of ocean acidification in times of ocean warming: A physiologist’s view. Mar. Ecol. Prog. Ser. 2008, 373, 203–217. [Google Scholar] [CrossRef]
- Dahlke, F.T.; Leo, E.; Mark, F.C.; Pörtner, H.O.; Bickmeyer, U.; Frickenhaus, S.; Storch, D. Effects of ocean acidification increase embryonic sensitivity to thermal extremes in Atlantic cod, Gadus morhua. Glob. Chang. Biol. 2017, 23, 1499–1510. [Google Scholar] [CrossRef] [PubMed]
- Rombough, P. The energetics of embryonic growth. Respir. Physiol. Neurobiol. 2011, 178, 22–29. [Google Scholar] [CrossRef] [PubMed]
- Somero, G. The physiology of climate change: How potentials for acclimatization and genetic adaptation will determine ‘winners’ and ‘losers’. J. Exp. Biol. 2010, 213, 912–920. [Google Scholar] [CrossRef] [PubMed]
- Reusch, T.B. Climate change in the oceans: Evolutionary versus phenotypically plastic responses of marine animals and plants. Evolut. Appl. 2014, 7, 104–122. [Google Scholar] [CrossRef] [PubMed] [Green Version]
- Melzner, F.; Thomsen, J.; Koeve, W.; Oschlies, A.; Gutowska, M.; Bange, H.; Hansen, H.; Körtzinger, A. Future ocean acidification will be amplified by hypoxia in coastal habitats. Mar. Biol. 2013, 160, 1875–1888. [Google Scholar] [CrossRef]
- Gobler, C.J.; Baumann, H. Hypoxia and acidification in ocean ecosystems: Coupled dynamics and effects on marine life. Biol. Lett. 2016, 12, 20150976. [Google Scholar] [CrossRef] [PubMed]
- Esbaugh, A.J.; Ern, R.; Nordi, W.M.; Johnson, A.S. Respiratory plasticity is insufficient to alleviate blood acid–base disturbances after acclimation to ocean acidification in the estuarine red drum, Sciaenops ocellatus. J. Comp. Physiol. B 2016, 186, 97–109. [Google Scholar] [CrossRef] [PubMed]
- Baumann, H.; Parks, E.; Murray, C.S. Starvation rates in larval and juvenile Atlantic silversides (Menidia menidia) are unaffected by high CO2 conditions. Mar. Biol. 2018, 165, 75. [Google Scholar] [CrossRef]
- Pechenik, J.A. Larval experience and latent effects—Metamorphosis is not a new beginning. Integr. Comp. Biol. 2006, 46, 323–333. [Google Scholar] [CrossRef] [PubMed]
- Schultz, E.T.; Conover, D.O.; Ehtisham, A. The dead of winter: Size-dependent variation and genetic differences in seasonal mortality among Atlantic silverside (Atherinidae: Menidia menidia) from different latitudes. Can. J. Fish. Aquat. Sci. 1998, 55, 1149–1157. [Google Scholar] [CrossRef]
- Kroeker, K.J.; Kordas, R.L.; Crim, R.; Hendriks, I.E.; Ramajo, L.; Singh, G.S.; Duarte, C.M.; Gattuso, J.-P. Impacts of ocean acidification on marine organisms: Quantifying sensitivities and interaction with warming. Glob. Chang. Biol. 2013, 19, 1884–1896. [Google Scholar] [CrossRef] [PubMed]
- Green, B.S. Maternal effects in fish populations. Adv. Mar. Biol. 2008, 54, 1–105. [Google Scholar] [PubMed]
- Hoffmann, A.A.; Sgrò, C.M. Climate change and evolutionary adaptation. Nature 2011, 470, 479–485. [Google Scholar] [CrossRef] [PubMed]
- Lefevre, S. Are global warming and ocean acidification conspiring against marine ectotherms? A meta-analysis of the respiratory effects of elevated temperature, high CO2 and their interaction. Conserv. Physiol. 2016, 4, cow009. [Google Scholar] [CrossRef] [PubMed]
Figure 1.
Average mean (+/−minimum/maximum) monthly temperature and pH conditions during the spawning and growing season of Atlantic silversides in (A) Flax Pond, Long Island, New York and (B) Mumford Cove, Connecticut. The sites provided wild spawners for experiment 1 (A) and experiments 2–5 (B). Long-term averages were derived from monitoring data collected in 15 min intervals by (A) USGS station #01304057 between 2008 and 2018 and (B) the Baumann lab in Mumford Cove between 2015–2018.

Figure 2.
M. menidia. Offspring responses to control (blue), high (red), and extreme (green) CO2 conditions at four temperatures across five CO2 × temperature factorial experiments. Traits include embryo survival (A–E), hatch length (F–I), larval survival (J–N) and larval growth rate (O–R). Individual replicates are represented by small faded circles. Treatment means (±SD) are depicted by large, bold circles and connected by dotted lines. Note: different scales used for hatch length measurements due to differences in sample timing; panels F and G use 1dph length Y axis (left) while panels H and I use hatch length Y axis (right).

Figure 3.
M. menidia. CO2 effect sizes using log-transformed response ratios (lnRR) of high (light grey) and extreme (dark grey) CO2 exposure across four rearing temperatures. Response traits include embryo survival (A,B), hatch length (C,D), larval survival (E,F), and growth rate (G,H). Circles represent lnRRs of each experiment, while black lines represent lnRRs averaged across experiments at each rearing temperature. Negative (positive) values indicate a trait decrease (increase) at elevated CO2 levels compared to control CO2 conditions.


Table 1.
Summary of five CO2 × temperature experiments on M. menidia offspring. Treatment levels for pCO2 (µatm) and temperature (°C) represent target conditions, actual measured values are presented in Table 2. Trait are abbreviated as embryo survival (ES), hatch length (HL), larval survival (LS), and growth rate (GR).
| Target Treatment Levels | |||||
|---|---|---|---|---|---|
| Exp Num | Fertilization Date | pCO2 | Temp | Number of Replicates | Measured Traits |
| 1 | 5/5/2014 | 400, 2200, 6000 | 17, 24 | 5 | ES, LS |
| 2 | 4/22/2016 | 400, 2200 | 17, 24 | 5 | ES, HL, LS, GR |
| 3 | 5/19/2016 | 400, 2200, 4000 | 17, 20, 24 | 5 | ES, HL, LS, GR |
| 4 | 4/28/2017 | 400, 2200 | 24, 28 | 3 | ES, HL, LS, GR |
| 5 | 5/26/2017 | 400, 2200, 4000 | 24, 28 | 5 | ES, HL, LS, GR |
Table 2.
Mean (±SD) pH and temperature (°C) from daily measurements. Mean (±SD) salinity, total alkalinity (AT; μmol kg−1), dissolved inorganic carbon (CT; μmol kg−1), partial pressure of CO2 (pCO2; μatm), fugacity of CO2 (fCO2; μatm), and carbonate ion concentration (CO32−; μmol kg−1) measured from replicated seawater samples of each treatment. Salinity was measured via refractometer and AT from endpoint titrations. CT and pCO2, fCO2 and CO32− were calculated in CO2SYS.
| Exp Num | Target Temp | Measured Temp | Target pCO2 | Measured pH | Salinity | AT | CT | pCO2 | fCO2 | CO32− |
|---|---|---|---|---|---|---|---|---|---|---|
| 1 | 17 | 17.5 ± 0.1 | 400 | 8.24 ± 0.02 | 26 | 2514 ± 17 | 2302 ± 12 | 433 ± 29 | 431 ± 29 | 168 ± 8 |
| 17.5 ± 0.1 | 2200 | 7.49 ± 0.05 | 26 | 2539 ± 22 | 2581 ± 5 | 2564 ± 94 | 2556 ± 94 | 38 ± 1 | ||
| 17.5 ± 0.1 | 6000 | 7.14 ± 0.05 | 26 | 2492 ± 33 | 2680 ± 11 | 5753 ± 277 | 6733 ± 276 | 17 ± 1 | ||
| 24 | 24.0 ± 0.2 | 400 | 8.20 ± 0.06 | 26 | 2501 ± 7 | 2258 ± 11 | 474 ± 27 | 472 ± 27 | 191 ± 7 | |
| 24.0 ± 0.2 | 2200 | 7.47 ± 0.05 | 26 | 2474 ± 81 | 2504 ± 8 | 2881 ± 172 | 2872 ± 172 | 42 ± 2 | ||
| 24.0 ± 0.2 | 6000 | 7.14 ± 0.05 | 26 | 2472 ± 49 | 2634 ± 13 | 6195 ± 378 | 6174 ± 378 | 20 ± 1 | ||
| 2 | 17 | 16.9 ± 0.3 | 400 | 8.17 ± 0.12 | 30 | 2038 ± 17 | 1851 ± 8 | 368 ± 18 | 367 ± 18 | 135 ± 6 |
| 16.9 ± 0.3 | 2200 | 7.49 ± 0.13 | 30 | 2031 ± 12 | 2058 ± 21 | 2037 ± 188 | 2030 ± 188 | 32 ± 2 | ||
| 24 | 23.5 ± 0.3 | 400 | 8.13 ± 0.09 | 30 | 204 ± 11 | 1838 ± 16 | 427 ± 29 | 426 ± 29 | 150 ± 7 | |
| 23.6 ± 0.3 | 2200 | 7.49 ± 0.12 | 30 | 2041 ± 11 | 2048 ± 7 | 2190 ± 277 | 2183 ± 276 | 5 ± 5 | ||
| 3 | 17 | 17.4 ± 0.2 | 400 | 8.22 ± 0.01 | 31 | 2054 ± 8 | 1838 ± 26 | 322 ± 12 | 321 ± 12 | 153 ± 2 |
| 17.6 ± 0.3 | 2200 | 7.51 ± 0.01 | 31 | 2047 ± 20 | 2066 ± 21 | 1952 ± 39 | 1945 ± 39 | 35 ± 1 | ||
| 17.4 ± 0.2 | 4200 | 7.20 ± 0.02 | 31 | 2053 ± 24 | 2174 ± 16 | 4056 ± 204 | 4042 ± 203 | 18 ± 1 | ||
| 20 | 19.7 ± 0.2 | 400 | 8.20 ± 0.02 | 31 | 2048 ± 29 | 1833 ± 3 | 345 ± 15 | 345 ± 15 | 160 ± 6 | |
| 19.6 ± 0.3 | 2200 | 7.51 ± 0.03 | 31 | 2031 ± 14 | 2039 ± 10 | 1964 ± 109 | 1957 ± 108 | 38 ± 2 | ||
| 19.7 ± 0.2 | 4200 | 7.21 ± 0.02 | 31 | 2058 ± 6 | 2153 ± 37 | 4066 ± 227 | 4063 ± 226 | 20 ± 1 | ||
| 24 | 23.7 ± 0.2 | 400 | 8.22 ± 0.02 | 31 | 2044 ± 9 | 1798 ± 8 | 331 ± 14 | 330 ± 14 | 185 ± 5 | |
| 23.7 ± 0.3 | 2200 | 7.49 ± 0.02 | 31 | 2048 ± 22 | 2050 ± 25 | 2157 ± 92 | 2151 ± 92 | 42 ± 1 | ||
| 23.6 ± 0.2 | 4200 | 7.20 ± 0.02 | 31 | 2059 ± 1 | 2140 ± 8 | 4339 ± 169 | 4325 ± 169 | 22 ± 1 | ||
| 4 | 24 | 23.6 ± 0.3 | 400 | 8.19 ± 0.03 | 31 | 2096 ± 63 | 1842 ± 64 | 368 ± 38 | 367 ± 38 | 180 ± 10 |
| 23.7 ± 0.3 | 2200 | 7.51 ± 0.03 | 31 | 2124 ± 51 | 2122 ± 44 | 2155 ± 83 | 2148 ± 82 | 45 ± 4 | ||
| 28 | 28.1 ± 0.2 | 400 | 8.22 ± 0.03 | 32 | 2164 ± 88 | 1860 ± 85 | 356 ± 35 | 355 ± 34 | 216 ± 11 | |
| 27.9 ± 0.4 | 2200 | 7.52 ± 0.03 | 32 | 2164 ± 117 | 2146 ± 113 | 2217 ± 134 | 2210 ± 133 | 54 ± 6 | ||
| 5 | 24 | 24.3 ± 0.4 | 400 | 8.19 ± 0.02 | 32 | 2137 ± 3 | 1897 ± 13 | 389 ± 23 | 388 ± 23 | 175 ± 8 |
| 24.1 ± 0.2 | 2200 | 7.50 ± 0.04 | 32 | 2151 ± 14 | 2156 ± 27 | 2265 ± 228 | 2258 ± 227 | 43 ± 4 | ||
| 24.2 ± 0.3 | 4200 | 7.21 ± 0.02 | 32 | 2130 ± 27 | 2230 ± 25 | 4432 ± 180 | 4418 ± 179 | 23 ± 1 | ||
| 28 | 28.2 ± 0.2 | 400 | 8.23 ± 0.02 | 32 | 2157 ± 24 | 1857 ± 29 | 350 ± 19 | 348 ± 19 | 215 ± 4 | |
| 28.1 ± 0.2 | 2200 | 7.48 ± 0.02 | 32 | 2176 ± 50 | 2172 ± 48 | 2439 ± 84 | 2431 ± 83 | 49 ± 2 | ||
| 28.2 ± 0.3 | 4200 | 7.20 ± 0.03 | 32 | 2155 ± 20 | 2244 ± 18 | 4720 ± 217 | 4714 ± 204 | 26 ± 1 |
Table 3.
Summary of all measured M. menidia response traits across five experiments; embryo survival (%), hatch length (mm), larval survival (%), and larval growth rate (mm d1−) epresented as treatments means ± SD. CO2 levels are shown as control (C), high (H), and extreme (E) (see Table 2 for values). Sample times are given as days post fertilization (dpf).
| Exp Num | Temp (°C) | Treatment CO2 | Days to First Hatch | Age at Hatch Sample (dpf) | Embryo Survival (%) | Hatch Length (mm) | Age at Larval Sample (dpf) | Larval Survival (%) | Growth Rate (mm d1−) |
|---|---|---|---|---|---|---|---|---|---|
| 1 | 17 | C | 13 | 14 | 68 ± 4 | 26 | 34 ± 9 | ||
| H | 13 | 14 | 74 ± 3 | 26 | 50 ± 22 | ||||
| E | 13 | 14 | 56 ± 6 | 26 | 43 ± 28 | ||||
| 24 | C | 6 | 7 | 65 ± 4 | 16 | 44 ± 10 | |||
| H | 6 | 7 | 65 ± 3 | 16 | 53 ± 13 | ||||
| E | 6 | 7 | 56 ± 8 | 16 | 37 ± 28 | ||||
| 2 | 17 | C | 13 | 15 | 92 ± 3 | 5.32 ± 0.05 | 30 | 21 ± 8 | 0.18 ± 0.03 |
| H | 13 | 15 | 87 ± 11 | 5.29 ± 0.05 | 30 | 11 ± 7 | 0.16 ± 0.04 | ||
| 24 | C | 6 | 7 | 88 ± 7 | 5.30 ± 0.14 | 16 | 32 ± 33 | 0.41 ± 0.05 | |
| H | 6 | 7 | 76 ± 6 | 5.35 ± 0.06 | 16 | 26 ± 7 | 0.40 ± 0.05 | ||
| 3 | 17 | C | 13 | 15 | 93 ± 5 | 5.37 ± 0.05 | 36 | 32 ± 8 | 0.21 ± 0.02 |
| H | 13 | 15 | 95 ± 5 | 5.42 ± 0.12 | 36 | 56 ± 21 | 0.20 ± 0.02 | ||
| E | 13 | 15 | 89 ± 6 | 5.42 ± 0.11 | 36 | 59 ± 14 | 0.19 ± 0.01 | ||
| 20 | C | 10 | 11 | 96 ± 5 | 5.55 ± 0.11 | 25 | 82 ± 10 | 0.33 ± 0.02 | |
| H | 10 | 11 | 95 ± 5 | 5.62 ± 0.09 | 25 | 77 ± 14 | 0.32 ± 0.02 | ||
| E | 10 | 11 | 94 ± 7 | 5.42 ± 0.08 | 25 | 75 ± 22 | 0.33 ± 0.03 | ||
| 24 | C | 6 | 7 | 95 ± 5 | 5.51 ± 0.09 | 16 | 72 ± 8 | 0.37 ± 0.02 | |
| H | 6 | 7 | 95 ± 6 | 5.32 ± 0.05 | 16 | 74 ± 9 | 0.35 ± 0.03 | ||
| E | 6 | 7 | 92 ± 9 | 5.22 ± 0.11 | 16 | 69 ± 14 | 0.37 ± 0.05 | ||
| 4 | 24 | C | 6 | 6 | 62 ± 9 | 4.98 ± 0.07 | 16 | 33 ± 10 | 0.33 ± 0.04 |
| H | 6 | 6 | 51 ± 7 | 4.98 ± 0.10 | 16 | 36 ± 32 | 0.33 ± 0.01 | ||
| 28 | C | 5 | 5 | 46 ± 5 | 4.76 ± 0.04 | 14 | 31 ± 35 | 0.48 ± 0.09 | |
| H | 5 | 5 | 49 ± 3 | 4.62 ± 0.09 | 14 | 40 ± 27 | 0.44 ± 0.08 | ||
| 5 | 24 | C | 6 | 6 | 74 ± 13 | 4.78 ± 0.07 | 16 | 41 ± 27 | 0.33 ± 0.06 |
| H | 6 | 6 | 83 ± 12 | 4.90 ± 0.16 | 16 | 37 ± 20 | 0.36 ± 0.05 | ||
| E | 6 | 6 | 55 ± 3 | 4.83 ± 0.10 | 16 | 29 ± 28 | 0.33 ± 0.05 | ||
| 28 | C | 5 | 5 | 80 ± 13 | 4.54 ± 0.10 | 14 | 14 ± 7 | 0.40 ± 0.04 | |
| H | 5 | 5 | 67 ± 9 | 4.69 ± 0.10 | 14 | 14 ± 9 | 0.42 ± 0.03 | ||
| E | 5 | 5 | 72 ± 13 | 4.70 ± 0.05 | 14 | 9 ± 6 | 0.38 ± 0.08 |
Table 4.
Summary statistics for linear mixed models testing the effects of CO2, temperature and their interaction (fixed factors) and experiment (random factor) on four response traits; embryo survival (ES), hatch length (HL), larval survival (LS), and growth rate (GR) of M. menidia offspring. Significant (α < 0.05) factors are denoted by p-values in bold.
| Trait | Factor | F | df | p |
|---|---|---|---|---|
| ES | CO2 | 2.992 | 2 | 0.058 |
| Temp | 1.140 | 3 | 0.336 | |
| CO2 × Temp | 0.677 | 6 | 0.669 | |
| Experiment | 33.581 | 4 | <0.001 | |
| HL | CO2 | 1.895 | 2 | 0.156 |
| Temp | 19.518 | 3 | <0.001 | |
| CO2 × Temp | 3.021 | 6 | 0.010 | |
| Experiment | 75.361 | 3 | <0.001 | |
| LS | CO2 | 0.296 | 2 | 0.756 |
| Temp | 9.429 | 3 | <0.001 | |
| CO2 × Temp | 0.759 | 6 | 0.614 | |
| Experiment | 12.385 | 4 | <0.001 | |
| GR | CO2 | 0.457 | 2 | 0.595 |
| Temp | 77.964 | 3 | <0.001 | |
| CO2 ×Temp | 0.515 | 6 | 0.838 | |
| Experiment | 3.330 | 3 | 0.012 |
© 2018 by the authors. Licensee MDPI, Basel, Switzerland. This article is an open access article distributed under the terms and conditions of the Creative Commons Attribution (CC BY) license (http://creativecommons.org/licenses/by/4.0/).
Share and Cite
MDPI and ACS Style
Murray, C.S.; Baumann, H. You Better Repeat It: Complex CO2 × Temperature Effects in Atlantic Silverside Offspring Revealed by Serial Experimentation. Diversity 2018, 10, 69. https://doi.org/10.3390/d10030069
AMA Style
Murray CS, Baumann H. You Better Repeat It: Complex CO2 × Temperature Effects in Atlantic Silverside Offspring Revealed by Serial Experimentation. Diversity. 2018; 10(3):69. https://doi.org/10.3390/d10030069
Chicago/Turabian StyleMurray, Christopher S., and Hannes Baumann. 2018. "You Better Repeat It: Complex CO2 × Temperature Effects in Atlantic Silverside Offspring Revealed by Serial Experimentation" Diversity 10, no. 3: 69. https://doi.org/10.3390/d10030069
Note that from the first issue of 2016, this journal uses article numbers instead of page numbers. See further details here.