Carbon Emissions of Hotels: The Case of the Sri Lankan Hotel Industry


1
Department of Building and Real Estate, The Hong Kong Polytechnic University, Hung Hom, Hong Kong 999077, China
2
School of Architecture and Built Environment, Deakin University, Geelong, VIC 3220, Australia
*
Author to whom correspondence should be addressed.
Buildings 2019, 9(11), 227; https://doi.org/10.3390/buildings9110227
Submission received: 16 July 2019
/
Revised: 15 October 2019
/
Accepted: 20 October 2019
/
Published: 30 October 2019
(This article belongs to the Special Issue Sustainable Development of Buildings: Design, Construction, Quality Inspection, Operation Management)
Abstract
:The need to mitigate climate change has become a major global concern, and greenhouse gas emissions are a major cause of global climate change. Therefore, the need to curb greenhouse gas emissions has been well recognized by global researchers, policymakers and academics. Carbon emissions of hotel operations have seized the attention of global researchers. However, carbon emissions of the hotels in developing countries remain to be a less explored domain. Therefore, carbon emissions of Sri Lankan hotels were explored using a case study approach. Five hotels in the Colombo suburb were explored, which revealed that each hotel released more than 7000 tons of carbon annually. Results further indicated the use of purchased electricity as the dominant source of carbon emissions. Emissions caused by transport activities were not included in the calculations due to the unavailability of data. Recommendations were made to overcome the issues identified during data collection as well as to reduce the carbon emissions from hotel operations. Wider adoption of the methodology used in this research will benefit the hotels to keep track of the carbon emissions using a systematic approach.
1. Introduction
According to United Nations World Tourism Organization [UNWTO] [1], international tourists have increased from 25 million to 1087 million during the period between 1950 and 2013. As a result, the economic impact of the tourism industry has also increased, i.e., to 9% of global GDP [1]. When considering the Sri Lankan context, tourist arrivals increased over 1 million in 2012, and is expected to increase even further [2]. Moreover, the number of hotels in the country has increased significantly. Under these circumstances, Fernando [2] has claimed that the tourism industry will account for 3.7% of the total Sri Lankan GDP by 2024. Simultaneously, the tourism industry has created several negative environmental impacts such as waste generation and carbon emissions. In particular, the hotel sector has been recognized as a key contributor to GHG emissions. Emissions caused by the hotels have gone unnoticed due to the unavailability of a proper reporting mechanism of carbon emissions [3]. Ricaurte [3] further indicated that GHG emission reporting as the initiative of a sustainable approach [4]. Therefore, it is evident that the hotel industry needs a proper GHG emission reporting mechanism that can be used universally.
The US Energy Information Administration [5] has recognized food service, inpatient hospital and food sales as the most energy demanding buildings. Lodging is listed as the 5th most energy demanding. Hotels, a combination of food service, food sales and lodging therefore can be recognized as a major contributor to global climate change due to the high level of carbon emissions resulting from high energy contribution. Chan and Lam [6] indicated that the predicted amount of carbon emissions due to energy use in the hotel industry is significant, and Lai, et al. [7] indicated that due to the unavailability of a proper method to determine the carbon emissions from hotels, the facilities managers and other professionals have been unable to identify their contribution to GHG emissions. Accordingly, global accommodation providers have initiated the process of recording their carbon emissions in different formats. However, due to the unavailability of a widely adopted method, this process has slowed down considerably [3]. Ricaurte [3] further claimed that “The need for a uniform carbon footprint calculation method of a hotel is paramount, yet it is not the only sustainability performance metric”. However, with sustainability becoming a major concern among the stakeholders, and carbon emission reporting considered as the initiative of achieving sustainability, carbon emission reporting is considered as an important function of a hotel operation [3].
Reduction of carbon emissions has become an urgent need, and with tourism industry creating a significant impact on global carbon emissions, it is the appropriate time to assess tourism-related carbon emissions using standard methods and to take necessary steps to mitigate the emissions (them). In order to establish carbon mitigation strategies, it is necessary to quantify them properly. Despite the availability of several guidelines and methods to quantify carbon emissions, none of them provide a distinctive approach to quantify the emissions of the hotel sector. Therefore, it has become a necessity to develop a basis to implement such a guideline for the hotel sector. Moreover, developing countries remain the least explored territories for carbon emissions, and the situation is similar for the Sri Lankan context. Therefore, the purpose of this study is to explore the carbon emissions of Sri Lankan hotels and thereby develop an outline to prepare a standard emission reporting guideline.
2. Literature Review
A comprehensive literature survey was conducted to identify the existing practices of carbon emission reporting around the world. This review will establish the importance of having a proper carbon emission reporting method, not only for the hotel industry, but also for many other industries.
The Indian Network for Climate Change Assessment [INCCA] [8] has classified power generation (energy), industrial and commercial activities, and agricultural activities, activities related to land use and land changes and waste handling as the main contributors to GHG emissions reported in the Indian context. The US Greenhouse gas inventory of the US Environmental Protection Agency [USEPA] [9] has indicated a similar classification, and the European Environment Agency [EEA] [10] has indicated a similar classification with an addition, solvent and other product use. Based on the literature, the following six categories indicated by the Intergovernmental Panel on Climate Change [IPCC] [11] can be recognized as the key carbon emission sources.
- Agriculture, Forestry and Other Land Use (AFOLU)
- Industry
- Transport
- Buildings
- Energy
- Waste
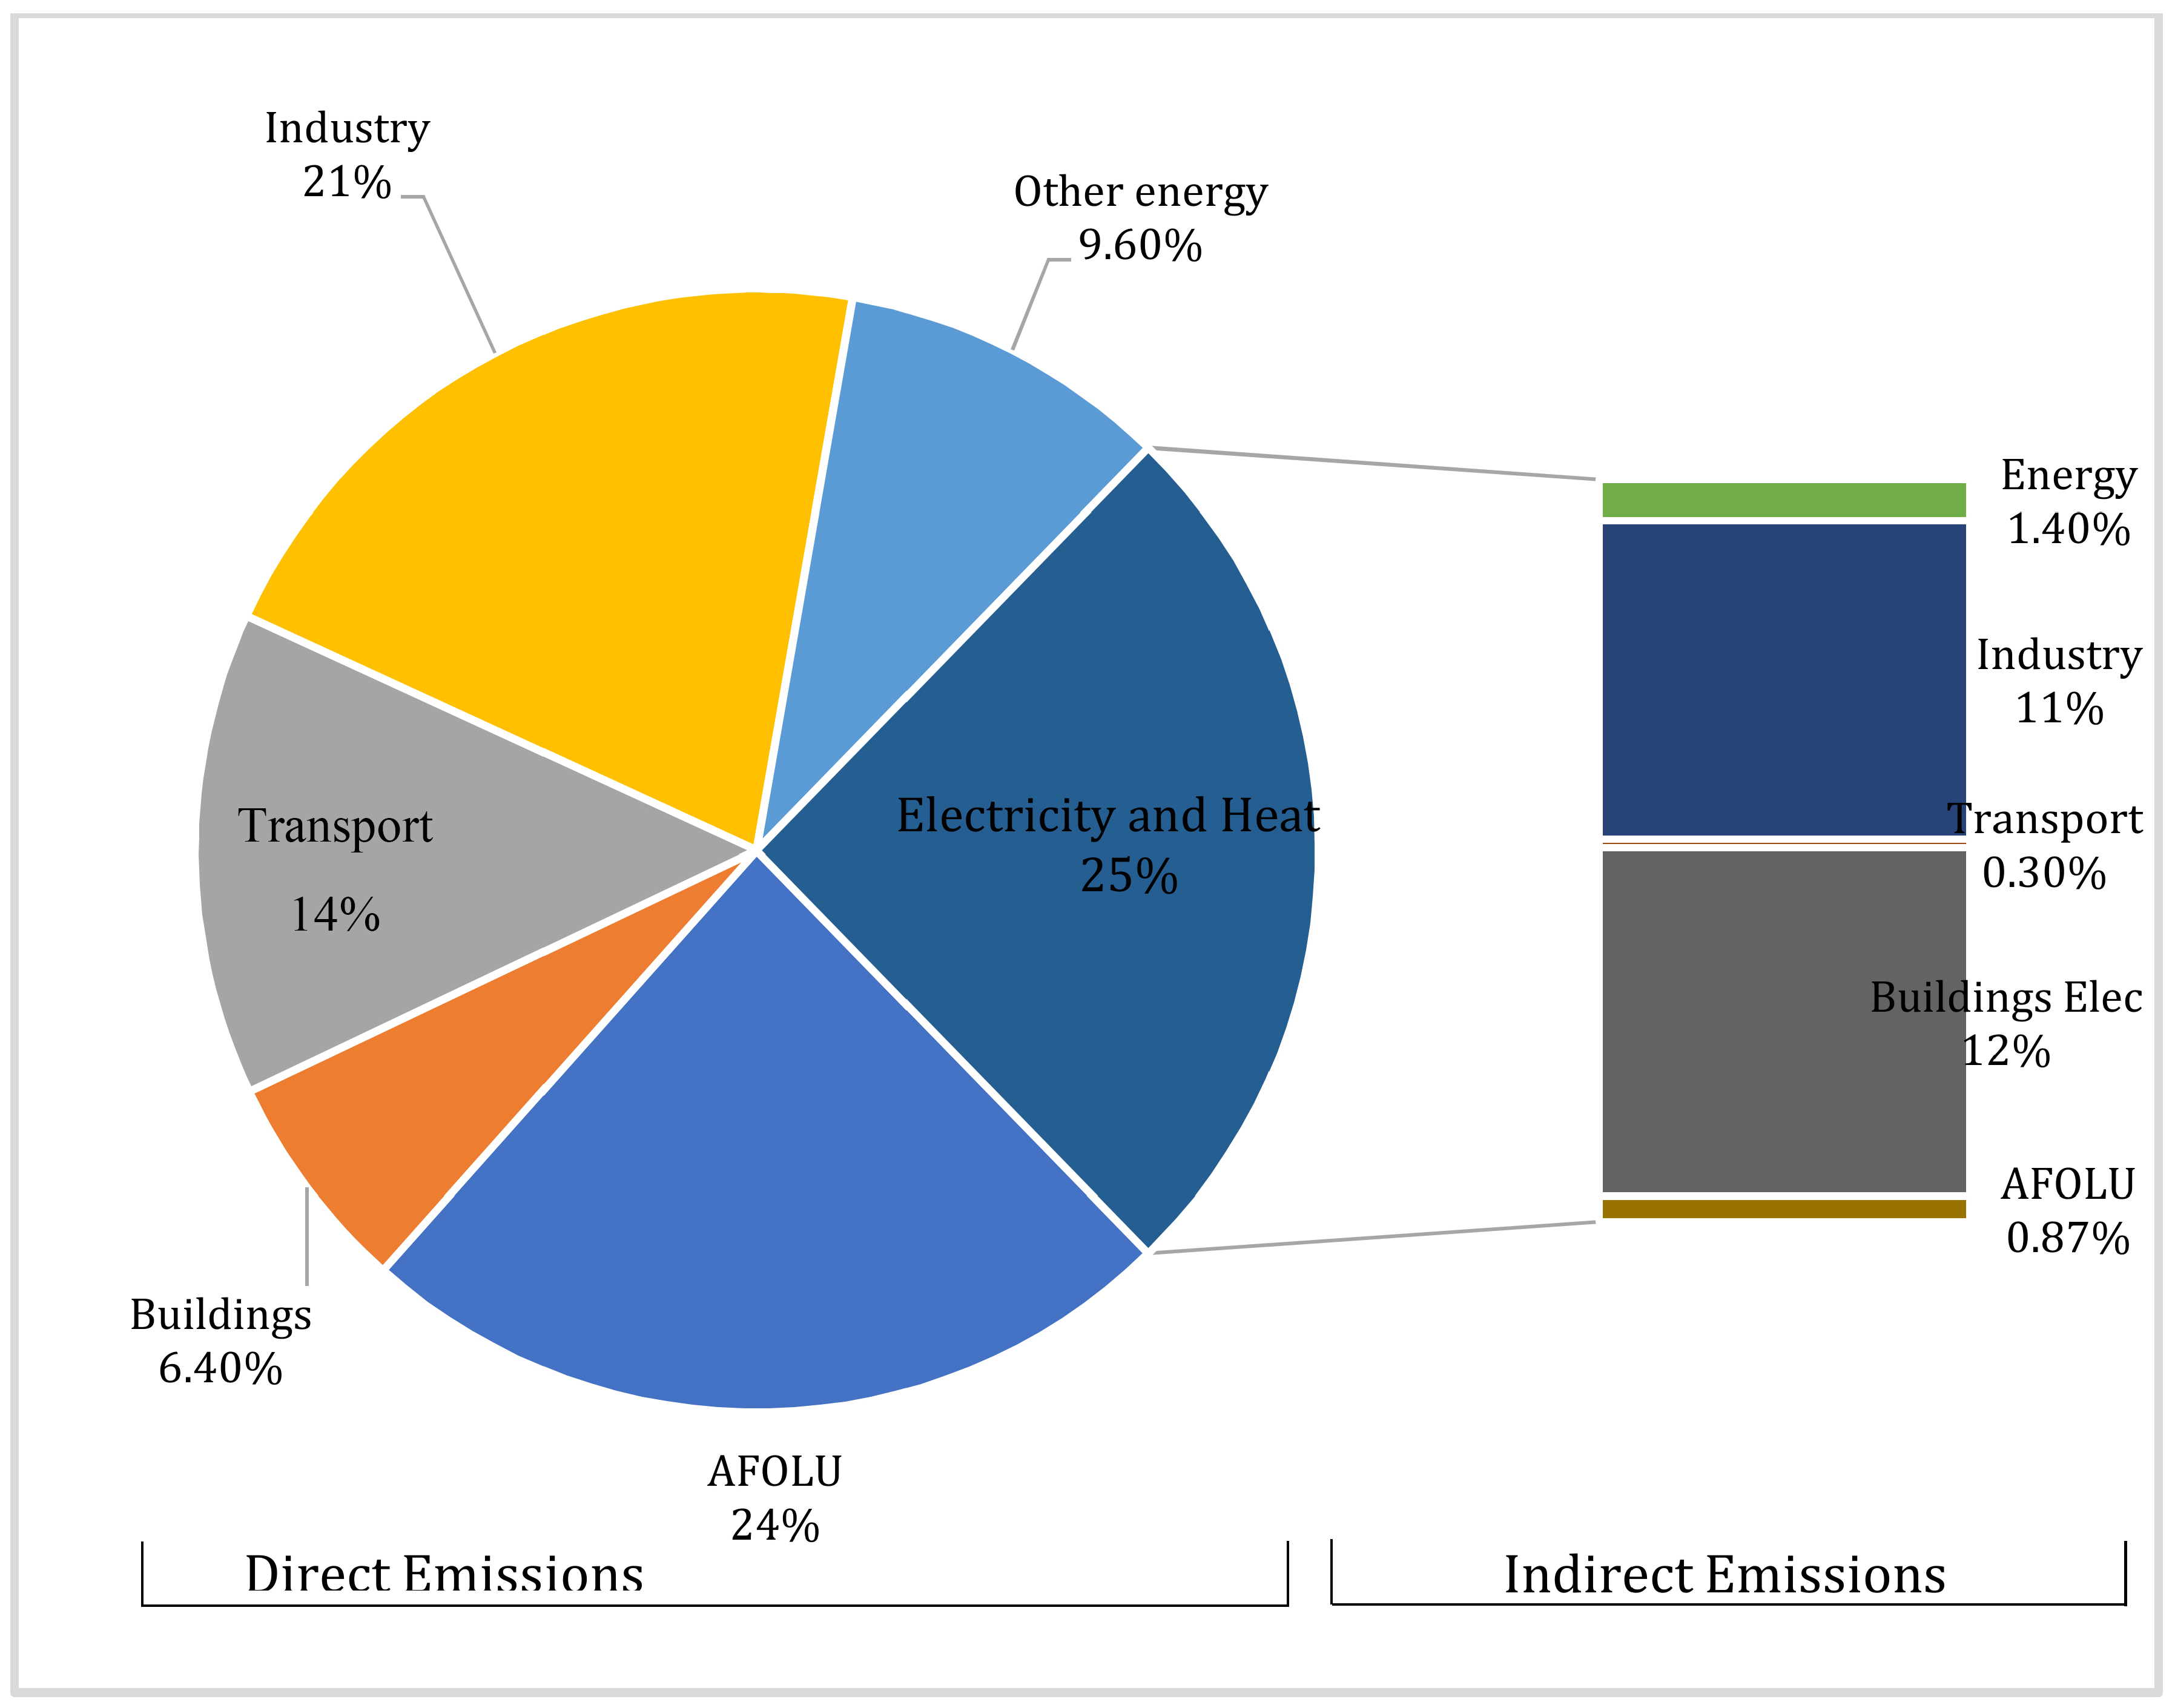
In terms of industry-related carbon emissions, IPCC [11] has recognized “electricity and heat production” as the leading GHG emitting sector, accounting for 25%, while “AFOLU” is reported as the second-highest greenhouse gas emitting sector, accounting for 24% of the total carbon emissions. As indicated in Figure 1, “transport” and “buildings” sectors account for 14% and 6.4%, respectively, of the total industry-related carbon emissions. In terms of indirect carbon emissions, “buildings” account for 12%, which is the largest contribution, while “industry” accounts for 11%. Thus, it is evident that “buildings” account for a significant portion of industry-related carbon emissions. As stated by Scheuer, et al. [12], buildings have a considerable contribution to global environmental impacts, and McKinsey [13] indicated that the building sector accounts for 20 to 30% of the global carbon footprint. It is also predicted that this amount is likely to grow further in the future. The intense energy use of commercial buildings is likely to increase the carbon footprint of buildings even further [14]. Hotels are considered one of the most demanding energy consumers among all the categories of the building stock due to their 24-h operation and the high variety of functions and facilities [4,15,16]. Moreover, the habits of the occupants have caused the hotel sector to be one of the highest energy-consuming sectors [17]. However, Filimonau, et al. [14] stated that despite the effect of the hotel sector on the environment, a limited number of studies exist which quantify the GHG emissions of hotels.
Scientific databases revealed 18 research publications related to carbon emissions of hotels. These studies were conducted in different countries in several different contexts. A summary of all the related studies is included in Table 1. While most of the studies have focused on quantifying the carbon emissions of hotel operations, some studies have ignored quantification (it). However, it is notable that carbon emission studies on developing countries are relatively scarce compared to European and Mediterranean countries. According to Dascalaki and Balaras [15], only 10% of hotels have profound energy management systems and even fewer number of hotels have addressed the resultant carbon emissions.
Quantifying the carbon emissions of hotel operations is considered a primary step of achieving sustainability which has resulted in the discovery of several carbon quantification approaches. Several global standards have been introduced for carbon accounting and reporting. These standards provide a systematic approach for the practitioners to quantify the carbon emissions of hotels. The following section reviews a few of the leading carbon emission reporting standards available.
2.1. Greenhouse Gas Protocol (GHG Protocol)
The GHG Protocol was developed by the World Resources Institute (WRI) and the World Business Council for Sustainable Development (WBCSD). This protocol is recognized as a primary GHG accounting tool for organizations and it is highly popular all over the world [33]. The GHG Protocol includes process-specific GHG emission factors which have been retrieved from the US Environment Protection Agency (EPA), the UK’s Department for the Environment, Food and Rural Affairs (DEFRA) and the Intergovernmental Panel on Climate Change (IPCC).
2.2. Intergovernmental Panel on Climate Change (IPCC)
Guidelines for reporting GHG emissions of industrial processes and activities have been proposed by the Intergovernmental Panel on Climate Change (IPCC). In general, national and corporate levels utilize the IPCC guidelines to evaluate carbon emissions [34]. The IPCC guideline estimates the process-specific carbon emissions based on the GHG emission coefficients which have been retrieved from different sources. These sources include government agencies such as the United States Environmental Protection Agency (US EPA) and European Environment Agency (EEA), expert consultations, academic publications and industry-related databases [34]. An IPCC emission factor database has been developed by summarizing the data gathered from the above-mentioned sources. However, the IPCC guideline also has several issues. The first of those issues is the geographical misrepresentation due to the adoption of sources such as the US EPA. Therefore, the IPCC guideline is not broadly applicable to all the contexts. The second issue is the irregular updates of its databases, especially the GHG emission factor database. A lack of updates affects the carbon footprint estimates. Despite these discrepancies, several other standards such as DEFRA and the GHG Protocol have used the carbon intensity coefficients of IPCC guidelines as the basis of GHG emission factors.
2.3. International Organization for Standardization (ISO)
2.4. Life Cycle Assessment (LCA)
LCA is a widely adopted method to evaluate the environmental impacts of a product or a service during its life cycle. LCA is considered the most comprehensive method for assessing the environmental aspect of products and services as well as for comparing and assessing the materials [36]. Many research studies have been conducted to estimate the carbon emissions of buildings using the LCA method. However, the LCA method has not been widely adopted to estimate the carbon emissions of hotels [14]. A new university building in the USA with hotel functions was assessed for energy consumption and GHG emissions using LCA, by Scheuer, et al. [12]. Moreover, König, et al. [37] conducted a study using LCA to assess the environmental impacts of hotels under construction. However, these two studies were not considered complete studies despite that the environmental impacts of building operations were modeled [14]. Comparatively, the studies conducted by De Camillis, et al. [21] and Sára, et al. [38] evaluated the environmental impacts of Italian hotels more effectively.
3. Research Methodology
This study was conducted to solve a contemporary issue, reduction of GHG emissions through proper reporting mechanisms. A case study approach was followed to explore the carbon emissions of the Sri Lankan hotel sector and thereby develop a carbon reporting mechanism. Tourism is one of the most prominent industries in the country, and various types of accommodation service providers are available all around the country. Among the accommodation service providers, luxury hotels provide most of the amenities available. Therefore, the energy consumption remains high in such hotels, resulting in large quantities of emissions. Accordingly, five luxury hotels located in the Colombo suburb were chosen as the case studies to explore the carbon emissions. In order to identify the areas of concern in the hotels, a preliminary walkthrough study was conducted in the selected hotels. A study team explored the typical areas of the hotels and had discussions with the hotel representatives to identify the hotel operations. Based on the preliminary survey, an electronic template was developed to collect the required data to quantify the carbon emissions.
Accordingly, the initial part of the template was included with operational elements of the hotels such as grading; age; the number of floors and guest rooms, occupancy rate, food and beverage outlets and the total floor area of the hotel. The next part of the template was prepared to gather data related to the following areas which considered a period of 12 months; (a) consumption of diesel (e.g., for backup power generation); (b) metered readings of water consumption; (c) inventory levels of refrigerants; (d) electricity consumptions and metered readings of electricity used; (e) gas consumption details; (f) inventory details of paper, paper usage statistics and details of paper recycling. In order to save time, the above data were retrieved from relevant documentation which included operation & maintenance logbooks of equipment; electricity bills and logbooks of electricity consumption; water bills and logbooks with water consumption; emergency power generation related logs and data on boilers and chillers. Based on the preliminary exploration observations, carbon emissions of the hotels were evaluated under the three main scopes indicated in Table 2.
This study adopted a case study method as it addresses a contemporary research problem which required an in-depth analysis of real-life context data [39]. Accordingly, five hotels were selected which are in the Colombo suburb. As indicated in Table 3, all the hotels were relatively old; Hotel A is the oldest, and Hotel C is the most recently occupied one. The heights of the buildings were not substantially different, and the scales of the hotels were also quite similar. The occupancy rate of the hotels was comparatively high during the time period considered for this study. In terms of the food and beverage outlets, Hotel A had 7 outlets while Hotel B and C both had 5 outlets each and Hotels D and E has 6 and 8 outlets, respectively.
Quantification of GHG Emissions
The procedures followed to quantify the carbon emissions of the hotels are outlined in the following section. GHG emissions were quantified based on the three scopes indicated in Table 2. Carbon emissions of stationary fuel combustion sources were calculated using Equation (1). Methane and Nitrous Oxide emissions of the operations were calculated using Equations (2) and (3). Sulfur hexafluoride (SF6), Hydrofluorocarbon (HFC) and Perfluorocarbon (PFC) emissions were calculated using Equations (4)–(6).
Equation (7) was used to calculate the resultant carbon emissions of electricity consumption, and the corresponding carbon emissions of gas consumption were calculated using Equation (8). Carbon emissions resulting from paper consumption were calculated using equation (9), and the resultant emissions of water consumption were calculated using equation (10). These equations were used to calculate the carbon emission equivalent of the three selected hotels.
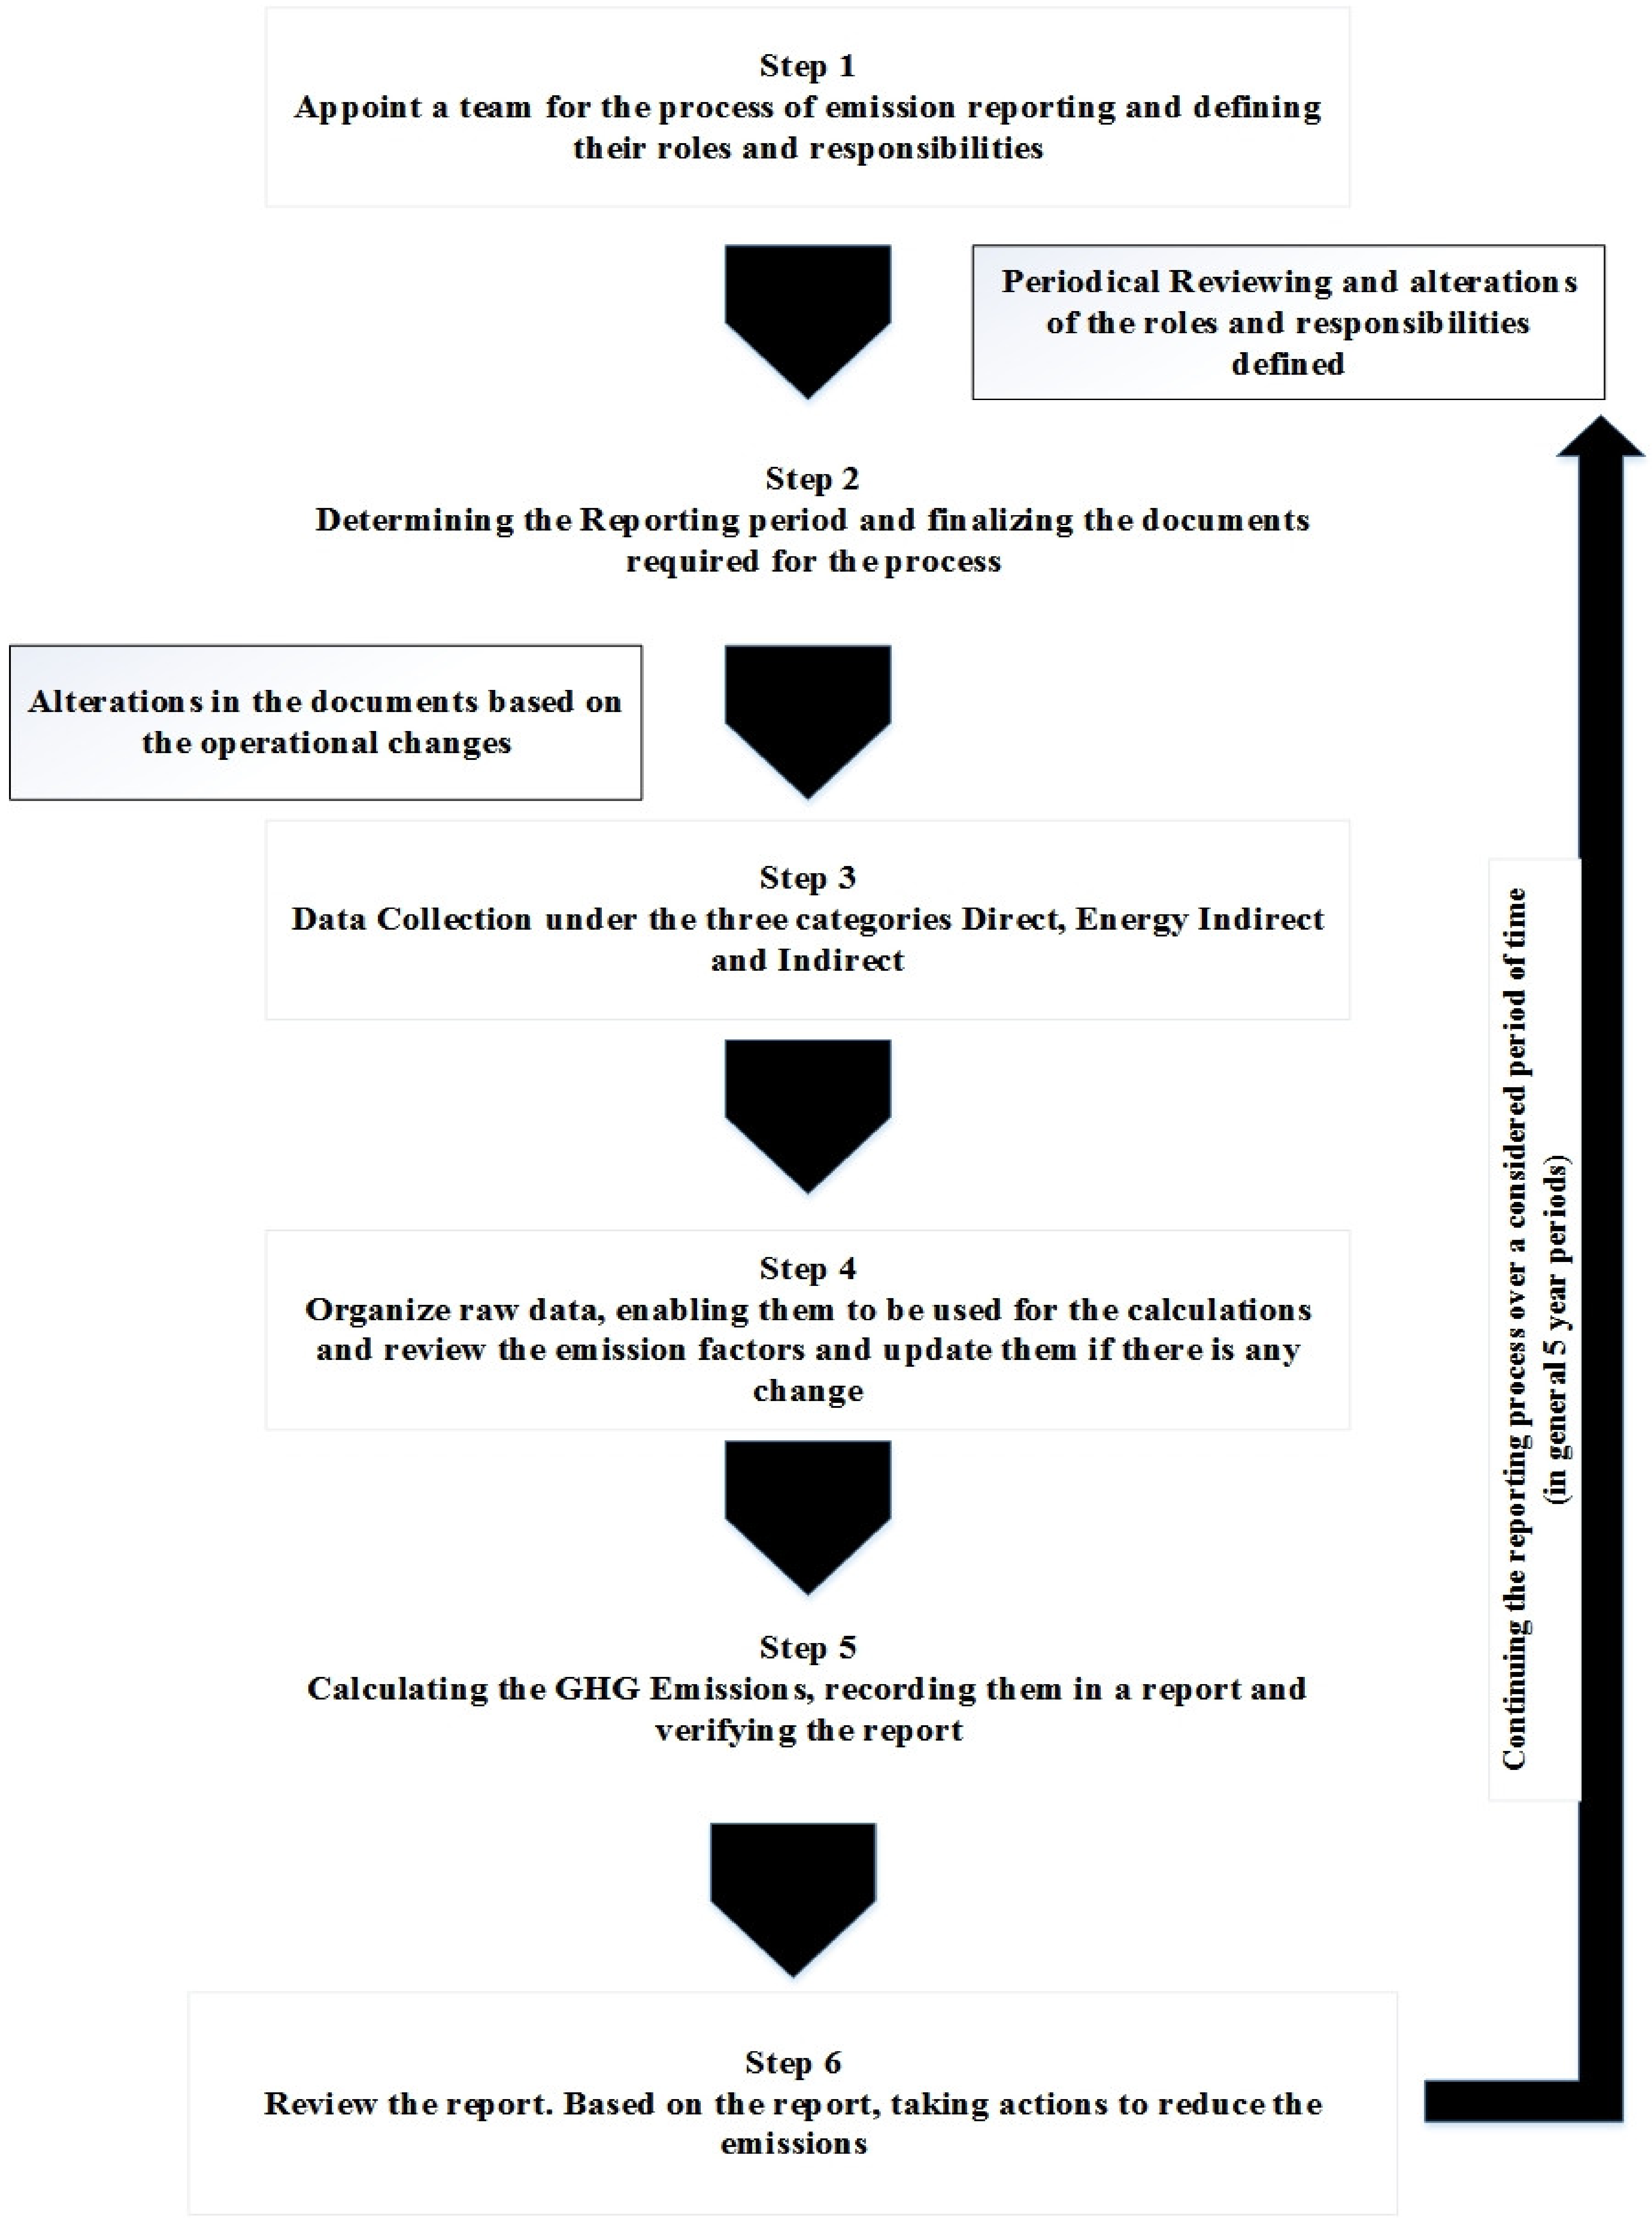
Based on the literature findings, an outline was developed (Figure 2) which was followed during the carbon quantification process. The process of GHG emission reporting is a combination of different processes. It is essential to follow these steps closely to implement a successful reporting mechanism. This developed mechanism could be followed as a standard practice for carbon quantification in the hotels.
4. Greenhouse Gas Emissions of the Hotels
Covering the three scopes of carbon emissions mentioned in Table 2, the total carbon emission equivalent of hotel A was 7164 tons. Furthermore, hotel B recorded 8495 tons; hotel C 7267, tons; hotel D, 7526 tons; and hotel E, 8484 tons of carbon emissions on an annual basis. These results indicated that hotels had a significant contribution to GHG emissions. In a similar study conducted by Filimonau, et al. [14] in Hong Kong, three hotels reported 9619 tons, 7078 tons and 2219 tons. Therefore, it is evident that Sri Lankan hotels have a similar impact on the global GHG emissions to that of the Hong Kong hotels.
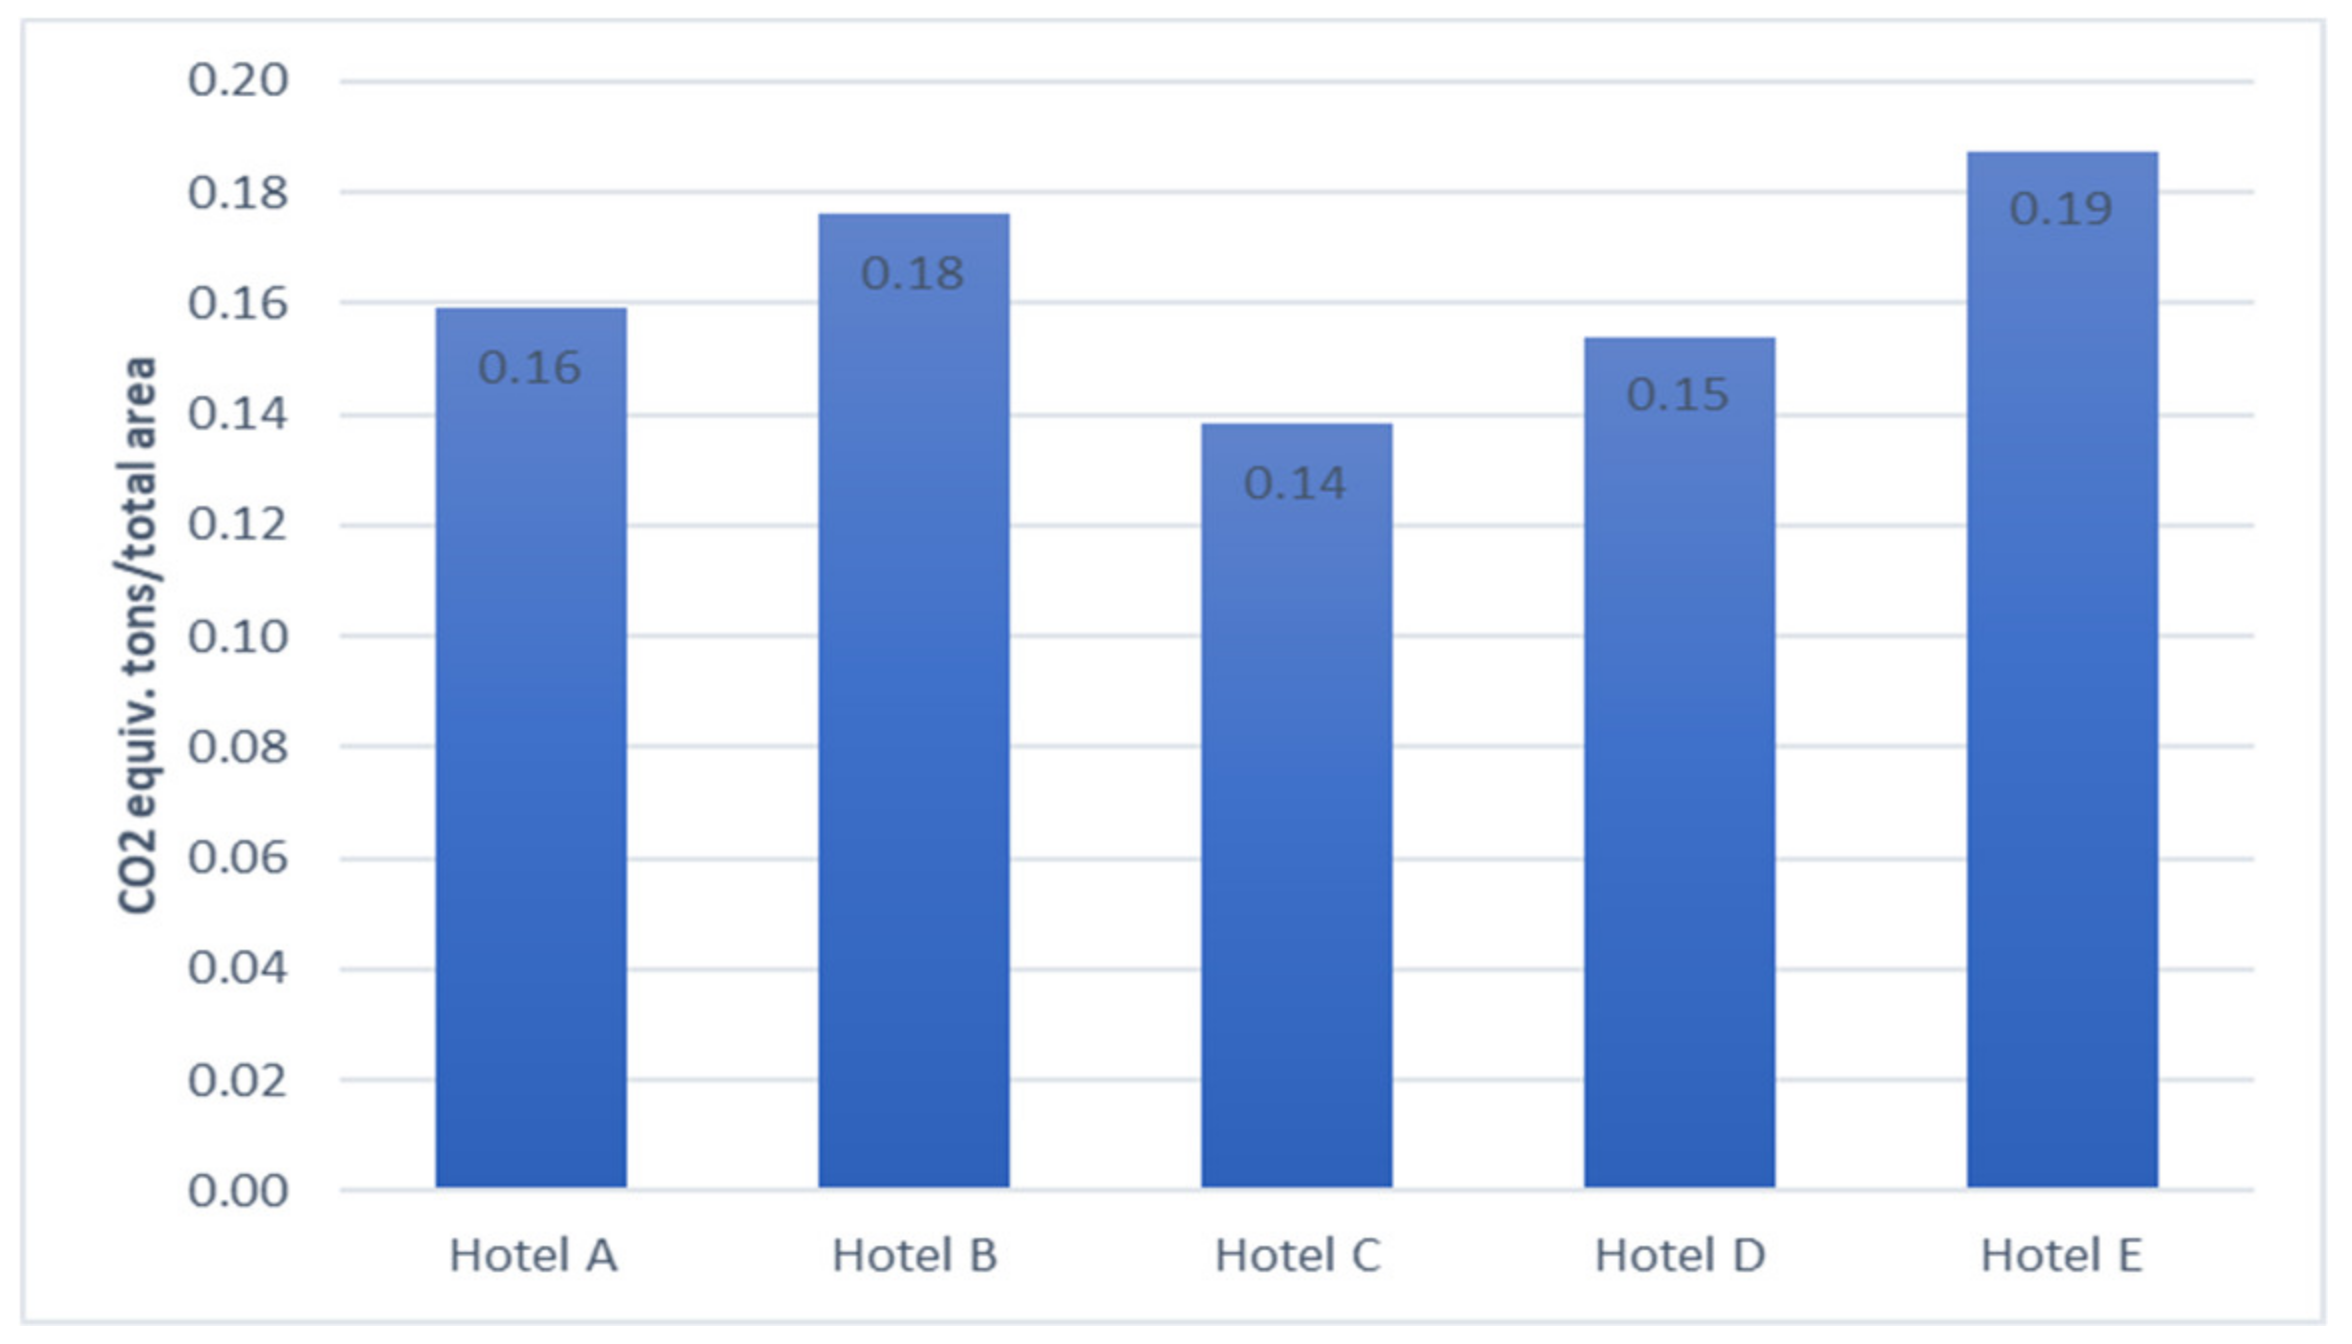
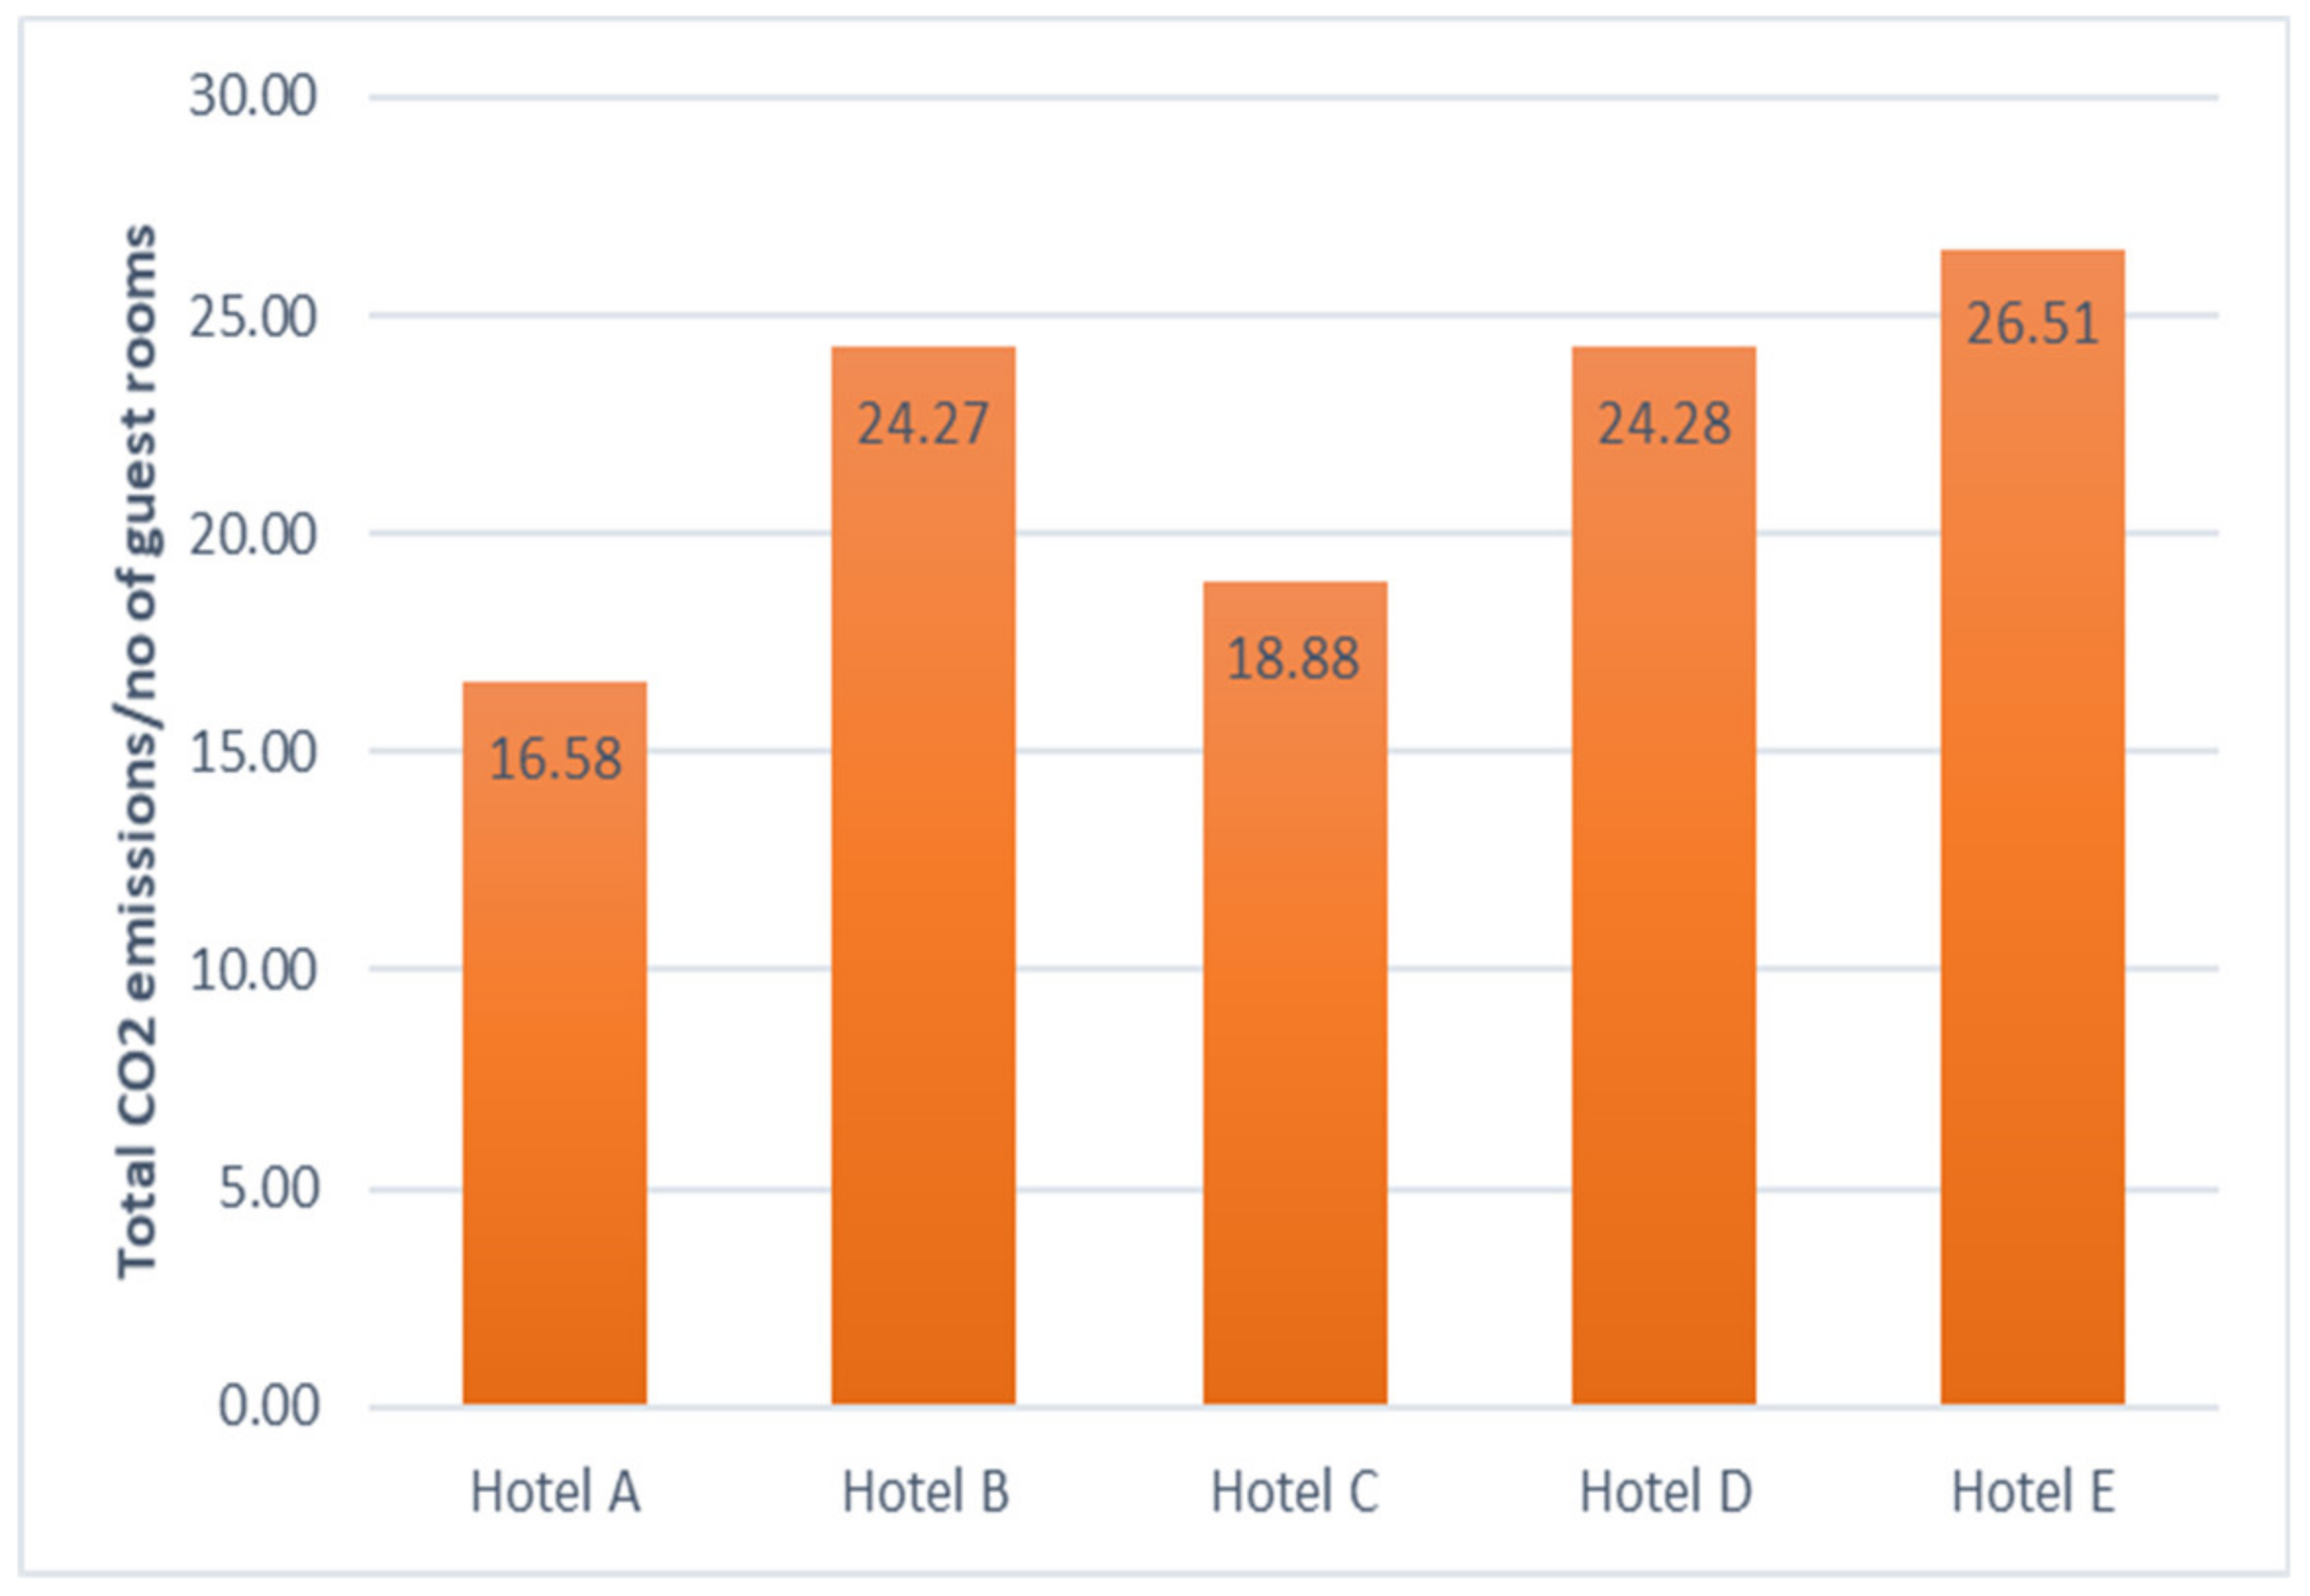
In order to conduct a fair comparison between the hotels, total carbon emissions of the hotels were normalized using the proxies of the total floor area and the number of guest rooms. Accordingly, emission levels of Hotel E were higher than those of the other hotels, followed closely by hotel B (Figure 3). Furthermore, emissions of hotel E remained above the other hotels when normalized using the guest rooms (Figure 4).
Total carbon emissions of the hotels were further analyzed using the three scopes indicated in Table 2. Scope 2 emissions were the dominant source of emissions across all the five hotels. Thus, it is evident that most of the emissions were caused by purchased electricity and gas. Generally, most of the electric power generation was done using hydropower stations in Sri Lanka. However, in recent times, a major portion of power generation was done using diesel power stations which have resulted in a significant increase of negative environmental impacts from power generation. The impact of scope 2 being high also reflects this fact. Moreover, it indicates that hotels consume high volumes of electricity and gas. When interviewing a few representatives of the selected hotels, they also agreed that electricity consumption is very high.
As per the respondents, their respective hotels consider guest satisfaction as the prominent objective which results in high energy and other resource consumption. Moreover, Sri Lanka is a tropical country which enjoys sunny weather all throughout the year. Therefore, temperature control remains a major challenge for the hotel sector. When explored further, it was revealed that a major portion of electricity was consumed for air conditioning and all the hotels were equipped with chiller cooled air conditioning systems. According to Hu, et al. [26], electricity use generates the largest portion of carbon emissions from the hotels. Therefore, the findings of this study are in line with other global studies.
Carbon emissions recorded from scope 1 and 3 were significantly lower than those of scope 1. Moreover, scope 1 and 3 had a similar contribution to the total carbon emissions. These findings suggest that selected hotels should consider evaluating electricity consumption to identify possible points of reducing electricity consumption, or more efficient systems should be integrated to the hotel systems to reduce their electricity consumption.
When exploring the occupancy of the selected hotels, it was evident that monthly occupancy rates varied significantly. Electricity consumption data indicated a close relationship with the occupancy rate of the hotels. As indicated in Table 4, scope 2 accounted for the highest percentage of the total emissions which indicates that electricity generation and occupancy rate might have a significant relationship. The above results led to the hypothesis that occupancy rate fluctuations may cause variations in the volume of resources consumed for serving the hotel patrons. This, in turn, may relate to the carbon emissions of the hotels.
5. Recommendations
Observations of the data collection process and findings indicated several limitations of the study. The recommendations provided in the following section will be of help to mitigate these limitations and contribute to reducing the carbon emissions of the hotel operations.
Carbon emissions of the selected hotels were calculated under three scopes. However, carbon emissions due to transportation activities were not included for the calculations, as data required were not available. None of the hotels maintained travel-related data and transportation facilities provided for the staff differed from one hotel to another. Moreover, most of the guests traveling to and from the selected hotels used external transportation facilities which made data collection even tougher. Despite the unavailability of data, it can be considered as minor compared to the carbon emissions of electricity consumption. Therefore, hotels should maintain a proper record of travel data to ensure that future carbon calculations will include travel-related emissions.
As mentioned above, most of the carbon emissions were reported from electricity consumption, and air conditioning accounted for a major portion of those emissions. It was noted that chillers in all the hotels were more than 10 years old. Old machines and systems are likely to consume more energy, resulting in more carbon emissions. Therefore, respondents of the hotels were informed to investigate the life cycle costs of new air conditioning systems and assess the possibility of installing them. A more energy-efficient air conditioning system is likely to reduce electricity consumption as well as reduce the carbon emissions despite the large initial cost that may incur. This will help in both reducing operational costs as well as carbon emissions.
Paper recycling was not practiced in all the selected hotels. Therefore, the researcher suggested implementing this environmentally friendly practice, which will minimize the GHG emissions resulting from paper consumption. Moreover, no trees were planted over the reporting period in all of the hotels, which resulted in no contribution to the GHG reduction. Therefore, the researcher further suggested that hotel management implement the practice of planting trees at places such as roofs and podiums of the hotels, which will help the process of the carbon footprint reduction.
Moreover, formulation of an outline for GHG emission reporting identified several key elements. All these elements had a significant impact on the final outcome of the process. Industry practitioners need to be aware of all these elements to prepare an effective emission report. The following recommendations can be made for the hotel industry related to the GHG emission reporting practices.
According to the research findings, it is essential to appoint sovereign personnel to handle the emission reporting process. The individual needs to have proper knowledge about the sustainability approaches, standards and the process of GHG emission reporting. Facilities Management (FM) graduates fulfill many of the above requirements. Therefore, the researcher recommends that hotels acquire the service of an FM to fill the role in GHG emission reporting. It was also identified that knowledge of GHG emission reporting was comparatively low amongst the professionals of the hotels. In order to reduce emissions, it is necessary to have comprehensive knowledge about the emissions and their sources (it). Therefore, the researcher recommends conducting training programs and knowledge sharing sessions on this topic to improve the knowledge of the professionals involved in hotel operations.
6. Conclusions
This study was focused on analyzing the carbon emissions of the Sri Lankan hotels and developing a systematic approach to report the GHG emissions. The GHG emissions from five archetypal hotels in Sri Lanka, quantified in carbon dioxide equivalents, were analyzed in detail. Comparison of carbon emissions returned different results when total carbon emissions of the hotels were normalized by the number of guestrooms and floor area, which was substantial in interpreting the hotel carbon emissions and comparing them.
Energy usage was revealed as the prime source of carbon emissions. Therefore, carbon emission reduction targets could be achieved by minimizing electricity consumption. In order to ensure the efficiency of electricity consumption, hotels will have to perform detailed energy audits. Albeit the fact that daily travel might result in relatively low carbon emissions, it is necessary to ensure that all forms of carbon emissions are covered by a proper carbon emission report. Therefore, all the hotels were advised to maintain travel data, which will enable the future carbon quantification processes to include the relevant data.
It was realized that the carbon quantification process required a wide range of meticulous data. Besides maintaining a proper record of the required data, provisions that can reduce and mitigate emissions such as using less toxic and environmentally friendly refrigerants, paper recycling, monitoring utility data by installing sub-meters, and planting trees, would aid the GHG emission reduction approach. Based on the findings and conclusions of this research project, carbon footprints of more hotels, including not only those locally but also the others elsewhere, can be calculated. When more study findings of this kind are available, representative emission benchmarks can be established, which will help monitor and optimize the carbon footprints of hotels for attaining a sustainable built environment.
Author Contributions
Research was conducted by L.H.U.W.A. under the supervision of G.K. L.H.U.W.A. wrote the article and G.K. reviewed the article.
Funding
No funding was received.
Conflicts of Interest
The authors declare no conflict of interest.
Abbreviations
| A(E)t | amount of (kWh) of electricity used in the tth period |
| Af.t | amount (l) of the fth type of fuel used in the tth period |
| A(G)t | amount (unit: 1 unit = 48 MJ) of gas used in the tth period |
| Ap[a] | amount (kg) of pth type of paper added to the inventory during the reporting period |
| Ap[e] | inventory (kg) of pth type of paper at the end of the reporting period (in storage) |
| Ap[r] | amount (kg) of pth type of paper collected for recycling during the reporting period |
| Ap[s] | inventory (kg) of pth type of paper at the beginning of the reporting period (in storage) |
| Ar[d] | amount (kg) of rth type of refrigerant disposed of through environmentally responsible means during the period |
| Ar[e] | inventory (kg) of rth type of refrigerant at the end of the reporting period (in storage, not equipment) |
| Ar[s] | inventory (kg) of rth type of refrigerant at the beginning of the reporting period (in storage, not equipment) |
| A(W)t | amount (m3) of fresh water used in the tth period |
| CH4 emission (kg) due to stationary or mobile sources of fuel combustion | |
| CH4 emission (kg) due to use of paper | |
| CO2 emission (kg) due to stationary or mobile sources of fuel combustion | |
| CO2 emission (kg) due to use of purchased electricity | |
| CO2 emission (kg) due to use of purchased gas | |
| CO2 emission (kg) due to use of fresh water | |
| HFC emission (kg) due to uncontrolled release of refrigerants | |
| PFC emission (kg) due to uncontrolled release of refrigerants | |
| N2O emission (kg) due to stationary or mobile sources of fuel combustion | |
| SF6 emission (kg) due to uncontrolled release of refrigerants | |
| emission factor of CH4 for the fth type of fuel | |
| emission factor of CO2 for the fth type of fuel | |
| emission factor of N2O for the fth type of fuel | |
| F(E)t | emission factor of electricity used in the tth period (specific for individual power companies) |
| F(G)t | emission factor of the pth type of paper |
| global warming of potential of CH4 | |
| global warming potential of N2O |
References
- UNWTO. Tourism Highlights, 2014 ed.; World Tourism Organisation: Madrid, Spain, 2014. [Google Scholar]
- Fernando, S. The tourism-led development strategy in Sri Lanka. J. Bus. Technol. 2017, 1, 40–49. [Google Scholar]
- Ricaurte, E. Developing a sustainability measurement framework for hotels: Toward an industry-wide reporting structure. Cornell Hosp. Rep. 2011, 11, 6–30, [Electronic Article]. [Google Scholar]
- Deng, S.M.; Burnett, J. A study of energy performance of hotel buildings in Hong Kong. Energy Build. 2000, 31, 7–12. [Google Scholar] [CrossRef]
- USEIA. 2012 Commercial Buildings Energy Consumption Survey: Energy Usage Summary. Available online: https://www.eia.gov/consumption/commercial/reports/2012/energyusage/ (accessed on 27 October 2019).
- Chan, W.W.; Lam, J.C. Prediction of pollutant emission through electricity consumption by the hotel industry in Hong Kong. Int. J. Hosp. Manag. 2002, 21, 381–391. [Google Scholar] [CrossRef]
- Lai, J.H.K.; Yik, F.W.H.; Man, C.S. Carbon audit: A literature review and an empirical study on a hotel. Facilities 2012, 30, 417–431. [Google Scholar] [CrossRef]
- INCCA. Greenhouse Gas Emissions: Indian Network for Climate Change Assessment; India Ministry of Environment: New Delhi, India, 2010. [Google Scholar]
- USEPA. Report on the 2015 U.S. Environmental Protection Agency (EPA) International Decontamination Research and Development Conference; U.S. Environmental Protection Agency: Washington, DC, USA, 2015.
- EEA. Environmental Indicator Report 2014; European Environment Agency: København, Denmark, 2014. [Google Scholar]
- IPCC. Climate Change 2014: Synthesis Report. Contribution of Working Groups I, II and III to the Fifth Assessment Report of the Intergovernmental Panel on Climate Change; Intergovernmental Panel on Climate Change(IPCC): Geneva, Switzerland, 2014. [Google Scholar]
- Scheuer, C.; A Keoleian, G.; Reppe, P. Life cycle energy and environmental performance of a new university building: modeling challenges and design implications. Energy Build. 2003, 35, 1049–1064. [Google Scholar] [CrossRef]
- McKinsey, G. Pathways to a Low-Carbon Economy. Version 2 of the Global Greenhouse Gas Abatement Cost Curve; McKinsey & Company: Stockholm, Sweden, 2009. [Google Scholar]
- Filimonau, V.; Dickinson, J.; Robbins, D.; Huijbregts, M.A. Reviewing the carbon footprint analysis of hotels: Life Cycle Energy Analysis (LCEA) as a holistic method for carbon impact appraisal of tourist accommodation. J. Clean. Prod. 2011, 19, 1917–1930. [Google Scholar] [CrossRef]
- Dascalaki, E.; Balaras, C.A. XENIOS—a methodology for assessing refurbishment scenarios and the potential of application of RES and RUE in hotels. Energy Build. 2004, 36, 1091–1105. [Google Scholar] [CrossRef]
- Deng, S.S. Energy and water uses and their performance explanatory indicators in hotels in Hong Kong. Energy Build. 2003, 35, 775–784. [Google Scholar] [CrossRef]
- Santamouris, M.; Balaras, C.; Dascalaki, E.; Argiriou, A.; Gaglia, A. Energy conservation and retrofitting potential in Hellenic hotels. Energy Build. 1996, 24, 65–75. [Google Scholar] [CrossRef]
- Chan, W.W. Partial analysis of the environmental costs generated by hotels in Hong Kong. Int. J. Hosp. Manag. 2005, 24, 517–531. [Google Scholar] [CrossRef]
- Beccali, M.; La Gennusa, M.; Coco, L.L.; Rizzo, G. An empirical approach for ranking environmental and energy saving measures in the hotel sector. Renew. Energy 2009, 34, 82–90. [Google Scholar] [CrossRef]
- Taylor, S.; Peacock, A.; Banfill, P.; Shao, L. Reduction of greenhouse gas emissions from UK hotels in 2030. Build. Environ. 2010, 45, 1389–1400. [Google Scholar] [CrossRef] [Green Version]
- De Camillis, C.; Raggi, A.; Petti, L. Tourism LCA: state-of-the-art and perspectives. Int. J. Life Cycle Assess. 2010, 15, 148–155. [Google Scholar] [CrossRef]
- El Hanandeh, A. Quantifying the carbon footprint of religious tourism: the case of Hajj. J. Clean. Prod. 2013, 52, 53–60. [Google Scholar] [CrossRef]
- Ge, J.; Lei, Y. Carbon emissions from the service sector: an input-output application to Beijing, China. Clim. Res. 2014, 60, 13–24. [Google Scholar] [CrossRef]
- Lai, J.H. Carbon footprints of hotels: Analysis of three archetypes in Hong Kong. Sustain. Cities Soc. 2015, 14, 334–341. [Google Scholar] [CrossRef]
- Cadarso, M.Á.; Gómez, N.; López, L.A.; Tobarra, M.Á.; Zafrilla, J.E. Quantifying Spanish tourism’s carbon footprint: the contributions of residents and visitors: a longitudinal study. J. Sustain. Tour. 2015, 23, 922–946. [Google Scholar] [CrossRef]
- Hu, A.H.; Huang, C.Y.; Chen, C.F.; Kuo, C.H.; Hsu, C.W. Assessing carbon footprint in the life cycle of accommodation services: the case of an international tourist hotel. Int. J. Sustain. Dev. World Ecol. 2015, 22, 313–323. [Google Scholar] [CrossRef]
- Oluseyi, P.; Babatunde, O.; Babatunde, O. Assessment of energy consumption and carbon footprint from the hotel sector within Lagos, Nigeria. Energy Build. 2016, 118, 106–113. [Google Scholar] [CrossRef]
- Cadarso, M.Á.; Gómez, N.; López, L.A.; Tobarra, M.Á. Calculating tourism’s carbon footprint: measuring the impact of investments. J. Clean. Prod. 2016, 111, 529–537. [Google Scholar] [CrossRef]
- Pieri, S.P.; Stamos, A.; Tzouvadakis, I. Reducing tourist carbon footprint through strategic mapping of the existing hotel stock–Attica. Int. J. Sustain. Energy 2016, 35, 734–745. [Google Scholar] [CrossRef]
- Liu, J.; Lin, C.; Huang, L.; Zhu, J.; Wu, L.; Li, Y.J.S. Use of Household Survey Data as a Tool to Assess the Carbon Footprint of Rural Tourist Accommodation and Related Services in China: A Case Study of Mount Qingcheng. Sustainability 2017, 9, 1680. [Google Scholar] [Green Version]
- Puig, R.; Kiliç, E.; Navarro, A.; Albertí, J.; Chacón, L.; Fullana-I-Palmer, P. Inventory analysis and carbon footprint of coastland-hotel services: A Spanish case study. Sci. Total Environ. 2017, 595, 244–254. [Google Scholar] [CrossRef] [PubMed]
- Salem, R.; Bahadori-Jahromi, A.; Mylona, A.; Godfrey, P.; Cook, D. Comparison and Evaluation of the Potential Energy, Carbon Emissions, and Financial Impacts from the Incorporation of CHP and CCHP Systems in Existing UK Hotel Buildings. Energies 2018, 11, 1219. [Google Scholar] [CrossRef]
- WRI. The Greenhouse Gas Protocol; World Resources Institute and World Business Council for Sustainable Development: Geneva, Switzerland, 2010. [Google Scholar]
- Eggleston, S.; Buendia, L.; Miwa, K.; Ngara, T.; Tanabe, K. IPCC Guidelines for National Greenhouse Gas Inventories; Institute for Global Environmental Strategies (IGES): Hayama, Japan, 2006. [Google Scholar]
- International Organization for Standardization. ISO 14064-3: Greenhouse Gases—Part3: Specification with Guidance for the Validation and Verification of Greenhouse Gases Assertions; ISO: Geneca, Switzerland, 2006. [Google Scholar]
- Arena, A.; De Rosa, C. Life cycle assessment of energy and environmental implications of the implementation of conservation technologies in school buildings in Mendoza—Argentina. Build. Environ. 2003, 38, 359–368. [Google Scholar] [CrossRef]
- König, H.; Schmidberger, E.; De Cristofaro, L. Life Cycle Assessment of a Tourism Resort with Renewable Materials and Traditional Construction Techniques; IOS Press: Amsterdam, The Netherlands, 2007. [Google Scholar]
- Sára, B.; Raggi, A.; Petti, L.; Scimìa, E. Implementation of LCA to Services: Case Studies in the Hospitality Industry. In Proceedings of the 6th International Conference on Eco Balance, Tsukuba, Japan, 25–27 October 2004; pp. 127–128. [Google Scholar]
- Yin, R.K. Qualitative Research from Start to Finish; Guilford Publications: New York, NY, USA, 2015. [Google Scholar]
Figure 1.
GHG Emission by Industry. (Based on IPCC (2014) Figure 1.7 pp. 47).

Figure 2.
General procedure followed to quantify hotel carbon emissions.

Figure 3.
Normalized emissions by total area.

Figure 4.
Normalized emissions by the number of guest rooms.


Table 1.
Tourist accommodation-related studies on carbon emissions.
| Source | Location | Scope | GHG Emissions Quantified |
|---|---|---|---|
| Chan and Lam [6] | Hong Kong | Survey on electricity consumption | Yes |
| Dascalaki and Balaras [15] | France, Greece, and Italy | Energy and water audits | Partially quantified |
| Chan [18] | Hong Kong | The environmental cost of energy use, water consumption, and solid waste disposal | Yes |
| Beccali, et al. [19] | Italy | Energy and environmental audit | Yes |
| Taylor, et al. [20] | United Kingdom | Energy and environmental audit | Yes |
| De Camillis, et al. [21] | Italy | Life cycle assessment | Yes |
| Filimonau, et al. [14] | Hong Kong | Carbon appraisal of tourist accommodation | Yes |
| El Hanandeh [22] | Mecca | Carbon emissions of religious tourism | Yes |
| Ge and Lei [23] | China | Carbon emissions of the service sector | Yes |
| Lai [24] | Hong Kong | The carbon footprint of hotels | Partially |
| Cadarso, et al. [25] | Spain | Carbon footprint linked to the visitor and resident tourist consumption | Yes |
| Hu, et al. [26] | Taiwan | Carbon emissions of tourist accommodations | Yes |
| Oluseyi, et al. [27] | Nigeria | Energy consumption | Yes |
| Cadarso, et al. [28] | Spain | Evaluating the carbon footprint of the tourism sector | No |
| Pieri, et al. [29] | Greece | Tourist carbon footprint | No |
| Liu, et al. [30] | China | Carbon estimation of rural tourist accommodation | Yes |
| Puig, et al. [31] | Spain | The carbon footprint of an overnight stay | Yes |
| Salem, et al. [32] | United Kingdom | Comparison of energy systems | Yes |
Table 2.
Scopes of emissions considered in the study.
| Classification | Emission Activities | Examples |
|---|---|---|
| Scope 1 | Stationary sources combustion, Mobile source combustion, Assimilation of carbon dioxide into biomass | Electricity generation, boilers, gas cooking stoves, Refrigerants emissions during the use of refrigeration and air conditioning equipment |
| Scope 2 | Consumption of purchased electricity and gas | Electricity used by electrical equipment; gas consumed by gas appliances |
| Scope 3 | Disposal of waste, water consumption, wastewater treatment | Electricity used for freshwater processing by the water board; Energy used for wastewater treatment |
Table 3.
Characteristics of the hotels.
| Hotel A | Hotel B | Hotel C | Hotel D | Hotel E | |
|---|---|---|---|---|---|
| Hotel grade | 4 Star | 4 Star | 4 Star | 4 Star | 4 Star |
| Building age (years) | 30 | 25 | 18 | 20 | 22 |
| No. of floors | 19 | 18 | 21 | 22 | 17 |
| Total floor area (m2) | 45021 | 48236 | 52563 | 48902 | 45230 |
| No. of guest rooms | 219 | 205 | 230 | 210 | 200 |
| Occupancy rate (%) | 51.4% | 57.2% | 49.7% | 53.2% | 56.7% |
| No. of regular employees | 432 | 350 | 385 | 310 | 320 |
Table 4.
Contribution of various scopes towards total GHG emissions.
| Scope 1 | Scope 2 | Scope 3 | Total Emissions | |
|---|---|---|---|---|
| Hotel A | 1028.78 | 4986 | 1149.75 | 7164.53 |
| Hotel B | 1676.6 | 5197 | 1622.425 | 8495.425 |
| Hotel C | 1595.78 | 4790 | 881.475 | 7267.255 |
| Hotel D | 953.63 | 5525 | 1047.55 | 7526.18 |
| Hotel E | 1675.04 | 5417 | 1392.475 | 8484.515 |
© 2019 by the authors. Licensee MDPI, Basel, Switzerland. This article is an open access article distributed under the terms and conditions of the Creative Commons Attribution (CC BY) license (http://creativecommons.org/licenses/by/4.0/).
Share and Cite
MDPI and ACS Style
Abeydeera, L.H.U.W.; Karunasena, G. Carbon Emissions of Hotels: The Case of the Sri Lankan Hotel Industry. Buildings 2019, 9, 227. https://doi.org/10.3390/buildings9110227
AMA Style
Abeydeera LHUW, Karunasena G. Carbon Emissions of Hotels: The Case of the Sri Lankan Hotel Industry. Buildings. 2019; 9(11):227. https://doi.org/10.3390/buildings9110227
Chicago/Turabian StyleAbeydeera, Lebunu Hewage Udara Willhelm, and Gayani Karunasena. 2019. "Carbon Emissions of Hotels: The Case of the Sri Lankan Hotel Industry" Buildings 9, no. 11: 227. https://doi.org/10.3390/buildings9110227
Note that from the first issue of 2016, this journal uses article numbers instead of page numbers. See further details here.