1. Introduction
Project progress monitoring and control is one of the most important tasks of construction project management [
1]. Monitoring of the actual state of the project can enable decision makers to assess the deviations from the as-planned state and adopt corrective actions if the project is behind schedule [
2]. Current practices of predicting the performance of a construction project require inspections that are still mainly manual, time consuming and can contain errors [
3]. The traditional, manual construction progress assessment with human presence is still dominating [
4]. Computer technologies have great potential to improve management practices in the construction industry [
5]. The construction industry has been a slow adopter of novel technologies [
6]. Automation of construction progress monitoring, however, aids to improve the accuracy and reduce the manual effort required. A building information model (BIM) can help to automate this process [
7]. BIM is a comprehensive digital representation of a building comprising not only the 3D geometry of all its components but also a semantic description of the component types and their relationships [
4,
8,
9].
To automate the construction progress monitoring, several methods such as laser scanning, photogrammetry and videogrammetry can be used. In all of these methods, a point cloud is generated to assess the current progress of the project (as-built model). Among these methods, photogrammetry is the most economical and effective technique to obtain a true 3D point cloud required for documentation of historical monuments [
10]. The laser scanning is an expensive alternative that requires high-skilled operators. Moreover, data processing is time consuming in this method, and there is usually a lack of texture in laser scanning [
11]. The videogrammetry may also have issues and challenges such as the high volume of data and time consuming processing required on the film as well as more noises in the final point cloud due to a reduction in image quality in comparison with still images.
In this research, a photogrammetric Multi-View Stereo approach is used for automated progress monitoring. This approach is simple and affordable with the existence of off-the-shelf digital cameras. To generate the point cloud, a computer vision approach known as Structured-from-Motion (SFM) has been implemented in academic open source software, VisualSFM. Computer vision is concerned with the automatic extraction, analysis and understanding of useful information from a single image or a sequence of images. It involves the development of a theoretical and algorithmic basis to achieve automatic visual understanding [
12]. The software for 3D reconstruction includes several codes for (1) estimating the poses of the images as well as their intrinsic parameters and a sparse point cloud in bundler, (2) clustering and selecting vantage images in a package called Clustering Multi-Views Stereo (CMVS) and (3) generating a dense point cloud from the obtained information in PMVS algorithm. One of the issues in point cloud generation using this approach is resolving the scale. This issue is a manual procedure in this approach and can be solved by rescaling the point cloud using a scale factor estimated by comparing two corresponding points in the model and object spaces. On the other hand, coded targets are often employed by photogrammetry researchers to define the datum and resolve the scale in 3D measurement using images [
13] and a fusion between coded target detection and a SFM approach, known as photogrammetric Multi-View Stereo [
14] has been implemented in photogrammetric software such as Photoscan Agisoft and Pix4D [
15].
Although extensive research has been conducted in the area of automated progress monitoring, there are still many unresolved challenges that need to be addressed. Further research is needed to evaluate the accuracy and completeness of the generated point cloud model using both computer vison and photogrammetry approaches presented in VisualSFM [
16] and Agisoft Photoscan [
17], respectively. Moreover, the previous studies are not capable of generating the point cloud completely by off-the-shelf digital cameras to represent both inside and outside of the construction model.
The aim of this study is to exploit photogrammetric Multi-View Stereo to generate an accurate 3D model of the inside and outside of a building throughout the project duration and evaluate its performance for automated construction progress monitoring. For this purpose, photogrammetric Multi-View Stereo approach is adopted and several coded targets are placed around the building to define the datum and resolve the scale. Having captured several images from the building in proper positions, the targets are detected fully automatically. SFM and Multi-View Stereo (MVS) algorithms are then run to generate as-built 3D model. The captured images are also imported in computer vision software, VisualSFM, to generate a dense point cloud using SFM/CMVS/Patch-based Multi-View Stereo (PMVS) approach. Resolving the scale in the SFM/CMVS/PMVS approach is done through manually picking several points in the point cloud and comparing the distance between the points in the model with real values in the object space. The two achieved 3D models are compared with the true values manually measured on the scene to evaluate the performance of the two approaches. The performance of the proposed method is evaluated using three criteria, being the accuracy of the generated model, the amount of generated noises and the number of points in each point cloud. The 3D point cloud model generated by the proposed photogrammetric Multi-View Stereo method will enable project managers to evaluate the quantity of performed work and identify construction deviations efficiently.
A review of the literature for construction progress monitoring is provided in the next section. The details of the research methodology are described in
Section 3 and the implementation details for two case studies are explained in
Section 4. The implementations results are discussed in
Section 5. Finally, the achievement of this research is presented in conclusions and remarks.
2. Related Work
In this section, we briefly review the previous research conducted on collecting site images for automated construction progress monitoring.
Abd Majid et al. identified different techniques to automate the process of producing as-built construction schedules by applying modern photogrammetry techniques for monitoring and evaluating the actual physical progress [
18]. Memon et al. proposed a prototype software for monitoring project progress automatically and addressed the Digitalizing Construction Monitoring (DCM) model for monitoring the physical progress of the project by using photogrammetry techniques [
1]. Golparvar and Peña-Mora developed a system that matches as-planned and as-built views with manual selection of features and detects the material content and color codes construction elements based on progress status against a 4D BIM [
2]. Boche and Has presented a new approach for automatically retrieving 3D Computer-Aided Design (CAD) objects in 3D range point clouds and presented two metrics that are used for automatically comparing as-built and as-planned point clouds [
19]. Tang and Akinci proposed automated framework for extracting surveying goals from point clouds composed of two parts including capturing of surveying goal definitions from inspectors and the generation of sequences of operations for extracting inspector-defined surveying goals and automatic execution of sequences of operations for generating surveying goal results [
20]. Boche presented an approach for the automated tracking of the as-built 3D status of construction sites using laser scanning and project 3D CAD modeling, and then proposed a novel Iterative Closest Point (ICP) algorithm for the fine registration of site laser scans with project 3D CAD models [
21]. Golparvar et al. presented a new fully automated approach for the reconstruction of 3D point cloud models from site images based on structure a SFM algorithm for automated and remote monitoring of progress [
22]. Golparvar et al. presented and compared two methods for obtaining point cloud models for detection and visualization of as-built status for construction projects including automated image-based reconstruction using SFM and 3D laser scanning [
23]. Golparvar et al. developed an automated approach to tracking, analysis, and visualization of progress using daily site photographs and 4D IFC-based BIMs [
24]. Bhatla et al. used an alternate technology to generate as-built 3D point clouds using photos taken using handheld digital cameras and compared them against the original as-built 3D models, and checked for accuracy of the modeling process [
25]. Turkan et al. presented a system to update the schedule and combined 3D object recognition technology with schedule information into a combined 4D object recognition system with a focus on progress tracking [
26]. Braun et al. presented a concept for photogrammetric production of point clouds for construction progress monitoring and for the procedure of as-planned and as-built comparison based on the geometry only [
4]. Rashidi et al. proposed a method for automatically calculating the absolute scale point cloud data (PCD) obtained from indoor/outdoor built infrastructure scenes using a colored cube [
27]. Jung et al. and Huber et al. proposed a semi-automated approach to produce an as-built BIM creation. [
28,
29]. Braun et al. proposed a method to facilitate the as-planned versus as-built comparison through image based monitoring. A dense point cloud was reconstructed from the images that is compared to an existing 4D building information model (BIM) [
7]. Behnam et al. presented a system for automated progress measurement and online progress reporting of repetitive construction tasks in linear infrastructure projects using satellite remote sensing technology [
30]. Braun et al. recorded the as-built state of a construction site by photogrammetric methods (e.g., UAVs) and compared it with an as-planned (4D) BIM model [
31].
Although an extensive research has been conducted in the area of automated progress monitoring, there are some shortcomings that need to be addressed:
(1) Point cloud models are scaled using methods such as ground control points (GCPs) and targets to improve their accuracy. In the conventional scaling methods, however, the targets are manually detected in the point cloud model, which is time consuming, requires high attention and highly skilled operators, is error-prone work, and results in a low accuracy for the generated 3D as-built model.
(2) None of the previous studies can generate the point cloud completely by off-the-shelf digital cameras to represent both inside and outside of the construction model. There are several studies conducted for outdoor progress monitoring. However, very limited research has been conducted in the area of indoor progress monitoring which has used either image processing methods or lasers scanner, not photogrammetry.
(3) None of the previous studies can fully automatically perform boundary tracing to generate an as-built BIM model. There have been a few studies conducted to perform boundary tracing. All the previous studies, however, used a manual process for generating as-built BIM model that is time consuming, labor-intensive, tedious, error prone, and inefficient in large projects.
In this research, a new photogrammetric Multi-View Stereo method is proposed for automated construction progress monitoring that aims to resolve some of the mentioned shortcomings of the previous studies. In the proposed method, the coded targets are utilized to automatically resolve the scale and improve the accuracy of the point cloud generated. An accurate and complete as-built 3D model of indoor and outdoor of building is generated using SFM and MVS algorithms. Having the generated point cloud, the boundary tracing is performed fully automatically and the CAD model is generated from an as-built point cloud and compared with the as-planned model.
3. Methodology
This paper presents a novel method for automated construction progress monitoring using photogrammetry and computer vision techniques. The proposed method has the capability to build accurate 3D point cloud model of the project throughout the project duration to represent both inside and outside of the construction model.
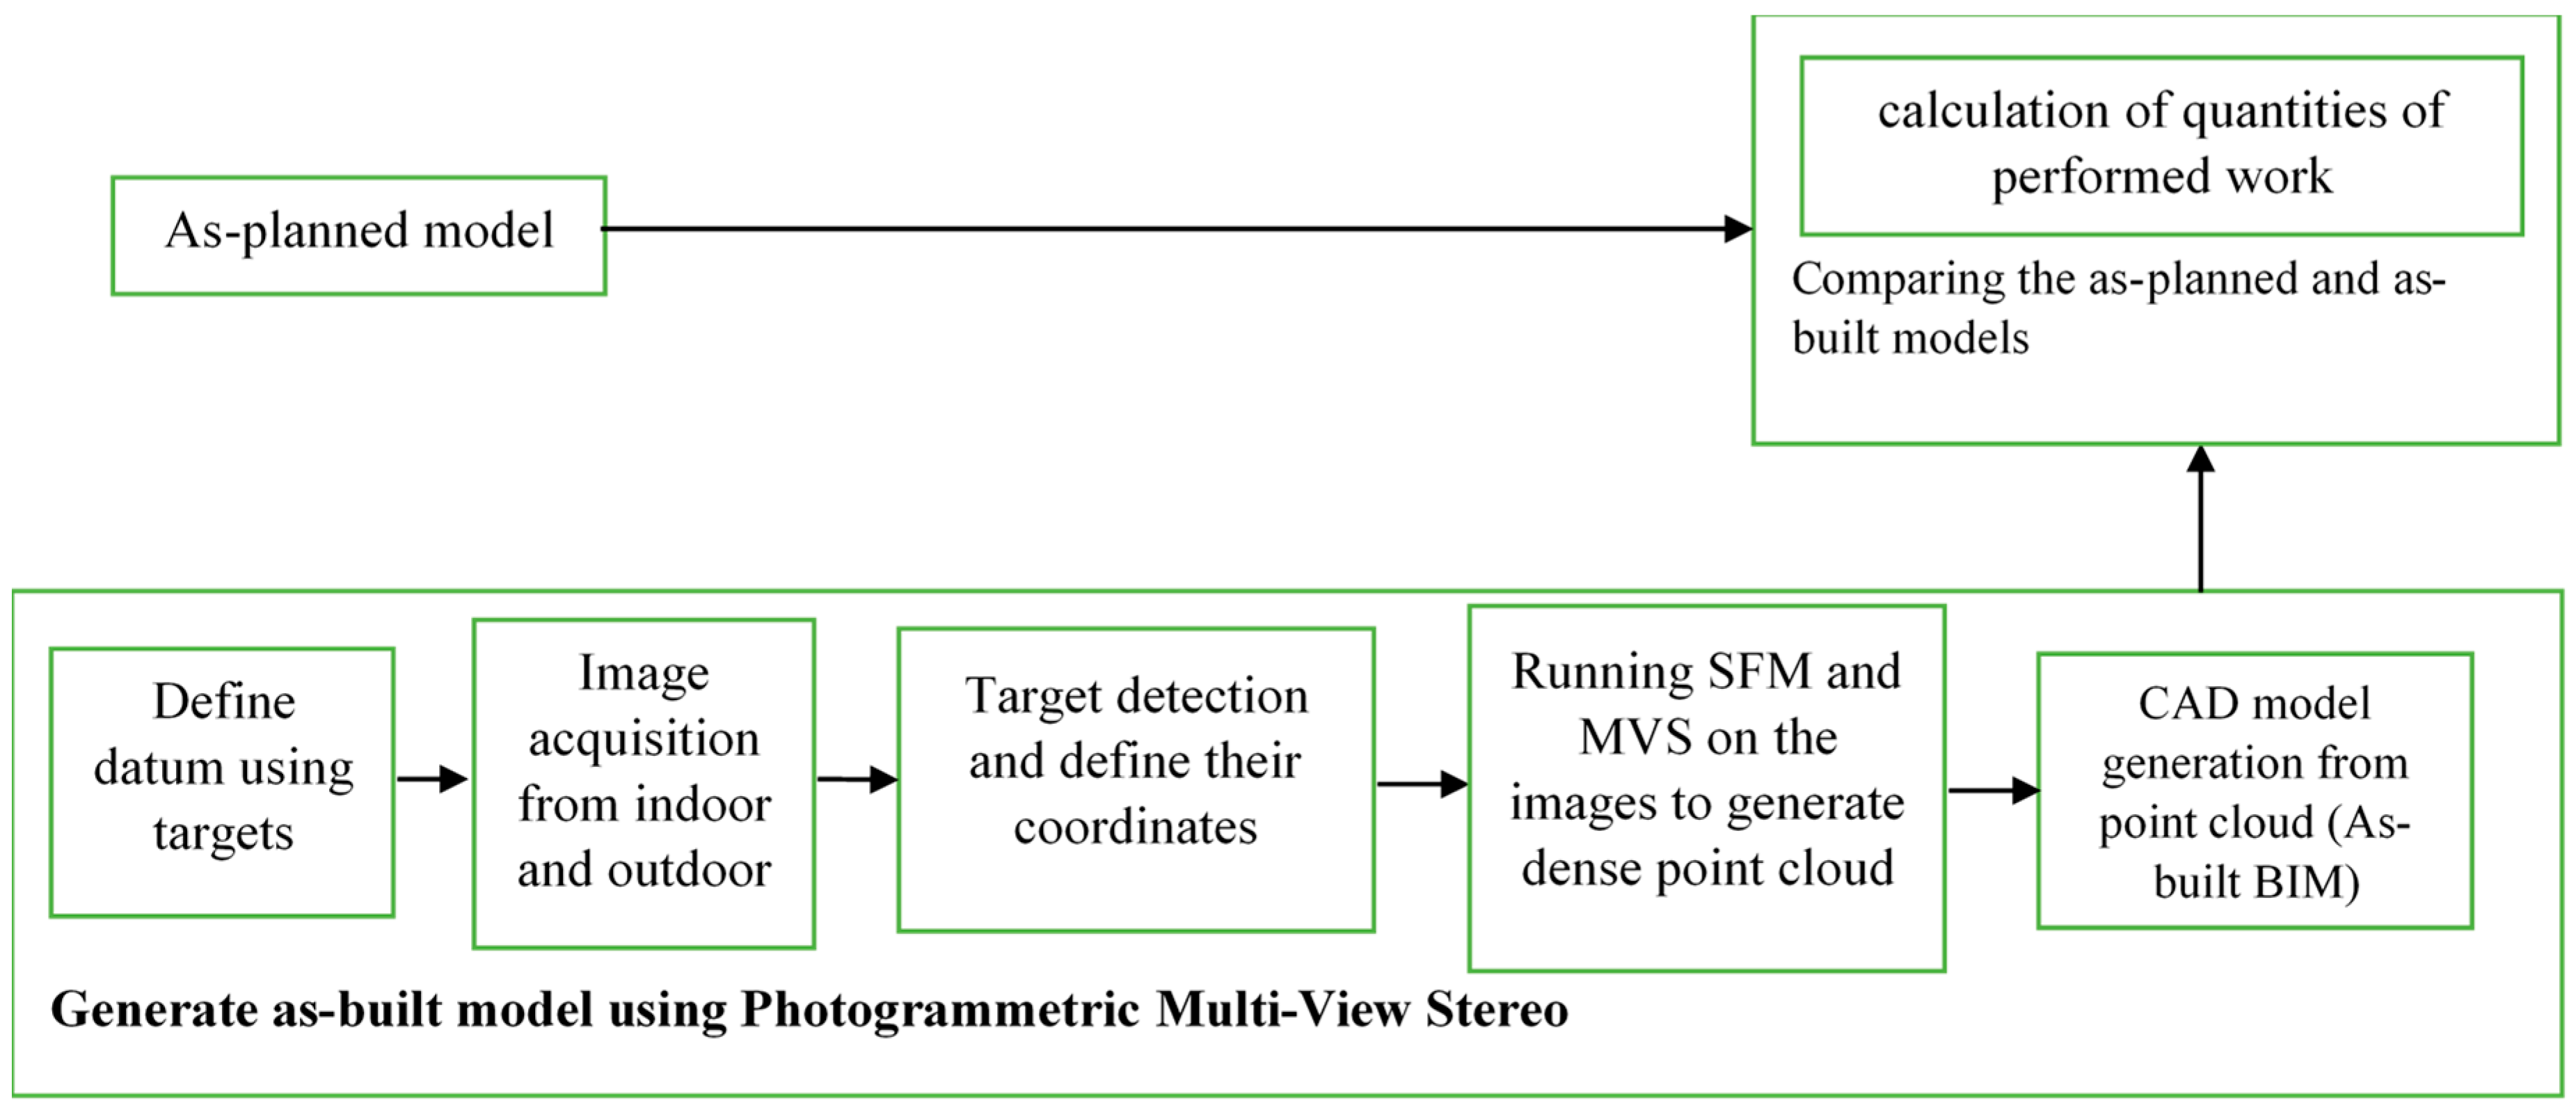
The as-planned model (4D BIM) is used as the basis for project control and the project deviations can be realized by comparing the as-planned vs as-built model generated from point cloud. The proposed approach makes the process of data collection and analysis easier to assess the project progress and detect deviations from the initial plan. The flowchart diagram shown in
Figure 1 represents different stages by which the construction progress measurement and monitoring is done using the proposed approach.
As shown in
Figure 1, the project progress measurement and monitoring is done in three main steps including (1) generate as-planned model, (2) generate as-built model using SFM/CMVS/PMVS and photogrammetric Multi-View Stereo, and (3) comparing the as-planned model and each of the as-built models. These steps are explained in the next section briefly.
3.1. Generate As-Planned Model
In order to automate the construction progress monitoring, it is necessary to first generate a baseline for the project performance called the as-planned model. In automated progress monitoring, the actual progress of work is compared against the as-planned model to aid decision makers to assess deviations from the as-planned state and adopt corrective actions if the project is behind the schedule. In this research, the as-planned model is produced using the Autodesk Revit software and is linked to the project schedule.
3.2. Generate As-Built Model
The second step is the generation of the as-built model, which is the core part of this research and is done in two different ways, using photogrammetric Multi-View Stereo and SFM/CMVS/PMVS approaches.
In this research, the as-built model is generated utilizing close range photogrammetry and computer vision. The close range photogrammetry is an independent method in the documentation and reconstruction process. This methodology is based on images with a high overlap so that the triangulation process can perform well. The aim of the close range photogrammetry is to streamline and speed up the data acquisition and processing. This method is an appropriate and accurate way to document for components that have textures and colors, as well as to provide metric data of objects with varying sizes and complexity over a short period of time [
32]. The captured images were imported into the Agisoft PhotoScan software. In this research, the version 1.4.4 build 6848 of Agisoft Photoscan software was used. Agisoft Photoscan is a photogrammetric tool that uses the SFM-MVS algorithm to generate spars and dense points cloud using 2D images.
The generation of the as-built model is done using the proposed photogrammetric Multi-View Stereo method in four steps as explained in the following section. To compare the proposed approach against the previous studies, the dense point cloud is also generated with SFM/CMVS/PMVS algorithm using the steps explained thereafter.
3.2.1. Photogrammetric Multi-View Stereo
Photogrammetric Multi-View Stereo includes four main steps consisting of (1) defining datum using targets, (2) image acquisition from indoor and outdoor, (3) target detecting and defining of their coordinates, (4) running SFM and MVS on the images to generate the dense point cloud. Each of these steps are explained in the next sections.
Step 1: Define datum using targets
In this research, coded targets are used as markers to define a local coordinate system and model scale or as an auxiliary point to improve the image alignment. The targets aid to reduce errors and increase the accuracy.
One of the most important issues in the automation of close range photogrammetric systems is the recognition of coded targets in images automatically [
33]. In fact, considering a specific code for each target, the code of each target is identified throughout the recognition and measurement of the target center coordinates. Consequently, the matching of the corresponding targets in different images is done automatically using these codes. One of the uses of an automated coded target detection is the complete automation of the process of calculating the bundle adjustment cluster in close range photogrammetry [
33]. There are some criteria in placing the coded targets: (1) Coded targets should be flat, any deformations should be avoided, (2) coded targets should be circles with black and white segments, so you have to cut them, (3) any changes in the coded target pattern must be avoided, and (4) once the coded targets are printed, they should be placed in the scene or around the object of interest so that they can be clearly seen from at least of couple or images.
The size of the coded targets should not be too big or too small compared to the object or scene. It is recommended that the size of central black circle-point on the taken photo is not greater than 30 pix [
34].
The proposed method has the capability of detecting and matching coded targets on images automatically, which will result in time savings comparing to the manual identification and matching of markers. Using this feature, coded targets can be used as a reference point registered in the form of coordinates in the project site. These data are used in the photogrammetric process to produce photogrammetric models with an accurate scale of 1:1.
Step 2: Image acquisition from indoor and outdoor
In this research, photogrammetric imaging is used to generate 3D models. The photogrammetric imaging using the camera is more inexpensive and accessible comparing to other methods such as laser scanners. The close range photogrammetry offers an economical, flexible, reliable, precise and fast way to produce 3D models of two-dimensional images [
32,
35,
36]. The completeness of 3D reconstruction for indoor and outdoor progress monitoring can be improved via some special considerations such as better camera registration. Therefore, more complete point clouds are achieved.
Step 3: Target detection and define their coordinates
The coded targets are fully automatically detected from the captured images. In this approach, the targets are used as reference points for the object coordination system.
Step 4: Running SFM and MVS on the images to generate dense point cloud
There are various methods to generate point cloud using two-dimensional images. In this research, SFM and MVS algorithms is used to generate as-built 3D point clouds. SFM has emerged recently as an inexpensive method for extracting the 3D structure of a scene from multiple overlapping photographs using bundle adjustment procedures [
37,
38]. SFM is the process of estimating three-dimensional structures (e.g., sparse point cloud) from a set of two-dimensional images. It includes camera pose estimation, triangulation, and global optimization [
39]. SFM algorithm detects key point (e.g., edge point) and follows their motion in a sequence of images. This information is used as an input and the position of the point is estimated and a sparse three-dimensional point cloud is generated. It should be mentioned that the camera position should be estimated accurately in this algorithm [
40,
41].
The output resulted from SFM is a spars point cloud. To achieve a dense point cloud from the calibrated set of images that are available, MVS algorithm is used in this research. The internal and external camera orientation parameters, including non-linear radial distortions, were derived using only the camera type and focal length information included in the image’s EXIF metadata. PhotoScan uses a greedy algorithm to find approximate camera locations and refines them later using a bundle-adjustment algorithm [
42]. The implementation procedure in the MVS include matching, expansion, and filtering. In the matching step, key points (such as corners) are found and several other images are matched. If specific matching algorithms (e.g., MVS) are going to be used for dense matching, the images should be rectified with the relative orientation parameters estimated in the second step. Corresponding image measurements extracted from the network are then used to compute approximate 3D coordinates which can be inserted into a bundle adjustment with the relative orientation parameters of the stereo camera as geometric constraints. If a bundle adjustment supporting such constraints is not available it is possible, but less optimal in terms of error propagation, to compare the known base line of the camera against the computed mean image pair separation and apply a suitable scale factor. After resolving the scale with one or two iterations, the vantage images are clustered and selected, input into the dense point cloud is processed and finally a surface mesh is provided using surface reconstruction and rendering packages. The stereo matching process is accomplished by searching for corresponding points in overlapping regions between two images. Dense image matching is a crucial step in the reconstruction process. In this step, corresponding pixels in two images are found. Methodologies have been conveniently categorized as window-based (local) and pixel-based (global) [
14,
43,
44,
45,
46,
47,
48]. With these initial adaptations, the expanding and filtering steps are repeated [
41,
49]. In the expansion step, initial matches are extended to nearby pixels to obtain a dense set of patches, and, in the filtering phase, incorrect matches are deleted by using visibility constraints [
14]. This process has five quality settings: Ultra High, High, Medium, Low, and Lowest. Ultra High quality uses full size image resolution; High uses 50% of the original scale, Medium uses 25%, Low uses 12.5%, and Lowest uses 6.75%. These percentages directly affect the total number of points in the dense cloud [
50]. Dense surface reconstruction was based on the optimized camera positions. Pair-wise depth maps were computed for each image and combined into a final dense point cloud. The dense point cloud was further used to build a mesh for the final model [
42]. Finally, the targets were used in the project to reduce errors and increase the accuracy.
3.2.2. SFM/CMVS/PMVS Algorithm
SFM/CMVS/PMVS approach includes three steps: (1) Running SFM on the captured images, (2) cluster and select vantage images using CMVS, and (3) dense point cloud generation using PMVS. Each of these steps are explained in the following section.
Step 1: Running SFM on the captured images
SFM creates 3D data from 2D images by: (1) Identifying unique features contained within each image in the set; (2) identifying the common features between overlapping images. For the successful completion of the reconstruction task, it is crucial to guarantee enough image overlap across the input dataset. The requirement can be put in the following figures: sixty percent of side overlap + 80% of forward overlap at least; (3) determining camera positions by minimizing the distance between common features; (4) using Multi-View Stereopsis to reconstruct the 3D scene. Cluster and select vantage images using CMVS dense point cloud generation using PMVS [
51].
Step 2: Cluster and select vantage images using CMVS clusters and select the optimal viewpoint through a four step iterative procedure including merging the sparse point cloud generated with Structure from Motion, removing low quality images, clustering images into smaller components using a Normalized Cuts algorithm [
52] and finally adding images to weak clusters. Because CMVS was designed for extremely large photo collections (e.g., more than 10,000 photos uploaded to the internet), it ignores many metric constraints considered in photogrammetric network design [
53].
Step 3: Dense point cloud generation using PMVS
One of the most accurate and complete algorithms is Patch-based Multi-View Stereo (PMVS) [
49,
54] which results in a dense point cloud model by using the output of Bundler [
49]. PMVS uses undistorted images, the orientation parameters of these images, a sparse set of point and the projection matrices to determine a dense and accurate set of rectangular patches. The implemented procedure in PMVS includes matching, expansion and filtering steps [
14].
3.3. CAD Model Generation from Point Cloud (As-Built BIM)
The output of last step is dense point cloud. To compare the as-planned and as-built model, a CAD model is required. The traditional measurement tools for as-built data acquisition are laser distance meters, digital cameras, and measuring tapes [
28]. To generate as-built BIM from point cloud we need boundary tracing. In this paper, fully automatic boundary tracing is proposed. Point cloud is imported to Geomagic software and is then converted to a triangular surface mesh. This process specifies model boundaries exactly. Using the produced mesh model, the as-built BIM model is generated with a high accuracy using Autodesk Revit.
3.4. Comparing As-Planned and As-Built Models
Having generated the CAD model of project, the as-planned and as-built BIM could be compared. In this research, the as-built state of the project is determined quantitatively. For this purpose, the quantities of performed work is determined from the generated as-built point cloud model. The results of comparing the as-planned and as-built models is used to update the schedule.
4. Experiments
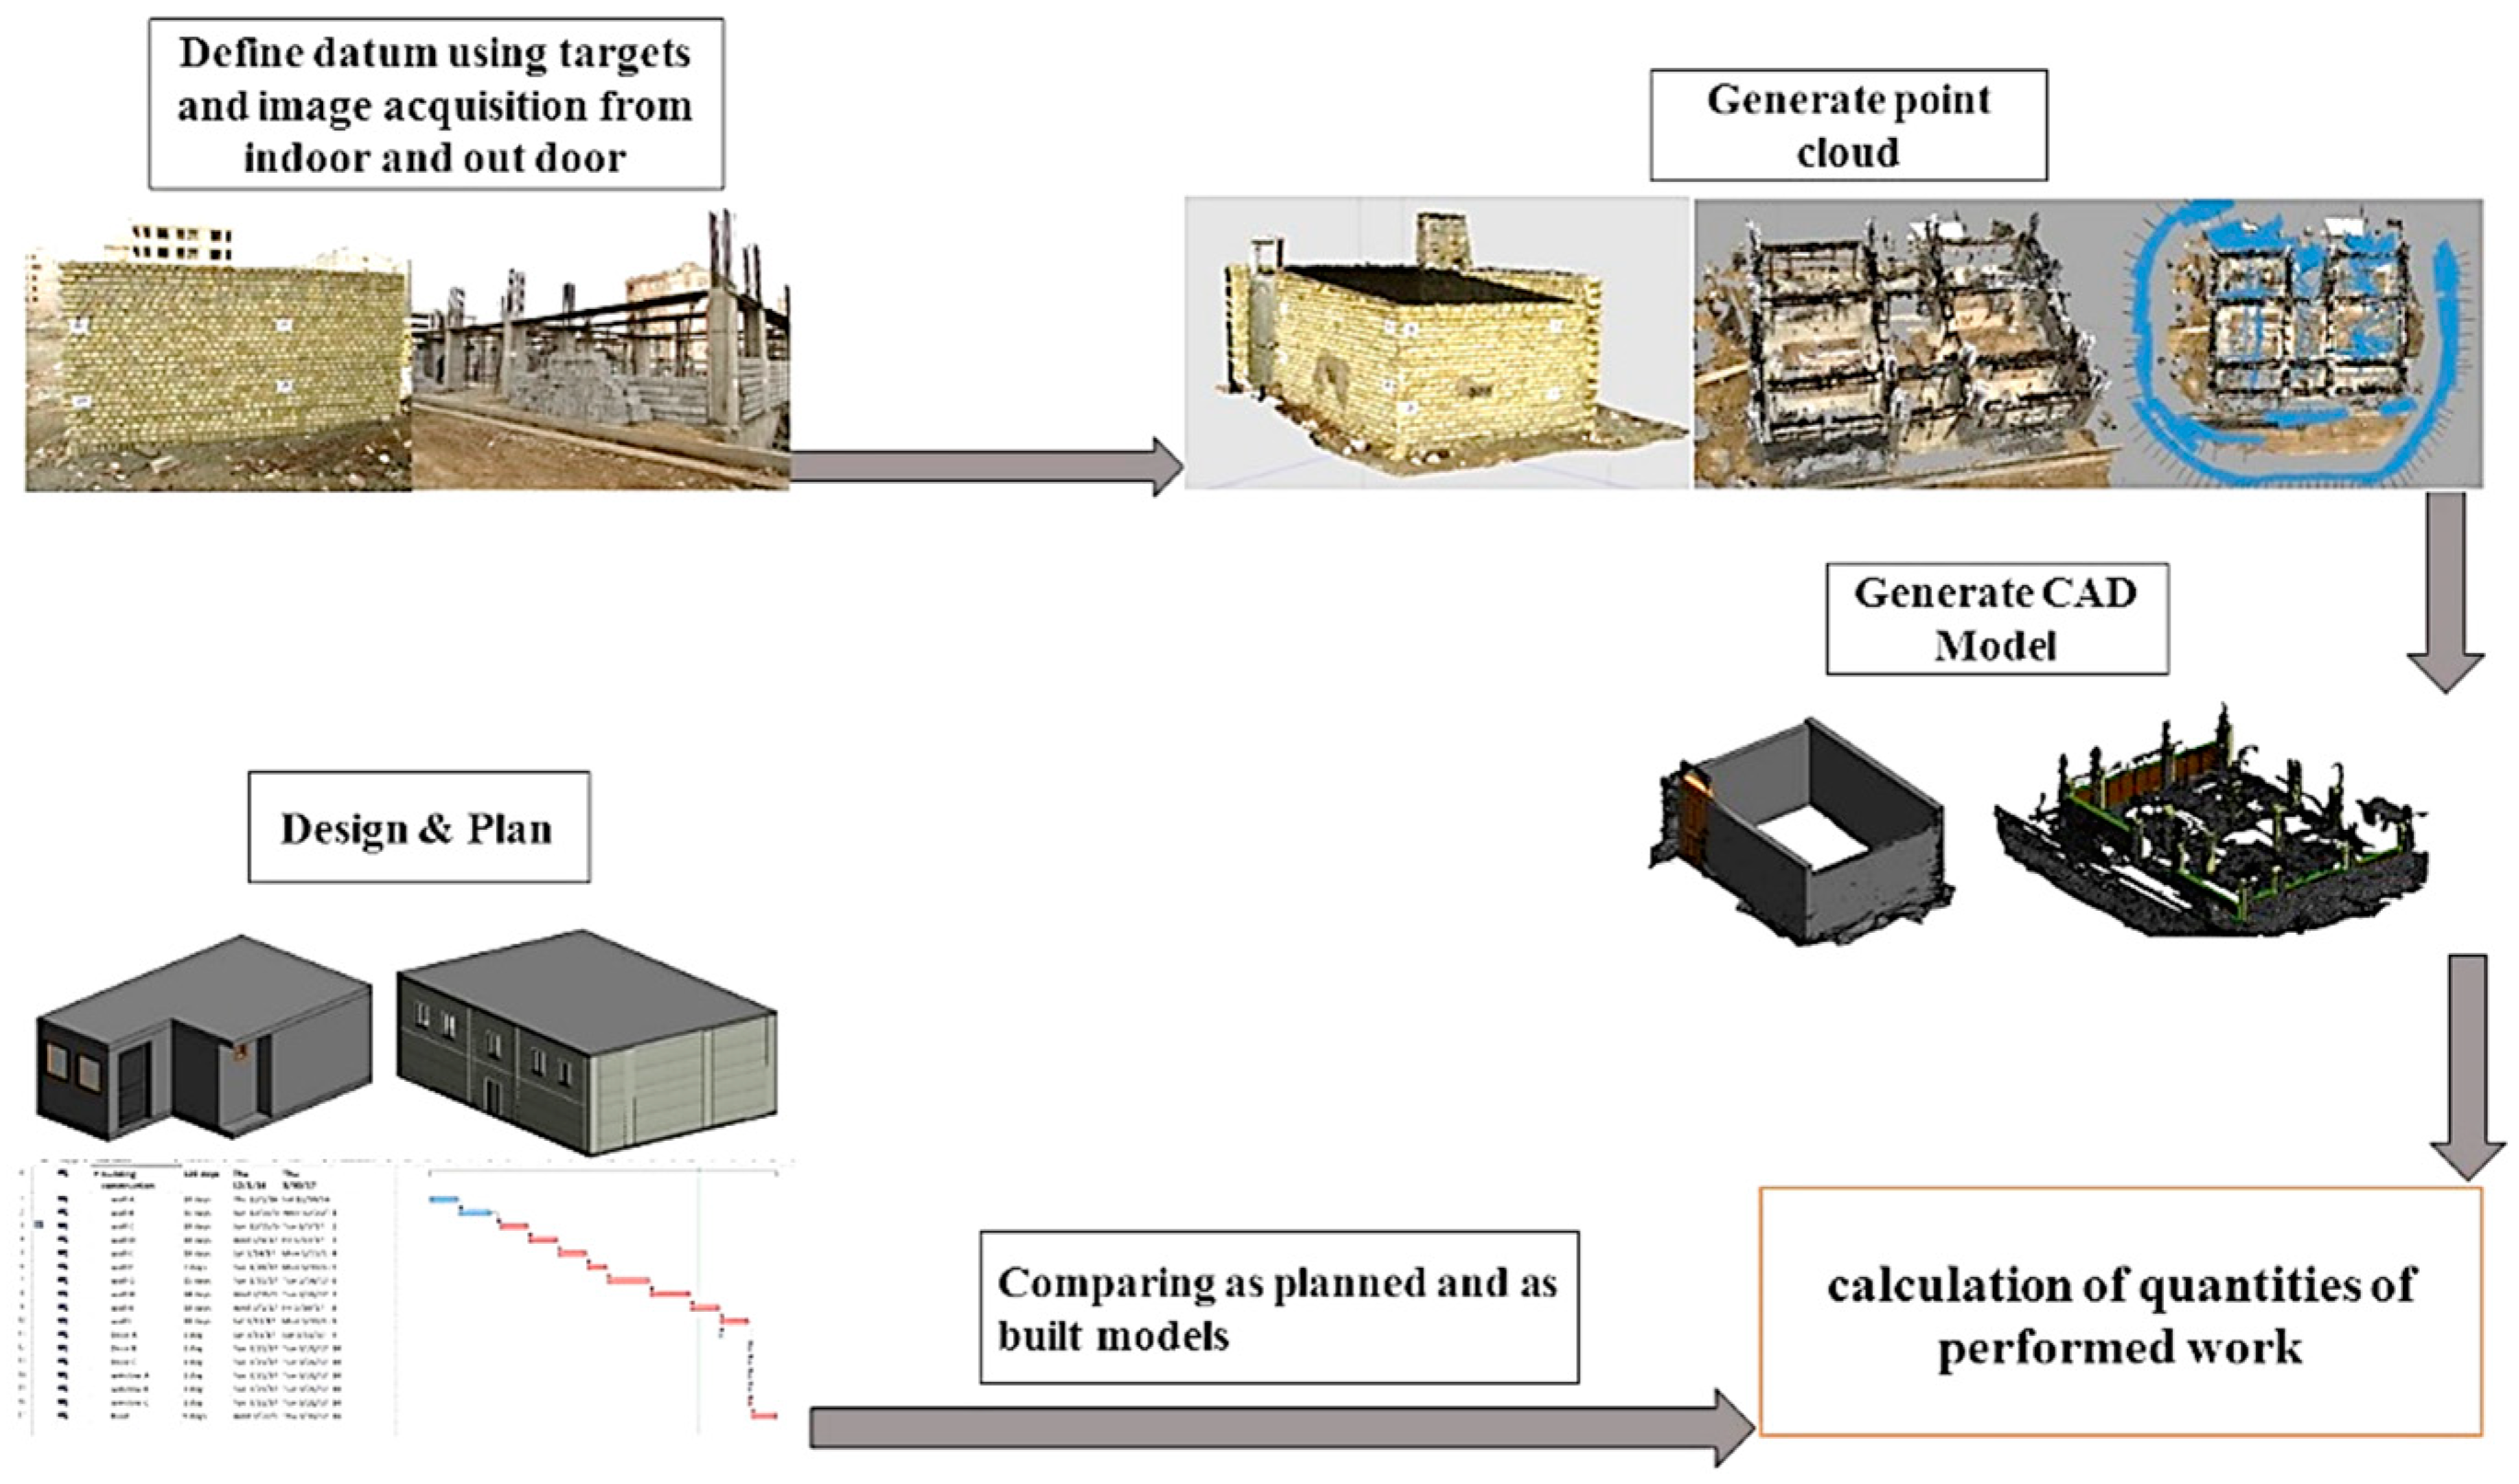
To evaluate the applicability and performance of the proposed SFM/CMVS/PMVS and photogrammetric Multi-View Stereo approaches, they were implemented on two real case study projects and the construction progress was monitored automatically. Both of case studies were located in Tehran Province, Iran which has a semi-dry, continental climate (Köppen Klimaklassifikation: BSk). The coded targets were used and the images were captured from the project site at particular point of time throughout the project duration. Then, the images were converted to 3D point cloud model using the proposed method and SFM/CMVS/PMVS. Having the generated points cloud, the as-planned model was produced using Autodesk Revit software. Finally, the quantities of executed and remained work were calculated. Therefore, the actual state of the project could be compared with the as-planned state to evaluate the deviations (
Figure 2).
To image acquisition for 3D reconstruction, the Canon IXUS 150 with the characteristics shown in
Table 1 was used. The characteristics of computer system used to process the data has also been given in
Table 2.
The coded targets are markers that could be put around the object before the images are taken. To build a correct and complete 3D point cloud model, Agisoft Photo Scan needed pictures from the whole object. This meant that a photographer had to move around the object.
The model scale issue could be resolved by installing the targets around the object. The target characteristics and size are defined using the following equation:
where,
F is focal length,
D is camera distance to object, t is the number of photo’s pixels which usually takes the value of 30 and
T is the target size. In the studied project,
D = 300 cm,
F = 56 mm,
t = 30. Considering these values,
T is calculated as 16.1 mm (
Figure 3).
In this research, 16 targets were used in the first case study and 6 targets were used in the second case study. The dimension of the coded targets were 210 × 148 mm and targets were prepared using printed papers.
To achieve the most appropriate results for image-based 3D reconstruction, the camera’s settings should be defined depending on the surrounding environment condition in which the image capturing is done. In the studied project, shutter speed was set on 1/8, diaphragm was set on f/3.2, ISO was 200, and focal length was chosen as 56 mm.
In this research, photoscan as an advanced image-based 3D modeling tool was used to generate high-quality 3D content from the images using SFM and MVS algorithms.
In this method, image alignment and 3D modeling is performed fully automatically. First, the photos are aligned. Then, a sparse point cloud is generated and after that a dense point cloud is created.
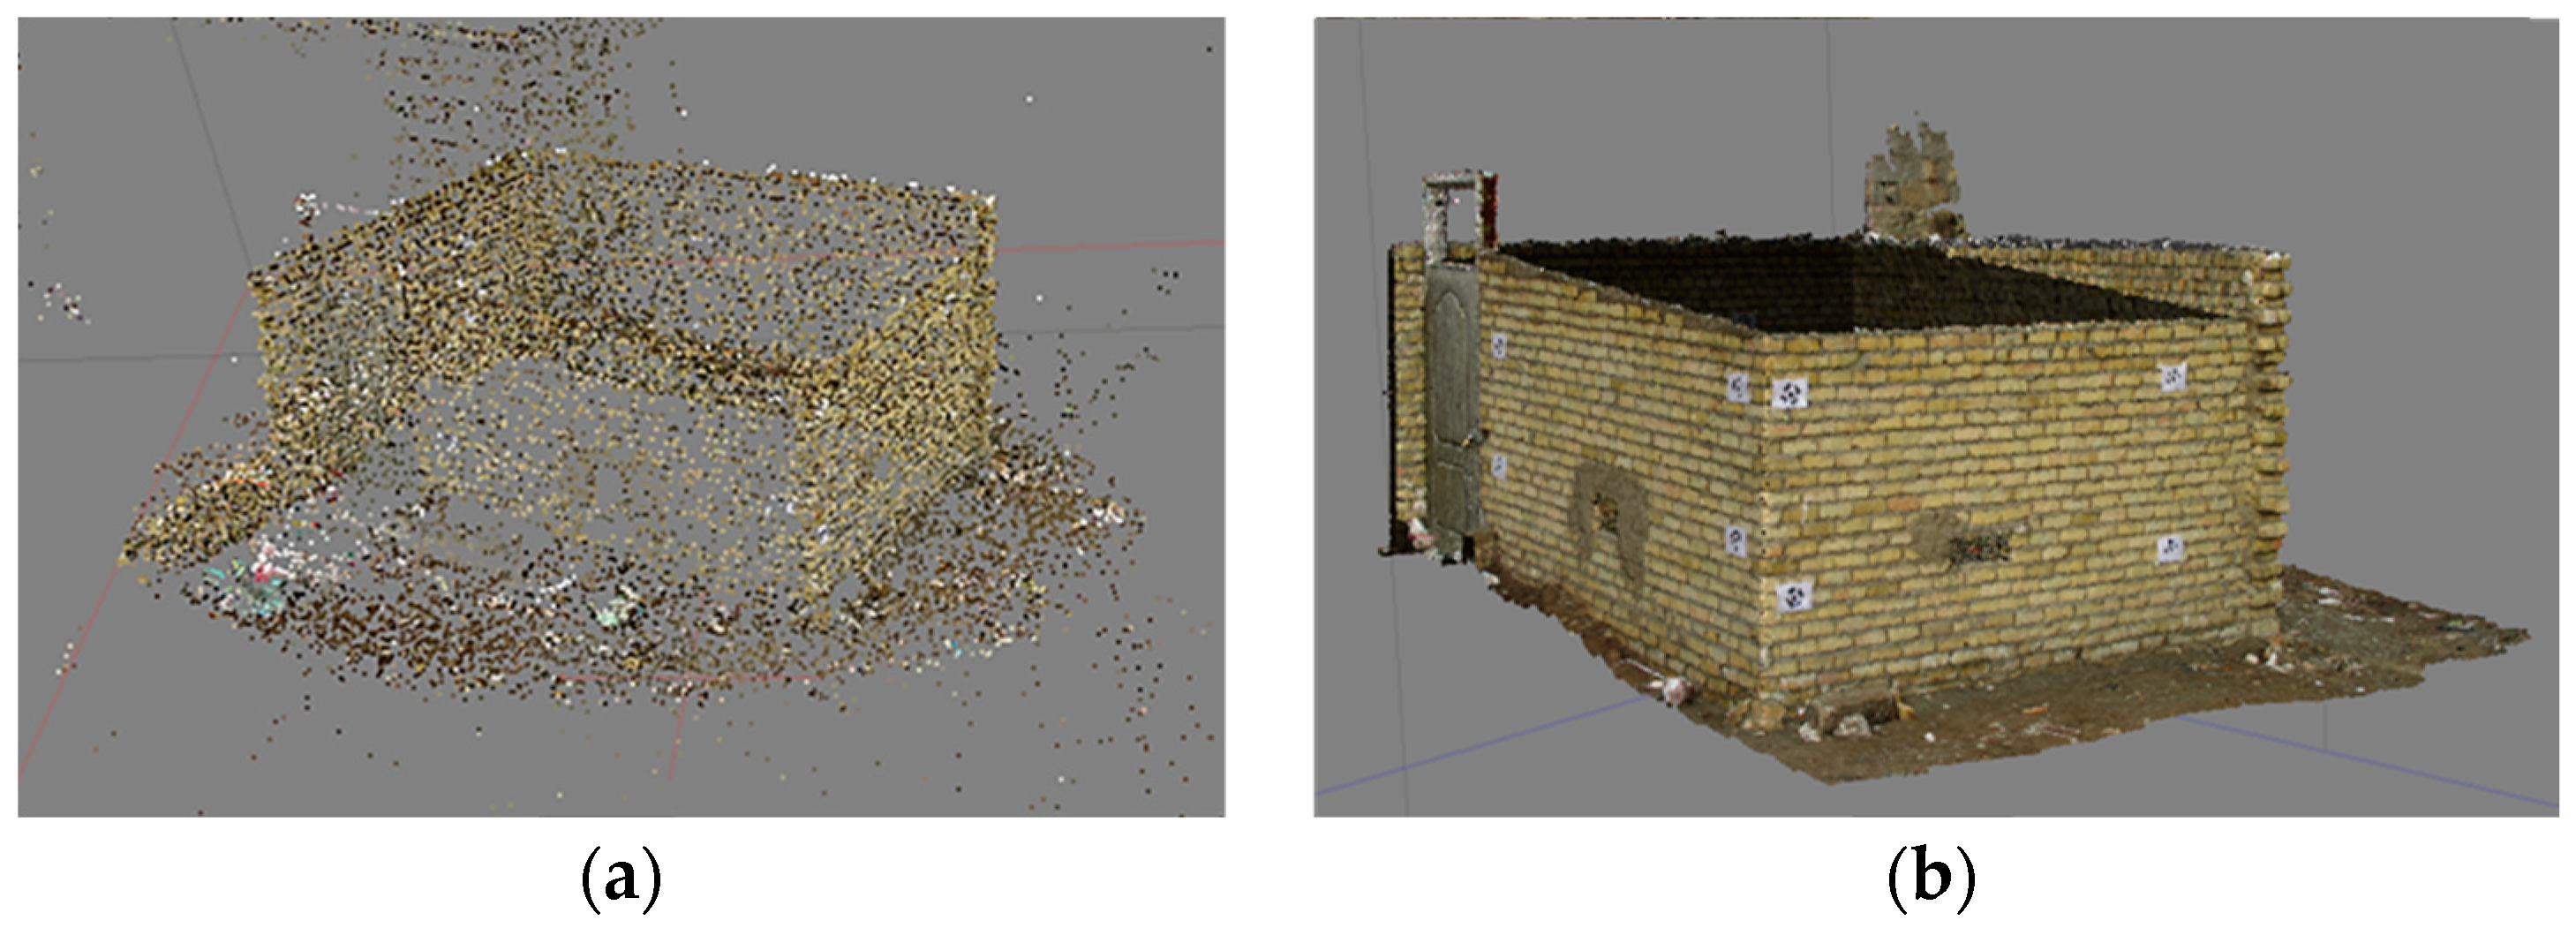
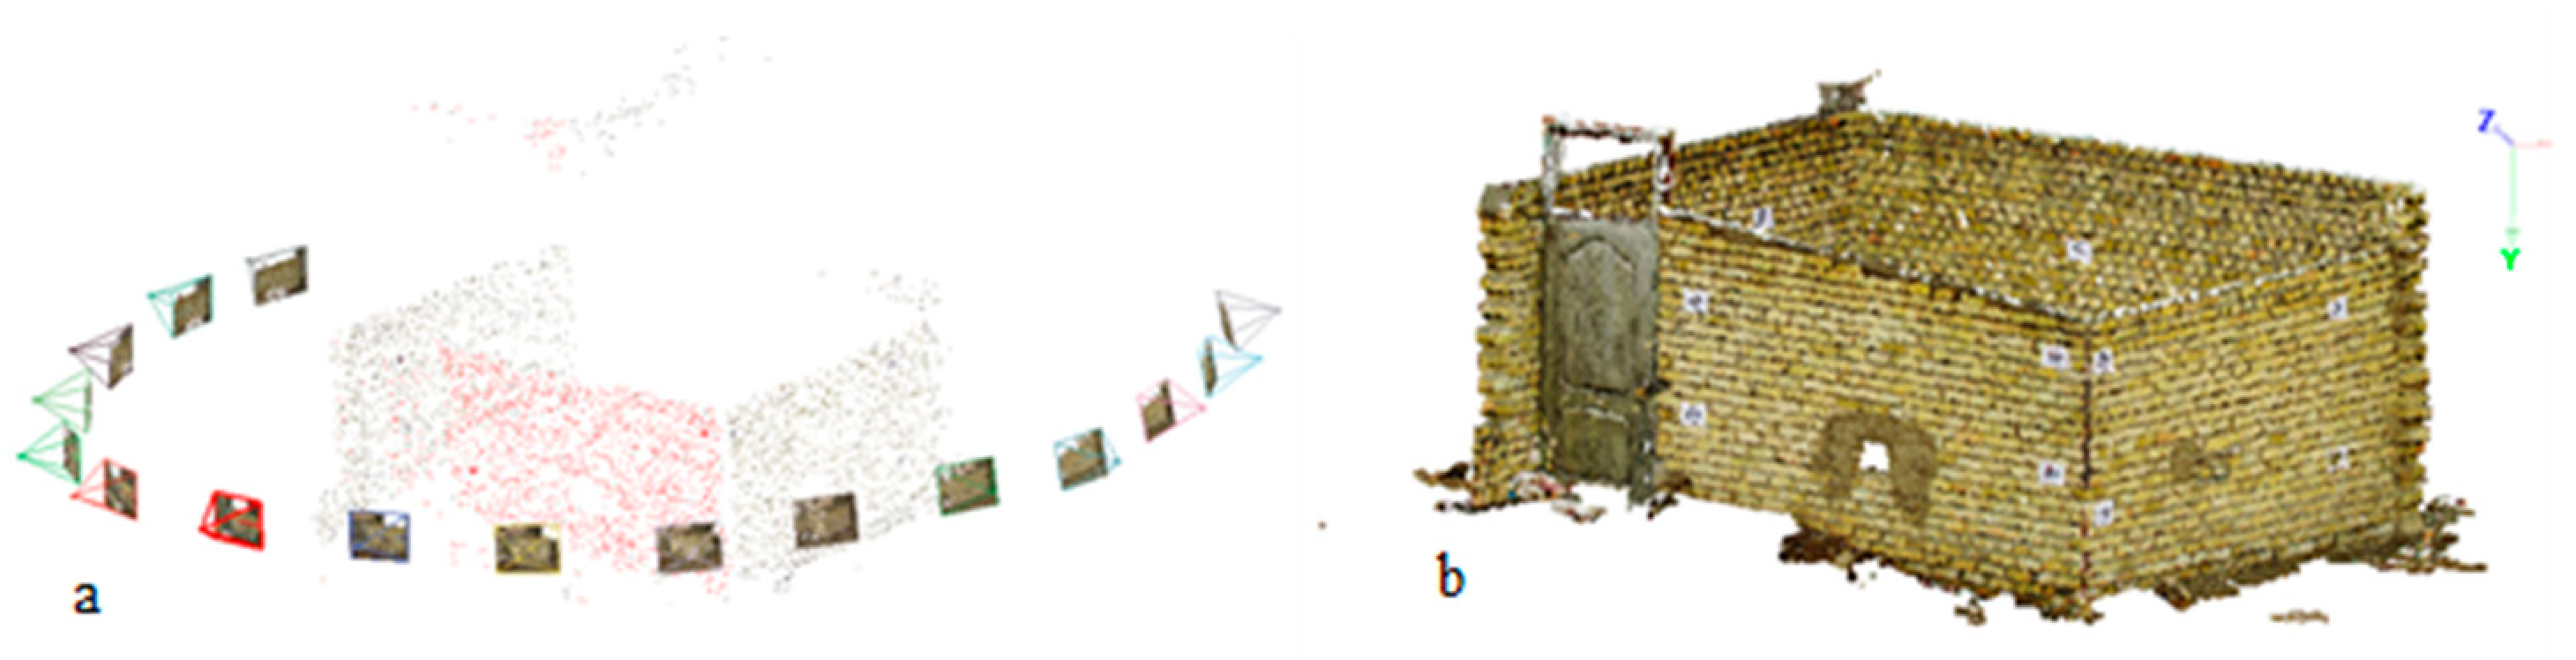
Figure 4 and
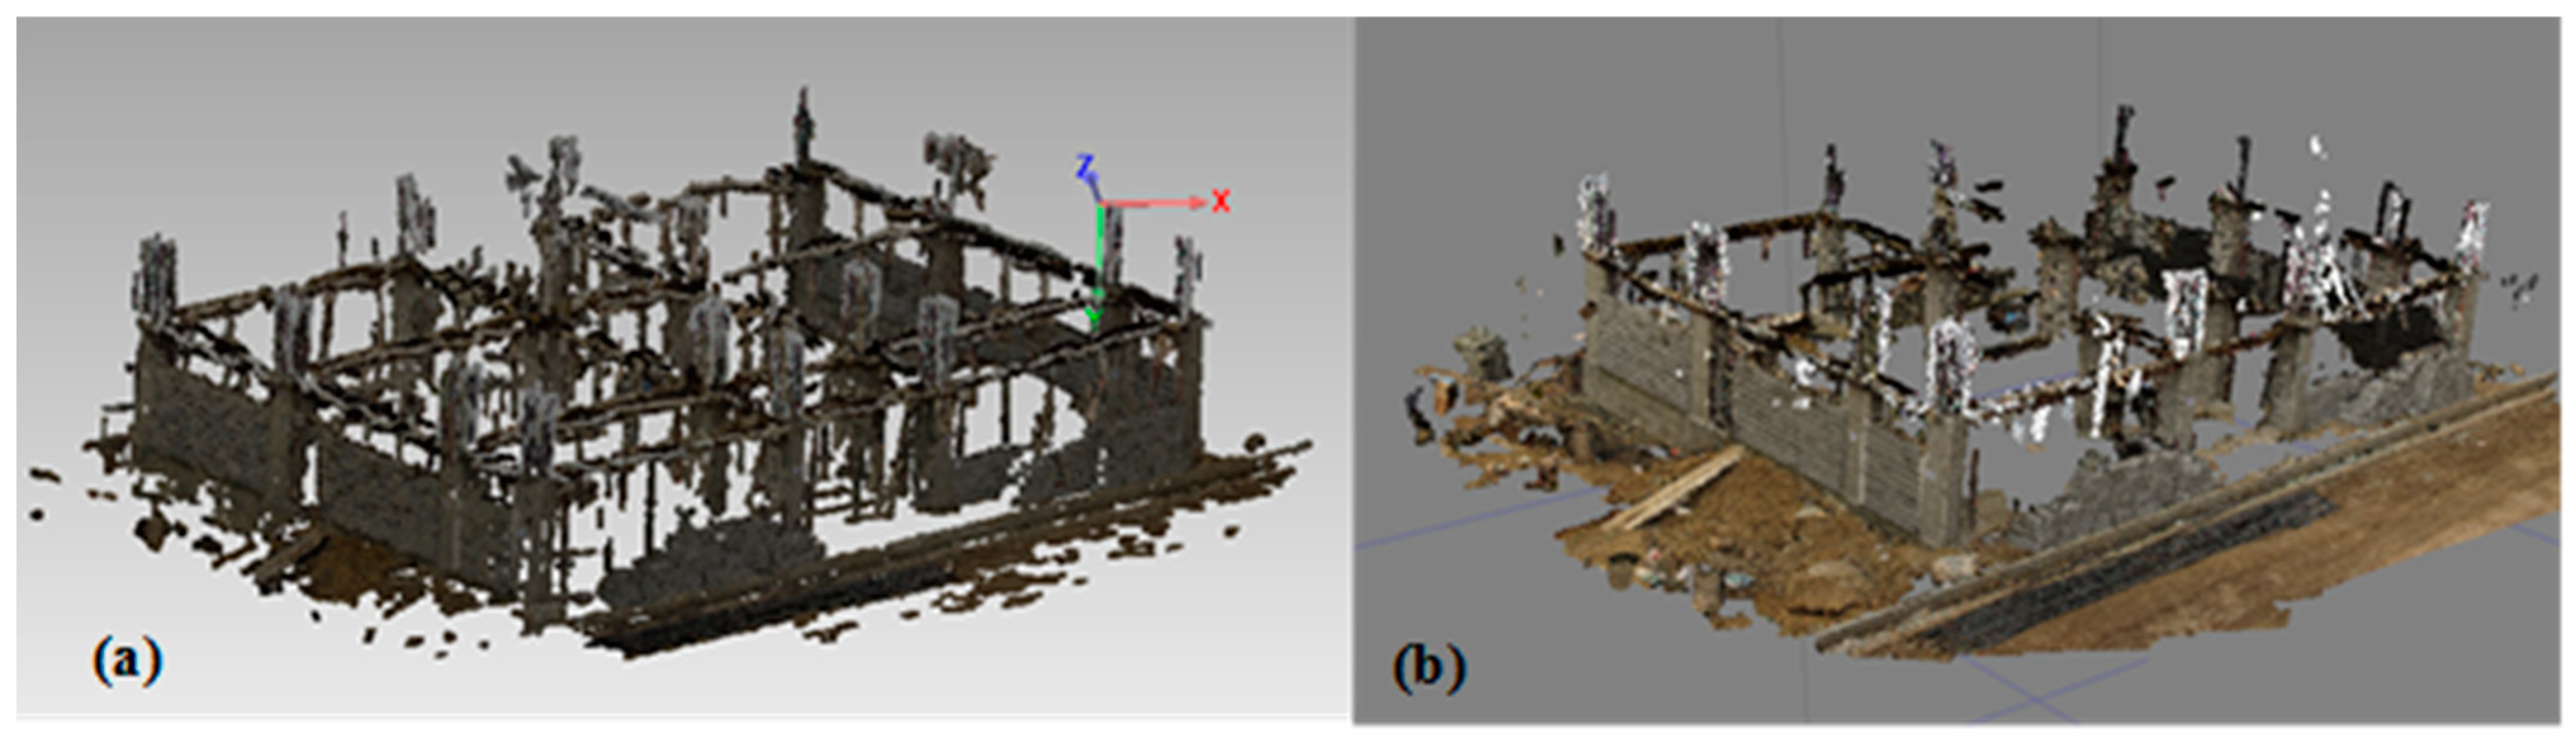
Figure 5 represent the generated sparse and dense point cloud for two studied projects. The dense point cloud generation is done by photoscan based on the location of cameras and photographs. The 3D model can specify the accurate position of targets automatically and generates a 3D model with the scale of 1:1 consistent with the global coordinates. In the studied projects, utilization of targets aids to increase the accuracy of generated point could 3D model as will be discussed in the next section. According to the estimated position of the camera, the depth map for each camera is computed.
The point cloud model generated for the second case study did not support the desired completeness for automated progress monitoring. As shown, indoor building components such as the floor and the internal elements were reconstructed imperfectly or incompletely.
There have been several researches conducted for outdoor progress monitoring. However, very limited research has been done in the area of indoor progress monitoring in which either image processing methods or lasers scanner, not the photogrammetry has been used [
23,
28,
29].
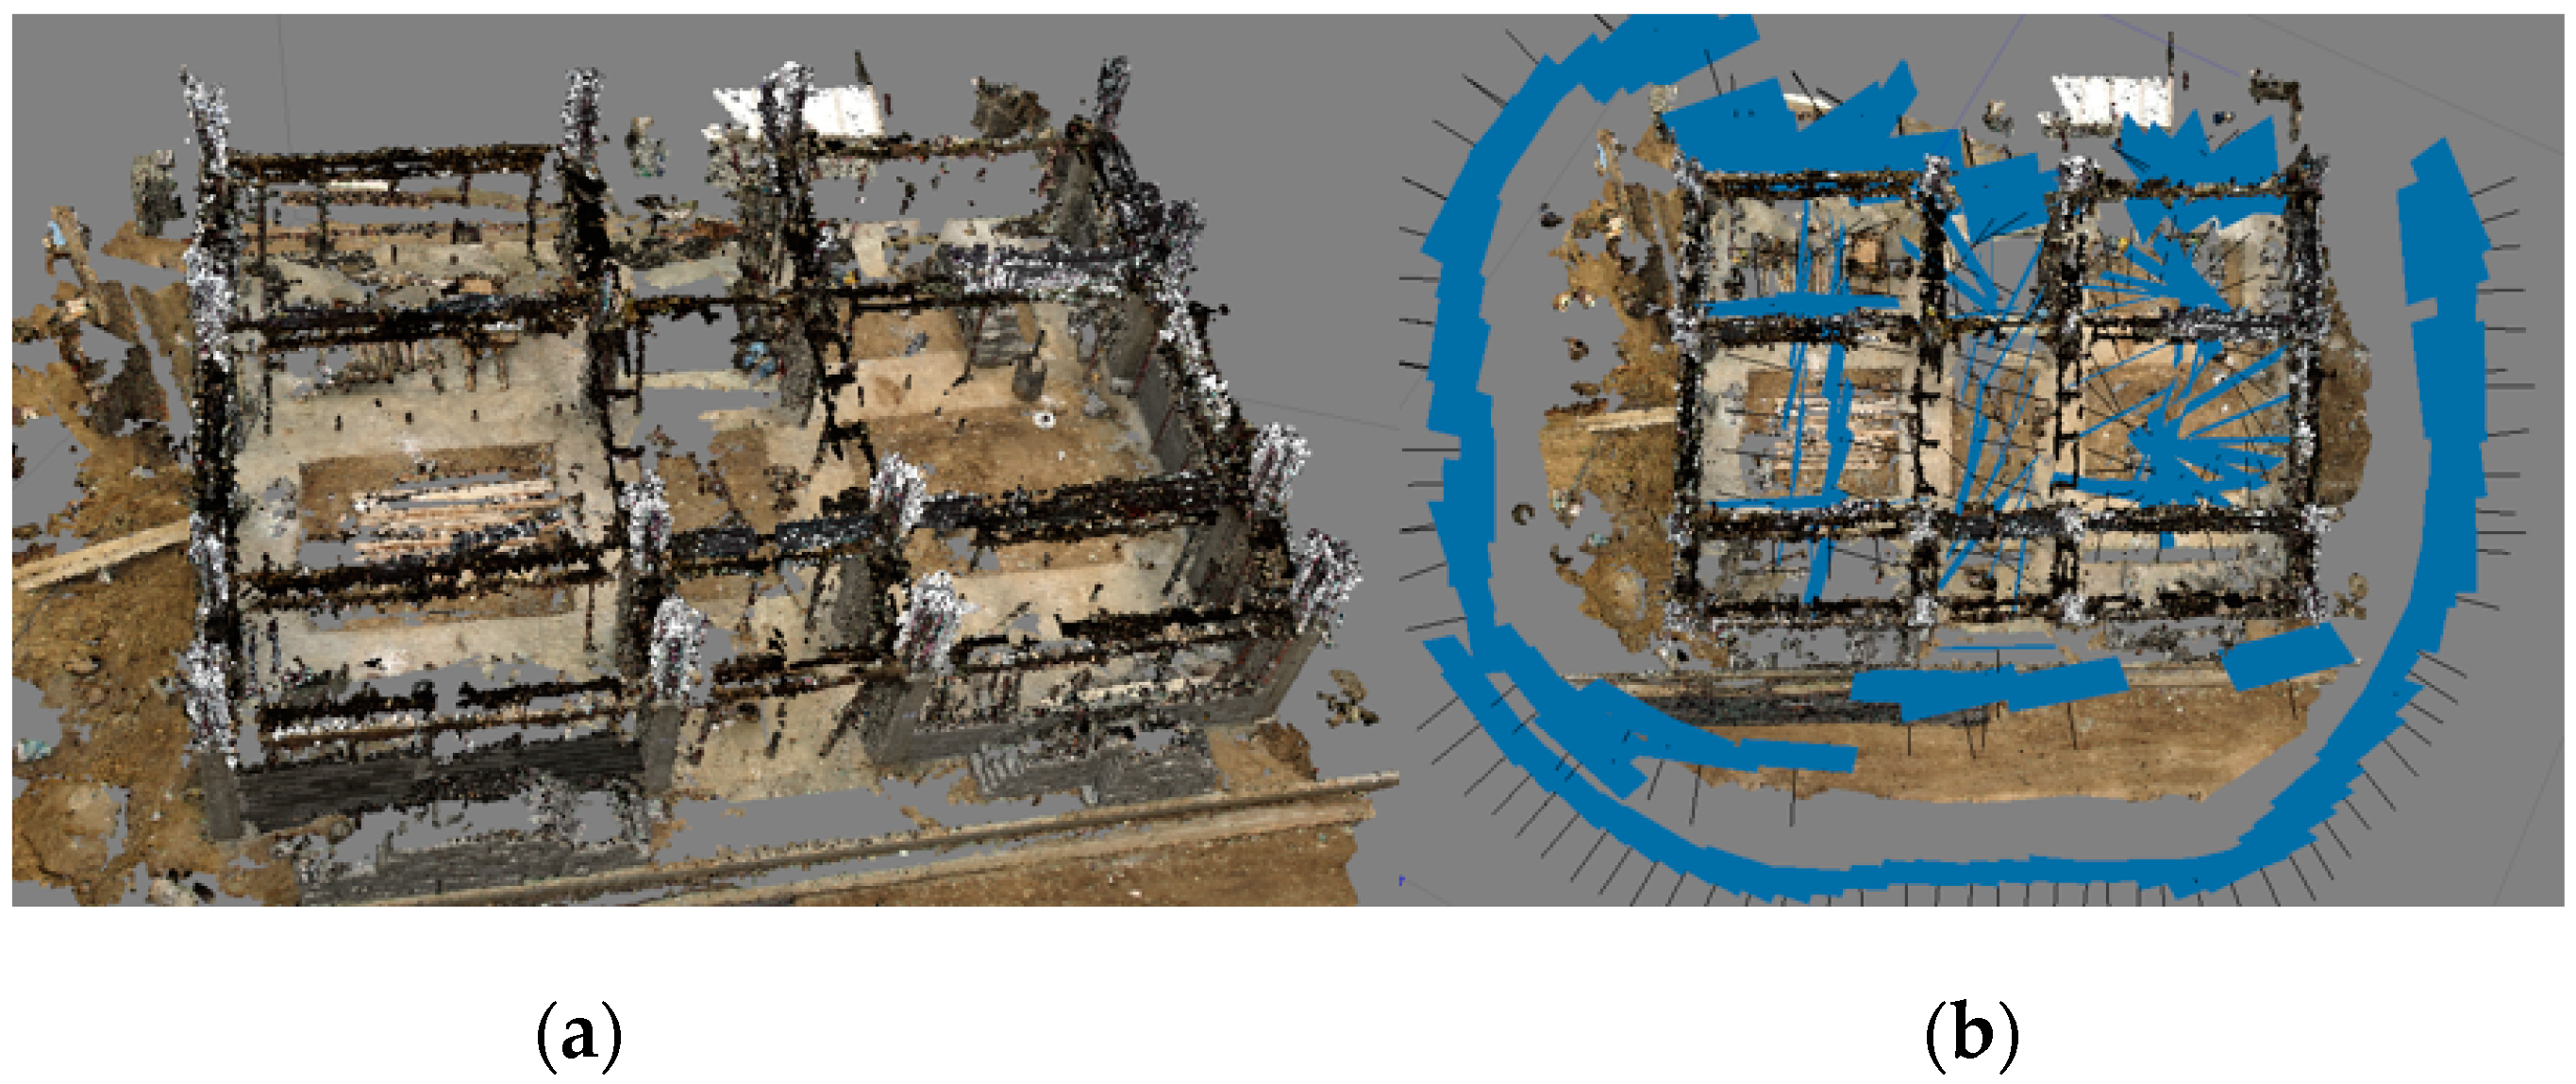
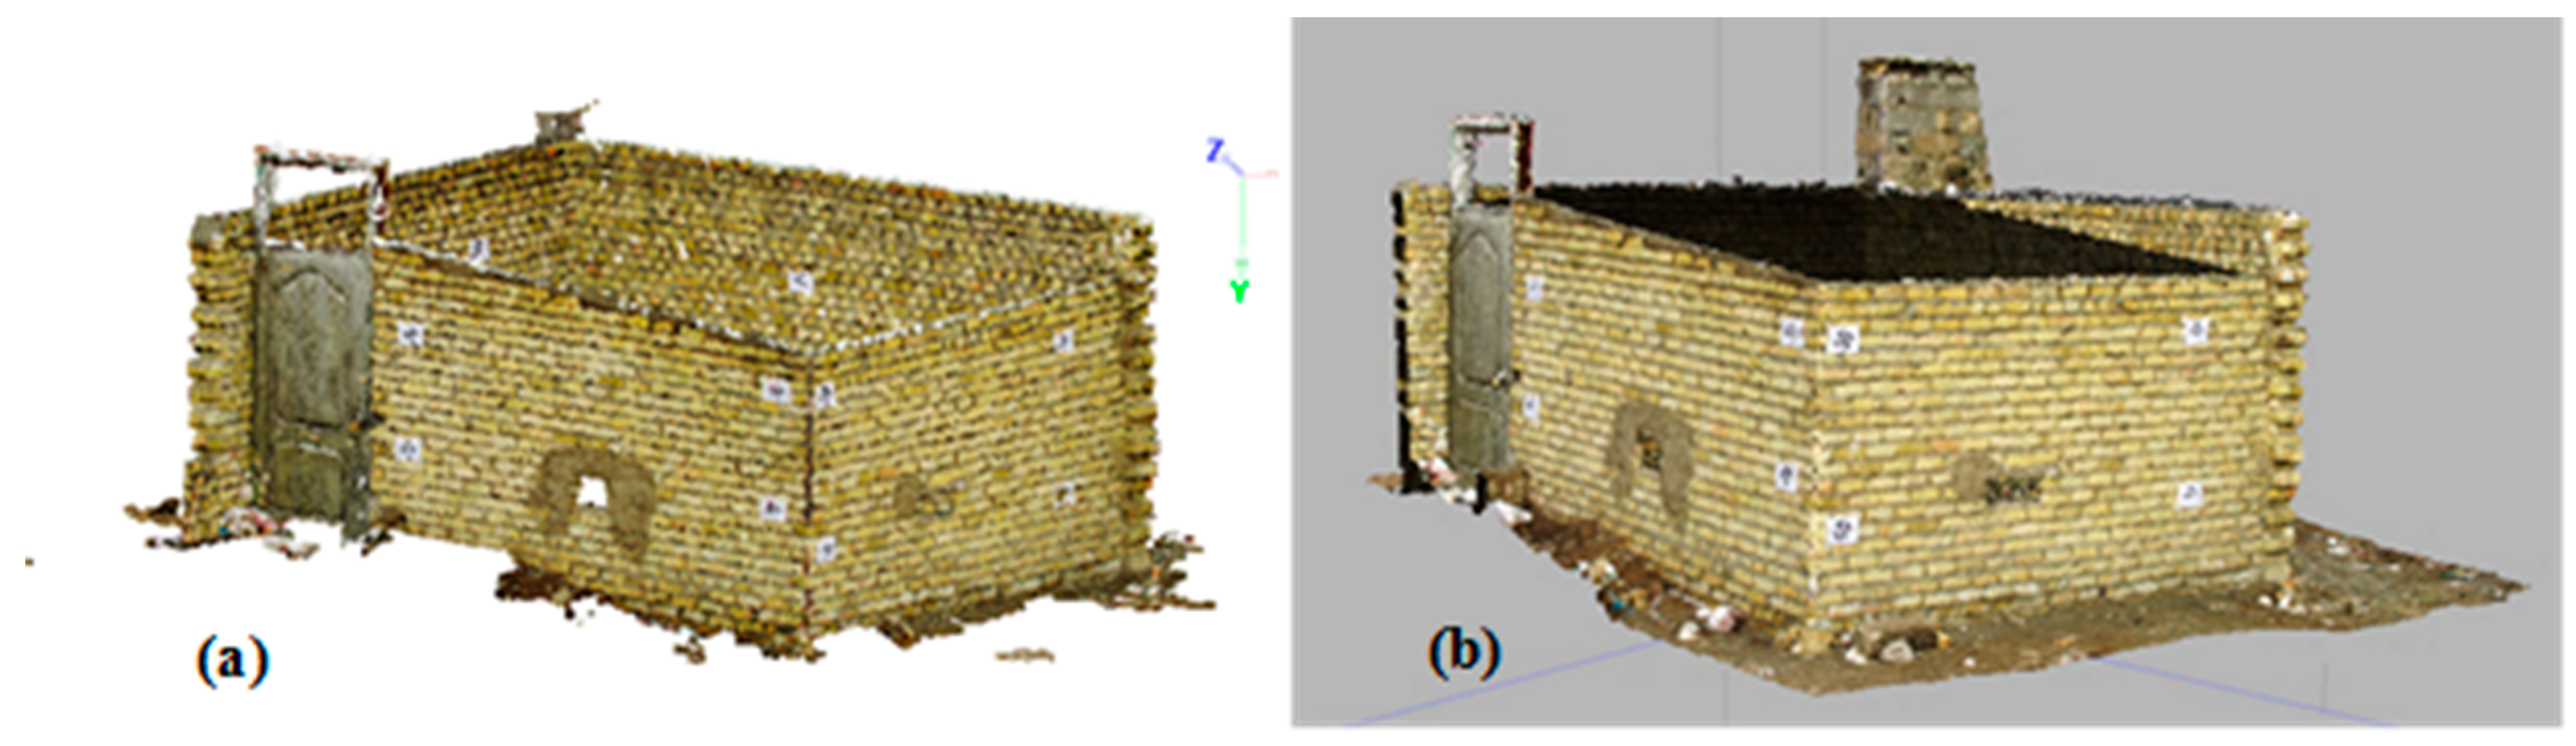
In this research, a SFM-MVS algorithm is used for indoor and outdoor progress monitoring to improve completeness in 3D reconstruction. To do this, images were captured from both the outside and inside of the building and some special considerations such as better camera registration were used to achieve more accurate and complete point clouds. Taking images from inside of the building must support the desired frequency or completeness. The distance from the object, enough illumination, an accurate camera angle and enough number of images must be provided. These considerations are depicted in
Figure 5. The improved point cloud together with the devised camera positions has been represented in
Figure 5.
On the other hand, to compare our approach against previous work we generated dense point cloud from two case studies with SFM/CMVS/PMVS. In this approach: (1) The images imported in the VisualSFM software, then the spars point cloud generated by SFM algorithm, (2) VisualSFM detected features in all images and performed matches, and (3) the CMVS algorithm was used to cluster images and then the PMVS algorithm was used to generate the dense point cloud. For correct scaling of the point cloud, we used AutoCAD software. By knowing the length of one of the walls, we manually scaled the point cloud. (
Figure 6 and
Figure 7)
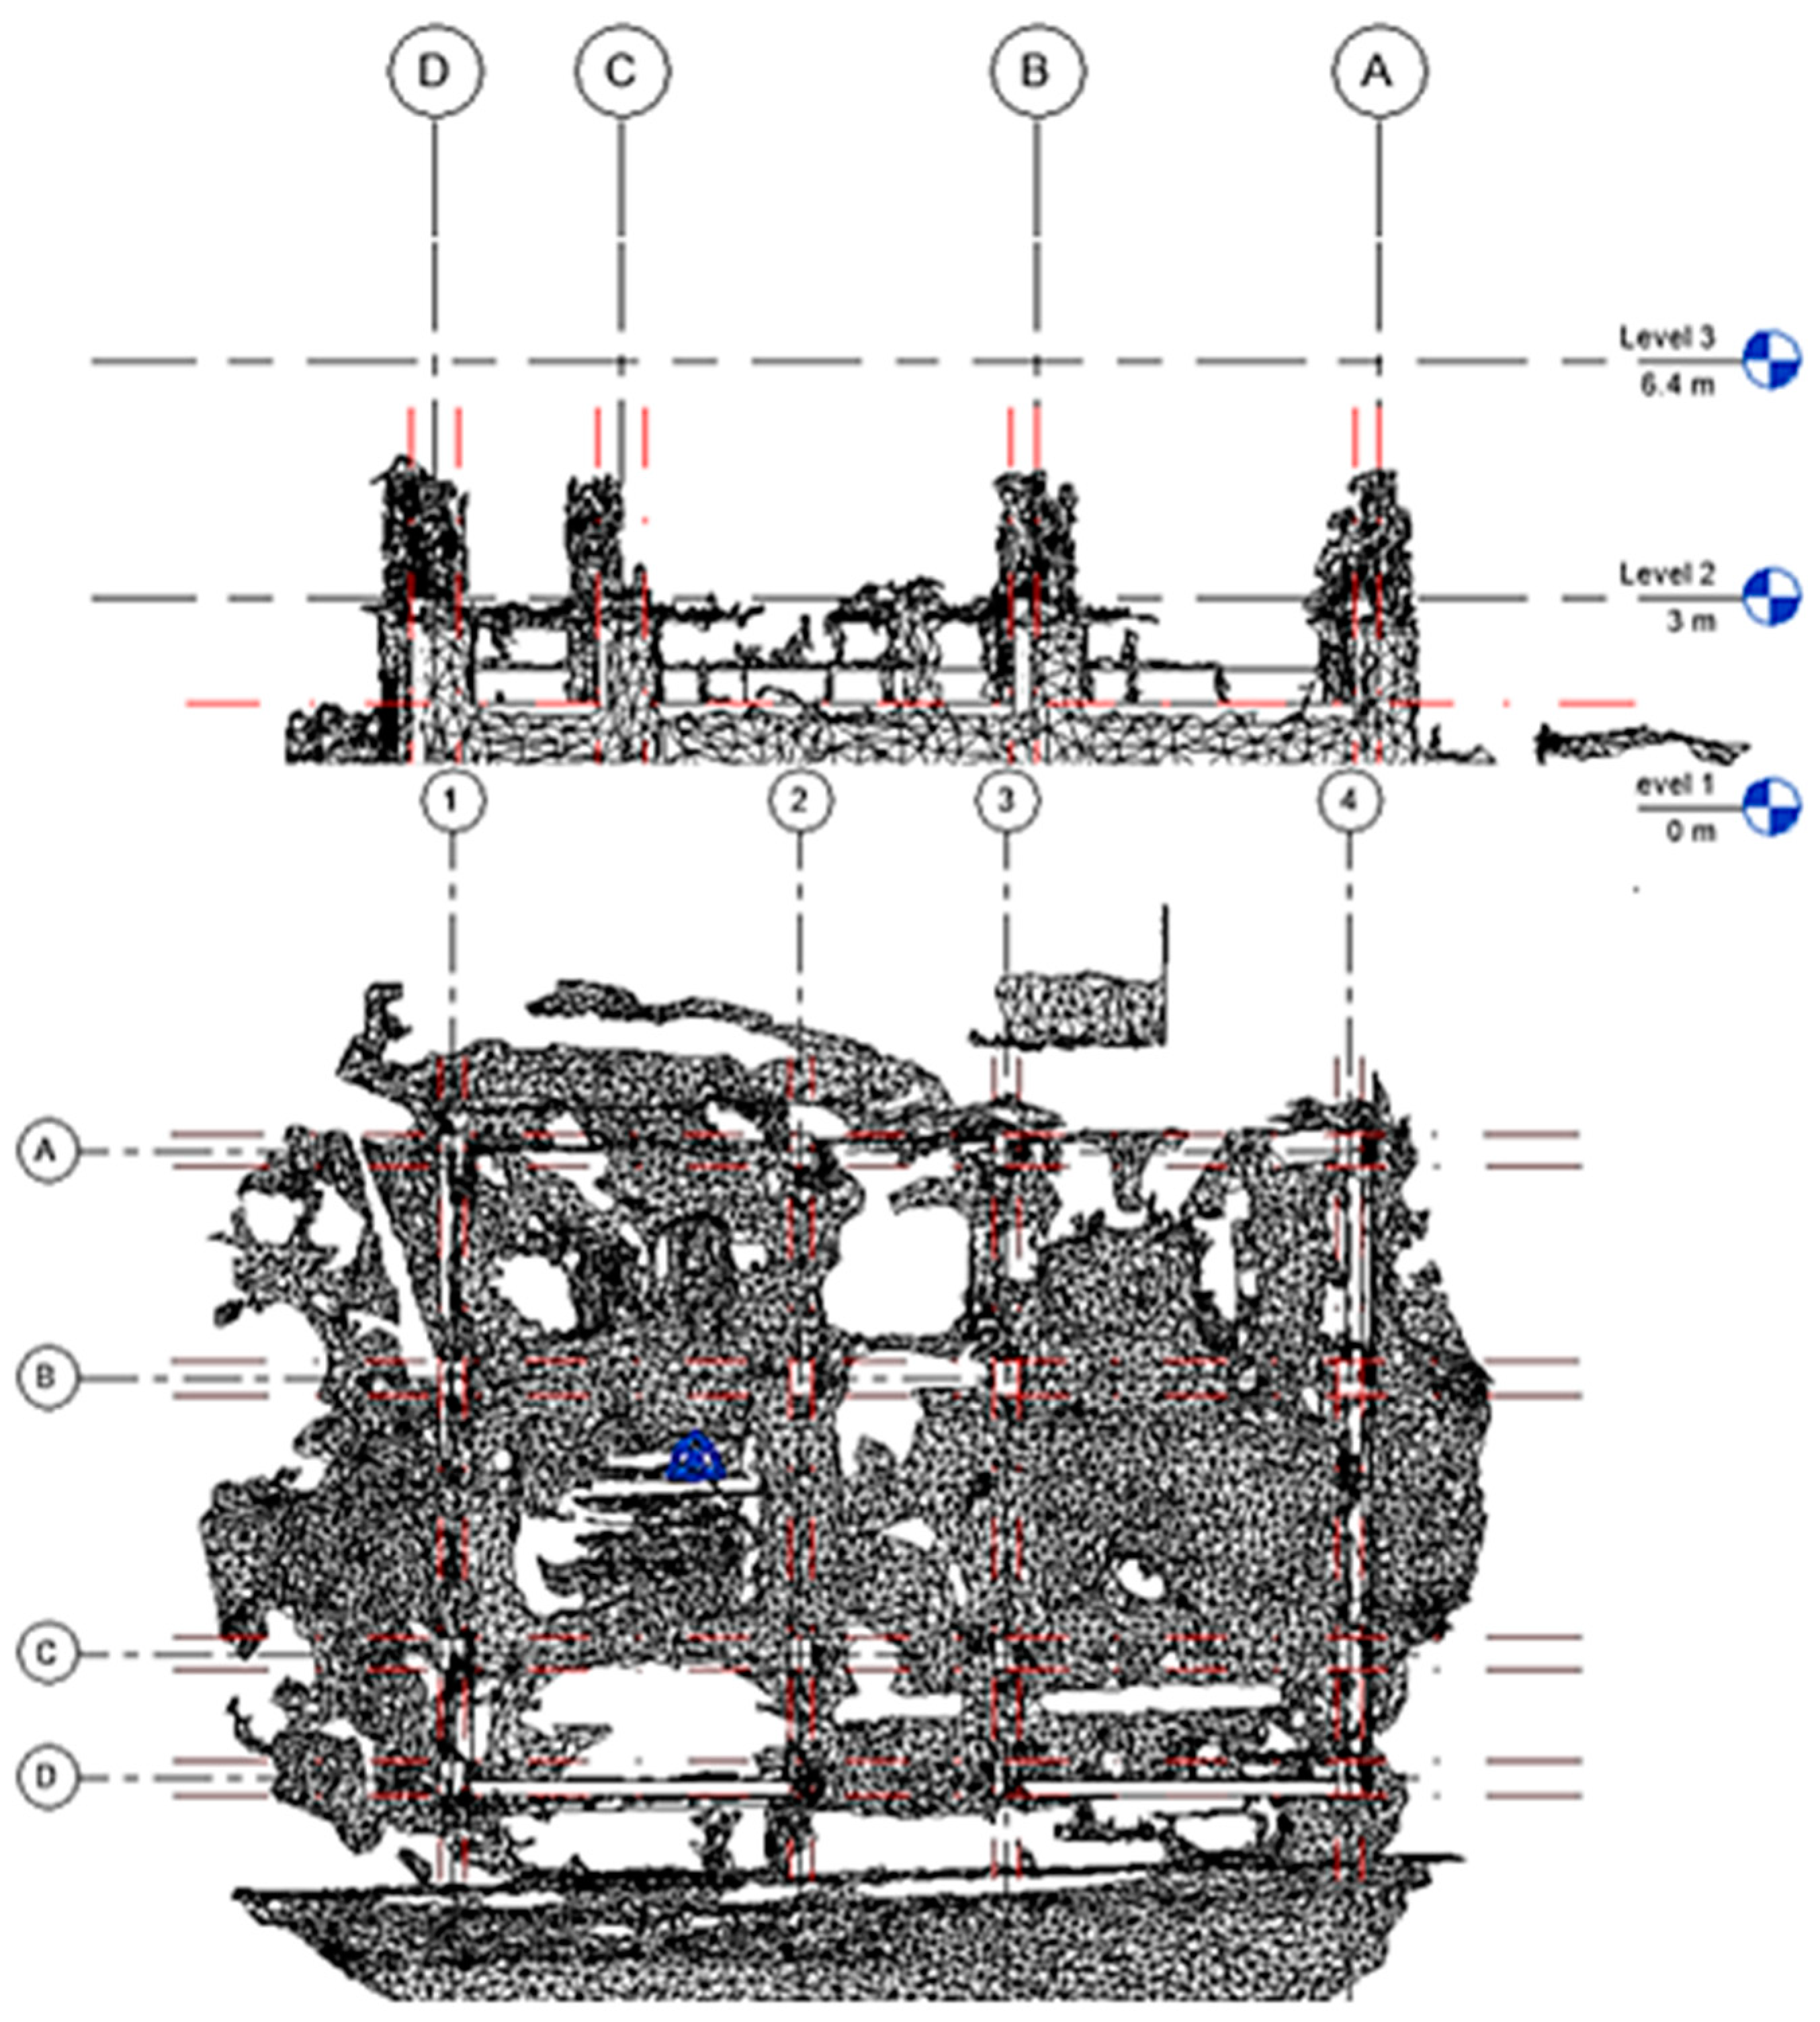
To compare as-planned and as-built models, the CAD model was generated for two studied projects. For this purpose, the dense point cloud model was converted to mesh model by Geomagic and Agisoft sofware. This process specified model boundary exactly and fully automatically. The mesh model was transferred to the Autodesk Revit Architecture and the as-built BIM model was constructed based on the dimensions of the generated point cloud achieved in the previous steps. To produce as-built model, edges of the mesh model were detected using reference lines. Then, the as-built model was produced based on the reference lines that showed placing of the building elements such as columns, walls and so on. The
Figure 8 shows the reference lines and the as-built model. These processes was done manually.
5. Evaluation
In this section, the results achieved by the proposed photogrammetric Multi-View Stereo method and SFM/CMVS/PMVS approach are compared based on three criteria, being the accuracy of the generated model, the amount of generated noises and the number of points of the generated point cloud.
5.1. The Accuracy of the Generated Model
In this section, the accuracy of the point cloud generated by the proposed photogrammetric Multi-View Stereo method is compared to SFM/CMVS/PMVS algorithm. For this purpose, the models generated by two methods were transferred to the Autodesk Revit Architecture with the scale of 1:1 and the as-built BIM models were generated.
To compare the accuracy of the point cloud generated by the proposed method against the previous studies, three measurement criteria were considered including the length and height of walls, the area of walls and the volume of walls. For this purpose, the quantities of performed work was determined in Autodesk Revit for both as-planned and as-built models (
Table 3). We compared the volume, area and length of elements one by one. The comparison of models was done manually. Since the comparison between the conventional SFM/CMVS/PMVS method and the proposed photogrammetric Multi-View Stereo method should be tangible, elements with a larger size were selected to show the merits and higher accuracy of the proposed method. In the case study projects, the walls were selected due to the aforementioned requirement. In
Table 3,
Table 4,
Table 5 and
Table 6, the results achieved by the proposed method are compared with the SFM/CMVS/PMVS algorithm.
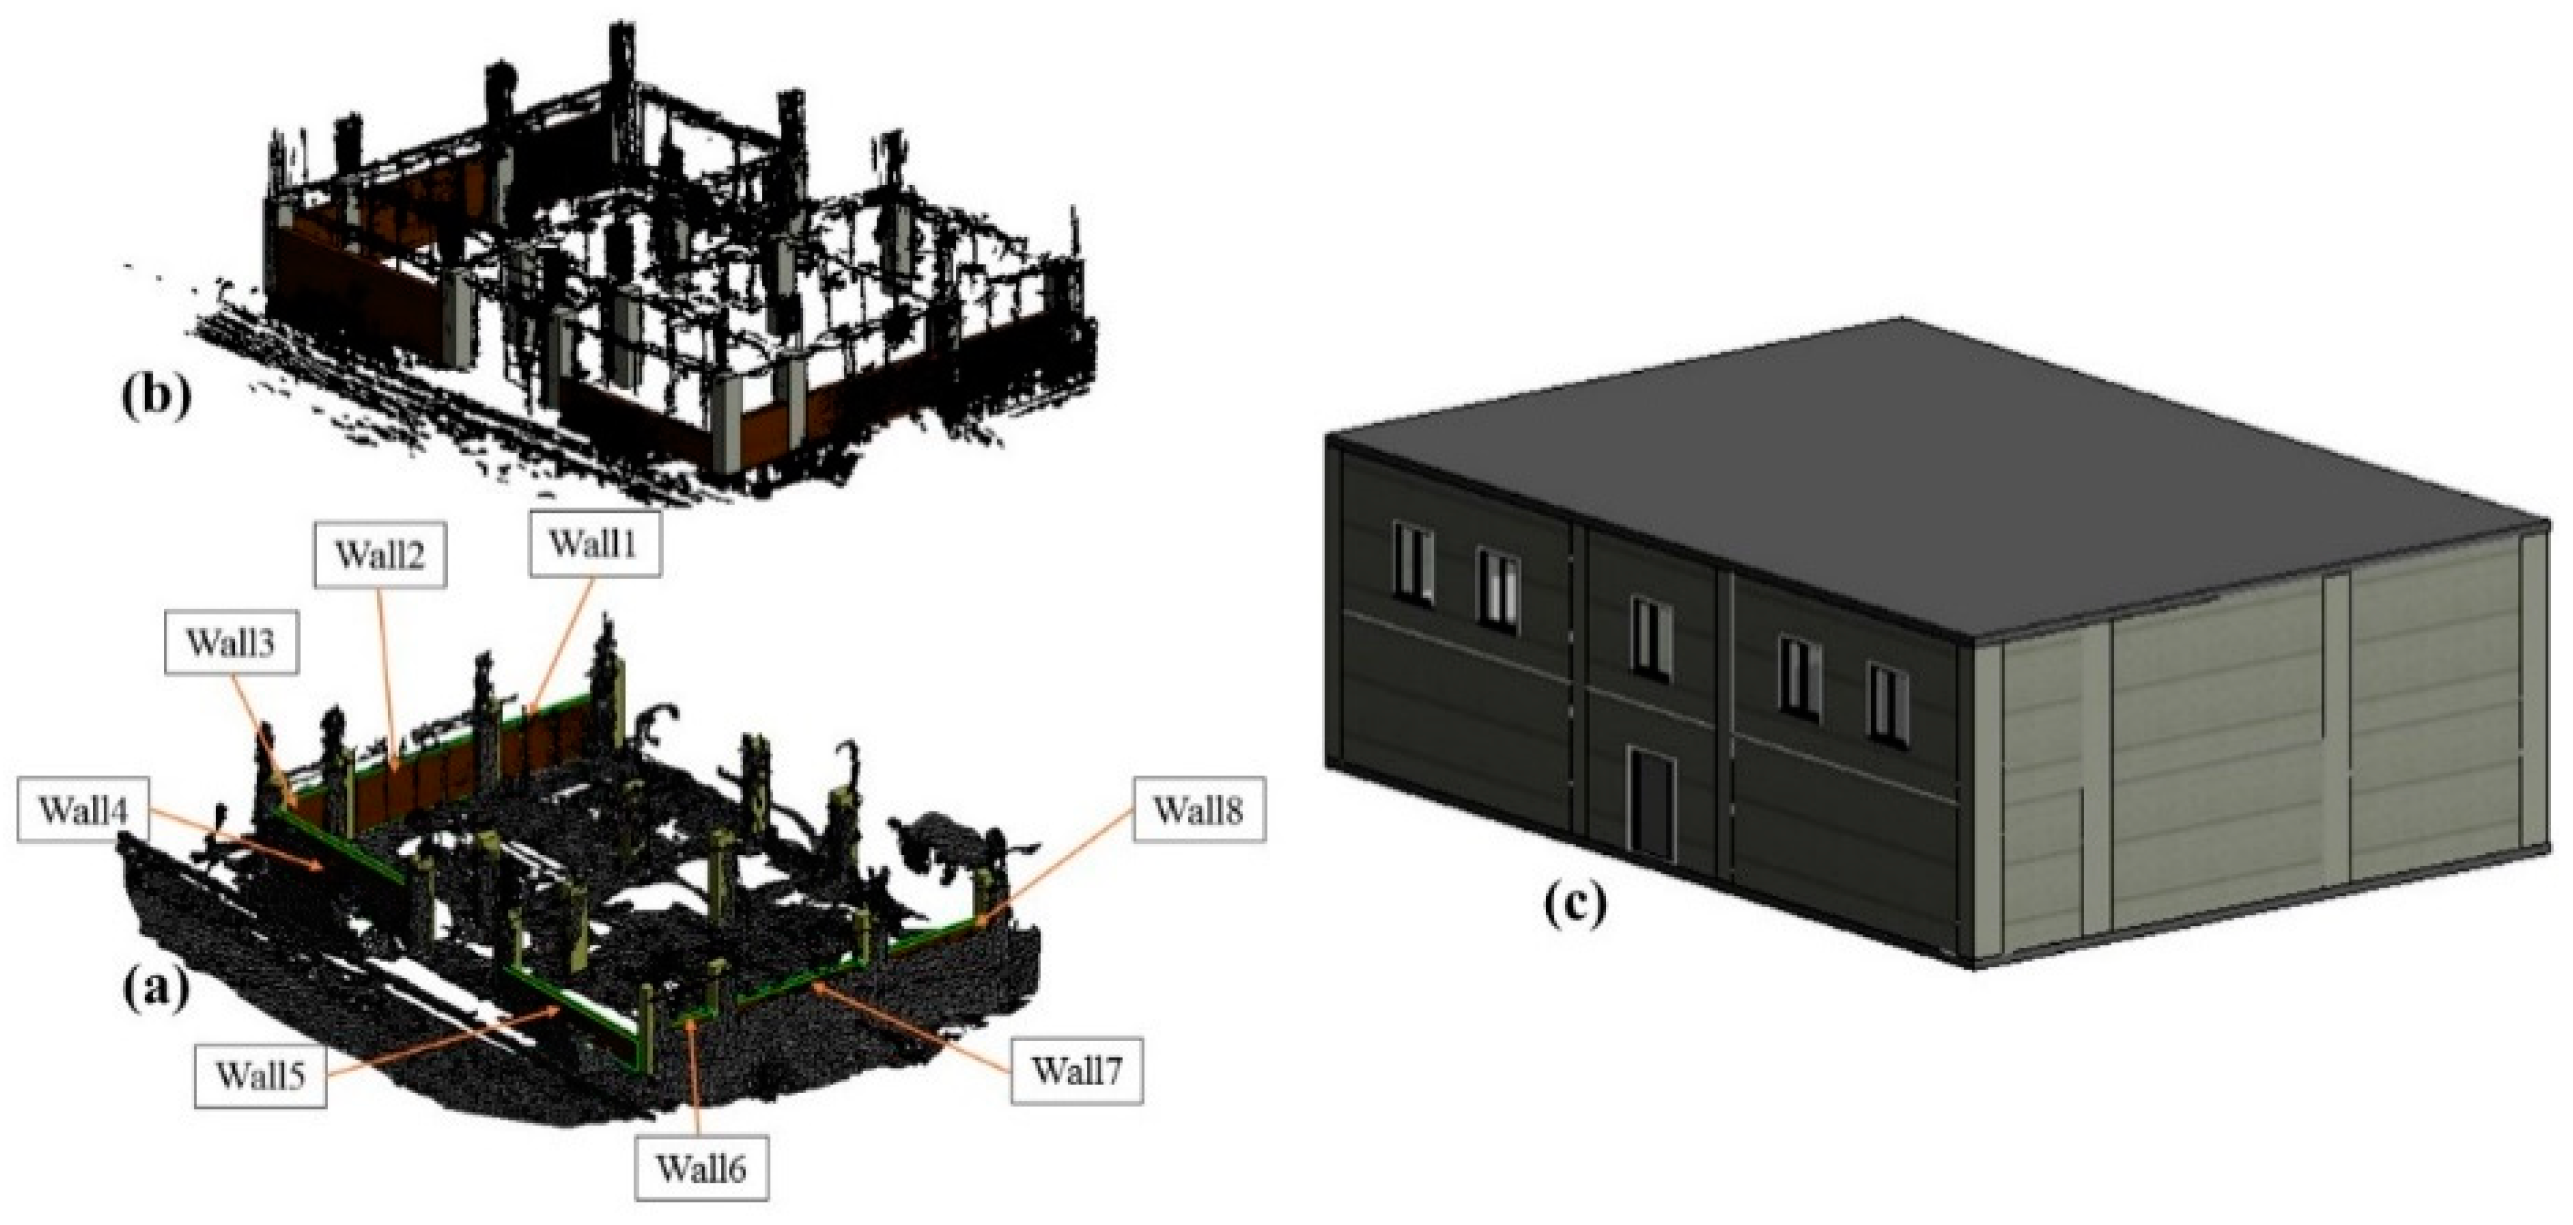
Figure 9 and
Figure 10 depicts the as-built model generated by two methods (proposed photogrammetric Multi-View Stereo based method and SFM/CMVS/PMVS algorithm) versus the as-planned model for the first and second case study, respectively.
Table 3 and
Table 5 represent the quantities of performed work determined by the proposed method and SFM/CMVS/PMVS algorithm for the first and second case study, respectively. Finally,
Table 4 and
Table 6 compare the accuracy of as-built models generated by the proposed method (SFM-MVS algorithm) and SFM/CMVS/PMVS algorithms for the first and second case study, respectively. The achieved results show that the 3D as-built model generated using the proposed method was more accurate compared to the model generated by SFM/CMVS/PMVS algorithm. As shown in
Table 4 and
Table 6, in two case studied projects, the volume of work was calculated with an accuracy of around 99 percent using the point cloud generated by the proposed method. However, the accuracy of point cloud generated by the SFM/CMVS/PMVS algorithm was around 96 and 91 percent for the first and second case study, respectively. Therefore, it is observed that the proposed method extensively improved the accuracy of generated point cloud comparing to the SFM/CMVS/PMVS algorithm.
It is worthy to note that in the SFM/CMVS/PMVS algorithm, as the length of building increased, the accuracy of generated point cloud decreased. As shown in
Table 4 and
Table 6, the accuracy of the point cloud generated by the SFM/CMVS/PMVS algorithm was 96 and 91 percent for the first and second case studied projects, respectively. Therefore, the SFM/CMVS/PMVS algorithm was inaccurate particularly when the length of building/element was high. However, the proposed photogrammetric Multi-View Stereo method revealed an accuracy of around 99 percent in all the cases. This shows that the proposed method presents a robust method for automated progress monitoring enabling us to determine the quantity of performed work with an accuracy that is close to 100 percent.
The automated progress monitoring method developed in this research has some unique features that aid to significantly improve the accuracy of the generated point cloud. These features include using coded targets, applying a new SFM-MVS algorithm, improving completeness of generated point clouds and generating the point cloud completely by off-the-shelf digital cameras to represent both inside and outside of the construction model.
5.2. Noise Level
Noise is extra points that are in the points cloud model. The performance of the proposed photogrammetric Multi-View Stereo method was also evaluated based on the amount of generated noise. The generated noise levels are important since they affect the processing time and the accuracy of the generated mesh model and ultimately the generated as-built BIM model.
Figure 11 and
Figure 12 represent the point cloud generated by the proposed method and the SFM/CMVS/PMVS algorithm for the first and second case study projects, respectively. As shown, the generated noise in the proposed method (SFM-MVS based algorithm) was much less than the SFM/CMVS/PMVS algorithm.
5.3. The Number of Points of the Generated Point Cloud
The performance of the proposed photogrammetric Multi-View Stereo method was also evaluated based on the number of points of the generated point cloud. The number of generated points is one of the factors that affects the accuracy of the generated model. It means that the higher the number of generated points, the higher the accuracy. When generating points cloud, the surrounding of the object is also generated. The number of generated points, however, is refined. To do this the points cloud that were generated using the proposed method (SFM-MVS algorithm) were refined in the Agisoft Photoscan software and the points cloud that were generated using conventional method (SFM/CMVS/PMVS method) were refined in the Geomagic software. This process was done manually.
In the first studied project, the number of points generated using the proposed photogrammetric Multi-View Stereo method was 5,006,994, while the number of generated points using the SFM/CMVS/PMVS algorithm was 1,800,283. This shows that the number of points generated using proposed method was around 2.8 times of the SFM/CMVS/PMVS method.
For the second studied project, the number of points generated using the proposed method and the SFM/CMVS/PMVS method was 24,650,922 and 2,256,845, respectively. Therefore, the number of points generated using proposed method was around 10.9 times of the SFM/CMVS/PMVS method. The achieved results show that the performance of the proposed SFM-MVS method was significantly better than the SFM/CMVS/PMVS method and the proposed method had a preference over the traditional method particularly in the large scale buildings.
It is believed that the proposed photogrammetric Multi-View Stereo method may present a novel and robust tool for automated project progress monitoring. Using the proposed method, the accuracy and completeness of generated points can be improved and the actual progress of the project can be determined more accurately. The achieved results shows that using the proposed method, the quantity of performed work can be determined with an accuracy of around 99 percent.
6. Conclusions and Remarks
Automated progress monitoring enables decision makers to assess the deviations from the as-planned state and adopt corrective actions if the project is behind schedule. This research proposed a novel photogrammetric Multi-View Stereo approach for automated construction progress monitoring which addressed some of the major shortcomings of the previous studies. For this purpose, the photogrammetric Multi-View approach was applied and several coded targets were placed around the building to define the datum and resolve the scale. Having captured several images from the building in proper positions, the targets were detected fully automatically in photogrammetric software. The SFM and MVS algorithms were then run in the software to generate an as-built 3D model. The captured images were imported in computer vision software, to generate a dense point cloud using SFM/CMVS/PMVS approach. The scale was resolved in SFM/CMVS/PMVS approach by picking several points in the point cloud manually and comparing the distance between the corresponding points in the model with real values in the object space. Finally, the quantity of performed work was calculated.
To evaluate the applicability and performance of the proposed photogrammetric Multi-View Stereo method, it was implemented on two real case study projects, being a two-story building and a one-story buildings, and construction progress was monitored automatically. The as-built point cloud was generated for two case study projects and the quantities of performed work was determined using the proposed method.
The performance of the proposed method was evaluated using three criteria, being the accuracy of the generated model, the amount of generated noise and the number of points in the generated point cloud. It was shown that the accuracy of the point cloud generated by the proposed method was around 99 percent in the two case studies, while the accuracy of point cloud generated by the SFM/CMVS/PMVS algorithm, which has been used in most of the previous studies, was around 96 and 91 percent for the first and second case study, respectively. Therefore, it is observed that the proposed method has extensively improved the accuracy of the generated point cloud compared to the SFM/CMVS/PMVS algorithm. Moreover, the generated noise in the proposed method was less than the SFM/CMVS/PMVS algorithm. Finally, it was shown that the number of points generated using the proposed method was around 2.78 and 10.92 times more than the SFM/CMVS/PMVS method in the first and second case study, respectively.
The SFM/CMVS/PMVS algorithm is inaccurate particularly when the length of building/element is high. However, the photogrammetric Multi-View Stereo method proposed in this research reveals an accuracy of around 99 percent in all the cases. Based on the obtained experimental results, it has been revealed that in the SFM/CMVS/PMVS algorithm, as the length of building is increased, the accuracy of generated point cloud is decreased. This shows that the proposed method has the capability to determine the quantity of performed work with an accuracy of around 100 percent for different types of buildings.
It is believed that the proposed photogrammetric Multi-View Stereo method may present a novel and robust tool for automated progress monitoring in construction projects. Using the proposed method, the accuracy and completeness of generated points cloud can be improved and the actual progress of the project can be determined more accurately.


