Article

Atmospheric Dynamics and Numerical Simulations of Six Frontal Dust Storms in the Middle East Region

1
Atmospheric Science & Meteorological Research Center (ASMERC), Tehran 14977-16385, Iran
2
Institute for Environmental Research and Sustainable Development, National Observatory of Athens, Palaia Penteli, 15236 Athens, Greece
3
Environmental Chemical Processes Laboratory, Department of Chemistry, University of Crete, 71003 Crete, Greece
4
Leibniz Institute for Tropospheric Research (TROPOS), 04318 Leipzig, Germany
5
Department of Geography, Philipps-Universität Marburg, 35037 Marburg, Germany
*
Author to whom correspondence should be addressed.
Atmosphere 2021, 12(1), 125; https://doi.org/10.3390/atmos12010125
Submission received: 18 December 2020 / Revised: 12 January 2021 / Accepted: 14 January 2021 / Published: 18 January 2021
(This article belongs to the Special Issue Observing Atmospheric Dynamics and Dust Activity - 2nd Volume)

Abstract

:
This study analyzes six frontal dust storms in the Middle East during the cold period (October–March), aiming to examine the atmospheric circulation patterns and force dynamics that triggered the fronts and the associated (pre- or post-frontal) dust storms. Cold troughs mostly located over Turkey, Syria and north Iraq played a major role in the front propagation at the surface, while cyclonic conditions and strong winds facilitated the dust storms. The presence of an upper-atmosphere (300 hPa) sub-tropical jet stream traversing from Egypt to Iran constitutes also a dynamic force accompanying the frontal dust storms. Moderate-Resolution Imaging Spectroradiometer (MODIS) and Cloud-Aerosol Lidar and Infrared Pathfinder Satellite Observation (CALIPSO) observations are used to monitor the spatial and vertical extent of the dust storms, while model (Weather Research and Forecasting model coupled with Chemistry (WRF-Chem), Copernicus Atmospheric Monitoring Service (CAMS), Regional Climate Model-4 (RegCM4)) simulations are also analyzed. The WRF-Chem outputs were in better agreement with the MODIS observations compared to those of CAMS and RegCM4. The fronts were identified by WRF-Chem simulations via gradients in the potential temperature and sudden changes of wind direction in vertical cross-sections. Overall, the uncertainties in the simulations and the remarkable differences between the model outputs indicate that modelling of dust storms in the Middle East is really challenging due to the complex terrain, incorrect representation of the dust sources and soil/surface characteristics, and uncertainties in simulating the wind speed/direction and meteorological dynamics. Given the potential threat by dust storms, more attention should be directed to the dust model development in this region.

1. Introduction

Desert dust is a major constituent of the Earth’s atmosphere and the second most abundant aerosol type. Emitted from desert areas mainly in the Northern Hemisphere, dust storms are considered as natural hazards with deleterious effects on climate, human health, marine and terrestrial ecosystems [1,2,3]. Therefore, investigation of dust storms is very important in countries located in the global dust belt or directly affected by transported dust plumes [4,5,6,7]. The Middle East region contributes around 15–20% to the global dust emissions, with origin mostly from the deserts in the Arabian Peninsula, Iraqi plains and southeast Iran [8,9,10]. Dust storms originating from the Middle East and the Arabian Peninsula highly affect the regional climate, cyclogenesis and the monsoon circulation over Southwest Asia [11,12,13,14]. Frequent and intense dust storms throughout the year over the region attenuate the incoming solar radiation and energy production via photovoltaic panels [15,16,17,18], resulting in huge financial losses due to several damages in infrastructure [19,20] and causing severe acute respiratory and cardiovascular diseases [21,22].
Several studies reported an increase in dust aerosol optical depth (AOD), in frequency and intensity of the dust storms over the Iraqi plains and the Arabian Peninsula during the past fifteen years [23,24], while over the eastern Iran a decrease in dust activity was observed after 2003 [25,26]. Moreover, Yu et al. [27] reported some evidence of increased Shamal winds during the recent years, with a higher probability for escalated dust activity and AODs in central Iraq and the eastern and southern Arabian Peninsula. Small- and large-scale atmospheric dynamics control the dust activity over the region, such as the El-Nino (La Nina) phase, changes in sea surface temperatures of both the Indian Ocean and the Mediterranean Sea, movement of the Inter-Tropical Convergence Zone (ITCZ) and changes in the position and intensity of the Siberian High, which influence the pressure gradients and wind regimes [28,29,30]. Furthermore, several factors control the dust emissions such as soil moisture, soil texture, vegetation cover and topography [31].
The dust-storm activity over the Middle East and the Arabian Peninsula is more frequent in summer than winter due to a higher frequency of dust storms related to Shamal and Levar winds [32,33,34]. The summer dust storms over the region are mainly driven by the Shamal winds, so-called “Shamal dust storms”, which have been well documented [27,35,36,37]. Although being rather rare, intense dust storms may also occur in winter, mostly associated with intrusion of cold fronts from higher latitudes. Atmospheric disturbances during the cold period of the year, mostly associated with cut-off lows at lower latitudes, facilitate the formation of dry cyclones and strong density currents over the desert areas that initiate frontal dust storms [38,39]. Hamidi et al. [40] investigated 60 dust storms from 2003 to 2011 in the Middle East and categorized them into (i) Shamal dust storms and (ii) frontal dust storms. The rapid formation of the frontal dust storms and the hidden dust plumes in satellite imagery due to extensive cloudiness are reasons that make prediction of these phenomena really difficult [35,41].
Several previous studies have examined the atmospheric circulation patterns, dust-aerosol characteristics and effects of intense dust storms over the Middle East and the Arabian Peninsula using a synergy of ground-based measurements, satellite observations and model simulations [8,12,35,40,42,43,44,45,46]. These studies highlighted the pressure gradients, the surface cyclonicity and the wind shear as major factors for triggering dust phenomena in the Middle East, which may dramatically increase the dust AOD up to 3.0 and the surface dust concentrations above 2000 µg m−3. The regional climate models use fine spatial resolution and more complex schemes for soil characteristics, roughness, dust emissions and atmospheric dynamic processes, thus presenting some advantages compared to the global models in dust simulations [47,48].
In this study, six frontal dust storms were investigated over the Middle East and the Arabian Peninsula during the cold period of the year (October–February). The synoptic and dynamic conditions that trigger the dust storms are examined in order to assess the role of the frontal systems in dust emissions and propagation. Furthermore, simulations from three models i.e., Weather Research and Forecasting model coupled with Chemistry (WRF-Chem [49]), Copernicus Atmospheric Monitoring Service (CAMS [50]) and Regional Climate Model-4 (RegCM4 [51]) are carried out during the six dust-storm events in order to compare the ability of these models to represent the spatial distributions of AOD and dust concentrations. The model simulations are qualitatively analyzed against the AOD spatial distribution from MODIS (Moderate-Resolution Imaging Spectroradiometer), while the main objective of the study is to examine the differences in model simulations and the challenges in accurate representation of dust emissions and transport over the complex terrain of the Middle East. Furthermore, CALIPSO (Cloud-Aerosol Lidar and Infrared Pathfinder Satellite Observation) retrievals were used for monitoring the vertical structure of the dust plumes over the region, while WRF-Chem simulations of vertical meteorological and dust cross sections assess the model capability in representing the frontal systems and the associated dust storms.

2. Study Area and Dust Storms

The study area includes the Middle East and the Arabian Peninsula, where several active deserts are located [52,53,54]. Tigris and Euphrates alluvial plains (Iraqi flood plains) [32,55] and the Rub-Al Khali desert in the southern Arabian Peninsula [11] are considered the main dust sources over the region, while An-Nafud and Al-Dahna deserts in the northern and eastern parts of the Arabian Peninsula, respectively, are also known for intense dust outbreaks. Dasht-e Kavir and Dasht-e Lut in the central plateau of Iran are weaker dust sources, but sometimes intense dust storms originate from them [56,57]. The Sistan Basin, located in the borders between Iran, Afghanistan and Pakistan, is one of the most important dust hotspots in this area [58,59]. In addition, most of the dry lands in Iran are highly susceptible to dust storms all year round [60,61]. The climate of the region is characterized by hot and dry summers, with mild winters and scanty rainfall [62,63].
Dust storms over the region can be divided into various categories such as Shamal, frontal and convective dust storms; the latter correspond to mesoscale and small-scale phenomena like haboobs and dust devils [64,65]. The Shamal dust storms are more frequent in summer [27], while the frontal dust storms occur mostly during the cold period and can be further classified to pre- and post-frontal types [37]. The frontal dust storms over the Iraqi alluvial plains and the northern part of the Persian Gulf are also associated with strong Shamal winds during the winter period. They have a different driving mechanism compared to the summer Shamal, as they are induced by the southward movement of cold intrusions from Turkey/north Iraq and/or from cold frontal systems in this area [66,67]. This study analyzed the synoptic meteorology during six characteristic frontal dust-storm events occurring over the Middle East during the cold period of the year (October–February) and examined the models’ performance in simulating the spatial distribution of aerosols and PM10 concentrations. The six frontal dust storms were named as DS1 to DS6 and are listed in Table 1. All of them impacted the west and southwest parts of Iran, except for DS6 which affected southeast Iran. A common characteristic of all these dust storms is the visibility reduction to ~100 m at Iranian meteorological stations downwind to dust plumes.

3. Data Set and Methodology

Daily synoptic maps of mean sea-level pressure (MSLP), geopotential heights at 500 hPa and 850 hPa, vector winds and temperature at 850 hPa were constructed over the Middle East during the dust-storm events using data from the Global Forecast System (GFS) at 0.5° × 0.5° spatial resolution (https://www.ncdc.noaa.gov). Furthermore, upper-atmosphere (300 hPa) synoptic winds were obtained from NCEP/NCAR (National Center for Environmental Prediction/National Center for Atmospheric Research) reanalysis data at 2.5° × 2.5° spatial resolution [68]. These data are used to examine the synoptic atmospheric conditions that prevailed during the dust events and for the determination of the frontal areas.
MODIS satellite retrievals of aerosol optical depth (AOD550) from Collection 6.1 (combined Deep Blue and Dark Target) and level 3 (1° × 1°) [69] were obtained from the Giovanni visualization tool (https://giovanni.gsfc.nasa.gov), along with true color imagery during the dust storms (https://lance-modis.eosdis.nasa.gov). Daily MODIS AODs were used to detect the spatial distribution and intensity of the dust storms and for a qualitative comparison with the model simulations. The errors in the AOD550 retrievals in C006.1 are within ±(0.05 ± 20%) of the ground-based measured AODs over land; however, at heavy dust storms with surface visibility of 100 m, satellites cannot detect well the state of aerosol below 2 km. In addition, CALIPSO products of vertical backscatter coefficient and aerosol sub-types [70,71] were used to study the vertical profiles of dust aerosols, clouds and mixture states in the atmosphere (https://www-calipso.larc.nasa.gov). CALIPSO profiles were used during daytime and nighttime overpasses over the study area with cross sections over the dust plumes. However, in heavy dust storms CALIPSO can detect aerosols only up to the upper edge of the dense dust-aerosol cloud, approximately at heights of 2 km. Moreover, CALIPSO takes measurements in a vertical cross section at nadir and rarely passes directly over validation stations, such as AERONET over the region, thus preventing a validation of CALIPSO products. In addition, PM10 concentrations (in µg m−3) on the dust-storm days were obtained at several dust-affected stations across Iran, belonging to the air-pollution monitoring network of the Department of Environment, Iran. These PM10 concentrations were used to examine the impact of dust storms over the stations and for qualitative comparison with the model predictions. It should be noted that most of these stations are located outside the dust-source areas and are affected by transported dust plumes.

4. Model Simulations

In this study, the six frontal dust storms were simulated by numerical models (WRF-Chem, CAMS and RegCM4) with different spatial resolutions, meteorological inputs, dust schemes and soil/surface characteristics (Table 2). Therefore, remarkable differences were expected between the model simulations of the dust storms, and their performance was qualitatively evaluated against MODIS AODs. Apart from the columnar AOD, the three models were also analyzed for their simulations of surface dust concentrations (PM10). It should be noted that CAMS and RegCM4 model outputs were taken (offline) from the Sand and Dust Storm Warning Advisory and Assessment System (SDS-WAS; https://sds-was.aemet.es).

4.1. WRF-Chem Model

The Weather Research and Forecasting model coupled with Chemistry (WRF-Chem) is widely used for simulations and predictions of regional climate, weather conditions, air quality and dispersion of aerosols and pollutants [74,75,76]. In this study, WRF-Chem (version 4) was configured to have a simulation domain (20–42° N, 37–68° E) using a nesting with grid size of x:156, y:111 and horizontal resolution of 21 km and 30 vertical sigma levels (from 1000 hPa up to 10 hPa). The model uses the GFS produced by NCEP at 0.5° × 0.5° horizontal resolution (~55 km) for the initial and boundary conditions updated every 6 h. The Air Force Weather Agency (AFWA) dust emission scheme [72,77], composed of three main components including saltation flux, threshold friction velocity and bulk vertical dust flux, was used for simulations of dust emissions and transport. The flux of dust particles is calculated as [78]:
H D P = C ρ a g u 3 1 + u t u 1 u t 2 u 2
G = H ( D P ) d S r e l D P
where, H D P is the saltation flux, D P is the diameter of dust particles, ρ a the air density, C a dimensional tuning constant (1 mg S2 m−5), u the friction velocity and u t the threshold friction velocity. The threshold friction velocity is highly sensitive to surface conditions such as soil moisture, roughness, clay/sand fractions and salt components in the soil [79,80]. The concentration of the dust flux triggered by saltation is represented by the following expression:
F b u l k = G α × E r o d
where E r o d is the erodibility function and α the sandblasting efficiency factor that depends on the cleay fraction in the soil and is given by Gillette [81]:
α = 10 0.134 % c l a y 6
The model uses eight particle size bins, from 0.15 to 7.1 µm, for simulations of dust transport at a 3 h time step, while the model spin up was 12 h. The WRF-Chem model was configured with micro-physics option from WSM6, while it used the Yonsei University (YSU) planetary boundary layer scheme, the unified Noah land-surface model and the RRTM model for the short- and long-wave radiations [82]. Moreover, offline simulations of MSLP, vertical cross sections of potential temperature, relative humidity (RH) and dust concentrations were obtained from WRF-Chem, aiming to explore the capability of the model to predict frontal dust storms in the Middle East. More details about this model and its applications for simulations of land processes, dust emission fluxes, surface concentrations and radiative effects of dust over the Middle East can be seen in several previous works [12,42,82,83,84,85,86].

4.2. CAMS Model

The Copernicus Atmospheric Monitoring Service (CAMS) is based on Monitoring Atmospheric Composition and Climate (MACC) global reanalysis [50,87] and has been extensively used to provide global simulations of dust transport [88]. The CAMS data includes aerosol modeling and assimilation based on satellite observations and reanalysis. The model part is based on ECMWF (European Centre for Medium-Range Weather Forecasts) parameterizations related to aerosol types and atmospheric processes [89]. CAMS model includes the dust uplifting scheme from Ginoux et al. [73] with a spatial resolution of 8–10 km and 137 sigma vertical layers. The flux F P of a particle size class p is approximated by the expression:
F P = C S S P u 10   m 2 u 10   m u t   i f   u 10   m > u t 0   o t h e r w i s e
where S is the source function, C is a dimensional factor equal to 1 µg S2 m−5, u 10   m is the horizontal wind speed at 10 m and u t the threshold horizontal wind speed. In CAMS simulations, the AOD is related to column mass loading via the formula:
A O D λ   =   1 8 A O D λ   =   1 8 3 4 ρ k r k M k Q e x t λ k
For each size bin k, ρ k   is the particle mass density, M k is the columnar mass loading, r k   is the effective radius and Q e x t λ k   is the extinction efficiency factor, which was calculated using the dust refraction indices and the Mie scattering theory according to Toon and Ackerman [90]. CAMS provides data for aerosol types and other atmospheric variables at a time step of three hours, while the simulations consider three transport-sized bins (0.03-0.55-0.9-20 µm).

4.3. RegCM4 Model

One of the first regional climate models (RCMs) was the RegCM system developed in the late 1980s and early 1990s at the National Centre for Atmospheric Research (NCAR) and then at the Abdus Salam International Centre for Theoretical Physics (ICTP) [91,92]. The latest version (RegCM4) provides adequate climatic information at regional scales that assists in adjusting the climatic variable configuration [93]. It is a sigma vertical coordinated (18 levels) and non-hydrostatic climate model and its dynamics use the fifth version of the hydrostatic MM5 mesoscale model [94]. The calculations of the dust emissions are based on parameterizations of soil aggregate saltation and sandblasting processes [51]. The main steps in this calculation are (i) the specification of soil aggregate size distribution for each model grid cell, (ii) the calculation of a threshold friction velocity, (iii) the calculation of the horizontal saltation soil aggregate mass flux, and (iv) the calculation of the vertically transportable dust mass flux generated by the saltating aggregates. The horizontal flux associated with a given saltating aggregate of size Dp is given by:
dHF ( Dp ) = E × pa / g × u × 2 ( 1 + R ( Dp ) )   × ( 1 - R ( Dp ) )   × dSrd ( Dp )
where E is the ratio of erodible to total surface, dSrd(Dp) is the relative surface of soil aggregate of diameter Dp to the total aggregate surface. R(Dp) is the ratio of the threshold friction velocity to the friction velocity u , calculated within each grid cell from the model prognostic surface wind and the surface roughness height. The horizontal particle flux is obtained by the integration of Equation (7) over Dp. The vertical dust flux in this model comes from:
F d u s t , i D P = π 6 · ρ P · D i 3 · N i
D p is the diameter of the particle, D i is the median diameter of ith mode, ρ P is the aggregate density taken as 2.65 gr cm−3 and N i is calculated from the equation:
d N i D P = d F k i n D P · p i D P / e i
where e i is the binding energy related to the emission mode i. Similar with CAMS (see Equation (6)), the Mie code for the estimation of columnar AOD was used from Toon and Ackerman [90]. The RegCM4 model has been widely used for examining the dynamics of dust storms and for simulating temperature and precipitation in South/Southwest Asia [14,95,96].

5. Results and Discussion

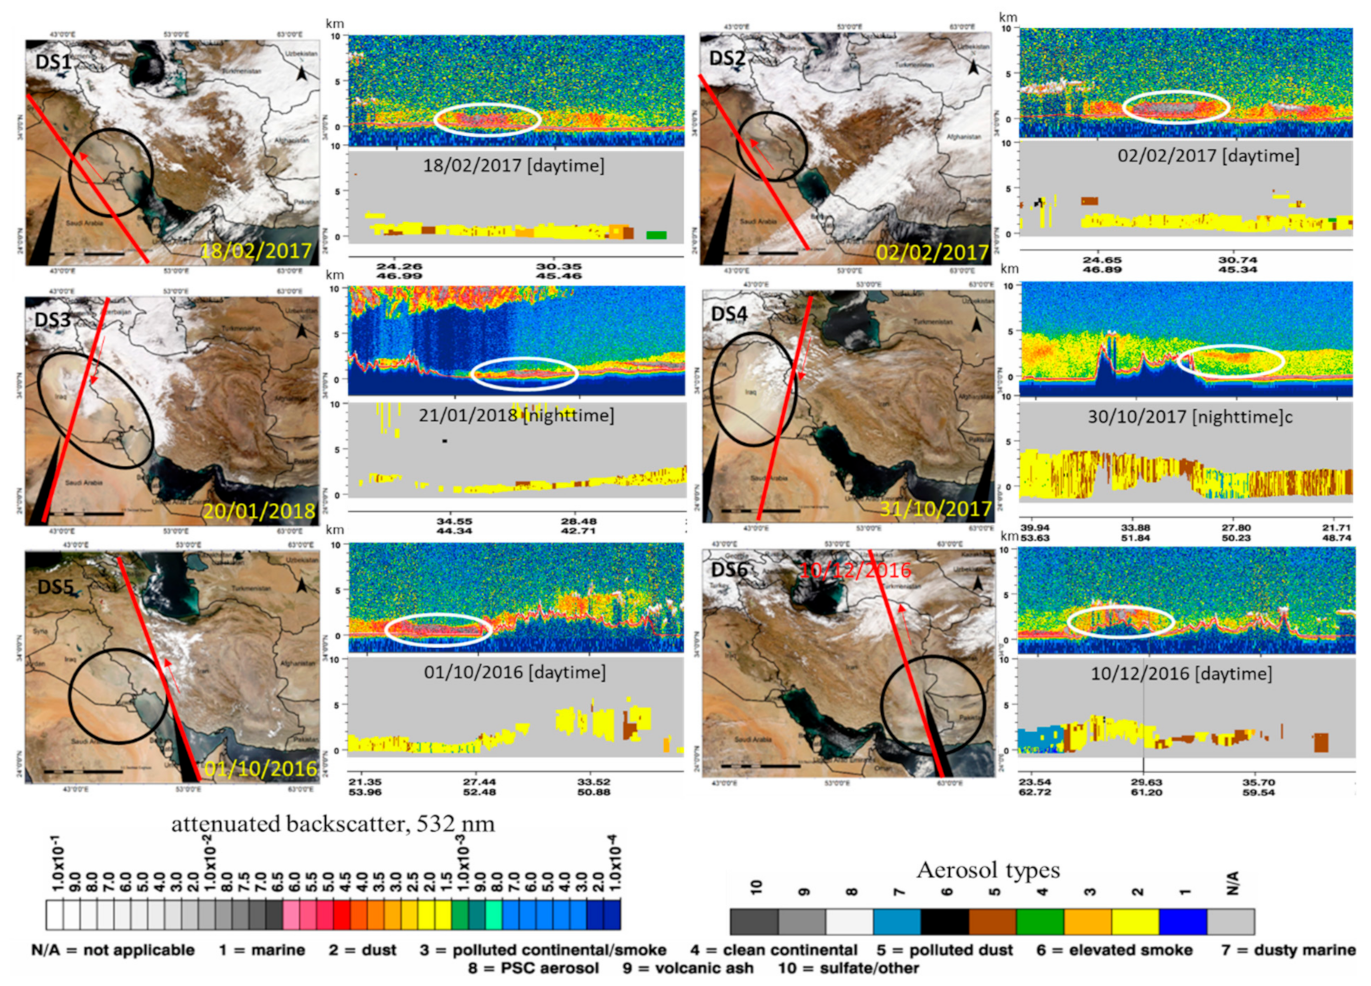
5.1. Satellite Observations

True-color imagery from Aqua- and Terra-MODIS was used in the dust-storm events over the Middle East region (Figure 1). MODIS imagery is supported by CALIPSO profiles of the attenuated backscatter coefficient and aerosol sub-type classification [97] during CALIPSO overpasses over the region (red lines in the MODIS imagery)—although a delay exists between MODIS and CALIPSO observations—while a direct comparison between MODIS and CALIPSO data was not attempted.
An intense dust plume was detected over southern Iraq, southwest Iran, Kuwait and the northern Persian Gulf on 18 February 2017 (DS1), accompanied with extensive cloudiness over east Turkey and northwest Iran. According to CALIPSO profiles, this dust storm was traveling from Mesopotamia towards the eastern Arabian Peninsula in the lower troposphere (<1.5 km), rather forming a frontal dust wall near the surface. The aerosol-type classification indicated a clear dominance of desert-dust aerosols with some few mixtures of anthropogenic pollution, mostly from oil refineries and urban emissions in the region.
In DS2 (2 February 2017), the dust storm impacted the same area and the spatial distribution of cloudiness presented great consistencies with DS1, implying similar meteorological conditions and driving mechanisms for dust generation and transport. However, in this case thicker cloudiness covered vast areas of south and central Iran, with an axis from southwest (central Arabia) to northeast (central Iran), indicating the presence of a frontal system. The main dust plume occurred behind this cloud zone and was considered a post-front dust storm. It was vertically extended until about 1.5 km, similar to DS1, with high intensity at areas between 25° N and 29° N according to CALIPSO profiles, while the clouds occurred at 3–4 km and ahead (south/southeast) of the intense dust plume.
DS3 (20 January 2018) was a strong dust event over the Iraqi plains, also highly affecting southwest Iran and the northern Persian Gulf. Although the dust-impacted area and the spatial distribution of cloudiness present great similarities with the previous cases—as all these events occurred in the mid of winter—the dust plume in DS3 lay near the surface (below 1 km), propagating from north Iraq to the south with a progressive increase in altitude over central-south Arabia. As shown from MODIS imagery and verified by the CALIPSO profiles, a major part of the dust plume lay below thick clouds existed at the upper atmospheric levels (8–10 km). In several cases, dust storms generated by frontal systems in winter were obscured by clouds in the lower or in the upper atmosphere and were not clearly detectable by satellites [37].
In DS4 (30–31 October 2017), the dust plume covered the largest part of north-central Iraq and some areas in north Saudi Arabia (An Nafud desert). Scanty clouds were also seen over northwest Iran and central-north Iraq. CALIPSO observations revealed the presence of dust and polluted dust aerosols across the whole overpass, extending vertically up to 4–5 km but with lower intensity compared to previous cases, indicating larger dispersion (horizontal and vertical) of the dust storm. The highest thickness of the dust plume was detected south of the Zagros Mountains (white oval in CALIPSO image), while the presence of marine aerosol mixed with dust and pollution was also detected close to the Persian Gulf (50° E).
In DS5 (1 October 2016), the dust storm covered southeast Iraq, the southwest part of Iran and the Persian Gulf, while scanty cloudiness was present over the Zagros Mountains and central Iran. CALIPSO observations showed dominance of dust aerosols over the mountainous areas, while the intensity of the dust plume was escalated over the Persian Gulf, which was confined below 1.5 km (26–27° N) (white oval in the CALIPSO image).
The DS6 (10 December 2016) differentiates from the other cases, since the dust event affected the southeastern part of Iran, west of Pakistan and the northern Arabian Sea. Clouds were detected over northeast Iran and Turkmenistan, but were not related with the dust storm, which seemed to be emitted from various source regions such as the Lut Desert, the Sistan Basin, the Jazmurian dried lakebeds and other susceptible areas in the arid southeast Iran [98,99,100,101]. Dust aerosols prevailed over the complex topography of southeast Iran, while a mixed dust-marine aerosol layer covered the northern part of the Arabian Sea, thus affecting the marine ecosystem [102].
Overall, the dust plumes during the examined frontal dust storms in the cold period of the year were mostly confined below 2 km in altitude and in most of the cases were associated with extensive cloudiness due to frontal systems. On the contrary, during spring and summer the dust layers over the region reached much higher altitudes (6–8 km) and were mainly triggered by seasonal winds due to pressure gradients and enhanced convection [11,27,30,99]. Five out of the six examined dust storms affected the southwest part of Iran (Khuzestan province) and the largest city of Ahvaz, which is under the influence of high dust-laden atmospheres all year round [103], causing serious health hazards to the inhabitants [104,105].

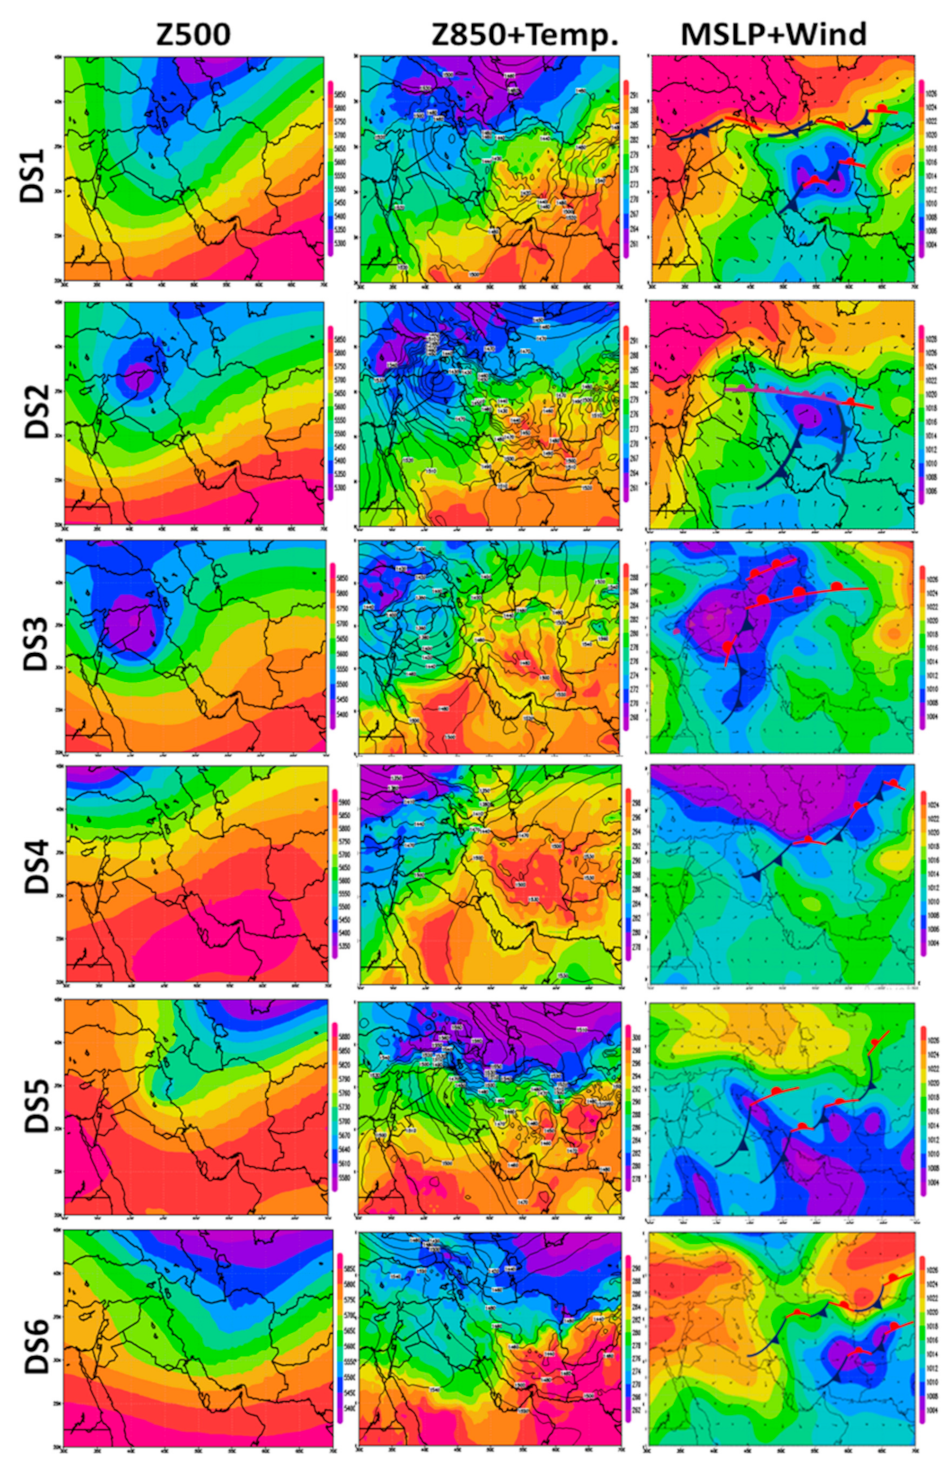
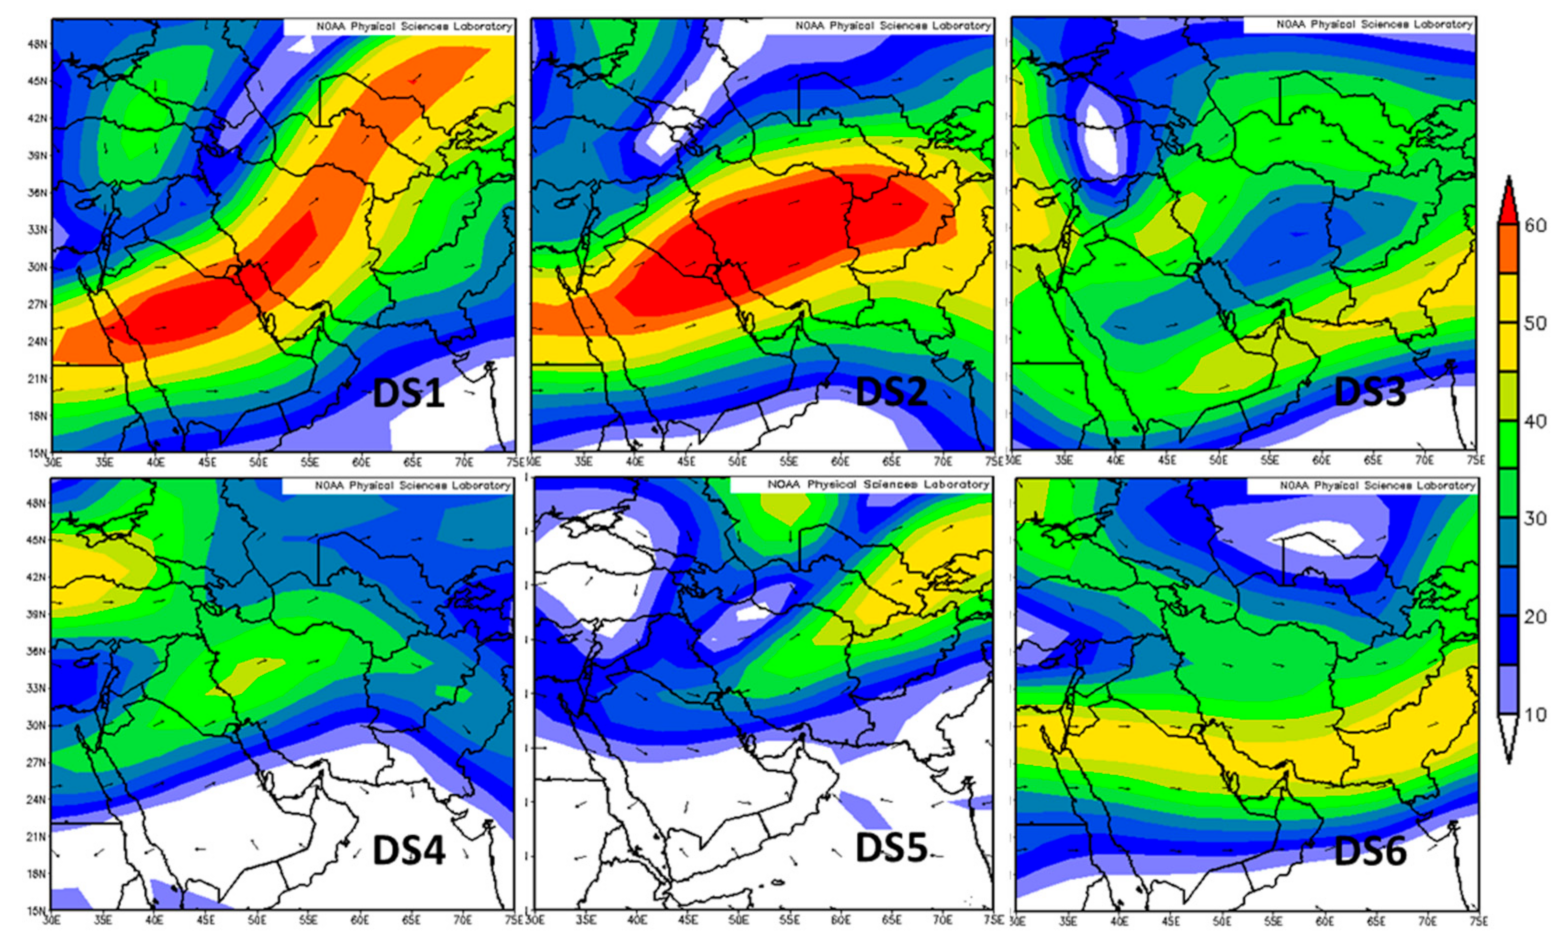
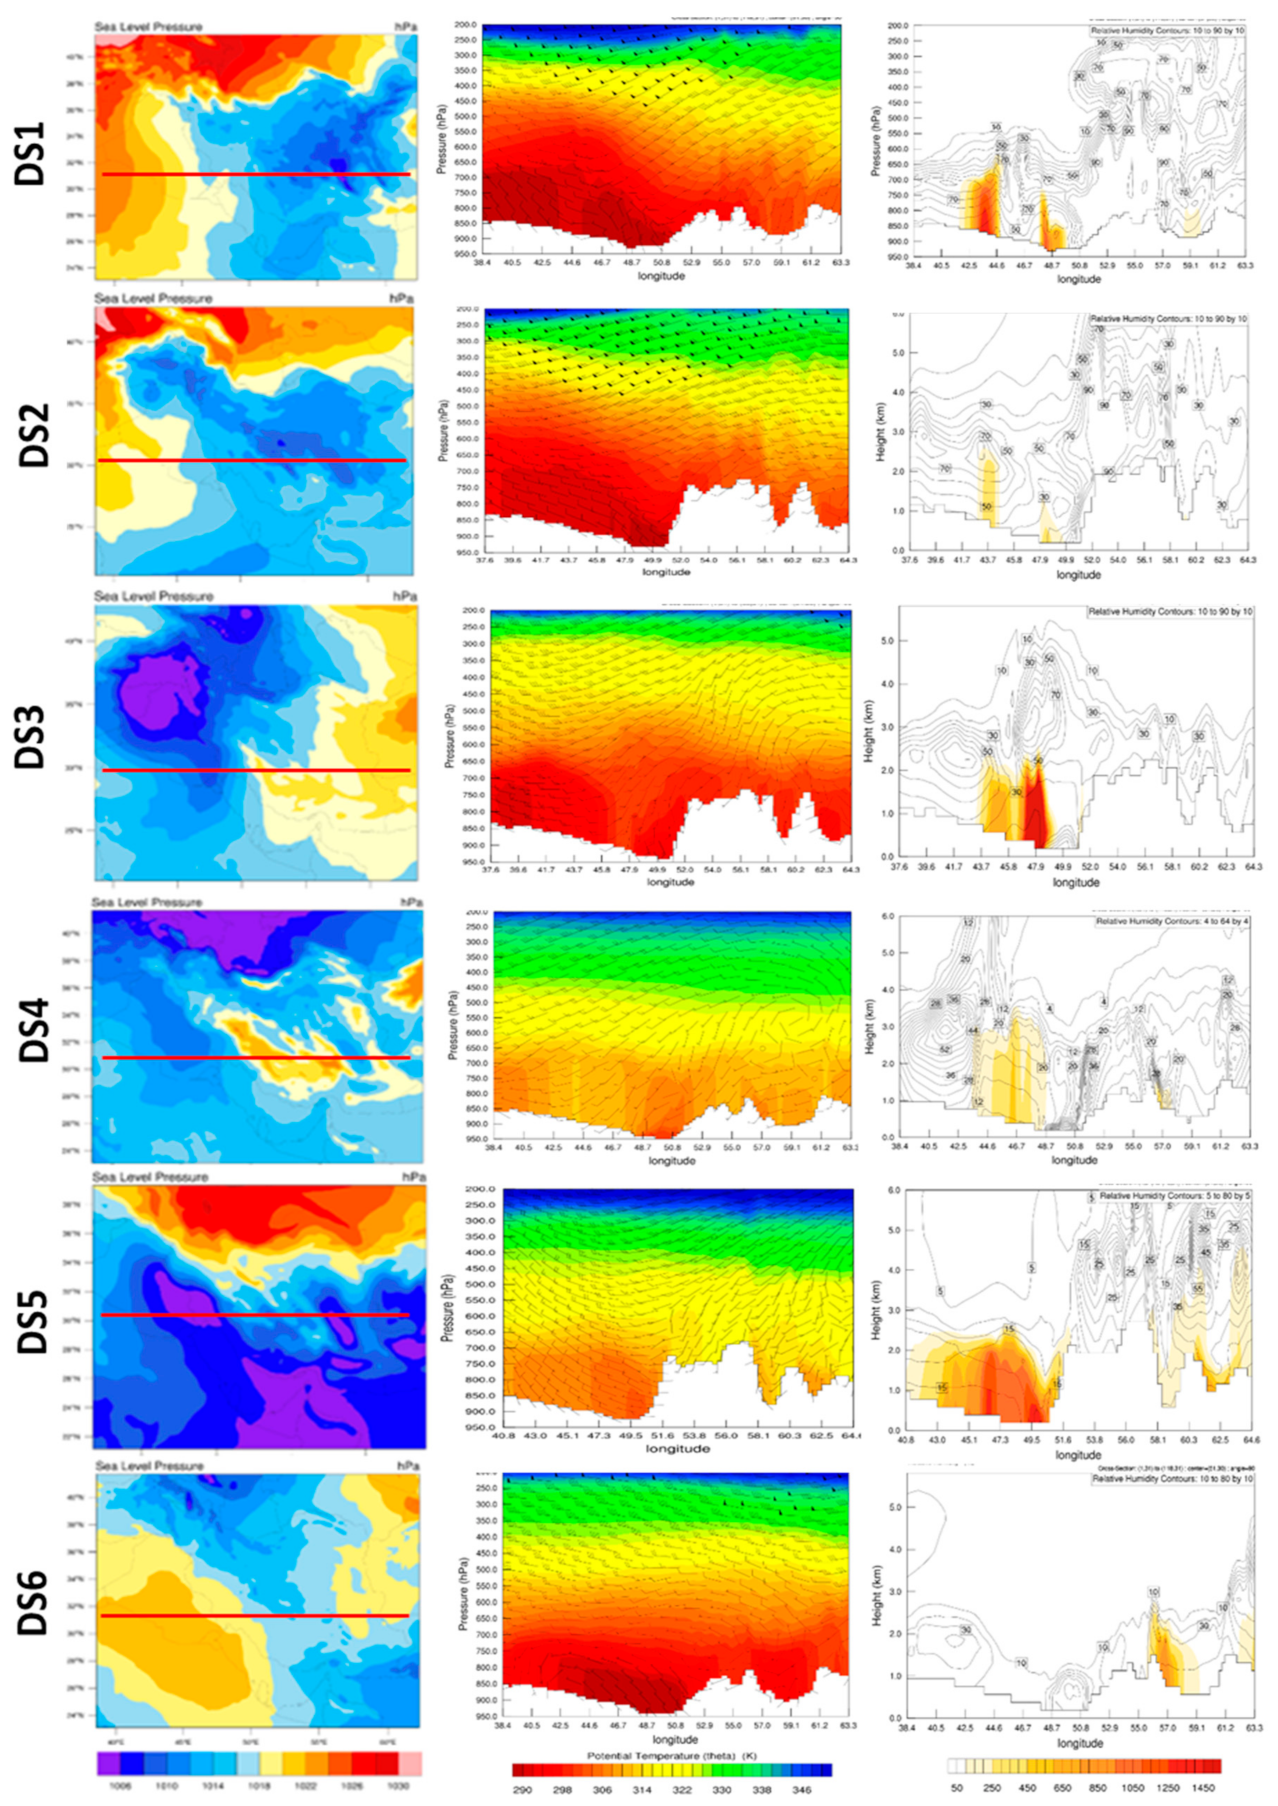
5.2. Synoptic Meteorology

For the synoptic analysis of the atmospheric circulation patterns that prevailed during the frontal dust storms, GFS-ANL data with 0.5° × 0.5° resolution were used, as well as NCEP/NCAR reanalysis for the upper-atmosphere (300 hPa) winds. Dust storms over the Middle East are highly associated with specific weather conditions like extended troughs and pressure gradients, while the wind field at the lower troposphere (i.e., 950–700 hPa) and surface cyclonicity also play a major role [11,29,30,35,38,40]. Figure 2 shows the synoptic maps of the geopotential heights at 500 hPa and 850 hPa levels, the temperature at 850 hPa and MSLP along with surface winds and frontal systems during the six dust storms.
For DS1, at 500 hPa a trough stretched from the Caspian Sea and Central Asia towards Turkey, northwest Iran and north Iraq, which also affected north Saudi Arabia. Such troughs represent an expansion of the Siberian High during the winter season and were found to be strongly linked with dust activity over the Middle East and north Arabia [29]. A low-pressure system was developed in front of the trough’s axis at lower altitudes, which caused a surface front. Air mass divergence and vertical motion strengthened the surface low-pressure system in front of the trough. North and northwest winds triggered by the trough significantly reduced the temperature over Turkey, Syria, Iraq and north Saudi Arabia, while central-east Iran was under the influence of warm air masses coming from the south. An intense mid-level jet stream over Turkey that was moving southwards behind the cold front over Syria and the subtropical upper-level jet stream lying from the central-north Arabian Peninsula to central Iran (see Figure 3) strengthened this frontal system towards the east-southeast of the trough axis, thereby causing an intense pre-frontal dust outbreak over south Iraq. In addition, a low-pressure system with two cores was developed near the surface in central Iran related to increased temperatures over these interior drylands. A low-pressure system, but with lower intensity in its core (~1010 hPa), also dominated over the southern Arabian Peninsula (Rub Al-Khali desert), facilitating a southwest flow over that area that also affected central-east Iran with the formation of warm fronts. On the contrary, Iraq, northern Saudi Arabia and the north Persian Gulf were under the influence of northwest winds accompanying a cold front and the dust storm. Rotating isobars and changes in wind direction from southwest to west/northwest revealed the presence of a cold front in the southwest of Iran. High-pressure conditions (>1025 hPa) prevailed over Turkey and the Black and Caspian Seas due to an expansion of the cold Siberian anticyclone, while the strong pressure gradient due to lower MSLP at southern latitudes formed an extended area of frontal systems from the eastern Mediterranean coast to Central Asia. At an 850 hPa level, a strong temperature gradient was observed along north Iraq, Iran and Central Asia, accompanied with cold advection and a baroclinic weather system associated with the cold front.
At DS2, the meteorological patterns at all layers presented large similarities to those that prevailed during the DS1. However, some notable differences existed, like the cut-off trough at 500 hPa over the Iraqi-Syrian desert which caused lower temperatures at 850 hPa over Syria and Iraq and stronger northwest winds over Iraq compared to the previous case. A closed low-pressure system also prevailed over central Iran, while the sudden change in wind direction in the west of Iran and east of Iraq determined the presence of a front in this area. Contrary to the previous case, the high MSLP conditions were mostly limited over Turkey and west of the Caspian Sea, while the lower pressure gradient signified a rather occluded front along north Iran. In addition, the low-pressure over the Rub Al-Khali Desert facilitated southwesterlies over southern Saudi Arabia and caused a post-frontal dust storm over the Empty Quarter [106]. MODIS imagery (Figure 1) showed that the frontal system was accompanied by extensive cloudiness with a clearly defined southwest to northeast axis, while behind the front, northwesterly strong (>15 ms−1) Shamal winds triggered an intense post-frontal dust storm moving from Iraq to the southern Arabian Peninsula along the eastern coastal corridor [37].
At the 500 hPa pressure level in DS3, a cut-off low center prevailed over Iraq and Syria, displaying similar characteristics as in DS2 but with higher intensity in its core. In addition, this trough was extended to lower latitudes compared to DS2 and facilitated a strong pressure gradient and the formation of a deep, low pressure accompanied with fronts at the surface in front of the trough axis over Iraq. A strong temperature gradient and baroclinic atmosphere at 850 hPa were seen in east and southeast of Iraq, which are signs of a front presence over this region. At the surface, an extensive low-pressure system covered Syria and Iraq and stretched west over northwest Iran and to the south over north Saudi Arabia. The cold front traversing through Iraq and the northern part of Saudi Arabia was accompanied with strong southwesterlies (>10 ms−1) ahead, which triggered the intense dust storm on 19 January 2018. As the main dust plume occurred ahead of the frontal system and covered central Iraq, the northeastern part of the Arabian Peninsula and the northern Persian Gulf (Figure 1), it was considered a pre-frontal dust storm [67], while the meteorological conditions seemed like those observed during a dust storm of same type in this area on 12–13 April 2011 [107].
On the contrary to previous cases, during the DS4 a trough stretched from Europe to Turkey, but marginally affected the Middle East region. A high-pressure center (gpm > 5800 m) covered the Arabian Peninsula and the southern half of Iran. At 850 hPa level, lower temperatures prevailed over the western part of the Middle East, while the Iranian Plateau was under the influence of high temperatures. An intense temperature gradient was formed over central Iraq, while changes in wind direction were also observed over the same region, defining the presence of a front. However, the pressure gradient and wind speeds were significantly weakened compared to the previous cases and the emitted dust plumes were of lower intensity and covered an extended area (Figure 1). Furthermore, the limited cloudiness over the region indicated an absence of strong and well organized frontal systems. Although the whole Arabian Peninsula and the Middle East were under the influence of rather constant MSLP conditions with the absence of intense gradients, the northern latitudes in Central Asia were covered by an extensive low-MSLP system.
In DS5, a trough at 500 hPa, as a south-westwards expansion of the Siberian High, affected north Iraq and northwest Iran, while high gpm dominated over the Arabian Peninsula and southern parts of Iran. This system transferred cold air masses from Central Asia over Iraq and Iran, thus lowering the temperature to 850 hPa. At the same time, several low-pressure centers at the surface prevailed over the southern latitudes, with the major low-pressure center lying along the eastern Arabian Peninsula as a remainder of the summer monsoon [30]. The MSLP lows over the Lut Desert and Sistan Basin seem to be of thermal origin due to low-atmosphere heating (note the highest temperatures at 850 hPa over these areas). Temperature and pressure gradients, associated with cold advection and a strong baroclinic zone, developed in Iraq, southwest Iran and north Saudi Arabia, signifying the presence of frontal systems that triggered the dust storm over the region.
In DS6, the dust storm occurred over southeast Iran and neighboring countries (Figure 1), associated with different atmospheric circulation patterns and a different triggering mechanism. At 500 hPa, a trough stretched from Central Asia to northeast Iran and reduced the temperature, while at the south and over the Arabian Peninsula high gpm dominated and the temperature at 850 hPa was significantly higher. Wind vectors at 850 hPa changed direction from northwesterly to southwesterly in the east and southeast of Iran, forming a low center of ~1440 gpm. Furthermore, an intense temperature gradient and a cold advection occurred at the west of the low-pressure center. At mean sea level, a low-pressure system with two closed cores (MSLP < 1004 hPa) prevailed in southeast Iran and south Afghanistan accompanied with frontal systems that triggered dust emissions from the Sistan Basin and Jazmurian dried beds which have been characterized as areas highly susceptible to dust emissions [54,101,108,109].
Compared to the literature, the MSLP patterns in DS3 present great similarities with those analyzed in Hamidi et al. [40], which also triggered frontal dust storms over the same area. Composite means of daily MSLP for more than 100 dust storms over Saudi Arabia from 2005 to 2012 showed that they were associated with a high-pressure system over Europe and Turkey and a low-pressure one over central and southeast Iran [110]. However, the vast majority of those dust storms occurred during the summer season with different atmospheric circulation patterns. Fattahi et al. [111] classified the synoptic weather patterns during dust storms in southwest Iran using principal component analysis (PCA), while Hermida et al. [67] identified four major atmospheric circulation patterns associated with dust outbreaks over the Arabian Peninsula and the Middle East during 2005–2013, also based on cluster analysis techniques. The atmospheric patterns at 500 hPa during the DS1, DS2 and DS3 were mostly consistent with the mean synoptic pattern of Cluster 2 in Hermida et al. [67]. In addition, the DS6 is mostly related to weather Cluster 4 of Hermida et al. [67], being more frequent in summer and associated with Sistan and Jazmurian dust storms. Recent research has shown that intense dust storms related or even triggered by cyclones in the deserts of the south Arabian Peninsula may be responsible for new cyclogenesis and extra dust emissions due to dust-induced radiative heating and instability of the lower troposphere [11].
The interactions between the lower-troposphere dynamics and the upper-atmosphere sub-tropical jet stream across the northern part of the Arabian Peninsula and southern Iran were found to be linked with dust storms over the region [28,36,112]. In this respect, Figure 3 presents the spatial patterns of the 300-hPa winds taken from NCEP/NCAR reanalysis over the region during the six examined dust storms. The position and intensity of the sub-tropical upper-level jets, with wind speeds reaching 50–60 ms−1, and their interactions with the lower troposphere systems largely control the vertical wind regimes and the frontal dust storms [113]. In DS1 and DS2, the upper-level jet traversed over northern Saudi Arabia and Iran with an axis towards northeast, while in DS3 its highest intensity was detected at southern latitudes, also split into two parts. During DS4, the sub-tropical upper-level jet was over Iraq and Iran but with weakened intensity (~40 ms–1), while in DS5 its core was moved towards northeast, also associated with the trough over Central Asia. During DS6, the upper-level jet was traversing from Egypt to northern Arabia, southern Iran and Pakistan, displaying its highest intensity (>50 ms−1) in its eastern parts, strongly associated with the dust emissions in southeast Iran and Pakistan (Figure 1 and Figure 3). The presence of the upper-level jet over central Iran caused an atmospheric disturbance and enhanced cyclonicity and switching of cold and warm fronts over the region, while strong pre-frontal winds were reported as a common trigger force of dust emissions in Saudi Arabia, Iraq and Iran [40,66,114].

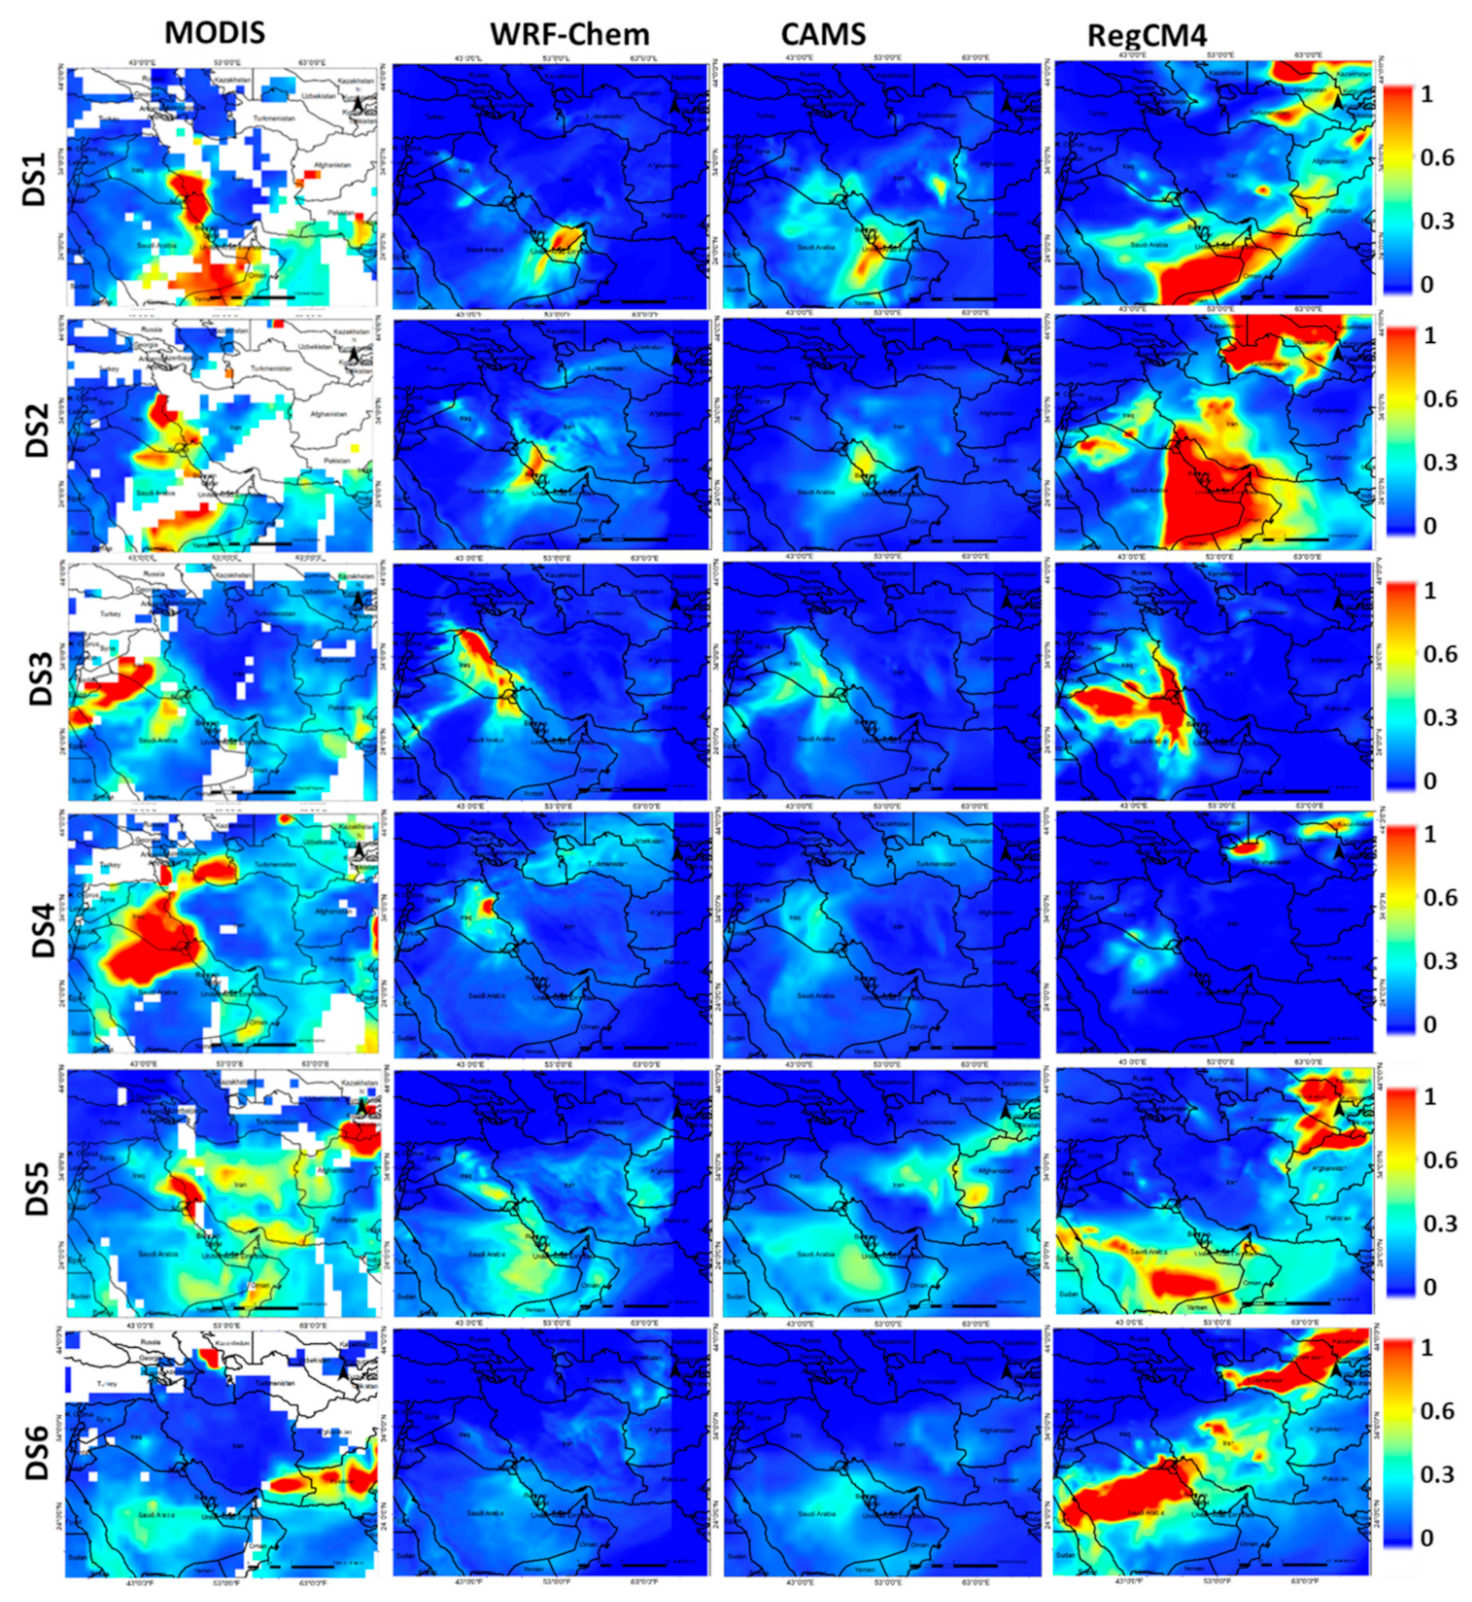
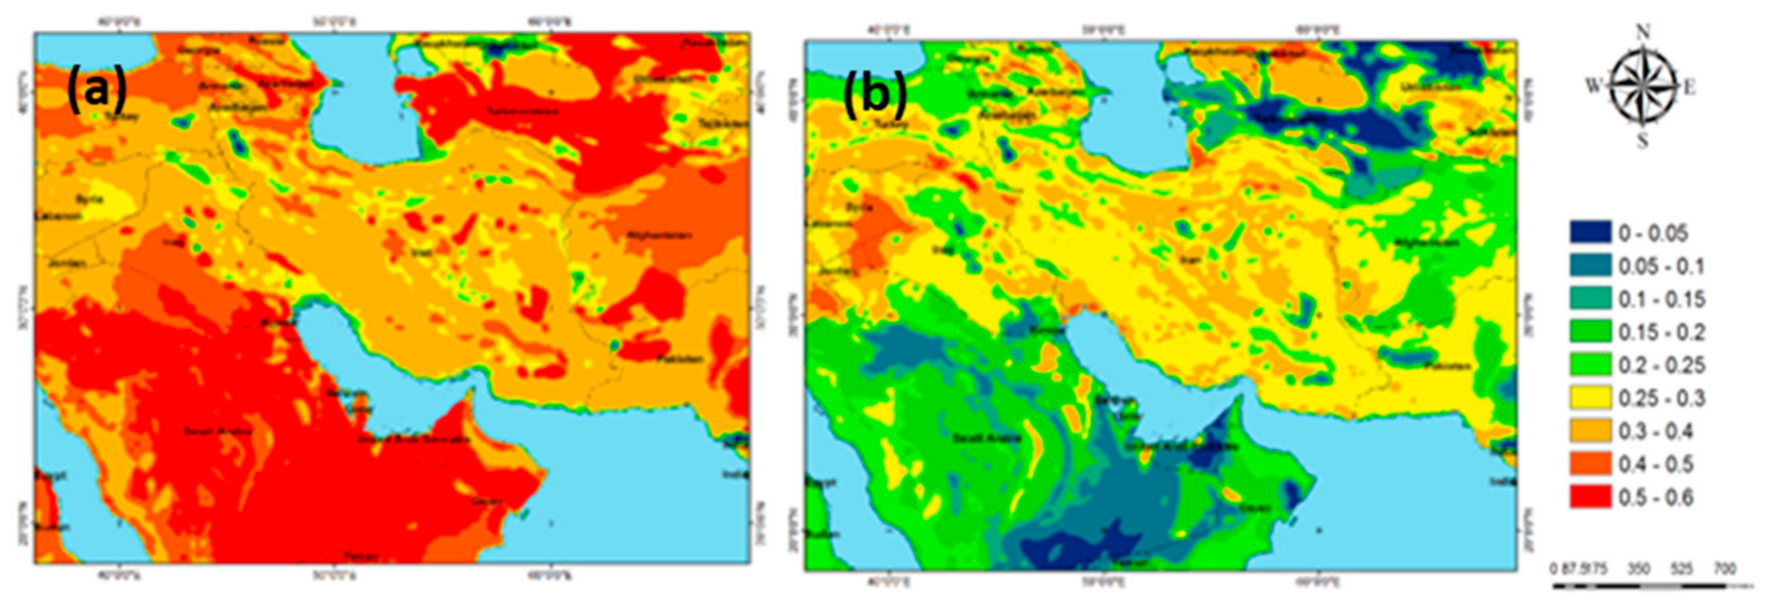
5.3. Spatial Distribution of the AOD

The spatial distributions of Terra-MODIS AODs and the model simulated ones at 9:00 UTC (close to Terra overpass) are shown in Figure 4 for the examined frontal dust storms. It should be mentioned that the present study does not attempt a direct validation of the models against MODIS AODs due to extensive cloudiness over the studied domain, while such an issue would prerequisite a validation of the MODIS 6.1 products over the desert environments [115,116,117,118,119,120,121]. In DS1, the maximum AOD values were detected over the southeast part of Iraq, southwest Iran and northern Persian Gulf, while high AODs covered the southern part of the Arabian Peninsula. Very contrasting modeling results were observed, also displaying large differences compared to MODIS observations. WRF-Chem simulated higher AODs associated with dust over south Arabia and in the innards of the Persian Gulf, while failing to reproduce the dust plumes over the Iraqi plains. CAMS generally better follows the MODIS observations, but highly underestimates the AOD values, especially at areas covered by intense dust plumes (Iraq), as shown for an intense dust storm in the Mediterranean [88]. RegCM4 does not represent well the dust storm in the southern Iraqi plains, while it simulates very high AODs over the south Arabian and Karakum deserts, contrary to the simulations of WRF-Chem and CAMS. The DS2 presents a rather similar distribution of MODIS AODs with the previous case, while WRF-Chem and CAMS outputs represent the spatial AOD distribution fairly well, but they both show a forward propagation of the dust storm compared to MODIS, which may be also attributed to the time shift between observations and model simulations.
Furthermore, both models highly underestimate the dust AOD values. On the contrary, RegCM4 presented very high AODs over the eastern and southern parts of the Arabian Peninsula, as well as over central Iran and the Karakum Desert, contrary to the other models. However, extensive presence of clouds over Central Asia does not allow the evaluation of the model results. Nevertheless, MODIS observations do not verify the high AODs simulated by RegCM4 over central Iran, indicating that the model displays many flaws in the accurate representation of the dust emissions and transport over the Middle East and Central Asia. In general, RegCM4 seems to have a tendency of overestimation of dust emissions over the Karakum and Aralkum deserts in Central Asia [122], opposing the other models. Only in DS3 did RegCM4 represent the spatial extend of the dust plume fairly well, while CAMS significantly underestimated it. In DS4, all models underestimated the MODIS AODs over Iraq and northern Saudi Arabia, while CALIPSO profiles revealed much lower intensity of the dust plumes compared to the other cases (Figure 1). WRF-Chem and CAMS represented fairly well the spatial AOD distribution in DS5, with enhanced values over Iraq, Saudi Arabia, central Iran, west Afghanistan and eastern Karakum Desert. In DS6, all models failed to accurately reproduce the escalated AODs over southeast Iran and western Pakistan, while WRF-Chem and CAMS represented well the AOD values over the Arabian Peninsula. RegCM-4 highly overestimates the AODs over central Arabia and Karakum Desert.
A previous study using WRF-CHIMERE simulations during two dust storms over the Arabian Peninsula revealed a remarkable model underestimation, which was significantly improved after consideration of anthropogenic emission inventories in the model [48]. This indicates that anthropogenic emissions maybe also be important, especially over the urban/industrial centers and in areas not directly affected by intense dust storms. Recent studies [123,124,125] revealed that anthropogenic and mixed aerosols may dominate in specific areas and seasons over the Middle East, while the anthropogenic component in AOD becomes higher during the cold period of the year [126,127]. However, any comparison in the AOD spatial distribution between MODIS observations and model simulations should be considered as qualitative, since in spite of the high accuracy of Deep Blue AODs over the region, their comparison against AERONET revealed a MODIS underestimation for the highest AODs with R2 in the order of 0.63–0.86 [8,80,128]. Detailed evaluation of the model’s performance against AERONET or other ground-based measurements was presented in several previous studies [14,42,48,85,86].

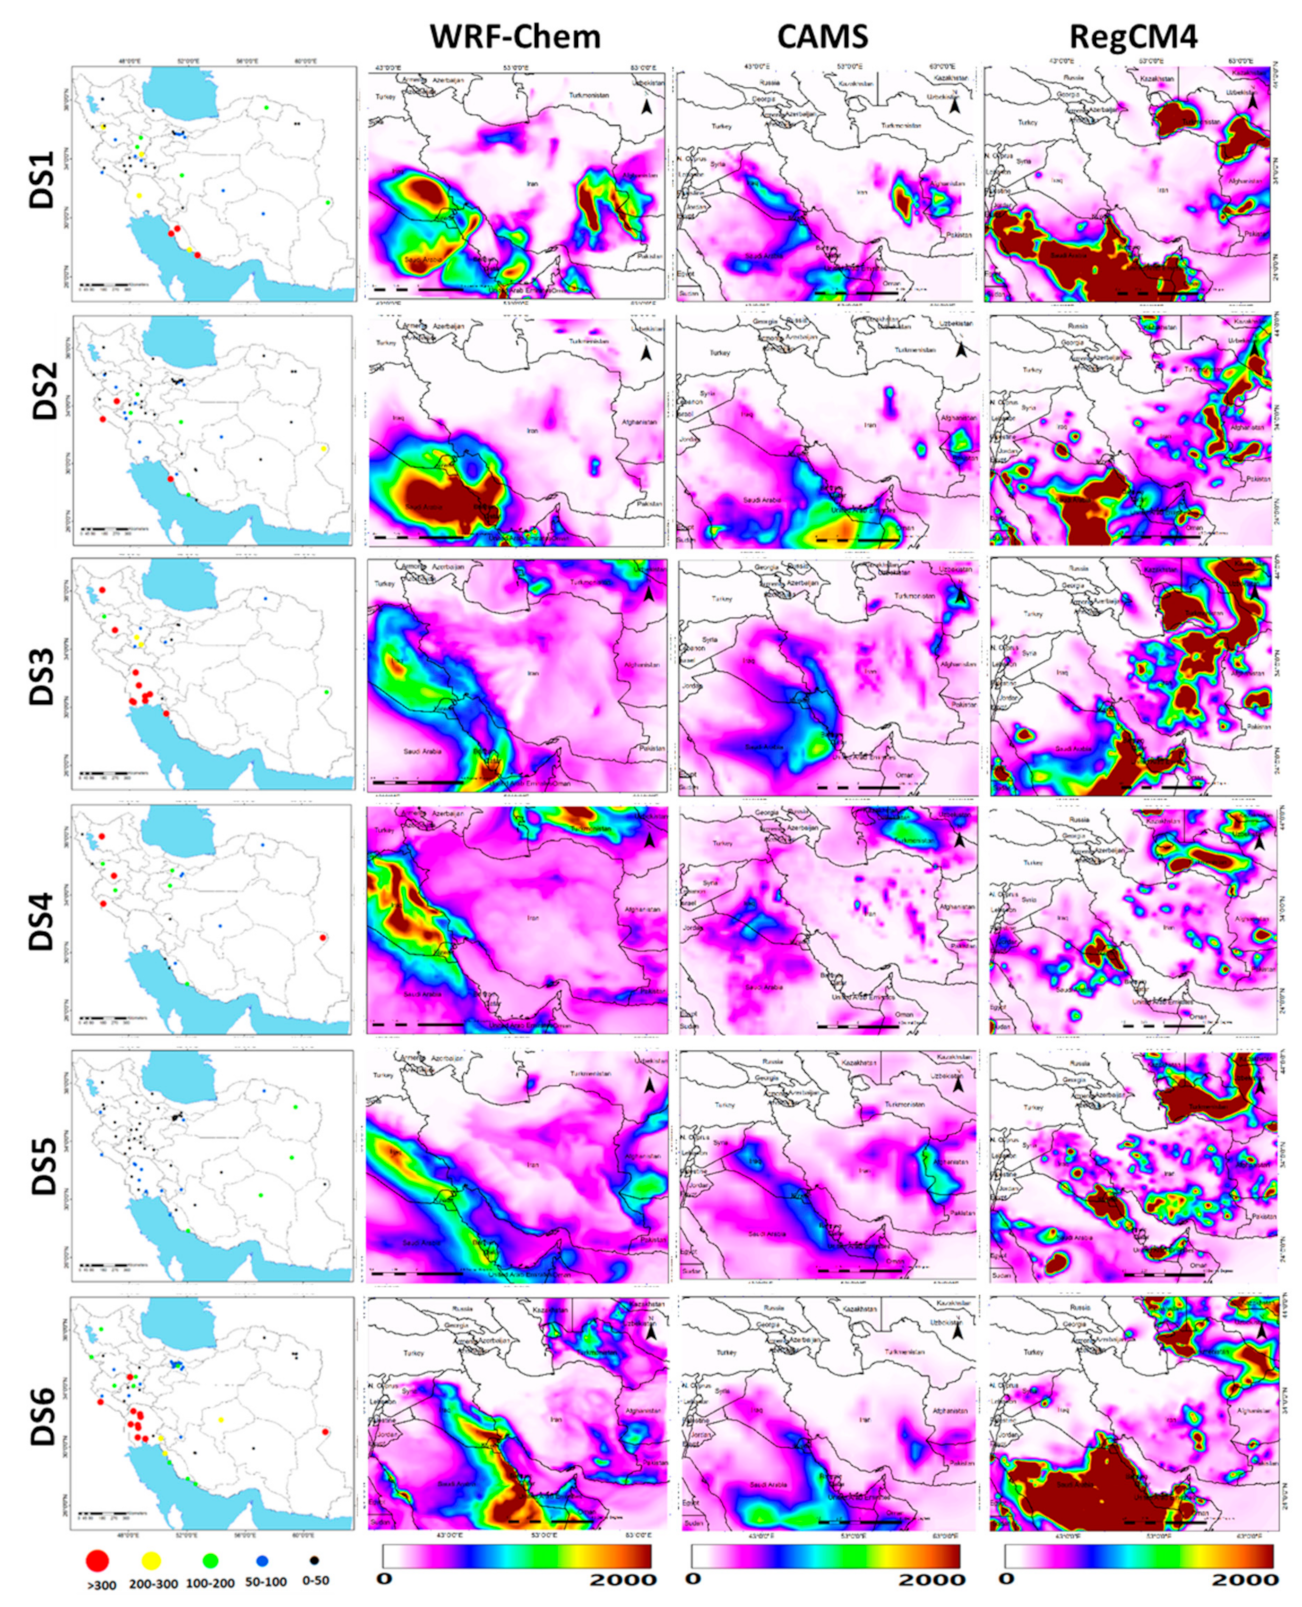
5.4. Simulations of PM10 Concentrations

Figure 5 shows the measured PM10 concentrations at selected air-quality monitoring stations in Iran, which are directly affected by the dust storms (left column), and the PM10 simulations during the same events from the three models, aiming to make a qualitative comparison between them. It is worth mentioning that anthropogenic pollutants may also contribute a significant fraction to PM10 concentrations in the large cities, but on the examined days they were mostly affected by the dust storms. The distribution of the air quality monitoring stations is not regular across Iran due to lack of PM10 measurements at the time frame of model simulations (12:00 UTC). In general, large differences are detected between the model outputs both in the amounts and spatial distribution of the PM10 concentrations. Similar to the AOD simulations, the RegCM4 model highly overestimates the PM10 levels over the Arabian Peninsula and Central Asia compared to WRF-Chem and CAMS models, simulating higher dust emissions from these desert areas. However, RegCM4 highly underestimates or even fails to capture the dust PM10 over Iraq in all the examined cases, indicating an incapability of representing dust events originating from this source. In addition, although WRF-Chem and CAMS presented similarities in the spatial distribution of PM10 on the examined days, CAMS significantly underestimated the PM10 levels compared to WRF-Chem, especially over the areas strongly affected by dust storms, like the Iraqi plains, east and south Arabian Peninsula, and southwest and east Iran. Maximum PM10 concentrations of above 2000 µg m−3 are rather common in the Middle East, Arabian Peninsula and Southwest Asia during intense dust storms, as recorded at several studies [35,41,105,129,130]. The simulated PM10 levels over the areas directly affected by the dust storms are also comparable to those from the WRF-CHIMERE model during selected dust storms in the Arabian Peninsula, which were found to reach about 3–4.5 mg m−3 near the surface [37].
Furthermore, the measured PM10 concentrations at the selected stations have shown good agreement with the predictions of WRF-Chem and CAMS models (qualitative evaluation), but not with RegCM4. More specifically, in DS1 stations located in southwest Iran and in the coastal Persian Gulf displayed the highest PM10 levels (>200–300 µg m−3) in consistency with the WRF-Chem predictions. A similar pattern was also observed in DS3, with enhanced PM10 (measured and simulated) across Iraq-Iran borders. High PM10 concentrations in Tabriz (a megacity in northwest Iran) were not coincident either with meteorological records of dust presence or with model simulations of dust AODs and are likely attributed to high PM10 levels due to industrial activities or even to dust particles from the surrounding arid landscapes and dried beds in lake Urmia [131]. In DS5, the measured PM10 concentrations were rather low (50–100 µg m−3) across southwest Iran in agreement with CAMS outputs, while WRF-Chem predicted higher PM10 levels. On the other hand, WRF-Chem simulated the enhanced PM10 concentrations over southwest Iran in DS6 and at Zabol station in Sistan (east Iran) reasonably well. Although the frontal dust storm in DS6 occurred over southeast Iran (Figure 1), the WRF-Chem model also predicts high PM10 levels in southwest Iran, also justified by the measured PM10 due to a dust event over the area.
Overall, the main findings from this qualitative comparison are that WRF-Chem and CAMS models are in general agreement regarding the spatial distribution of PM10, with WRF-Chem predicting higher concentrations, especially over the Iraqi flood plains and neighboring affected areas. These simulations are in agreement with satellite imagery and measurements from air-quality stations. On the contrary, the RegCM4 model simulated high dust concentrations over Turkmenistan and Saudi Arabia and failed to represent the dust storms over Iraq in all the cases. Large differences were observed between the outputs of the three models in predicting frontal dust storms in the Middle East, indicating the need for further development [79,132]. Hyde et al. [133] simulated 12 dust storms in Arizona using the WRF-Chem model and compared the PM10 concentrations with observational data. In those cases, the WRF-Chem model simulated the dust sources well, but it did not reproduce the PM10 concentrations well. The differences in PM10 outputs between the model simulations are attributed to the high sensitivity of the models to dust emission schemes, soil characteristics, erodibility and surface roughness, highlighting the necessity of using accurate schemes [12,48,134].

5.5. Differences between the Model Simulations

Previous analysis revealed remarkable differences between the model simulations of the amounts and spatial distribution of AOD and PM10 concentrations during the six examined dust storms (Figure 4 and Figure 5). This section discusses the reasons for these differences and the large discrepancies that models present against MODIS observations.
In numerical dust simulations, the surface characteristics are very important for calculating the dust emission fluxes. Models usually use standard soil texture and vegetation-cover datasets to calculate the dust emissions, while they may parameterize the relationship between soil texture and dust emissions in a different way [42,79,80]. Figure 6 shows the fractions of clay and sand in the Middle East region used in the WRF model, which are important factors for land susceptibility to wind erosion [100,101] and for estimating the emission fluxes [135]. These data (with 90 m resolution) are provided by the Food and Agriculture Organization (FAO) soil map. A comparison between the two figures (Figure 6a,b) reveals increased clay fraction in vast area of Iran and higher sand fraction in the whole Saudi Arabia, Turkmenistan and Iraqi flood plains.
The land-cover and vegetation classes map used in the RegCM4 model is shown in Figure 7. The figure reveals a clear dominance of desert and semi-desert areas across the Arabian Peninsula, Iraq, Iran and Turkmenistan, which are not of the same type, displaying large differences in the clay/silt/sand fractions (Figure 6) [42,86]. This likely affects the overestimated dust fluxes over the Karakum Desert, while different types of vegetation occur in north Iraq and along the mountainous ranges in Iran (Zagros and Alborz mountains). In addition, the effect of soil salinity is very important for simulations of dust emissions in the Middle East and Southwest Asia, as soil salinity affects the coherence forces between soil particles [42,86]. Therefore, the large uncertainties observed from the RegCM4 model in AOD simulations are likely attributed to inaccuracies in representation of soil conditions and surface characteristics (vegetation cover, roughness and soil type) implemented in the dust scheme [136]. Previous study using the static Ginoux Source Function (GSF) in WRF-Chem resulted in great uncertainties in dust simulations over the Middle East, which remained—although reduced—even after the use of an updated source function for this region, named West Asia source function (WASF; [80]). Similar to our results, several studies agree to larger discrepancies in dust simulations and model underestimations close to the dust source due to inaccuracies in soil properties, land susceptibility, wind regime, threshold friction velocity, etc [31,74,80].
Apart from the soil/surface characteristics and dust emission schemes, numerical dust simulations are highly dependent on the capability of the model to represent accurately the atmospheric conditions like wind speed and direction and, therefore, the quality of the simulations depend on the model’s ability to represent the local/regional meteorology. In the present cases, if the models are able to detect the fronts correctly, the intense surface winds and sudden changes in wind direction would be also simulated well, thus leading to better performances. Concurrent model underestimation in soil moisture and overestimation in wind speed compared to ECMWF resulted in enhanced dust emissions in the Middle East from the WRF-Chem compared to other models [80]. In addition, the simulation performance of the AOD and PM10 spatial distributions depends on the models’ capability to represent the transport, dilution and deposition (dry and wet) processes. The rough topography of the Middle East and Southwest Asia further affects the models’ performance, since the high mountainous ranges modify the wind flow and vertical profiles, leading to canalization of the dust storms between the mountains and large changes in wind shear and dust emissions [83,137]. Therefore, the spatial resolution and the accuracy in representation of the rough topography are important factors for accurate dust simulations over Southwest Asia [132] and the coarser spatial resolution of RegCM4 (45 km) may be a reason for the lower performance in dust simulations.

5.6. Meteorological Dynamics and Dust Concentrations via WRF-Chem Model

Figure 8 shows the simulated MSLP patterns over the Middle East during the six dust storms, along with vertical cross-sections of the potential temperature (θ), wind speed and direction, dust concentration and RH outputs from the WRF-Chem model. The longitude-vertical cross sections were performed around 31° N (red line in left panels), where all the examined dust events were detected. The dust storms were triggered by various mechanisms and under different synoptic and dynamic meteorological conditions in each event. The potential temperature profiles and atmospheric stability are key factors for dust uplift [113], while the cyclonicity near the surface [38,138] and the upper-atmosphere subtropical jet streams [112] are also very important.
WRF-Chem provides MSLP simulations in great consistency with GFS data (Figure 2) for all dust-storm events. Therefore, WRF-Chem displayed low MSLP over central-east Iran during DS1 and high-pressure conditions over the western half of Iraq, Turkey and the Caspian Sea with clearly defined pressure gradients along north Iran and east of Iraq that are associated with the frontal systems. Similarly, in DS2 the model represented satisfactorily the low-pressure center over the Iranian Plateau and the low-pressure stretching in northwest Iraq. The high pressure over Turkey was also well simulated by the model, as well as the expanded low pressure located over the Iraqi–Syrian borders in DS3. In DS4, the model simulated accurately the low-pressure system over north of the Caspian Sea, as well as the tongue of lower MSLP from Turkey to Iraq. The model’s capability in providing accurate simulations of MSLP was also verified in DS5, while in DS6, although the spatial distribution of the modelled MSLP generally followed that of GFS, WRF-Chem did not simulate the lower pressure conditions over southeast Iran well, probably being the main reason for the high underestimation of dust AOD (Figure 4) and surface PM10 concentrations (Figure 5) during that dust storm. These results verify the capability of WRF-Chem in representing the meteorological conditions associated with dust-storm events over the Middle East and South Asia, as shown in several previous studies [42,74,76,80,106,139,140,141,142].
In DS1, the vertical cross-sections of the potential temperature and wind reveal a baroclinic atmosphere with an increase in potential temperature at the eastern longitudes for a standard pressure level. At the western parts, lowest potential temperatures are shown near the surface with a downward wind speed enhancing the subsidence and MSLP over the region (west Iraq), while the larger gradient in the vertical potential temperature—compared to eastern longitudes—indicates increased atmospheric stability. The rate of change (gradient) in potential temperature and a sudden change in wind direction around 45–46° E define the presence of a front. An upward air flow is observed in front of the cold front, while at the upper atmospheric levels the jet stream is detected at lower altitudes (~400–450 hPa) above the area of the frontal system, indicating its crucial role in the propagation of the front and the associated dust storm. WRF-Chem outputs reveal high concentrations of dust (>1400 µg m−3) just behind the front, vertically extended to 700 hPa. A weaker dust plume is also shown ahead of the front but confined near the surface. In general, WRF-Chem model reproduced the presence of the cold front and the dust mass behind it quite well in this case.
The atmospheric conditions are very similar during DS2. A sudden drop in potential temperature and a strong change in RH gradients around 50° E signify the presence of a front, while a dust plume is observed behind it (post-frontal dust storm), although not well captured in this cross section since it was mostly simulated at southern latitudes (Figure 4 and Figure 5). The downward movement of momentum at areas behind the frontal dust storm has been found to be especially important for the dust generation [137]. It is worth mentioning that the presence of the Zagros Mountains may affect the meteorological profiles i.e., temperature, stability, wind speed and RH, while at the upper levels the jet stream was observed at lower heights (~400 hPa) over the frontal system, similar to DS1.
In DS3 the situation is a little different, with the horizontal gradient in potential temperature and the sudden change in wind direction occurring at ~47° E, while the upper-level jet was nearly absent in great similarity with NCEP/NCAR reanalysis (Figure 3). In this case, the maximum concentration of dust was simulated ahead of the frontal area and dust plumes lifted up to 2 km. The RH was high above the dust mass (>3–4 km), which is likely related to the presence of clouds, as MODIS and CALIPSO observations showed (Figure 1).
In DS4, the potential temperature presents the smoothest gradient both horizontally and vertically, thus indicating fewer stable conditions, weaker winds and weakened frontal systems. However, a sudden increase in potential temperature and a change in wind direction and RH gradient around 44–45° E indicates the presence of a frontal area (cold front), which is associated with dust emissions just ahead of it, reaching up to 3 km. The less stable conditions in this case favored the uplift of dust and its mixing from the surface until about 3 km. As also verified by NCEP/NCAR reanalysis, the upper-level sub-tropical jet was weaker in this case.
DS5 is associated with higher θ near the surface compared to the other cases, except DS4. The horizontal gradient in potential temperature, along with the sudden change in wind direction and RH, are seen over the mountain topography (longitude of ~52° E), which is consistent with the east frontal system in Figure 5. The emitted dust was simulated behind this frontal area (post-frontal dust storm) and it was expanded over a large area, as also verified from the meteorological and satellite observations (Figure 1 and Figure 2). Changes in wind directions (turbulent winds) and weak vertical gradients of the potential temperature over the Sistan Basin (longitude 61° E) show more unstable conditions, which favored dust emissions, as also verified by MODIS observations and CAMS simulations (Figure 4), while GFS data revealed the presence of low MSLP conditions that facilitated dust convection (Figure 2).
The atmospheric situation was totally different in DS6, with a sudden change in wind direction detected at ~59° E, verifying the presence of a front over east Iran, as also shown in Figure 2. WRF-Chem simulations of dust plume are observed just behind the frontal area (post-front dust storm). In this case, the simulated RH remained low throughout the area, indicating absence of clouds over the region and a dry atmosphere. On the other hand, the change in wind direction in the vertical between surface and ~2.5 km, and the horizontal and vertical distribution of the winds in the area 57–62° E, indicates presence of a rather occluded front over East Iran with a dispersion of dust around the area (Figure 1).

6. Conclusions

This study analyzed the atmospheric circulation patterns, driven mechanisms and spatial distribution of six intense pre- and post-frontal dust storms over the Middle East during the cold period of the year. Numerical simulations of the AOD and PM10 concentrations were performed via the synergy of three numerical models (WRF-Chem, CAMS and RegCM4) during the dust-storm events. In addition, GFS and NCEP/NCAR re-analysis data at surface and various atmospheric levels (e.g., 850, 500, 300 hPa) were synergized to investigate the synoptic conditions that were associated with or even facilitated the frontal dust storms. Atmospheric fronts were the trigger mechanism for the generation of these dust storms, with the frontal areas being characterized by atmospheric instability and strong near-surface winds. The dust storms were generated over the southern Iraqi plains and northern part of the Arabian Peninsula and affected the southwest part of Iran, while one dust storm was generated over the east Iranian deserts and drylands. MODIS and CALIPSO satellite observations were used to monitor the spatial and vertical distribution of the dust plumes, which were accompanied by clouds due to the presence of frontal systems. The CALIPSO observations revealed the presence of dust in the lower troposphere, mostly confined below 2 km.
The analysis of the synoptic meteorological conditions revealed that in most of the cases, a trough at 500 hPa was observed over Turkey and north Iraq, while low-pressure systems were developed in front of the trough, which could be strengthened by wind divergence and vertical motions. In DS5 and DS6, this trough was found to be placed over Central Asia, east of the Caspian Sea, and affected the northeastern part of Iran. These troughs were related with the Siberian anticyclone and constituted a major climatic factor controlling the dust activity in the Middle East during the cold period of the year by developing cold fronts at the surface that caused intense pre- and post-frontal dust storms. In five of the examined cases, cold fronts were located over Iraq and along the southwest part of Iran, while in DS6, a cold front was located in southeast Iran accompanied with another one in southeast Iraq. The frontal dust storms were associated with sub-tropical jet streams at 300 hPa over the northern Saudi Arabia, Persian Gulf and south-central Iran, with winds surpassing 40–50 ms−1.
Comparing the outputs (AOD and PM10 concentrations) from WRF-Chem, CAMS and RegCM4 models and qualitatively comparing them with MODIS (Level 3) observations showed that CAMS and WRF-Chem represented the spatial distribution of the MODIS AOD fairly well, but they highly underestimated it, while in a few cases they failed to reproduce the dust plumes over the Middle East. On the contrary, the RegCM4 model displayed notable differences in the spatial distribution of AOD and PM10 since it simulated large dust concentrations over the Central Arabian Peninsula, Turkmenistan and parts of the Iranian plateau, while it failed to accurately reproduce the dust storms over the Iraqi plains and in the western half of Iran. Different soil/surface and vegetation cover maps, as well as dust schemes between the models, along with differences in meteorological boundary conditions control the dust simulations.
Further analysis showed that WRF-Chem reproduced the MSLP over the Middle East well in all the examined dust events, despite a slight underestimation at the core of the low-pressure centers. Changes in potential temperature gradients, along with sudden changes in wind direction in vertical cross-sections simulated by WRF-Chem, detected the presence of the frontal systems. WRF-Chem also simulated the vertical distribution (up to 2 km) and the position of the main dust plumes fairly well, either behind or ahead of the frontal systems. The frontal dust storms cause financial and life losses in the Middle East region every year. Accurate model simulations of such phenomena with an active early warning system will help in mitigating their devastating impacts on the natural environment and human life. Overall, the regional dust models are a useful tool to study and predict the frontal dust storms in the Middle East region, but extra care must be taken to thoroughly test and improve their performance over a complex topography.

Author Contributions

Conceptualization, S.K., N.H.H. and D.G.K.; methodology, S.K., N.H.H., and M.M.; formal analysis, S.K., N.H.H. and M.M.; data curation, S.K., N.H.H., M.M. and D.G.K.; writing—original draft preparation, D.G.K. and N.H.H.; writing—review and editing, D.G.K., N.H.H., I.T., and C.O.; supervision, N.H.H. All authors have read and agreed to the published version of the manuscript.

Funding

This research received no external funding.

Institutional Review Board Statement

Not applicable.

Informed Consent Statement

Informed consent was obtained from all subjects involved in the study.

Data Availability Statement

Data are available upon request.

Acknowledgments

The GFS and NCEP/NCAR reanalysis teams are gratefully acknowledged for providing the meteorological maps. We are also thankful for MODIS AOD retrievals via Giovanni (https://giovanni.sci.gsfc.nasa.gov/giovanni/). The authors also thank the members of NASA Langley Research Centre Atmospheric Science Data Center for providing the CALIPSO profile datasets used in this work. CAMS and RegCM4 outputs were taken from the Sand and Dust Storm Warning Advisory and Assessment System (SDS-WAS; https://sds-was.aemet.es). D.G.K. acknowledges the support of the project “PANhellenic infrastructure for Atmospheric Composition and climatE change” PANACEA (MIS 5021516), funded by the Operational Program “Competitiveness, Entrepreneurship and Innovation” (NSRF 2014–2020) and co-financed by Greece and the European Union.

Conflicts of Interest

The authors declare no conflict of interest.

References

  1. Mahowald, N.M.; Baker, A.R.; Bergametti, G.; Brooks, N.; Duce, R.A.; Jickells, T.D.; Kubilay, N.; Prospero, J.M.; Tegen, I. Atmospheric global dust cycle and iron inputs to the ocean. Glob. Biogeochem. Cycles 2005, 19. [Google Scholar] [CrossRef]
  2. Middleton, N.; Kang, U. Sand and dust storms: Impact mitigation. Sustainability 2017, 9, 1053. [Google Scholar] [CrossRef] [Green Version]
  3. Schepanski, K. Transport of mineral dust and its impact on climate. Geosciences 2018, 8, 151. [Google Scholar] [CrossRef] [Green Version]
  4. Barkan, J.; Alpert, P.; Kutiel, H.; Kishcha, P. Synoptics of dust transportation days from Africa toward Italy and central Europe. J. Geophys. Res. 2005, 110, D07208. [Google Scholar] [CrossRef] [Green Version]
  5. Fernández, A.J.; Sicard, M.; Costa, M.J.; Guerrero-Rascado, J.L.; Gómez-Amo, J.L.; Molero, F.; Barragán, R.; Basart, S.; Bortoli, D.; Bedoya-Velásquez, A.E.; et al. Extreme, wintertime Saharan dust intrusion in the Iberian Peninsula: Lidar monitoring and evaluation of dust forecast models during the February 2017 event. Atmos. Res. 2019, 228, 223–241. [Google Scholar] [CrossRef]
  6. Shi, L.; Zhang, J.; Yao, F.; Zhang, D.; Guo, H. Drivers to dust emissions over dust belt from 1980 to 2018 and their variation in two global warming phases. Sci. Total Environ. 2021. [Google Scholar] [CrossRef]
  7. Yassin, M.F.; Almutairi, S.K.; Al-Hemoud, A. Dust storms backward Trajectories’ and source identification over Kuwait. Atmos. Res. 2018, 212, 158–171. [Google Scholar] [CrossRef]
  8. Gandham, H.; Dasari, H.P.; Langodan, S.; Karumuri, R.K.; Hoteit, I. Major changes in extreme dust events dynamics over the Arabian Peninsula during 2003–2017 driven by atmospheric conditions. J. Geophys. Res. 2020. [Google Scholar] [CrossRef]
  9. Mohammadpour, K.; Sciortino, M.; Saligheh, M.; Raziei, T.; Boloorani, A.D. Spatiotemporal regionalization of atmospheric dust based on multivariate analysis of MACC model over Iran. Atmos. Res. 2020, 249, 105322. [Google Scholar] [CrossRef]
  10. Shao, Y.; Wyrwoll, K.H.; Chappell, A.; Huang, J.; Lin, Z.; McTainsh, G.H.; Mikami, M.; Tanaka, T.Y.; Wang, X.; Yoon, S. Dust cycle: An emerging core theme in Earth system science. Aeol. Res. 2011, 2, 181–204. [Google Scholar] [CrossRef]
  11. Francis, D.; Chaboureau, J.-P.; Nelli, N.; Cuesta, J.; Alshamsi, N.; Temimi, M.; Pauluis, O.; Xue, L. Summertime dust storms over the Arabian Peninsula and impacts on radiation, circulation, cloud development and rain. Atmos. Res. 2020, 105364. [Google Scholar] [CrossRef]
  12. Jish Prakash, P.; Stenchikov, G.; Kalenderski, S.; Osipov, S.; Bangalath, H. The impact of dust storms on the Arabian Peninsula and the Red Sea. Atmos. Chem. Phys. 2015, 15, 199–222. [Google Scholar] [CrossRef] [Green Version]
  13. Jin, Q.; Yang, Z.L.; Wei, J. Seasonal responses of Indian summer monsoon to dust aerosols in the Middle East, India, and China. J. Clim. 2016, 29, 6329–6349. [Google Scholar] [CrossRef]
  14. Solmon, F.; Nair, V.S.; Mallet, M. Increasing Arabian dust activity and the Indian Summer Monsoon. Atmos. Chem. Phys. 2015, 15, 8051–8064. [Google Scholar] [CrossRef] [Green Version]
  15. Bamehr, S.; Sabetghadam, S. Estimation of global solar radiation data based on satellite-derived atmospheric parameters over the urban area of Mashhad, Iran. Environ. Sci. Poll. Res. 2020. [Google Scholar] [CrossRef]
  16. Gherboudj, I.; Ghedira, H. Assessment of solar energy potential over the United Arab Emirates using remote sensing and weather forecast data. Renew. Sustain. Energy Rev. 2016, 55, 1210–1224. [Google Scholar] [CrossRef]
  17. Gholami, A.; Ameri, M.; Zandi, M.; Ghoachani, R.G.; Eslami, S.; Pierfederici, S. Photovoltaic Potential Assessment and Dust Impacts on Photovoltaic Systems in Iran: Review Paper. IEEE J. Photov. 2020. [Google Scholar] [CrossRef]
  18. Roshan, D.R.; Koc, M.; Abdallah, A.; Martin-Pomares, L.; Isaifan, R.; Fountoukis, C. UV Index Forecasting under the Influence of Desert Dust: Evaluation against Surface and Satellite-Retrieved Data. Atmosphere 2020, 11, 96. [Google Scholar] [CrossRef] [Green Version]
  19. Miri, A.; Ahmadi, H.; Ekhtesasi, M.R.; Panjehkeh, N.; Ghanbari, A. Environmental and socio-economic impacts of dust storms in Sistan Region, Iran. Intern. J. Environ. Stud. 2009, 66, 343–355. [Google Scholar] [CrossRef]
  20. Sharifikia, M. Environmental challenges and drought hazard assessment of Hamoun Desert Lake in Sistan region, Iran, based on the time series of satellite imagery. Nat. Hazards 2013, 65, 201–217. [Google Scholar] [CrossRef]
  21. Ebrahimi, S.J.; Ebrahimzadeh, L.; Eslami, A.; Bidarpoor, F. Effects of dust storm events on emergency admissions for cardiovascular and respiratory diseases in Sanandaj, Iran. J. Environ. Health Sci. Eng. 2014, 12, 1–5. [Google Scholar] [CrossRef] [PubMed] [Green Version]
  22. Soleimani, Z.; Teymouri, P.; Darvishi Boloorani, A.; Mesdaghinia, A.; Middleton, N.; Griffin, D.W. An overview of bioaerosol load and health impacts associated with dust storms: A focus on the Middle East. Atmos. Environ. 2020, 223, 117187. [Google Scholar] [CrossRef]
  23. Klingmüller, K.; Pozzer, A.; Metzger, S.; Stenchikov, G.L.; Lelieveld, J. Aerosol optical depth trend over the Middle East. Atmos. Chem. Phys. 2016, 16, 5063–5073. [Google Scholar] [CrossRef] [Green Version]
  24. Notaro, M.; Yu, Y.; Kalashnikova, O.V. Regime shift in Arabian dust activity, triggered by persistent Fertile Crescent drought. J. Geophys. Res. 2015, 120, 10229–10249. [Google Scholar] [CrossRef]
  25. Miri, A.; Maleki, S.; Middleton, N. An investigation into climatic and terrestrial drivers of dust storms in the Sistan region of Iran in the early twenty-first century. Sci. Total Environ. 2021, 757, 143952. [Google Scholar] [CrossRef] [PubMed]
  26. Rashki, A.; Kaskaoutis, D.G.; Eriksson, P.G.; Rautenbach, C.D.W.; Flamant, C.; Vishkaee, F.A. Spatio-temporal variability of dust aerosols over the Sistan region in Iran based on satellite observations. Nat. Hazards 2014, 71, 563–585. [Google Scholar] [CrossRef] [Green Version]
  27. Yu, Y.; Notaro, M.; Kalashnikova, O.V.; Garay, M.J. Climatology of summer Shamal wind in the Middle East. J. Geophys. Res. 2016, 121, 289–305. [Google Scholar] [CrossRef] [Green Version]
  28. Yu, Y.; Notaro, M.; Liu, Z.; Wang, F.; Alkolibi, F.; Fadda, E.; Bakhrjy, F. Climatic controls on the interannual to decadal variability in Saudi Arabian dust activity: Toward the development of a seasonal dust prediction model. J. Geophys. Res. 2015, 120, 1739–1758. [Google Scholar] [CrossRef]
  29. Labban, A.H.; Mashat, A.S.; Awad, A.M. The variability of the Siberian High Ridge over the Middle East. Intern. J. Climat. 2020. [Google Scholar] [CrossRef]
  30. Rashki, A.; Kaskaoutis, D.G.; Mofidi, A.; Minvielle, F.; Chiapello, I.; Legrand, M.; Dumka, U.C.; Francois, P. Effects of Monsoon, Shamal and Levar winds on dust accumulation over the Arabian Sea during summer–The July 2016 case. Aeol. Res. 2019, 36, 27–44. [Google Scholar] [CrossRef]
  31. Solomos, S.; Abuelgasim, A.; Spyrou, C.; Binietoglou, I.; Nickovic, S. Development of a dynamic dust source map for NMME-DREAM v1.0 model based on MODIS Normalized Difference Vegetation Index (NDVI) over the Arabian Peninsula. Geosci. Model Dev. 2019, 12, 979–988. [Google Scholar] [CrossRef] [Green Version]
  32. Rezazadeh, M.; Irannejad, P.; Shao, Y. Climatology of the Middle East dust events. Aeol. Res. 2013, 10, 103–109. [Google Scholar] [CrossRef]
  33. Shalaby, A.; Rappenglueck, B.; Eltahir, E.A.B. The climatology of dust aerosol over the Arabian Peninsula. Atmos. Chem. Phys. Discuss. 2015, 15, 1523–1571. [Google Scholar] [CrossRef] [Green Version]
  34. Awad, A.M.; Mashat, A.W.S. Synoptic characteristics of spring dust days over northern Saudi Arabia. Air Qual. Atmos. Health 2016, 9, 41–50. [Google Scholar] [CrossRef]
  35. Saeed, T.M.; Al-Dashti, H.; Spyrou, C. Aerosol’s optical and physical characteristics and direct radiative forcing during a shamal dust storm, a case study. Atmos. Chem. Phys. 2014, 14, 3751–3769. [Google Scholar] [CrossRef] [Green Version]
  36. Francis, D.; Flamant, C.; Chaboureau, J.P.; Banks, J.; Cuesta, J.; Brindley, H.; Oolman, L. Dust emission and transport over Iraq associated with the summer Shamal winds. Aeol. Res. 2017, 24, 15–31. [Google Scholar] [CrossRef]
  37. Beegum, S.N.; Gherboudj, I.; Chaouch, N.; Temimi, M.; Ghedira, H. Simulation and analysis of synoptic scale dust storms over the Arabian Peninsula. Atmos. Res. 2018, 199, 62–81. [Google Scholar] [CrossRef]
  38. Francis, D.; Alshamsi, N.; Cuesta, J.; Gokcen Isik, A.; Dundar, C. Cyclogenesis and density currents in the Middle East and the associated dust activity in September 2015. Geosciences 2019, 9, 376. [Google Scholar] [CrossRef] [Green Version]
  39. Knippertz, P.; Todd, M.C. Mineral dust aerosols over the Sahara: Meteorological controls on emission and transport and implications for modeling. Rev. Geophys. 2012, 50. [Google Scholar] [CrossRef]
  40. Hamidi, M.; Kavianpour, M.R.; Shao, Y. Synoptic analysis of dust storms in the Middle East. Asia-Pac. J. Atmos. Sci. 2013, 49, 279–286. [Google Scholar] [CrossRef]
  41. Maghrabi, A.; Alharbi, B.; Tapper, N. Impact of the March 2009 dust event in Saudi Arabia on aerosol optical properties, meteorological parameters, sky temperature and emissivity. Atmos. Environ. 2011, 45, 2164–2173. [Google Scholar] [CrossRef]
  42. Hamidi, M.; Kavianpour, M.R.; Shao, Y. A quantitative evaluation of the 3–8 July 2009 Shamal dust storm. Aeol. Res. 2017, 24, 133–143. [Google Scholar] [CrossRef]
  43. Kalenderski, S.; Stenchikov, G.; Zhao, C. Modeling a typical winter-time dust event over the Arabian Peninsula and the Red Sea. Atmos. Chem. Phys. 2013, 13, 1999–2014. [Google Scholar] [CrossRef] [Green Version]
  44. Alam, K.; Trautmann, T.; Blaschke, T.; Subhan, F. Changes in aerosol optical properties due to dust storms in the Middle East and Southwest Asia. Rem. Sens. Environ. 2014, 143, 216–227. [Google Scholar] [CrossRef]
  45. Najafi, M.S.; Khoshakhllagh, F.; Zamanzadeh, S.M.; Shirazi, M.H.; Samadi, M.; Hajikhani, S. Characteristics of TSP loads during the Middle East springtime dust storm (MESDS) in Western Iran. Arab. J. Geosci. 2014, 7, 5367–5381. [Google Scholar] [CrossRef]
  46. Gharibzadeh, M.; Alam, K.; Bidokhti, A.A.; Abedini, Y.; Masoumi, A. Radiative Effects and Optical Properties of Aerosol during Two Dust Events in 2013 over Zanjan, Iran. Aeros. Air Qual. Res. 2017, 17. [Google Scholar] [CrossRef] [Green Version]
  47. Goldberg, D.L.; Gupta, P.; Wang, K.; Jena, C.; Zhang, Y.; Lu, Z.F.; Streets, D.G. Using gapfilled MAIAC AOD and WRF-Chem to estimate daily PM2.5 concentrations at 1 km resolution in the Eastern United States. Atmos. Environ. 2019, 199, 443–452. [Google Scholar] [CrossRef]
  48. Beegum, S.N.; Gherboudj, I.; Chaouch, N.; Couvidat, F.; Menut, L.; Ghedira, H. Simulating aerosols over Arabian Peninsula with CHIMERE: Sensitivity to soil, surface parameters and anthropogenic emission inventories. Atmos. Environ. 2016, 128, 185–197. [Google Scholar] [CrossRef]
  49. Grell, G.; Fast, J.; Gustafson, W.I.; Peckham, S.E.; McKeen, S.; Salzmann, M.; Freitas, S. On-line chemistry within WRF: Description and evaluation of a State-of-the-Art multiscale air quality and weather prediction model. In Integrated Systems of Meso-Meteorological and Chemical Transport Models; Springer: Berlin/Heidelberg, Germany, 2010; pp. 41–54. [Google Scholar]
  50. Benedetti, A.; Morcrette, J.J.; Boucher, O.; Dethof, A.; Engelen, R.J.; Fisher, M.; Flentje, H.; Huneeus, N.; Jones, L.; Kaiser, J.W.; et al. Aerosol analysis and forecast in the European centre for medium-range weather forecasts integrated forecast system: 2. Data assimilation. J. Geophys. Res. 2009, 114. [Google Scholar] [CrossRef] [Green Version]
  51. Zakey, A.S.; Solmon, F.; Giorgi, F. Implementation and testing of a desert dust module in a regional climate model. Atmos. Chem. Phys. 2006, 6, 4687–4704. [Google Scholar] [CrossRef] [Green Version]
  52. Ginoux, P.; Prospero, J.M.; Gill, T.E.; Hsu, N.C.; Zhao, M. Global-scale attribution of anthropogenic and natural dust sources and their emission rates based on MODIS Deep Blue aerosol products. Rev. Geophys. 2012, 50, RG3005. [Google Scholar] [CrossRef]
  53. Cao, H.; Liu, J.; Wang, G.; Yang, G.; Luo, L. Identification of sand and dust storm source areas in Iran. J. Arid Land 2015, 7, 567–578. [Google Scholar] [CrossRef]
  54. Abbasi, H.R.; Opp, C.; Groll, M.; Rohipour, H.; Khosroshahi, M.; Khaksarian, F.; Gohardoust, A. Spatial and temporal variation of the aeolian sediment transport in the ephemeral Baringak Lake (Sistan Plain, Iran) using field measurements and geostatistical analyses. Z. Geomorphol. 2018, 61, 315–326. [Google Scholar] [CrossRef]
  55. Karimi, N.; Namdari, S.; Sorooshian, A.; Bilal, M.; Heidary, P. Evaluation and modification of SARA high-resolution AOD retrieval algorithm during high dust loading conditions over bright desert surfaces. Atmos. Poll. Res. 2019, 10, 1005–1014. [Google Scholar] [CrossRef]
  56. Boroughani, M.; Pourhashemi, S.; Hashemi, H.; Salehi, M.; Amirahmadi, A.; Asadi, M.A.Z.; Berndtsson, R. Application of remote sensing techniques and machine learning algorithms in dust source detection and dust source susceptibility mapping. Ecolog. Inform. 2020, 56, 101059. [Google Scholar] [CrossRef]
  57. Rashki, A.; Middleton, N.J.; Goudie, A.S. Dust storms in Iran–Distribution, causes, frequencies and impacts. Aeol. Res. 2021, 48, 100655. [Google Scholar] [CrossRef]
  58. Rashki, A.; Kaskaoutis, D.G.; Francois, P.; Kosmopoulos, P.G.; Legrand, M. Dust-storm dynamics over Sistan region, Iran: Seasonality, transport characteristics and affected areas. Aeol. Res. 2015, 16, 35–48. [Google Scholar] [CrossRef]
  59. Abbasi, H.; Opp, C.; Groll, M.; Gohardoust, A. Wind regime and sand transport in the Sistan and Registan regions (Iran/Afghanistan). Z. Geomorphol. 2019, 62 (Suppl. 1), 41–57. [Google Scholar] [CrossRef]
  60. Khusfi, E.Z.; Moatamednia, M. Evaluating different functions of artificial neural networks for predicting the hourly variations of horizontal visibility under dry and humid conditions (case study: Zabol City). Desert Ecos. Engin. J. 2019, 3, 55–69. [Google Scholar]
  61. Khusfi, Z.E.; Khosroshahi, M.; Roustaei, F.; Mirakbari, M. Spatial and seasonal variations of sand-dust events and their relation to atmospheric conditions and vegetation cover in semi-arid regions of central Iran. Geoderma 2020, 365, 114225. [Google Scholar] [CrossRef]
  62. Almazroui, M.; Islam, M.N.; Jones, P.D.; Athar, H.; Rahman, M.A. Recent climate change in the Arabian Peninsula: Seasonal rainfall and temperature climatology of Saudi Arabia for 1979–2009. Atmos. Res. 2012, 111, 29–45. [Google Scholar] [CrossRef]
  63. Patlakas, P.; Stathopoulos, C.; Flocas, H.; Kalogeri, C.; Kallos, G. Regional Climatic Features of the Arabian Peninsula. Atmosphere 2019, 10, 220. [Google Scholar] [CrossRef] [Green Version]
  64. Maghrabi, A.H.; Al-Dosari, A.F. Effects on surface meteorological parameters and radiation levels of a heavy dust storm occurred in Central Arabian Peninsula. Atmos. Res. 2016, 182, 30–35. [Google Scholar] [CrossRef]
  65. Karami, S.; Ranjbar, A.; Mohebalhojeh, A.R.; Moradi, M. A rare case of haboob in Tehran: Observational and numerical study. Atmos. Res. 2017, 185, 169–185. [Google Scholar] [CrossRef]
  66. Abdi Vishkaee, F.; Flamant, C.; Cuesta, J.; Oolman, L.; Flamant, P.; Khalesifard, H.R. Dust transport over Iraq and northwest Iran associated with winter Shamal: A case study. J. Geophys. Res. 2012, 117, D03201. [Google Scholar] [CrossRef] [Green Version]
  67. Hermida, L.; Merino, A.; Sánchez, J.L.; Fernández-González, S.; García-Ortega, E.; López, L. Characterization of synoptic patterns causing dust outbreaks that affect the Arabian Peninsula. Atmos. Res. 2018, 199, 29–39. [Google Scholar] [CrossRef]
  68. Kalnay, E.; Kanamitsu, M.; Kistler, R.; Collins, W.; Deaven, D.; Gandin, L.; Iredell, M.; Saha, S.; White, G.; Woollen, J.; et al. The NCEP/NCAR 40-year reanalysis project. Bull. Amer. Meteor. Soc. 1996, 77, 437–472. [Google Scholar] [CrossRef] [Green Version]
  69. Sayer, A.M.; Hsu, N.C.; Lee, J.; Kim, W.V.; Dutcher, S.T. Validation, stability, and consistency of MODIS Collection 6.1 and VIIRS Version 1 Deep Blue aerosol data over land. J. Geophys. Res. 2019, 124. [Google Scholar] [CrossRef]
  70. Winker, D.M.; Hunt, W.H.; McGill, M.J. Initial performance assessment of CALIOP. Geophys. Res. Lett. 2007, 34. [Google Scholar] [CrossRef] [Green Version]
  71. Uno, I.; Yumimoto, K.; Shimizu, A.; Hara, Y.; Sugimoto, N.; Wang, Z.; Liu, Z.; Winker, D.M. 3D structure of Asian dust transport revealed by CALIPSO lidar and a 4DVAR dust model. Geophys. Res. Lett. 2008, 35. [Google Scholar] [CrossRef] [Green Version]
  72. LeGrand, S.L.; Polashenski, C.; Letcher, T.W.; Creighton, G.A.; Peckham, S.E.; Cetola, J.D. The AFWA dust emission scheme for the GOCART aerosol model in WRF-Chem v3.8.1. Geosc. Model Develop. 2019, 12, 131. [Google Scholar] [CrossRef] [Green Version]
  73. Ginoux, P.; Chin, M.; Tegen, I.; Prospero, J.M.; Holben, B.; Dubovik, O.; Lin, S.J. Sources and distributions of dust aerosols simulated with the GOCART model. J. Geophys. Res. 2001, 106, 20255–20273. [Google Scholar] [CrossRef]
  74. Kumar, R.; Barth, M.C.; Pfister, G.G.; Naja, M.; Brasseur, G.P. WRF-Chem simulations of a typical pre-monsoon dust storm in northern India: Influences on aerosol optical properties and radiation budget. Atmos. Chem. Phys. 2014, 14, 2431–2446. [Google Scholar] [CrossRef] [Green Version]
  75. Xi, X.; Sokolik, I.N. Quantifying the anthropogenic dust emission from agricultural land use and desiccation of the Aral Sea in Central Asia. J. Geophys. Res. 2016, 121, 12270–12281. [Google Scholar] [CrossRef]
  76. Foroushani, M.A.; Opp, C.; Groll, M.; Nikfal, A. Evaluation of WRF-Chem Predictions for Dust Deposition in Southwestern Iran. Atmosphere 2020, 11, 757. [Google Scholar] [CrossRef]
  77. Marticorena, B.; Bergametti, G. Modeling the atmospheric dust cycle: 1. Design of a soil-derived dust emission scheme. J. Geophys. Res. 1995, 100, 16415–16430. [Google Scholar] [CrossRef] [Green Version]
  78. Kawamura, R. Study on sand movement by wind. Rept. Inst. Sci. Technol. 1951, 5, 95–112. [Google Scholar]
  79. Kok, J.F.; Albani, S.; Mahowald, N.M.; Ward, D.S. An improved dust emission mode–Part 2: Evaluation in the Community Earth System Model, with implications for the use of dust source functions. Atmos. Chem. Phys. 2014, 14, 13043–13061. [Google Scholar] [CrossRef] [Green Version]
  80. Nabavi, S.O.; Haimberger, L.; Samimi, C. Sensitivity of WRF-chem predictions to dust source function specification in West Asia. Aeol. Res. 2017, 24, 115–131. [Google Scholar] [CrossRef]
  81. Gillette, D.A. Environmental Factors Affecting Dust Emissions by Wind Erosion, in Saharan Dust; Morales, C., Ed.; John Wiley: New York, NY, USA, 1979; pp. 71–94. [Google Scholar]
  82. Singh, C.; Singh, S.K.; Chauhan, P.; Budakoti, S. Simulation of an extreme dust episode using WRF-CHEM based on optimal ensemble approach. Atmos. Res. 2021, 249, 105296. [Google Scholar] [CrossRef]
  83. Alizadeh Choobari, O.; Zawar-Reza, P.; Sturman, A. Low level jet intensification by mineral dust aerosols. Ann. Geophys. 2013, 31, 625–632. [Google Scholar] [CrossRef]
  84. Ashrafi, K.; Motlagh, M.S.; Neyestani, S.E. Dust storms modeling and their impacts on air quality and radiation budget over Iran using WRF-Chem. Air Qual. Atmos. Health 2017, 10, 1059–1076. [Google Scholar] [CrossRef]
  85. Bukowski, J.; van den Heever, S.C. Convective distribution of dust over the Arabian Peninsula: The impact of model resolution. Atmos. Chem. Phys. 2020, 20, 2967–2986. [Google Scholar] [CrossRef] [Green Version]
  86. Hamidi, M.; Kavianpour, M.R.; Shao, Y. Numerical simulation of dust events in the Middle East. Aeol. Res. 2014, 13, 59–70. [Google Scholar] [CrossRef]
  87. Inness, A.; Ades, M.; Agusti-Panareda, A.; Barré, J.; Benedictow, A.; Blechschmidt, A.M.; Dominguez, J.; Engelen, R.; Eskes, H.; Flemming, J.; et al. The CAMS reanalysis of atmospheric composition. Atmos. Chem. Phys. 2019, 19, 3515–3556. [Google Scholar] [CrossRef] [Green Version]
  88. Kosmopoulos, P.G.; Kazadzis, S.; Taylor, M.; Athanasopoulou, E.; Speyer, O.; Raptis, P.I.; Marinou, E.; Proestakis, E.; Solomos, S.; Gerasopoulos, E.; et al. Dust impact on surface solar irradiance assessed with model simulations, satellite observations and ground-based measurements. Atmos. Meas. Tech. 2017, 10, 2435–2453. [Google Scholar] [CrossRef] [Green Version]
  89. Misra, A.; Tripathi, S.N.; Sembhi, H.; Boesch, H. Validation of CAMS AOD using AERONET Data and Trend Analysis at Four Locations in the Indo-Gangetic Basin. Ann. Geophys. Discuss. 2020. [Google Scholar] [CrossRef]
  90. Toon, O.B.; Ackerman, T.P. Algorithms for the calculation of scattering by stratified spheres. Appl. Opt. 1981, 20, 3657–3660. [Google Scholar] [CrossRef]
  91. Giorgi, F.; Marinucci, M.; Bates, G. Development of a second generation regional climate 15 model (RegCM2). Part I: Boundary layer and radiative transfer processes. Mon. Weather Rev. 1993, 121, 2794–2813. [Google Scholar] [CrossRef]
  92. Pal, J.S.; Giorgi, F.; Bi, X.; Elguindi, N.; Solmon, F.; Gao, X.J.; Francisco, R.; Zakey, A.; Winter, J.; Ashfaq, M.; et al. Regional climate modeling for the developing world: The ICTP RegCM3 and RegCNET. Bull. Amer. Meteorol. Soc. 2007, 88, 1395–1409. [Google Scholar] [CrossRef] [Green Version]
  93. Giorgi, F.; Coppola, E.; Solmon, F.; Mariotti, L.; Sylla, M.B.; Bi, X.; Elguindi, N.; Diro, G.T.; Nair, V.; Giuliani, G.; et al. RegCM4: Model description and preliminary tests over multiple CORDEX domains. Clim. Res. 2012, 52, 7–29. [Google Scholar] [CrossRef] [Green Version]
  94. Grell, G.; Dudhia, J.; Stauffer, D. A description of the fifth generation Penn State/mesoscale model (MM5). In NCAR Technical Note-398+ STR; 1994; p. 117. [Google Scholar]
  95. Kamali, S.; Mofidi, A.; Zarrin, A.; Nazaripour, H. Sensitivity studies of the forth-generation regional climate model simulation of dust storms in the Sistan plain, Iran. Model. Earth Syst. Environ. 2017, 3, 769–781. [Google Scholar] [CrossRef]
  96. Kaskaoutis, D.G.; Houssos, E.E.; Solmon, F.; Legrand, M.; Rashki, A.; Dumka, U.C.; Francois, P.; Gautam, R.; Singh, R.P. Impact of atmospheric circulation types on southwest Asian dust and Indian summer monsoon rainfall. Atmos. Res. 2018, 201, 189–205. [Google Scholar] [CrossRef]
  97. Voudouri, K.A.; Siomos, N.; Michailidis, K.; Papagiannopoulos, N.; Lucia, M.; Cornacchia, C.; Nicolae, D.; Balis, D. Comparison of two automated aerosol typing methods and their application to an EARLINET station. Atmos. Chem. Phys. 2019, 19, 10961–10980. [Google Scholar] [CrossRef] [Green Version]
  98. Rashki, A.; Arjmand, M.; Kaskaoutis, D.G. Assessment of dust activity and dust-plume pathways over Jazmurian Basin, southeast Iran. Aeol. Res. 2017, 24, 145–160. [Google Scholar] [CrossRef]
  99. Kaskaoutis, D.G.; Rashki, A.; Francois, P.; Dumka, U.C.; Houssos, E.E.; Legrand, M. Meteorological regimes modulating dust outbreaks in southwest Asia: The role of pressure anomaly and Inter-Tropical Convergence Zone on the 1–3 July 2014 case. Aeol. Res. 2015, 18, 83–97. [Google Scholar] [CrossRef]
  100. Gholami, H.; Mohammadifar, A.; Pourghasemi, H.R.; Collins, A.L. A new integrated data mining model to map spatial variation in the susceptibility of land to act as a source of aeolian dust. Environ. Sci. Poll. Res. 2020, 27, 42022–42039. [Google Scholar] [CrossRef]
  101. Gholami, H.; Mohamadifar, A.; Sorooshian, A.; Jansen, J.D. Machine-learning algorithms for predicting land susceptibility to dust emissions: The case of the Jazmurian Basin, Iran. Atmos. Poll. Res. 2020, 11, 1303–1315. [Google Scholar] [CrossRef]
  102. Kumar, A.; Suresh, K.; Rahaman, W. Geochemical characterization of modern aeolian dust over the Northeastern Arabian Sea: Implication for dust transport in the Arabian Sea. Sci. Total Environ. 2020, 729, 138576. [Google Scholar] [CrossRef]
  103. Salmabadi, H.; Khalidy, R.; Saeedi, M. Transport routes and potential source regions of the Middle Eastern dust over Ahvaz during 2005–2017. Atmos. Res. 2020, 104947. [Google Scholar] [CrossRef]
  104. Geravandi, S.; Yari, A.R.; Jafari, M.; Goudarzi, G.; Vosoughi, M.; Dastoorpoor, M.; Farhadi, M.; Mohammadi, M.J. Effects of dust phenomenon and impacts with emphasis on dust problems and present solutions in Khuzestan (Iran). Arch. Hyg. Sci. 2018, 7, 134–138. [Google Scholar] [CrossRef]
  105. Shahsavani, A.; Tobías, A.; Querol, X.; Stafoggia, M.; Abdolshahnejad, M.; Mayvaneh, F.; Guo, Y.; Hadei, M.; Hashemi, S.S.; Khosravi, A.; et al. Short-term effects of particulate matter during desert and non-desert dust days on mortality in Iran. Environ. Intern. 2020, 134, 105299. [Google Scholar] [CrossRef] [PubMed]
  106. Miller, S.D.; Grasso, L.D.; Bian, Q.; Kreidenweis, S.M.; Dostalek, J.F.; Solbrig, J.E.; Bukowski, J.; van den Heever, S.C.; Wang, Y.; Xu, X.; et al. A Tale of Two Dust Storms: Analysis of a complex dust event in the Middle East. Atmos. Meas. Tech. 2019, 12, 5101–5118. [Google Scholar] [CrossRef] [Green Version]
  107. Gholamzade Ledari, D.; Hamidi, M.; Shao, Y. Evaluation of the 13 April 2011 frontal dust storm in west Asia. Aeol. Res. 2020, 44, 100592. [Google Scholar] [CrossRef]
  108. Gholami, H.; Rahimi, S.; Fathabadi, A.; Habibi, S.; Collins, A.L. Mapping the spatial sources of atmospheric dust using GLUE and Monte Carlo simulation. Sci. Total Environ. 2020, 138090. [Google Scholar] [CrossRef] [PubMed]
  109. Rahmati, O.; Mohammadi, F.; Ghiasi, S.S.; Tiefenbacher, J.; Moghaddam, D.D.; Coulon, F.; Nalivan, O.A.; Bui, D.T. Identifying sources of dust aerosol using a new framework based on remote sensing and modelling. Sci. Total Environ. 2020, 737. [Google Scholar] [CrossRef]
  110. Notaro, M.; Alkolibi, F.; Fadda, E.; Bakhrjy, F. Trajectory analysis of Saudi Arabian dust storms. J. Geophys. Res. 2013, 118, 6028–6043. [Google Scholar] [CrossRef]
  111. Fattahi, E.; Noohi, K.; Shiravand, H. Study of dust storm synoptical patterns in southwest of Iran. Desert 2012, 17, 49–55. [Google Scholar]
  112. Namdari, S.; Karimi, N.; Sorooshian, A.; Mohammadi, G.; Sehatkashani, S. Impacts of climate and synoptic fluctuations on dust storm activity over the Middle East. Atmos. Environ. 2018, 173, 265–276. [Google Scholar] [CrossRef]
  113. Solomos, S.; Kalivitis, N.; Mihalopoulos, N.; Amiridis, V.; Kouvarakis, G.; Gkikas, A.; Binietoglou, I.; Tsekeri, A.; Kazadzis, S.; Kottas, M.; et al. From Tropospheric Folding to Khamsin and Foehn Winds: How Atmospheric Dynamics Advanced a Record-Breaking Dust Episode in Crete. Atmosphere 2018, 9, 240. [Google Scholar] [CrossRef] [Green Version]
  114. Alharbi, B.H.; Maghrabi, A.L.; Tapper, N. The March 2009 dust event in Saudi Arabia: Precursor and supportive environment. Bull. Amer. Meteorol. Soc. 2013, 94, 515–528. [Google Scholar] [CrossRef]
  115. Tian, X.; Gao, Z. Validation and Accuracy Assessment of MODIS C6.1 Aerosol Products over the Heavy Aerosol Loading Area. Atmosphere 2019, 10, 548. [Google Scholar] [CrossRef] [Green Version]
  116. Tian, X.; Liu, Q.; Li, X.; Wei, J. Validation and Comparison of MODIS C6.1 Aerosol Products over Beijing, China. Remote Sens. 2018, 10, 2021. [Google Scholar] [CrossRef] [Green Version]
  117. Wei, J.; Li, Z.; Peng, Y.; Sun, L. MODIS Collection 6.1 aerosol optical depth products over land and ocean: Validation and comparison. Atmos. Environ. 2018, 201, 428–440. [Google Scholar] [CrossRef]
  118. Wei, J.; Peng, Y.; Guo, J.; Sun, L. Performance of MODIS Collection 6.1 Level 3 aerosol products in spatial temporal variations over land. Atmos. Environ. 2019, 206, 30–44. [Google Scholar] [CrossRef]
  119. Wang, Y.; Yuan, Q.; Li, T.; Shen, H.; Zheng, L.; Zhang, L. Evaluation and comparison of MODIS Collection 6.1 aerosol optical depth against AERONET over regions in China with multifarious underlying surfaces. Atmos. Environ. 2019, 200, 280–301. [Google Scholar] [CrossRef] [Green Version]
  120. Gupta, P.; Remer, L.A.; Patadia, F.; Levy, R.C.; Christopher, S.A. High-Resolution Gridded Level 3 Aerosol Optical Depth Data from MODIS. Remote Sens. 2020, 12, 2847. [Google Scholar] [CrossRef]
  121. Huang, G.; Chen, Y.; Li, Z.; Liu, Q.; Wang, Y.; He, Q.; Liu, T.; Liu, X.; Zhang, Y.; Gao, J.; et al. Validation and Accuracy Analysis of the Collection 6.1 MODIS Aerosol Optical Depth over the Westernmost City in China Based on the Sun Sky Radiometer Observations from SONET. Earth Space Sci. 2020, 7. [Google Scholar] [CrossRef] [Green Version]
  122. Shi, L.; Zhang, J.; Yao, F.; Zhang, D.; Guo, H. Temporal variation of dust emissions in dust sources over Central Asia in recent decades and the climate linkages. Atmos. Environ. 2020, 222, 117176. [Google Scholar] [CrossRef]
  123. Ali, M.A.; Nichol, J.E.; Bilal, M.; Qiu, Z.; Mazhar, U.; Wahiduzzaman, M.; Almazroui, M.; Islam, M.N. Classification of aerosols over Saudi Arabia from 2004–2016. Atmos. Environ. 2020, 241, 117785. [Google Scholar] [CrossRef]
  124. Xu, X.; Xie, L.; Yang, X.; Wu, H.; Cai, L.; Qi, P. Aerosol optical properties at seven AERONET sites over Middle East and Eastern Mediterranean Sea. Atmos. Environ. 2020, 243, 117884. [Google Scholar] [CrossRef]
  125. Sabetghadam, S.; Alizadeh, O.; Khoshsima, M.; Pierleoni, A. Aerosol properties, trends and classification of key types over the middle-east using satellite-derived atmospheric optical datasets. Atmos. Environ. 2021, 118100. [Google Scholar] [CrossRef]
  126. Farahat, A.; El-Askary, H.; Al-Shaibani, A. Study of aerosols’ characteristics and dynamics over the Kingdom of Saudi Arabia using a multisensor approach combined with ground observations. Adv. Meteorol. 2015, 247531. [Google Scholar] [CrossRef] [Green Version]
  127. Foroushani, M.; Opp, C.; Groll, M. Chemical Characterization of Aeolian Dust Deposition in Southern and Western Iran. Asian J. Geogr. Res. 2019, 2, 1–22. [Google Scholar] [CrossRef] [Green Version]
  128. Shaheen, A.; Wu, R.; Aldabash, M. Long-term AOD trend assessment over the Eastern Mediterranean region: A comparative study including a new merged aerosol product. Atmos. Environ. 2020. [Google Scholar] [CrossRef]
  129. Behrooz, R.D.; Esmaili-Sari, A.; Bahramifar, N.; Kaskaoutis, D.G. Analysis of the TSP, PM10 concentrations and water-soluble ionic species in airborne samples over Sistan, Iran during the summer dusty period. Atmos. Poll. Res. 2017, 8, 403–417. [Google Scholar] [CrossRef]
  130. Farsani, M.H.; Shirmardi, M.; Alavi, N.; Maleki, H.; Sorooshian, A.; Babaei, A.; Asgharnia, H.; Marzouni, M.B.; Goudarzi, G. Evaluation of the relationship between PM10 concentrations and heavy metals during normal and dusty days in Ahvaz, Iran. Aeol. Res. 2018, 33, 12–22. [Google Scholar] [CrossRef]
  131. Motaghi, F.A.; Hamzehpour, N.; Abasiyan, S.M.A.; Rahmati, M. The wind erodibility in the newly emerged surfaces of Urmia Playa Lake and adjacent agricultural lands and its determining factors. Catena 2020, 194. [Google Scholar] [CrossRef]
  132. Basart, S.; Vendrell, L.; Baldasano, J.M. High-resolution dust modelling over complex terrains in West Asia. Aeol. Res. 2016, 23, 37–50. [Google Scholar] [CrossRef]
  133. Hyde, P.; Mahalov, A.; Li, J. Simulating the meteorology and PM10 concentrations in Arizona dust storms using the Weather Research and Forecasting model with Chemistry (WRF-Chem). J. Air Waste Manag. Assoc. 2018, 68, 177–195. [Google Scholar] [CrossRef] [Green Version]
  134. Parajuli, S.P.; Yang, Z.L.; Kocurek, G. Mapping erodibility in dust source regions based on geomorphology, meteorology, and remote sensing. J. Geophys. Res. 2014, 119, 1977–1994. [Google Scholar] [CrossRef]
  135. Parajuli, S.P.; Stenchikov, G.L.; Ukhov, A.; Kim, H. Dust emission modeling using a new high-resolution dust source function in WRF-Chem with implications for air quality. J. Geophys. Res. 2019, 124, 10109–10133. [Google Scholar] [CrossRef] [Green Version]
  136. Menut, L.; Pérez, C.; Haustein, K.; Bessagnet, B.; Prigent, C.; Alfaro, S. Impact of surface roughness and soil texture on mineral dust emission fluxes modeling. J. Geophys. Res. 2013, 118, 6505–6520. [Google Scholar] [CrossRef] [Green Version]
  137. Kaskaoutis, D.G.; Francis, D.; Rashki, A.; Chaboureau, J.P.; Dumka, U.C. Atmospheric Dynamics from Synoptic to Local Scale During an Intense Frontal Dust Storm over the Sistan Basin in Winter 2019. Geosciences 2019, 9, 453. [Google Scholar] [CrossRef] [Green Version]
  138. Bou Karam, D.; Flamant, C.; Cuesta, J.; Pelon, J.; Williams, E. Dust emission and transport associated with a Saharan depression: February 2007 case. J. Geophys. Res. 2010, 115, D00H27. [Google Scholar] [CrossRef] [Green Version]
  139. Karagulian, F.; Temimi, M.; Ghebreyesus, D.; Weston, M. Analysis of a severe dust storm and its impact on air quality conditions using WRF-Chem modeling, satellite imagery, and ground observations. Air Qual. Atmos. Health 2019, 12, 453–470. [Google Scholar] [CrossRef] [Green Version]
  140. Karegar, E.; Hamzeh, N.H.; Jamali, J.B.; Abadi, A.R.S.; Moeinaddini, M.; Goshtasb, H. Numerical simulation of extreme dust storms in east of Iran by the WRF-Chem model. Nat. Hazards 2019, 99, 769–796. [Google Scholar] [CrossRef]
  141. Dai, T.; Cheng, Y.M.; Goto, D.; Schutgens, N.A.J.; Kikuchi, M.; Yoshida, M.; Shi, G.Y.; Nakajima, T. Inverting the East Asian Dust Emission Fluxes Using the Ensemble Kalman Smoother and Himawari-8 AODs: A Case Study with WRF-Chem v3.5.1. Atmosphere 2019, 10, 543. [Google Scholar] [CrossRef] [Green Version]
  142. Sathe, Y.; Kulkarni, S.; Gupta, P.; Kaginalkar, A.; Islam, S.; Gargava, P. Application of Moderate Resolution Imaging Spectroradiometer (MODIS) Aerosol Optical Depth (AOD) and Weather Research Forecasting (WRF) model meteorological data for assessment of fine particulate matter (PM2.5) over India. Atmos. Poll. Res. 2018, 10, 418–434. [Google Scholar] [CrossRef]
Figure 1. True color imagery from Aqua (DS5, DS6) and Terra (DS1–DS4) Moderate-Resolution Imaging Spectroradiometer (MODIS) and Cloud-Aerosol Lidar and Infrared Pathfinder Satellite Observation (CALIPSO) profiles of total attenuated backscatter at 532 nm (km−1 sr−1) and aerosol-type classification during the dust storm days over the Middle East. The CALIPSO orbit paths are shown by the red lines in MODIS imagery, with the arrows denoting the direction of the overpass, while the presence of the thick dust plumes is highlighted by the circle and oval shapes in the MODIS and CALIPSO images.
Atmosphere 12 00125 g001
Figure 2. Synoptic maps of the geopotential heights (m) at 500 hPa, 850 hPa along with temperature (K), and mean sea level pressure (hPa) along with winds and surface fronts taken from Global Forecast System (GFS) analysis at 12:00 UTC on 17 February 2017 (DS1), 01 February 2017 (DS2), 19 January 2018 (DS3), 30 October 2017 (DS4), 01 October 2016 (DS5) and 10 December 2016 (DS6).
Atmosphere 12 00125 g002
Figure 3. Synoptic maps of the vector winds at 300 hPa (in ms−1 colored scale) taken from National Center for Environmental Prediction/ National Center for Atmospheric Research (NCEP/NCAR) reanalysis on 17 February 2017 (DS1), 1 February 2017 (DS2), 19 January 2018 (DS3), 30 October 2017 (DS4), 1 October 2016 (DS5) and 9 December 2016 (DS6).
Atmosphere 12 00125 g003
Figure 4. Spatial distribution of the Terra-MODIS aerosol optical depth (AOD550) and simulated AODs (at 9:00 UTC) via Weather Research and Forecasting model coupled with Chemistry (WRF-Chem), Copernicus Atmospheric Monitoring Service (CAMS) and Regional Climate Model-4 (RegCM4) models over the Middle East region on 17 February 2017 (DS1), 1 February 2017 (DS2), 19 January 2018 (DS3), 30 October 2017 (DS4), 1 October 2016 (DS5), 9 December 2016 (DS6). [LST = UTC + 3.30].
Atmosphere 12 00125 g004
Figure 5. PM10 concentrations (μg m−3) from air quality monitoring stations in Iran for each DS event at 12:00 UTC (left column). PM10 concentrations from WRF-Chem, CAMS and RegCM4 simulations at 12:00 UTC on 18 February 2017 (DS1), 3 February 2017 (DS2), 20 January 2018 (DS3), 29 October 2017(DS4), 30 September 2016 (DS5), 10 December 2016 (DS6). [LST = UTC + 3.30].
Atmosphere 12 00125 g005
Figure 6. Sand fraction (a) and clay fraction (b) used in the dust emission scheme in the WRF model.
Atmosphere 12 00125 g006
Figure 7. Land cover map used by RegCM4 model over the study region.
Atmosphere 12 00125 g007
Figure 8. Simulations of mean sea level pressure (left column), longitude-vertical cross-section of potential temperature (θ), wind speed and direction (mid column) and dust concentration with relative humidity (right column) from the WRF-Chem model at latitude 31° N at 12:000 UTC on 17 February 2017 (DS1), 1 February 2017 (DS2), 19 January 2018 (DS3), 30 October 2017 (DS4), 1 October 2016 (DS5) and 10 December 2016 (DS6).
Atmosphere 12 00125 g008
Table 1. Time of occurrence and affected areas of the six frontal dust storms.
Case IDTimeMin.Visibility (m)Affected Area
DS117–20 February 2017100West and southwest of Iran, East Iraq
DS21–3 February 2017100West Iran, East Iraq
DS318–21 January 2018100Western half of Iran, Iraq, northeast of Saudi Arabia
DS429 October–1 November 2017100West Iran, Iraq, North Saudi Arabia
DS530 September–2 October 2016100West and southwest Iran
DS69–10 December 2016100West Afghanistan, West Pakistan and East Iran
Table 2. Main characteristics of the numerical models used in this study.
ModelScaleInstituteEmission SchemeHorizontal ResolutionVertical CoordinateVertical Layers
WRF-ChemRegionalUCARAFWA [72]21 kmsigma30
CAMS-ECMWFGlobalUCARUplifting [73]8–10 kmsigma137
RegCM4RegionalEMASaltation and sandblasting [51]45 kmsigma18
Publisher’s Note: MDPI stays neutral with regard to jurisdictional claims in published maps and institutional affiliations.

