Exposure and Respiratory Tract Deposition Dose of Equivalent Black Carbon in High Altitudes


1
Leibniz-Institute for Tropospheric Research, Permoserstrasse 15, 04318 Leipzig, Germany
2
Laboratory for Atmospheric Physics, IIF-UMSA, Universidad Mayor de San Andres, Cota Cota Calle 27, La Paz, Bolivia
3
Department of Atmospheric and Oceanic Science, University of Maryland, College Park, MD 20742, USA
*
Author to whom correspondence should be addressed.
Atmosphere 2020, 11(6), 598; https://doi.org/10.3390/atmos11060598
Submission received: 14 May 2020
/
Revised: 30 May 2020
/
Accepted: 2 June 2020
/
Published: 5 June 2020
(This article belongs to the Special Issue Atmospheric Carbonaceous Aerosols)
Abstract
:The traffic microenvironment accounts for a significant fraction of the total daily dose of inhaled air pollutants. The adverse effects of air pollution may be intensified in high altitudes (HA) due to increased minute ventilation (MV), which may result in higher deposition doses compared to that at sea level. Despite this, air quality studies in regions with combined high pollution levels and enhanced inhalation are limited. The main goals of this study are to investigate how the choice of travel mode (walking, microbus, and cable car ride) determines (i) the personal exposure to equivalent black carbon (eBC) and (ii) the corresponding potential respiratory deposited dose (RDD) in HA. For this investigation, we chose La Paz and El Alto in Bolivia as HA representative cities. The highest eBC exposure occurred in microbus commutes (13 μg m−3), while the highest RDD per trip was recorded while walking (6.3 μg) due to increased MV. On the other hand, the lowest eBC exposure and RDD were observed in cable car commute. Compared with similar studies done at sea level, our results revealed that a HA city should reduce exposure by 1.4 to 1.8-fold to achieve similar RDD at sea level, implying that HA cities require doubly aggressive and stringent road emission policies compared to those at sea level.
1. Introduction
In the past years, ambient particulate matter (PM) has been recognized as among the top ten most significant environmental risks to health [1,2], and is a group 1 carcinogen to humans [3], causing about seven million premature deaths worldwide per year [4]. Moreover, studies have shown that long-term exposure to PM potentially exacerbates the severity of emerging diseases, e.g., COVID-19 and SARS [5,6]. A small increase of 1μg m−3 PM2.5 (PM smaller than 2.5 μm in diameter) exposure over 15–20 years may 20-fold increase the risk of mortality from COVID-19. In the face of emerging air quality crises, more studies are needed to reevaluate the effects of air pollution on human health covering the regions, where such information is limited.
The decline of air quality in many cities is owed to emissions from the transportation sector [7], where, at the ground level, both vehicles and urban commuters riskily co-exist. A number of studies have estimated the air pollution exposure of urban commuters under different transport microenvironments (TMEs), such as cars [8,9], trains [10,11], buses [12,13], and cycling [14,15]. However, only a handful of studies, as seen from the summary of related studies in Table S1, include equivalent black carbon (eBC) particles as a target pollutant, in spite of their known toxicity [16] and dangerous concentration levels on the roadside [17]. The magnitude of exposure to pollutants in TMEs may vary for different study locations as a result of differences in used methods and considered conditions (such as ventilation rates, fuel types, etc.).
The relationship between traffic-related air pollution and human health is widely reviewed from both epidemiological and toxicological perspectives [18]. Most studies use exposure as a measure to quantify the contact of a person to a pollutant, with the values usually being taken from stationary measurement sites. On the other hand, exposure alone does not provide any direct quantification of how much of the pollutants reside in the respiratory system. To gain such information, exposure concentrations of pollutants, breathing rate, breathing pattern (e.g., long deep breaths vs. short shallow breaths), knowledge about personal physiology, etc. is required [19]. Respiratory rates vary in many different ways to enable a successful gas exchange at the alveolar–capillary membrane, and this is primarily a critical metabolic factor for people living in high altitudes [20]. Despite a slight decrease in effort for breathing as a result of the lower density of the ambient air, the reduction in oxygen at high altitude necessitates much larger volumes of air to supply enough oxygen to the body. As the lung ventilation increases with increasing altitude, correspondingly, the respiratory tract deposition dose also increases. As can already be anticipated, the RDD represents a more comprehensive picture of the interaction between air pollution and humans compared to sole measurement of exposure concentration. Discernibly, exposure and RDD estimate databases for TMEs are yet scarce. Such information could benefit scientific knowledge in validating exposure models, reassessing the risk–benefit balance of active physical activities on the road (e.g., walking), and providing an understanding of how air pollution may change as communities transition to a more compact, transit-oriented development.
As cities continue to grow, horizontal expansion of transit systems in dense, developing cities gets inefficient, especially for private vehicles, since it demands space [21]. Among the developments and realized alternatives for public transportation is the utilization of cable car technology. The use of the cable car has been adopted to improve mobility in informal settlements in Latin America [22]. Since then, cable cars as a public mode of transportation have been introduced in some other cities, such as Caracas, Rio de Janeiro, and La Paz. To the best of the authors’ knowledge, there have been no studies yet that have determined the commuter exposure and RDD to air pollutants in such a mode of transportation. Quantification of personal exposure and RDD of black carbon (BC) is an essential step towards identifying the potential health risks in different TMEs.
In the framework of this study, we carried out a systematic investigation of exposure concentrations and RDD in different travel modes (i.e., walking, microbus, cable car) in two high-altitude cities (>3500 masl (meters above sea level)): La Paz and El Alto, Bolivia. The main objectives of this study were to (i) determine the eBC exposure concentration and RDD in HA city in main public travel modes and (ii) assess the exposure and RDD reduction potential of using cable cars as a mode of transportation.
2. Materials and Methods
2.1. Route Characteristics
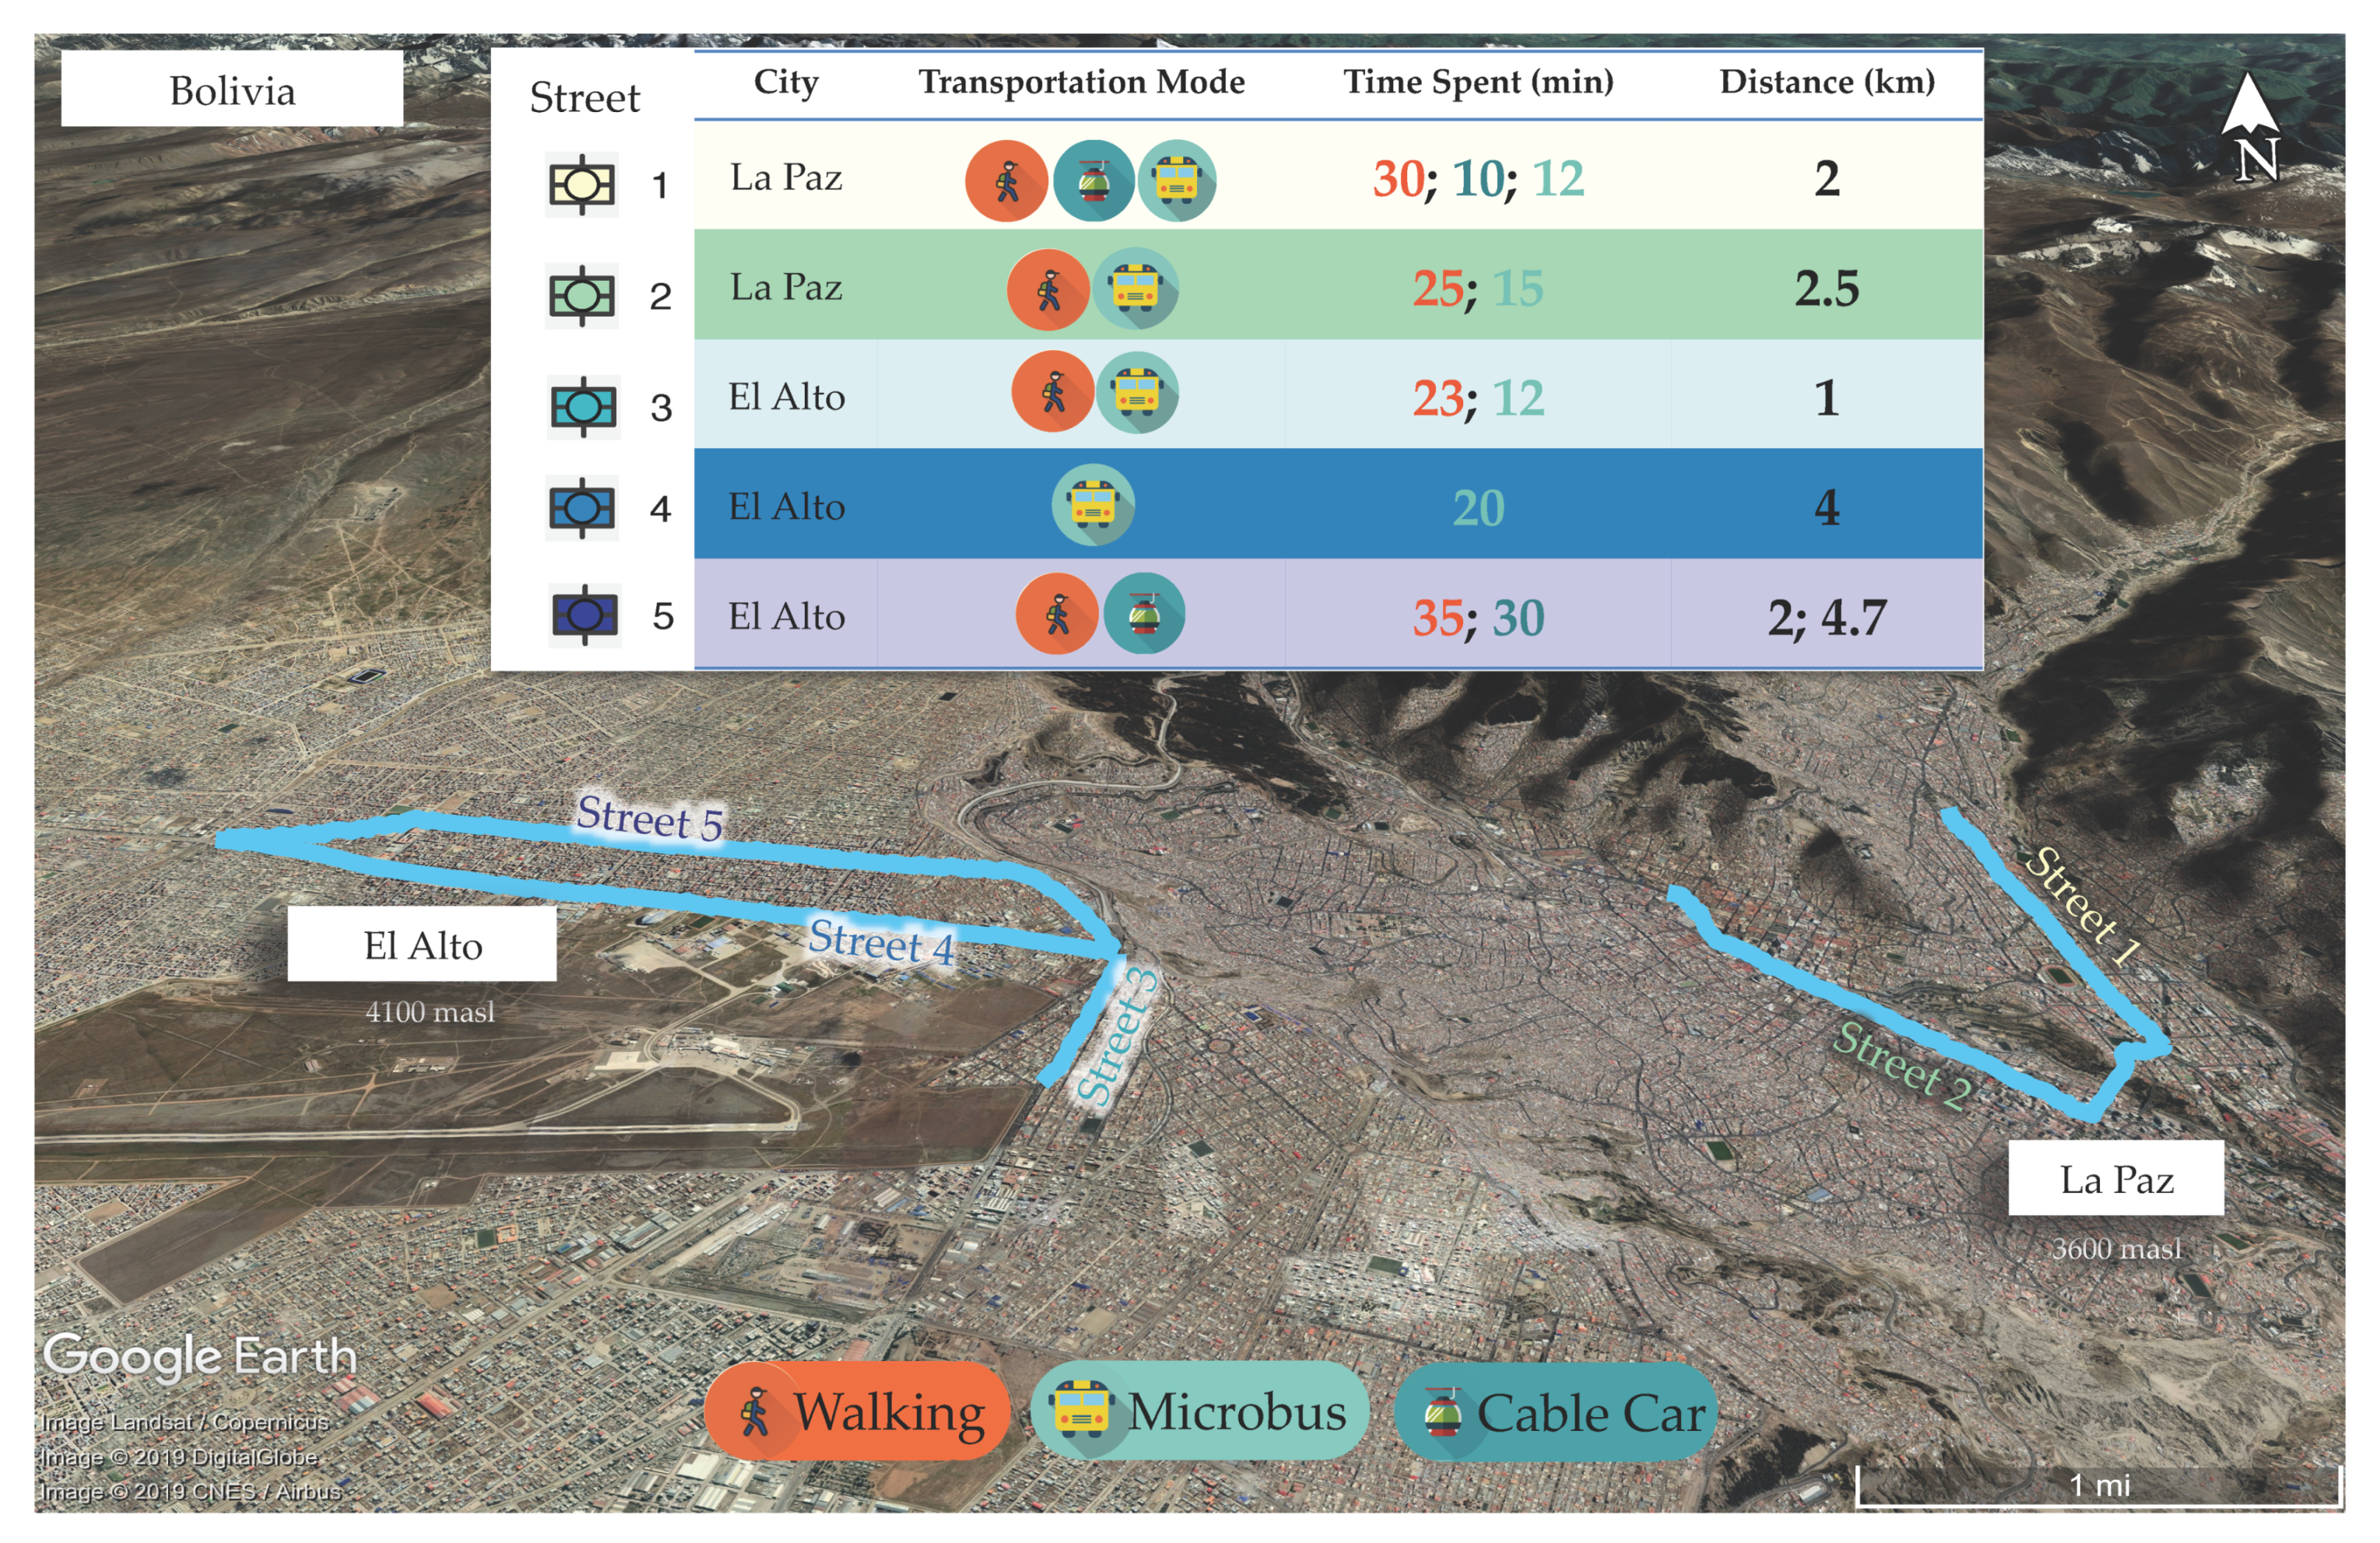
The exposure concentrations in different TMEs were measured in the cities of La Paz (3600 masl) and El Alto (4100 masl), during May–June 2018. The capital city, La Paz, is located in a valley-type topography where the roads are typically characterized by approx. 7% grade slopes. El Alto is located at a higher altitude than La Paz and has flatland-type terrain. The streets in La Paz are narrower than in El Alto. The number of registered vehicles in the city of La Paz/El Alto is approximately 450,000, but this is believed to be much higher due to unregistered vehicles [23]. In general, the vehicular fleet in Bolivia is composed mainly of gasoline-driven (84%), followed by diesel (13%) and natural gas (3%) vehicles. The measurement routes are shown in Figure 1. For simplicity, we numbered measurement routes as Streets 1 and 2 (La Paz) and streets 3 to 5 (El Alto). The full street name can be found in Table 1, which also summarizes the characteristics of the street segments.
2.2. Description of Travel Modes
To assess the variability of exposure to eBC among different travel modes, the measurements were focused in two categories, namely, active (walking) and passive (cable car, microbus) mode. Like most developing countries, Bolivia, and, specifically, the cities investigated in this study, has its own rather unique mode of transportation—microbus. This old open-window vehicle is one of the most popular and cheap options for public transportation within the cities. A slightly different version of the microbus, a smaller, lower-passenger-capacity bus called a minibus or minivan was also investigated in the study, which was categorized under microbus TME because of its physical similarities. A microbus provides affordable convenience, as it can stop anywhere without regard to traffic rules (on request by passengers), which in return worsens road congestion. Microbuses, minivans, and minibuses account for about 70% of on-road public transportation [24]. Recently, a state-run cable car system called Mi Teleferico was introduced as a cost-efficient, low-spatial-impact solution to urban transport. Several cable car lines run along and within the cities of La Paz and El Alto, where cabins arrive at each station every 12 s with a maximum capacity of 10 passengers per cabin. This study was designed to cover the majority of means of public transportation in La Paz and El Alto cities.
Measurements that were done by commuting on foot in La Paz or El Alto meant sharing the sidewalk or center aisle walkway with street vendors and small private businesses, resulting in frequent passages on the driveway. Whenever possible, the measurements were performed by walking at the center aisle walkway to sample emissions from both sides of the street. Sampling sessions during rides on microbuses and cable cars were not always prompt because of either lack of availability of transportation or vehicles being overcrowded. Waiting times to fetch rides were unavoidable and were excluded from data analysis. Comparing the travel modes in terms of average time spent per 2 km, the trend showed twalking > tmicrobus > tcable car.
2.3. Instrumentation and Sampling Design
Exposure concentration of eBC was measured using two sets of portable measurement systems equipped with micro-aethalometers (model MA200, AethLabs, San Francisco, CA, USA), a GPS module (model NL-8004U, Navilock, Berlin, Germany), and a data logging device (model Odroid C1+, Hardkernel, GyeongGi, Korea), all placed in a portable backpack. A detailed description of the instrumentation can be found in Madueño et al. [25]. The working principle of an aethalometer is based on measuring the optical attenuation increment, when the light is passed through a particle laden filter. Equivalent black carbon mass concentration is then calculated using the known optical absorbance per unit mass of BC material. Since the MA200 is a multi-wavelength instrument, the measurements at 880 nm were interpreted as the concentration of eBC. The instrument flows (150 mL/min) were calibrated before, during, and after the measurement campaign. Both micro-aethalometers were inter-compared under real-world conditions and showed a good agreement (R2 = 0.99, Madueño et al. [25]. The backpacks with measurement instruments were carried in front of the body at breathing height while commuting. All sampling sessions were conducted on non-rainy days to avoid misrepresentation of typical urban air pollution conditions due to potential pollution washout [26]. The measurement sessions were made during morning peak traffic hour (08:00–11:00 LT, local time) and afternoon off-peak traffic hour (13:00–15:00 LT), covering weekdays and weekends. To avoid biases in sampling, measurement sessions, e.g., morning peak traffic hour, started and ended in the same city, randomly choosing the starting point and taking any mode of transportation available at the street segment. Measurements were performed over 28 days, totaling to 345 single trips, of which 179 trips were on foot (walking), 104 trips were on the microbus, and 62 trips were riding inside the cable car. After initial data screening (e.g., excluding waiting periods) a total of 129 h and 16 min of commuting were used in data analysis.
2.4. Estimation of Respiratory Tract Deposition Dose
There are several available methods to determine aerosol particle respiratory tract deposition dose. For example, in-silico particle dosimetry models, which use a theoretical prediction of particle deposition by diffusion (e.g., the Multiple-Path Particle Dosimetry Model, MPPD, Chemical Industry Institute of Toxicology, Research Triangle Park, NC, USA). Dosimetry models rely on a set of parameters (e.g., particle physical-chemical properties (shape, density), morphological structure of the lung, etc.).On the other hand, in-situ measurement techniques to determine the inhaled particle dose are also available (e.g., the respiratory tract deposition system by Londahl et al. [27] and system to measure real-world deposition dose of black carbon (MERDOC) by Madueño et al. [25]). The most simple yet widely used method to determine RDD is through estimating the potential deposition dose, as described by Dons et al. [10], Betancourt et al. [28], and Merritt et al. [29]:
where RDDi,j is the respiratory deposition dose (in μg) for activity i and street segment j, Ci,j (μg m−3) is the exposure concentration, MVi (m3 min−1) is the minute ventilation for the associated typical activity during a travel mode, and Δti,j (min) is the duration of exposure from start to endpoint of travel. Formula (1) is multiplied to deposition fraction (DF, size-dependent) if information on particle number size distribution is available. For a given street segment, Equation (1) represents the inhaled dose commuters experience per trip on that route. A normalization factor was applied to make dose measurements comparable across different studies (e.g., dose per unit time, RDDi,j⁄Δti,j (μg min−1)).
RDDi,j = Σ Ci,j × MVi × Δti,j
In the case of this study, the measured variables were exposure concentration to eBC and the duration of exposure in TMEs. Other parameters necessary for RDD calculation (e.g., minute ventilation) were obtained from Milledge [30]. Numerous other studies intensively review the minute ventilation rate for different energy expenditures, ages, and genders at sea level [20,31,32,33].
As barometric pressure decreases with increasing altitude, oxygen content per volume of air decreases. Thus, for a given intensity of work, supplying the same amount of oxygen requires the lungs to take in a greater total volume of air. Numerous field and laboratory studies (in both hypobaric and normobaric conditions) showed that, at high altitude (e.g., 6300 masl), any given intensity of work requires approximately a four times higher ventilation rate than at sea level [34]. Lahiri et al. [35] demonstrated that high-altitude natives have different regulation of pulmonary ventilation during different intensities of work at hypobaric conditions compared to sea-level natives. Thus, referring to the energy expenditure of different work intensities from sea-level natives to estimate minute ventilation may not represent the case of high-altitude natives. The study best resembling the conditions in La Paz and El Alto was by Milledge [30] on the minute ventilation at different work intensities of male Himalayans at 4880 masl. In this work, we used male minute ventilation as values for females were not available at the time of this study. Comparison of the minute ventilation per activity level is summarized in Table 2.
3. Results and Discussion
3.1. Equivalent Black Carbon (eBC) Exposure in TMEs
Data obtained from portable measurements are often not normally distributed [7,26], and, hence, the arithmetic mean may mislead the overall tendency. Nevertheless, we included arithmetic means in our data presentation for comparability to other studies. To be able to compare the eBC exposure with other studies under STP (standard temperature and pressure; 273 K and 1012 hPa) conditions, an adjustment was applied to our measured eBC mass concentrations based on suggestions by Alvarez et al. [36]. Briefly, the pollutant concentration correction factor for high altitudes (for comparison with standard conditions) comes from the general gas law: CSt = CL(PSt/PL)(TL/TSt), where St denotes the concentration (C), atmospheric pressure (P), and temperature (T) under standard, and L under local conditions. In this study, we used a correction factor of 1.47 to adjust locally measured pollutant concentration to standard conditions (see Table 2 in Alvarez et al. [36]). Pollutant concentrations at local conditions can be found in supplementary material (Table S3).
The information on eBC mass concentration in different transport microenvironments (TMEs) and its descriptive statistics at STP conditions are summarized in Table 3. Spatially aggregated exposure data (following the spatial averaging methodology presented by Alas et al. [37]) separated by mode of travel, route, and time of sampling is provided in Figure S1. Spatial variability of eBC exposure concentration in different TMEs is presented in Figure S1a–c.
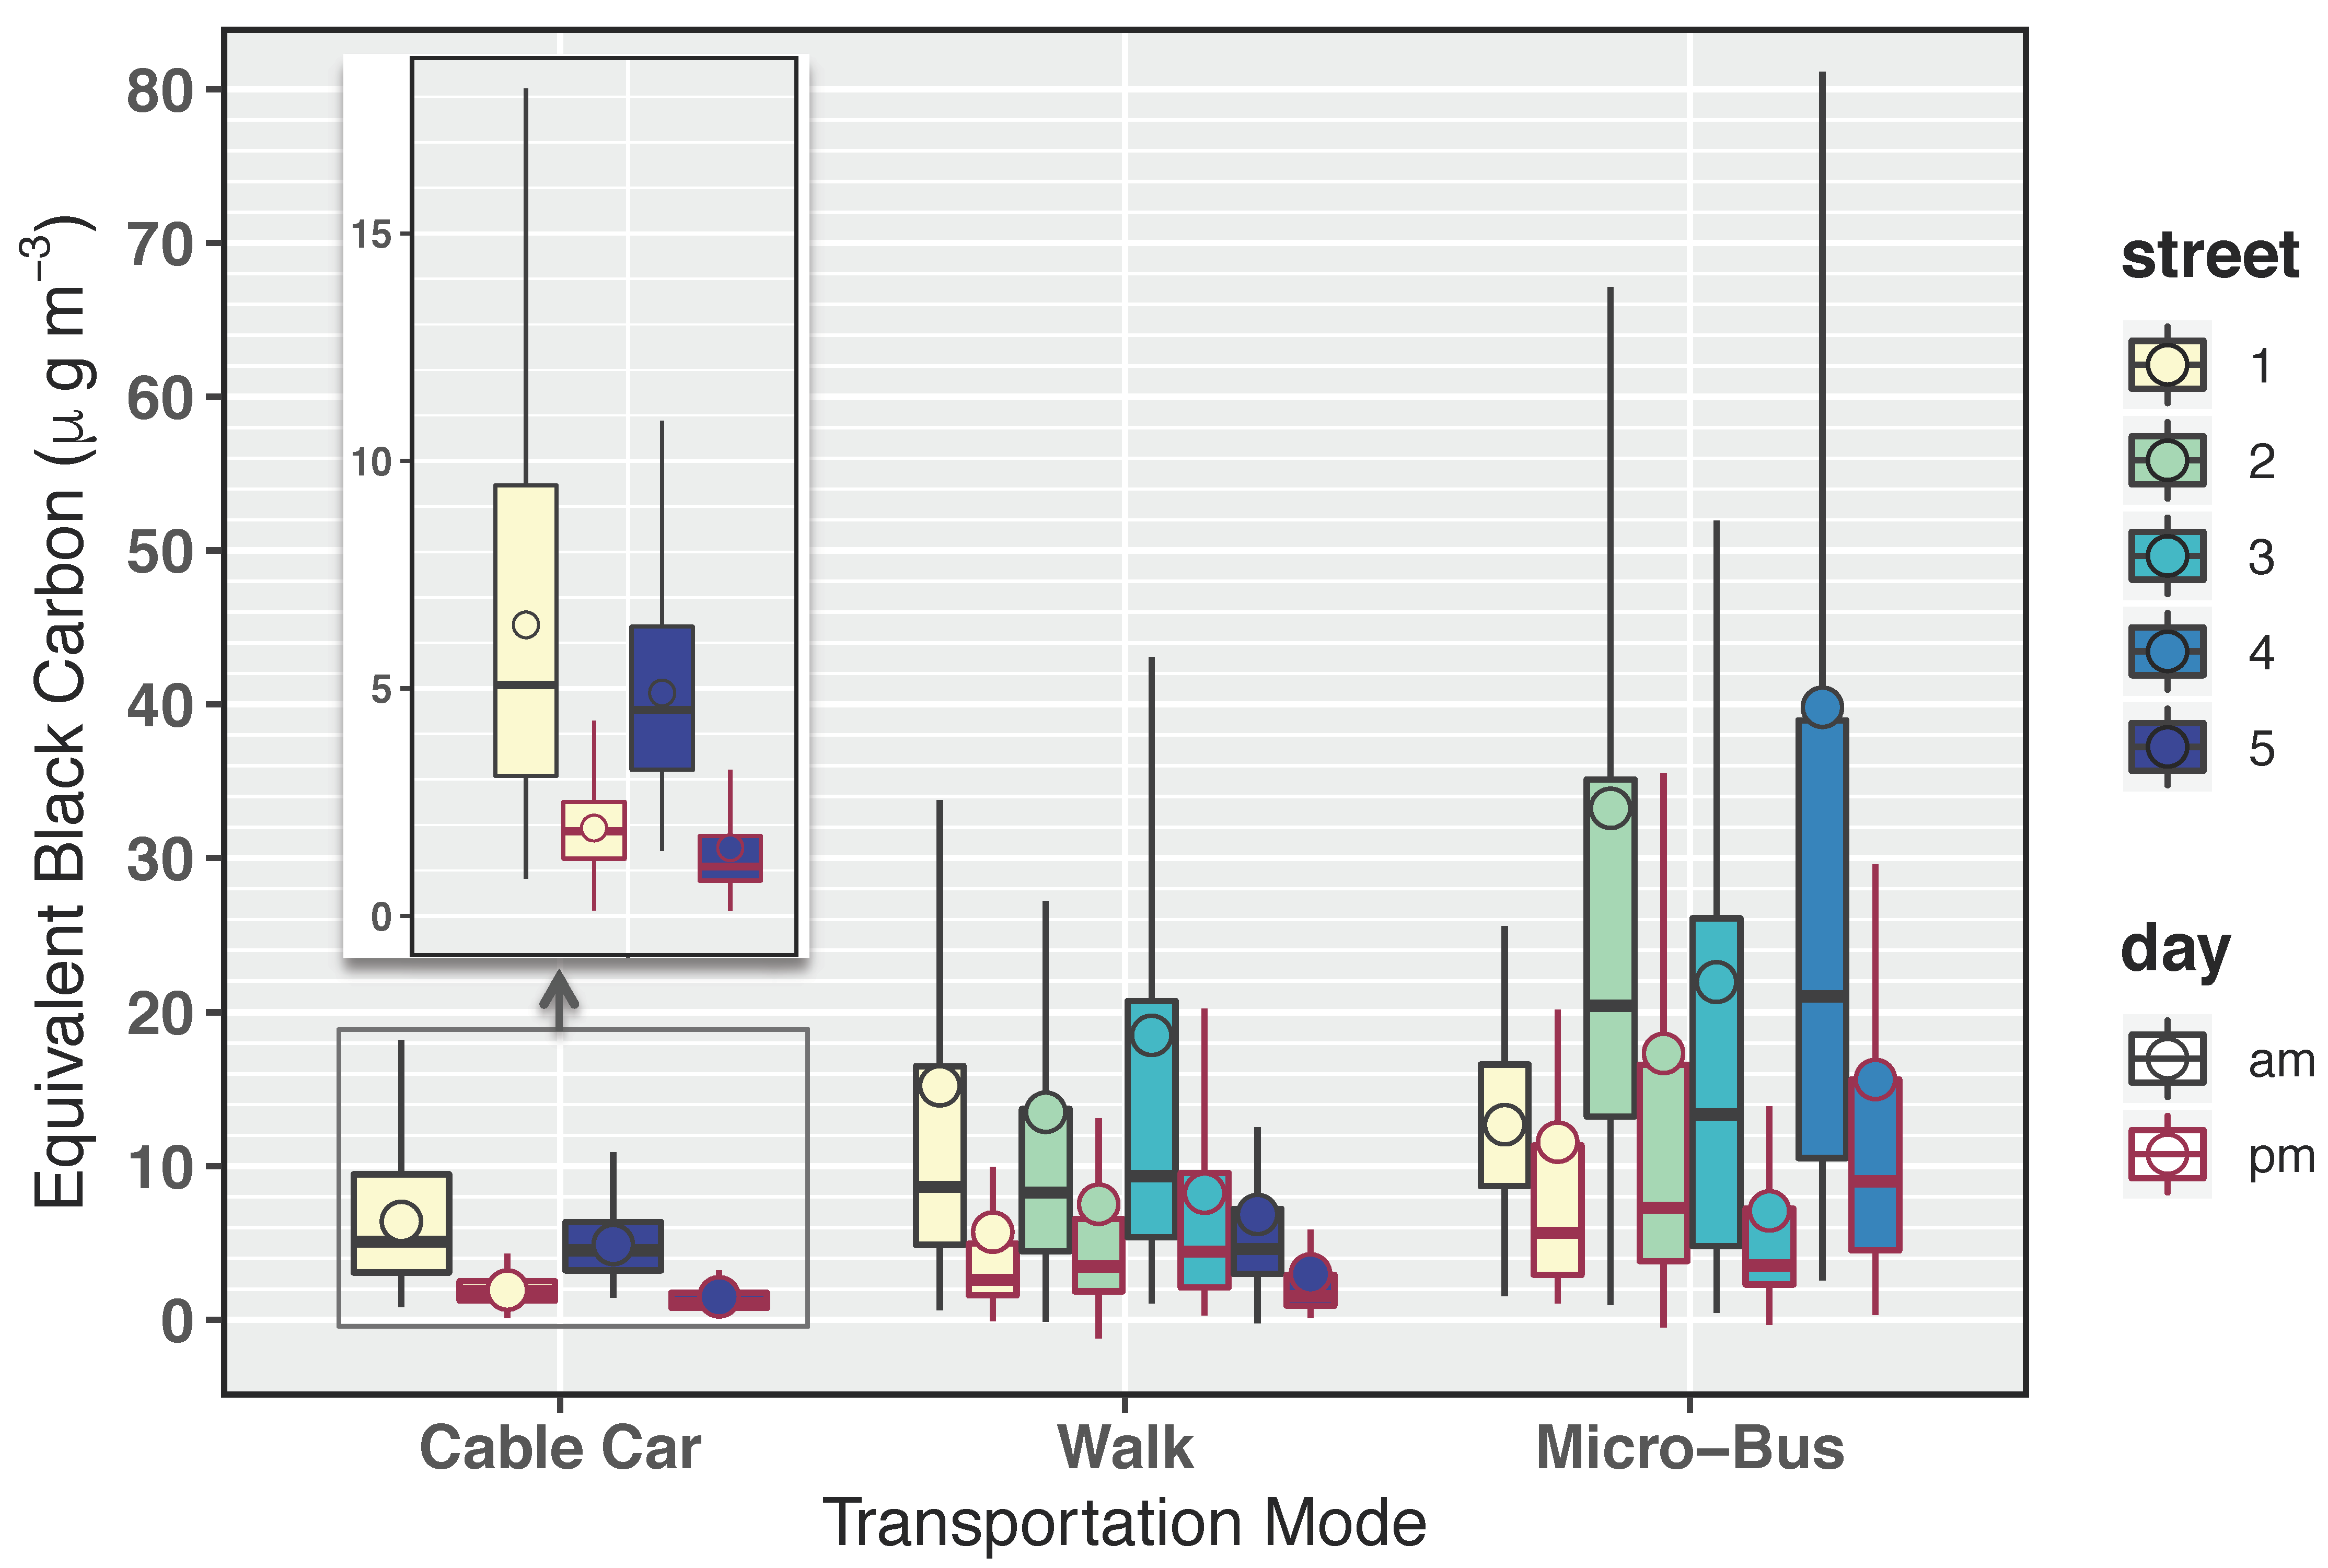
The mean eBC exposure concentration inside the microbus was 24.9 μg m−3, with a wide range of variability (SD, 44 μg m−3). The lowest mean values (0.34 μg m−3) were recorded in open areas, while the highest were at intersections and bus stops (approx. 82 μg m−3) (spatial variability plot of eBC is available in Figure S1). Wiedensohler et al. [38] reported the mean and maximum roadside eBC concentrations in La Paz to be 12 μg m−3 and 23 μg m−3, respectively. This suggests a significant underestimation in personal exposure inside microbuses if stationary measurement data is used for commuter exposure assessment. Contrarily, the mean personal exposure during walking (10.3 μg m−3) and riding cable cars (3.7 μg m−3) could be significantly overestimated if stationary measurement site data is used. From here, it can be seen that if stationary site measurements are used in personal commuter exposure assessment, high uncertainties may be introduced due to high eBC concentration variability. On average, commuters traveling by microbus were exposed to higher eBC concentration, by up to seven times, compared to other TME. The main reason for this is the proximity to the pollution source and the high infiltration of outside pollutants into the microbus through constantly open windows. The eBC exposure concentrations in TMEs on different measurement routes has the following trend: microbus > walking > cable car (Figure 2), which is similar to results from other studies [8,10,13,26,28,29] and agrees well with the systemic review study of Cepeda et al. [39]. However, our observed level of eBC exposure is up to 10 times higher than in the mentioned references. The difference in the magnitude of exposure may be attributed to different vehicle fleets (diesel vs. gasoline), locations (e.g., low emission zones vs. regular setting), closed vs. open windows, etc.
Expectedly, higher eBC exposure concentrations for all the TMEs were observed during the morning peak traffic sampling period. Air pollution concentrations were found, in many studies, to peak during morning hours, as a result of lower mixing height coupled with the peak of traffic volume [38,40]. Congestion on roads increases in-vehicle exposure duration and is associated with emission hotspots due to repeated vehicle accelerations [41,42]. The increased levels of traffic-related pollutants in La Paz and El Alto may be a result of three separate causalities, which together contribute to elevated roadside pollution. Firstly, both La Paz and El Alto are high-altitude cities (3600 and 4100 masl, respectively). Previous studies suggest that, at high altitudes, internal combustion engines operate at reduced efficiency, which relates to higher emission of pollutants (the air/fuel ratio of the mixtures is far richer than stoichiometric) [43,44]. Secondly, intensive traffic and frequent passenger requests to hop on/off along the route result in vehicle speedups, slowdowns, stops, and starts. Such behavior of increased vehicle acceleration/deceleration results in a rich air/fuel mixture, and is known to produce significantly higher emissions compared to steady driving conditions [45,46]. Lastly, approx. 60% of Bolivia’s total vehicle fleet is more than 10 years old, whereas 80% of the public transport fleet is comprised of 17-to-44-year-old vehicles [47]. Outdated engine technology was shown to produce extremely high emissions [17,40]. All previously mentioned causalities work in favor of increased pollution levels in the cities.
The highest mean eBC exposure was observed on the morning microbus rides in a commercial street in El Alto (Street 4, 40.7 μg m−3). Although that segment of route consists of total 10 driving lanes, the frequent stopping and accelerating of microbuses to pick up or drop off passengers along the way may have caused the highest observed eBC exposure concentration. The lowest mean eBC exposure concentration on an afternoon of off-peak traffic sampling was recorded on Street 5, which was 1.6 μg m−3. Considering commutes in off-peak traffic hours, the exposure to eBC can be reduced by up to four times due to lower traffic volume.
3.2. Potential Respiratory Tract Deposition Dose (RDD) Assessment
A summary of the potential RDD per trip is listed in Table 4, and normalized eBC RDD is shown in Figure 3. Although commuters using microbuses were exposed to significantly higher eBC concentrations on the same street than commuters on foot (walking) or in the cable car, the longer time spent on-road and higher inhalation rate of commuters using active modes may offset this effect (Equation (1)).
The time spent traveling 2 km by foot, microbus, and cable car ride was, on average, 30 min, 15 min, and 10 min, respectively. From a study in Stockholm, Sweden (0 masl) [29], the times reported for travel on foot and bus rides for similar distances were reported to be 23 min and 11 min, respectively. A study in Bogota, Colombia (2600 masl) [28] reported an average of 30 min and 10 min travel times on foot and bus rides, respectively. The microbus commuters in our study spent about 50% longer compared to commuters in Stockholm and Bogota. Interestingly, cable car commuters in La Paz and El Alto spent a similar amount of time to cover the same distance as commuters riding buses in Sweden or Colombia. However, it is more complicated to compare the time spent on walking to other similar studies due to several factors, e.g., obstacles in pedestrian ways, the added weight of the portable measurement system, etc. We may surmise the similarity of our time spent on walking to the results from Bogota due to high-altitude resemblance, which makes walking more demanding work, and thus might explain longer time spent per distance than at sea level.
Besides the duration of exposure, the RDD is also determined by the minute ventilation (Equation (1)). While numerous studies intensively investigated minute ventilation [33,48,49,50] (often referred to as inhalation rate), values are commonly taken from the EPA’s Exposure Factor Handbook [8,9,12,20,26,28,29]. While these studies have their reasons to assign minute ventilation from the handbook, we decided to take into account additional minute ventilation factors, such as hypoxia (reduced oxygenation) and the physiology of high-altitude natives [30].
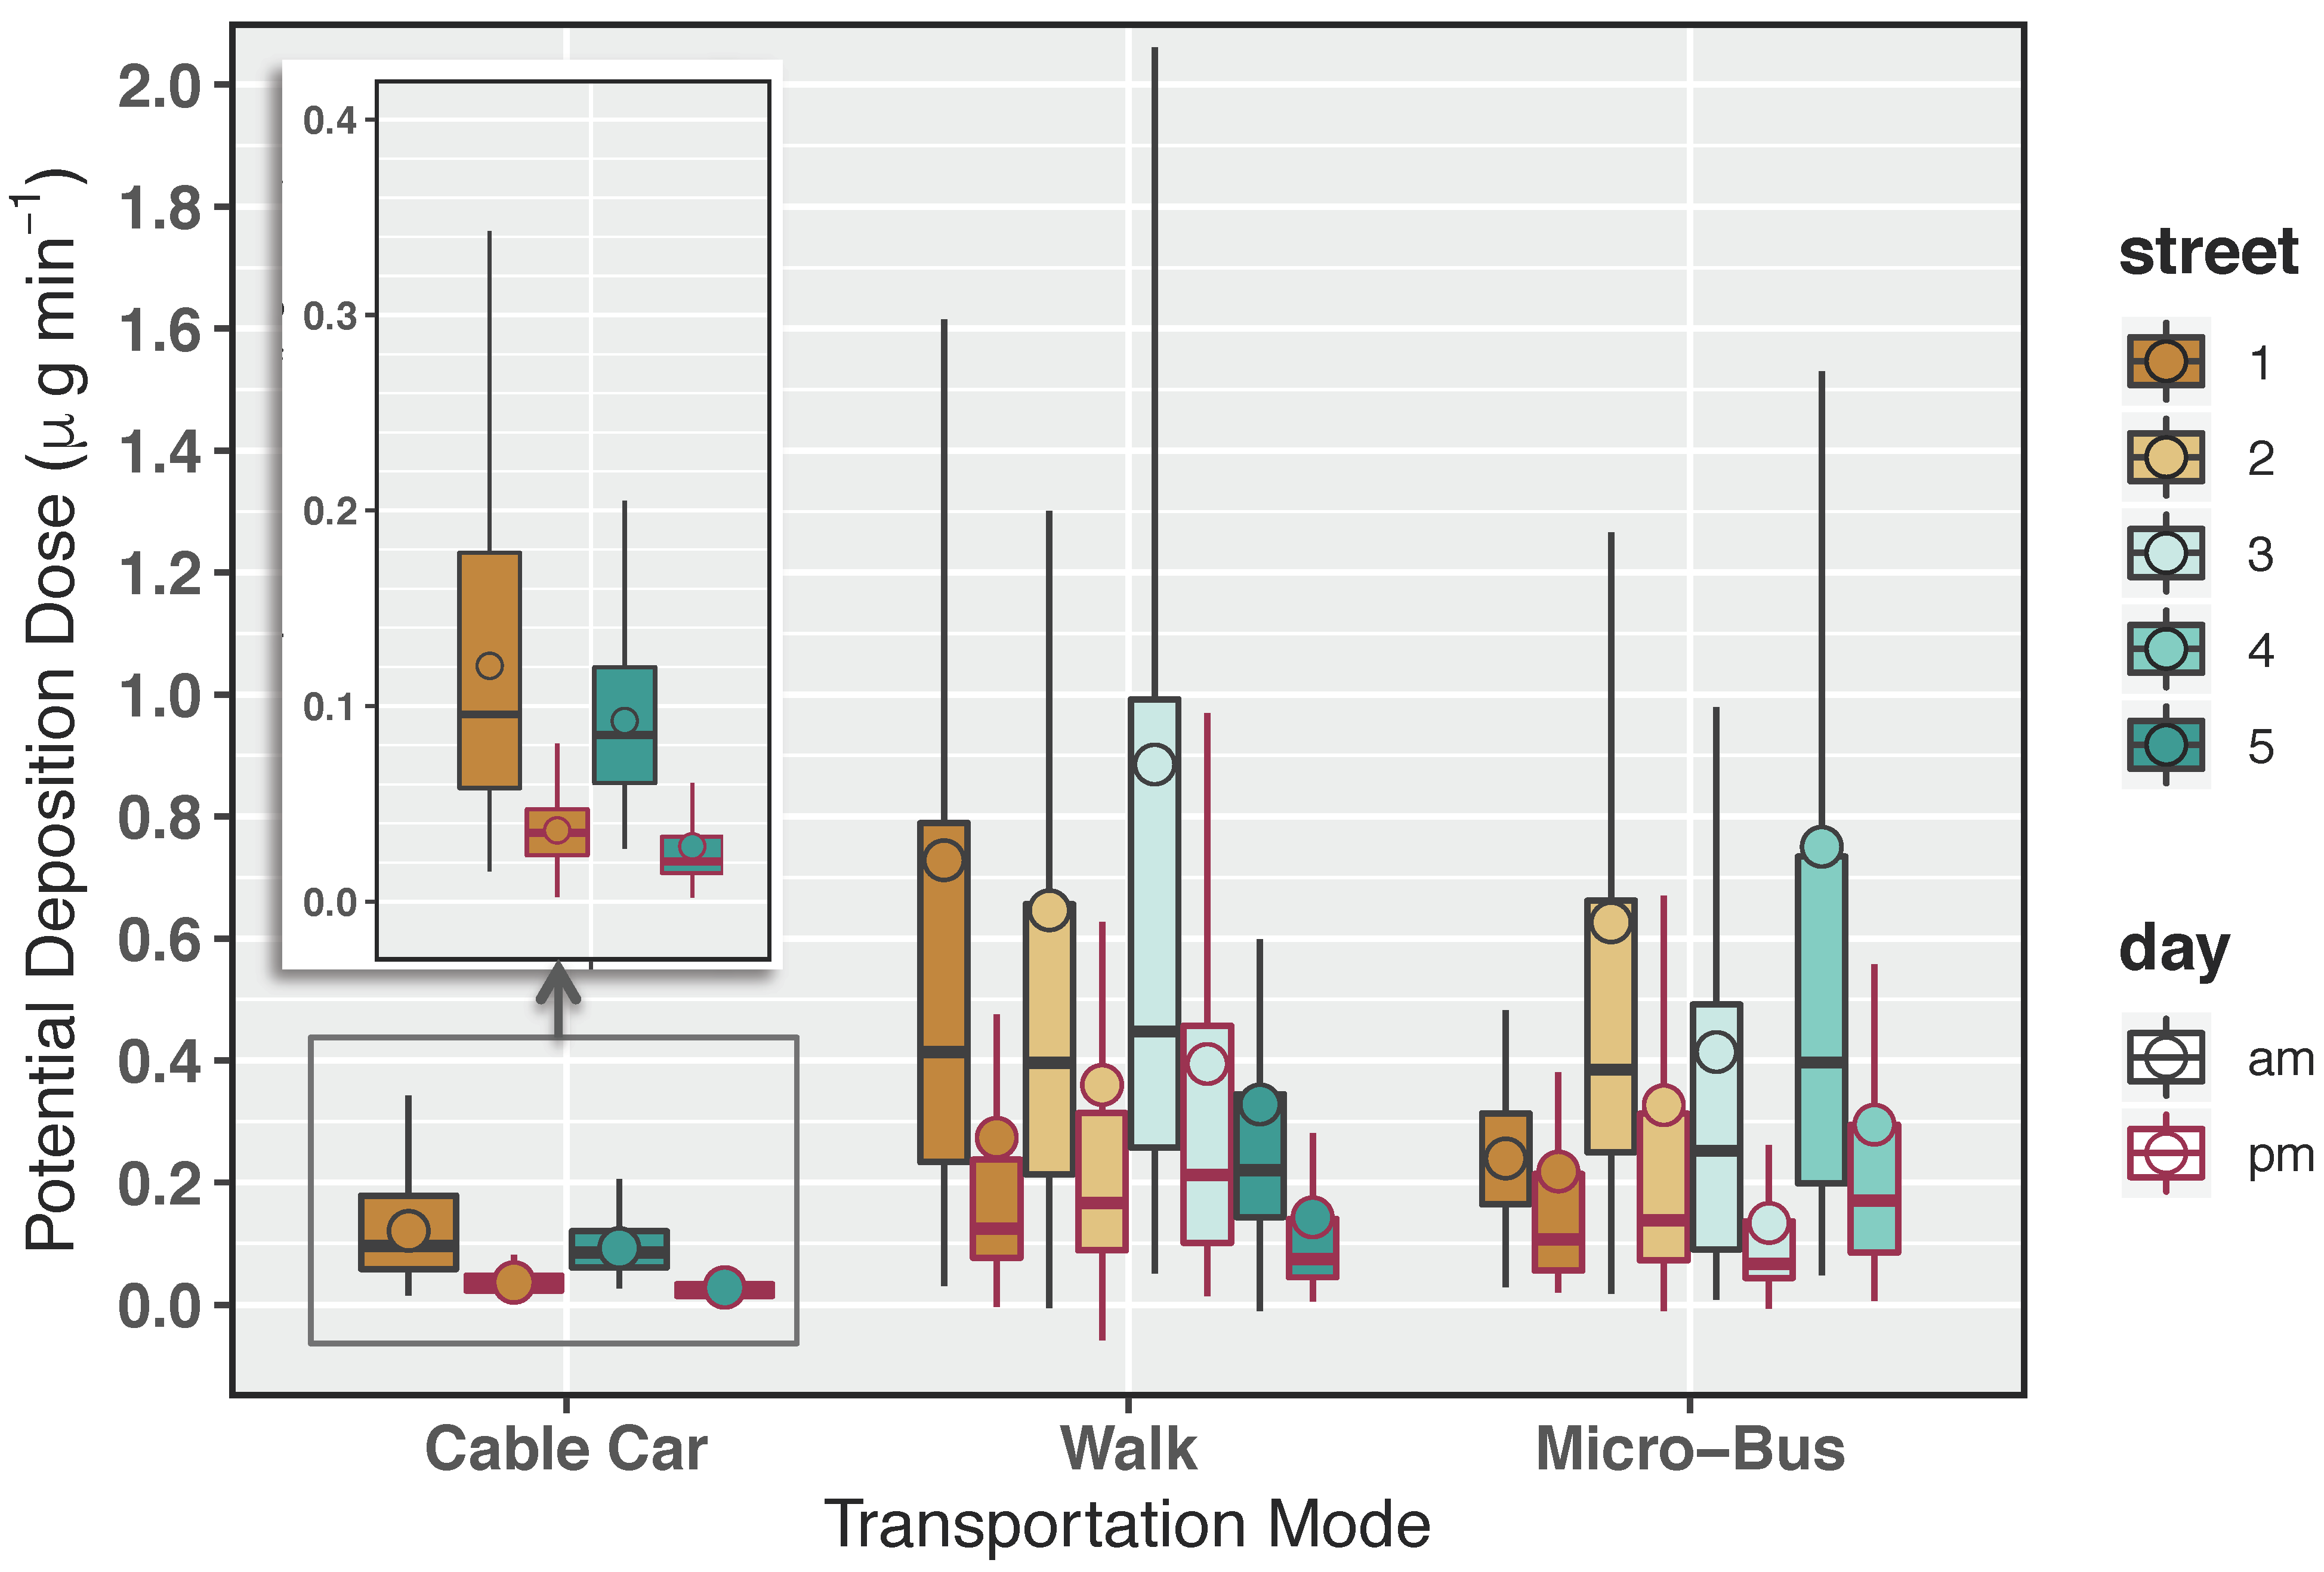
Estimated eBC RDD per trip by walking, microbus and cable car ride were 13 μg, 6.6 μg, and 0.6 μg, respectively. After the normalization of eBC RDD by the commuting time, the mean eBC RDD during walking and microbus ride were on a par (0.48 μg min−1 vs. 0.46 μg min−1). The lowest normalized eBC RDD was observed during a cable car ride (0.07 μg min−1) (Figure 3). Expectedly, morning peak traffic commutes were always identified with higher eBC RDD than afternoon off-peak traffic commutes for all measurement routes and TMEs. This can be explained by higher eBC exposure concentrations. Commuters may reduce eBC RDD by wisely choosing commuting routes with less traffic volume.
In general, in other studies, commuting in different TMEs showed consistently higher values during walking than during bus rides (Table 5). Twelve studies reviewed by Cepeda et al. [39], together with more recent studies by Okokon et al. [15], Targino et al. [26], and Merritt et al. [29], reported similar results for eBC RDD when comparing walking to bus or car travel modes. All studies, including this study, concluded that eBC RDD per trip for active modes was considerably higher than for passive commuting modes. Although the results may undermine the use of the active mode of travel, such a conclusion should not be isolated from the benefits that active living could bring. A recent epidemiological study [39], comprised of investigations of exposure to TMEs, estimated the trade-off in years of life expectancy (YLE) due to inhalation of fine particles, and revealed that the positive net gain in YLE by active travel could be up to 5 years (depending on age group) for commuting a 7-km route per week; or, from another perspective, commuters using motorized transport lost up to 1 YLE more than active travel mode commuters, indicating that the benefits of active commuting outweigh the risks.
The best-case scenario for a commuter is to travel on modes and routes where both eBC exposure and minute ventilation is at its lowest. Our study showed that the eBC exposure during walking and microbus rides in Bolivia is on average 2.6- and 4.3-times higher than in other studies under STP conditions, respectively. Moreover, our measurement sites were located at high altitude, which in effect made minute ventilation for walking and microbus ride 1.8- and 1.4-times greater than the inhalation rate of commuters at sea level. The combination of both high eBC exposure concentrations and high minute ventilation resulted in 2.5- and 5.8-fold higher eBC RDD per time of travel on foot and bus, respectively, than studies reported at sea level. Higher minute ventilation implies that, in order to reduce the eBC RDD by the same factor as at sea level, the exposure at high altitude has to be reduced 1.4- to 1.8-fold. In other words, in order to halve eBC RDD at sea level, a high altitude city should reduce their exposure by about four times more to achieve similar results. This entails that policies and regulations on road emissions in high-altitude cities should be doubly stringent and aggressive than at sea level.
3.3. Reduction of Exposure and RDD in Cable Car Ride
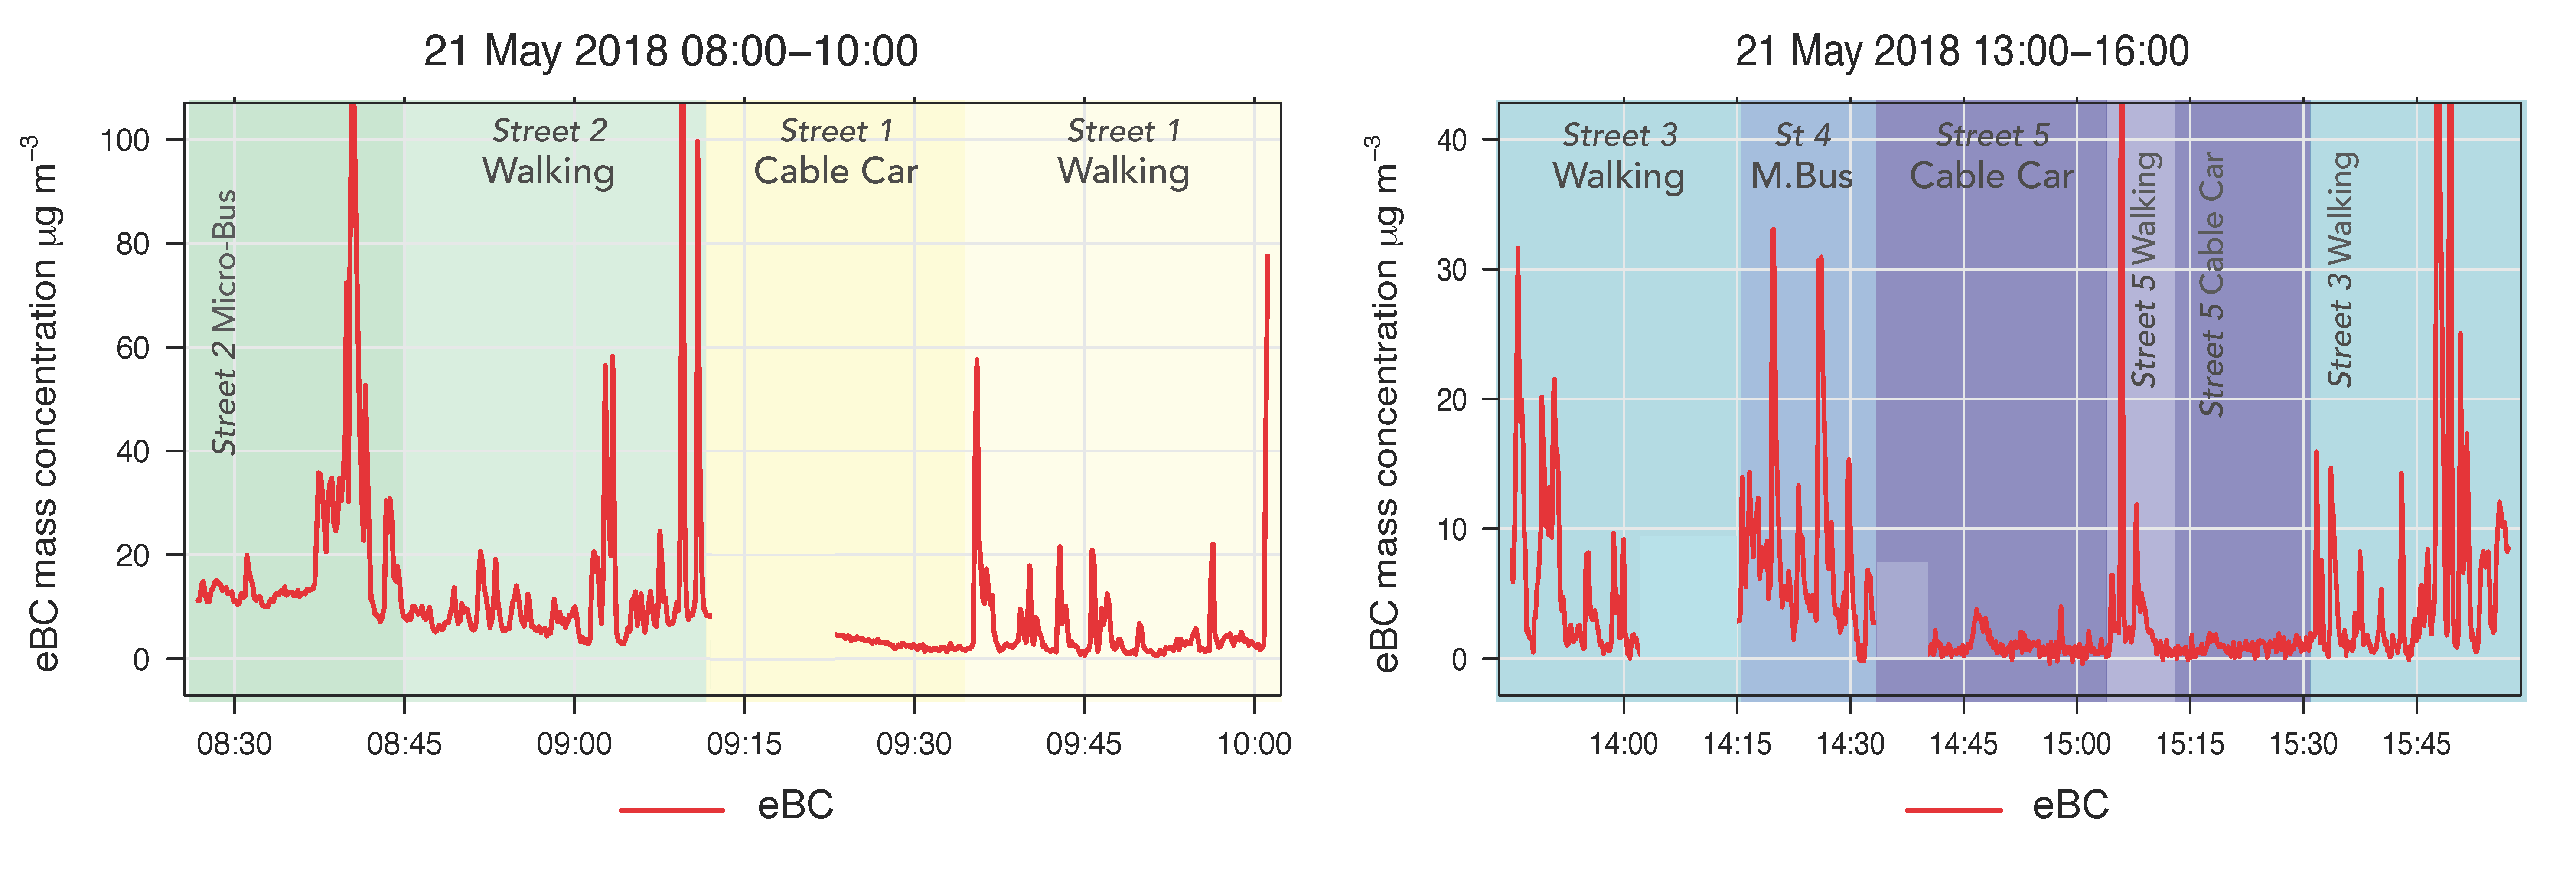
To illustrate the variance in eBC exposure concentration during a commute, Figure 4 shows a sample time-series on one of the sampling sessions recorded at the time of morning peak traffic hours in the streets of La Paz and afternoon off-peak traffic hours in El Alto. It can be seen how abruptly the exposure to eBC concentration dropped when entering the cable car. Conversely, a sudden increase in eBC exposure after riding the cable car was observed in the majority of cases.
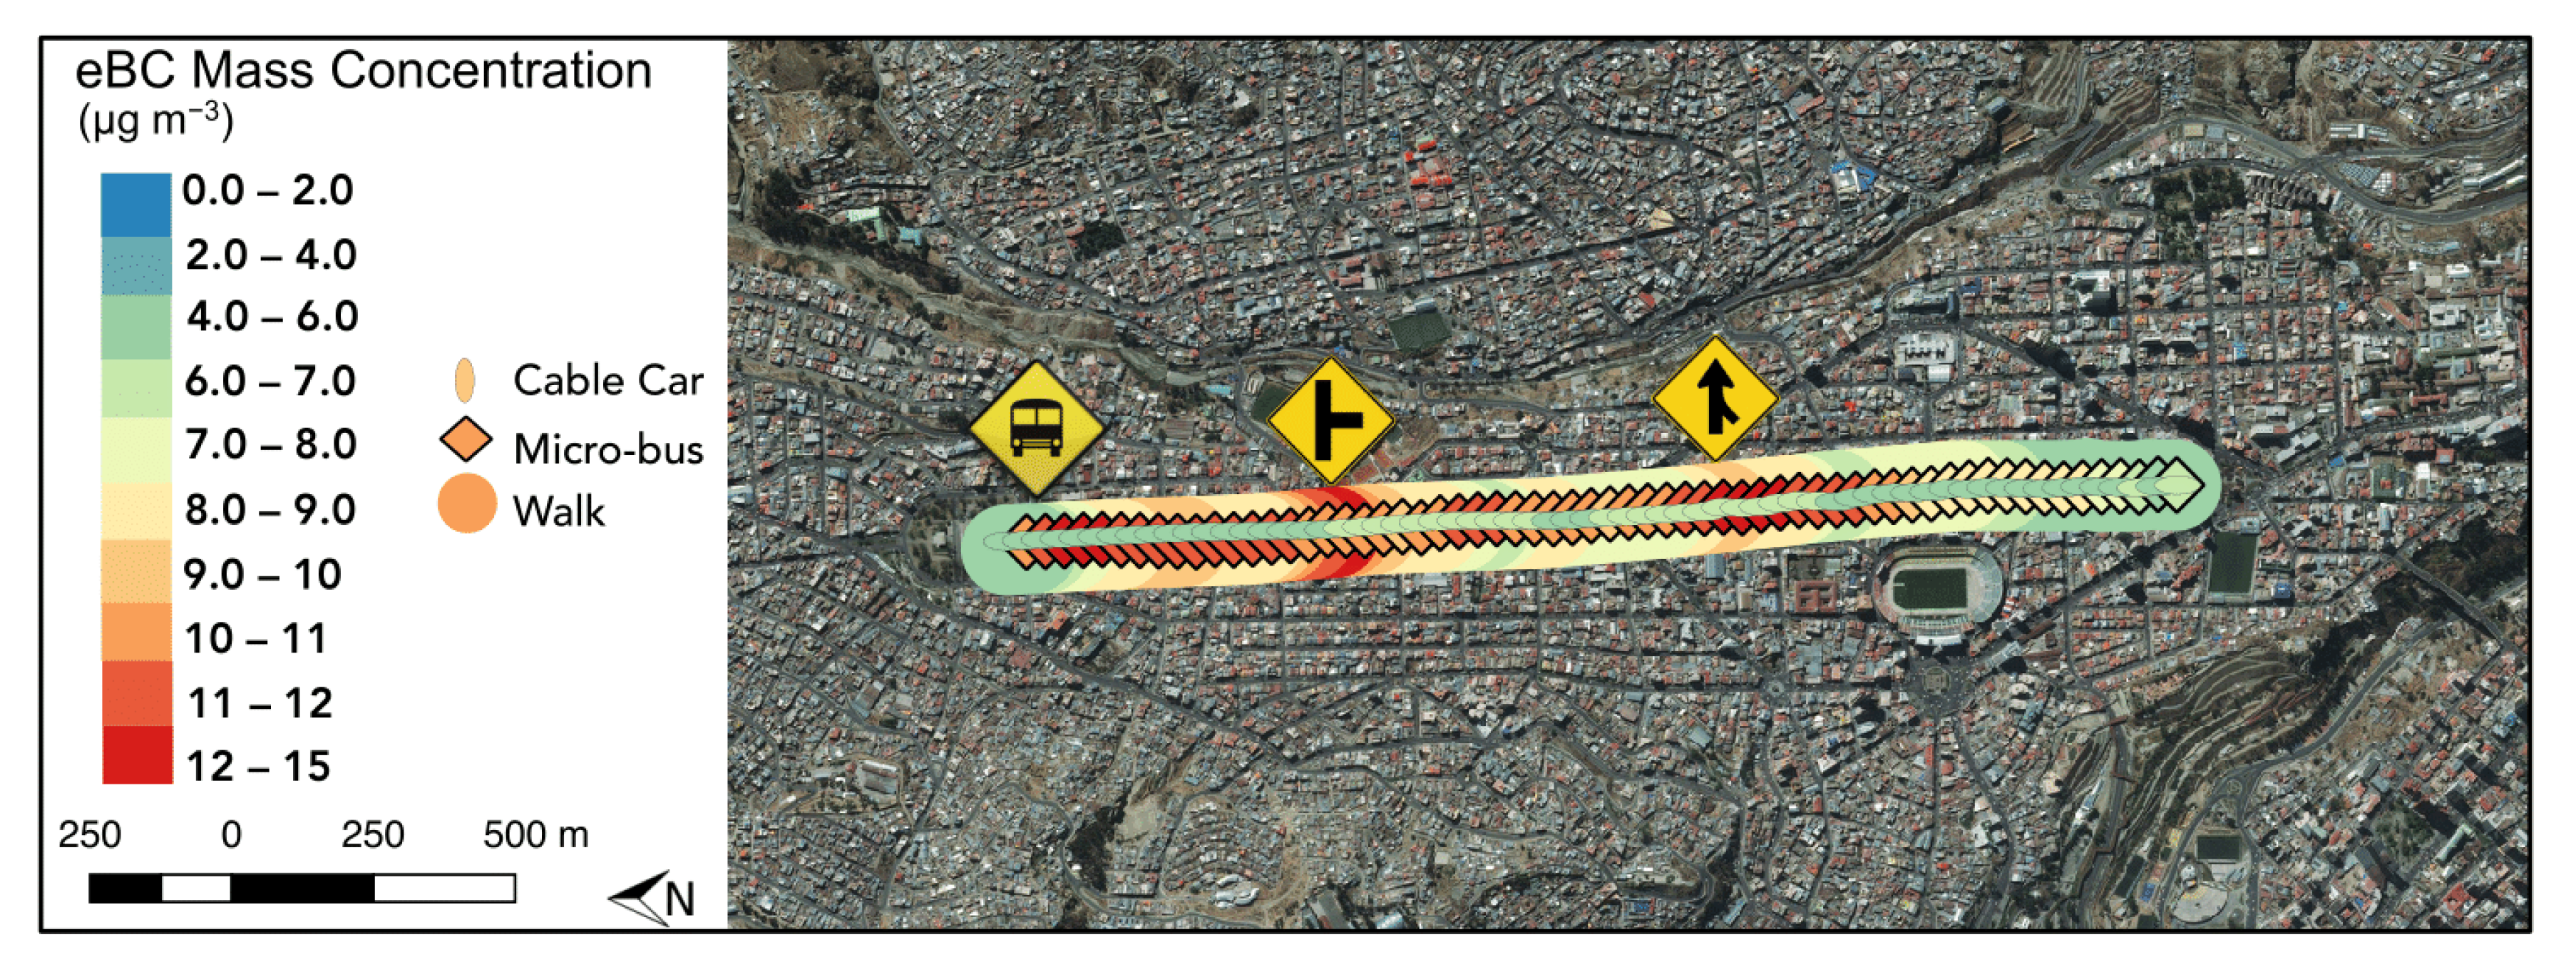
For comparison of eBC exposure concentrations between different modes of transportation, we choose Street 1, where all travel modes co-existed (Figure 5). This enabled us to reduce possible variability in eBC exposure due to different street configurations, time of day, etc. Figure 5 displays the spatial distribution of median eBC exposure concentrations for all morning sampling sessions in Street 1 on each TME. The commute by walking showed a relatively stable eBC mass concentration, except in situations near road intersections with a traffic light, where the highest increase in eBC exposure concentration was measured. Emission bursts from the accelerating car may explain the increased eBC exposure in this location. Contrarily, a cable car ride consistently showed low and more stable eBC exposure concentrations during the commute, indicating less effect due to traffic.
As shown in Section 3.1 and Section 3.2, eBC exposure and RDD during commuting highly depend on the travel mode chosen. Unique to this study is a passage for commute by cable car. As this is not only remote to the street pollution sources, it also provides the fastest travel speed of 0.2 km min−1 (compared to 0.13 (microbus) and 0.07 (walking) km min−1). Shorter travel time, lower minute ventilation, and greater distance away from pollution source (lower exposure concentration) result in considerably lower RDD of eBC (2.8 μg m−3; 0.05 μg min−1). By choosing the cable car as transportation mode, the exposure could be reduced by up to five times (Table 3), thereby reducing average RDD per trip 13 times when compared to other modes of transportation (Table 4). For example, during a morning peak traffic hour in a commercial street in El Alto (Street 4), the highest observed eBC exposure concentration was 40.7 μg m−3. Meanwhile, on the parallel street (Street 5) inside the cable car, the eBC exposure concentration was measured as 5.1 μg m−3 (Table 3). This is comparable to the eBC urban background concentration (5 μg m−3) in El Alto reported by Wiedensohler et al. [38].
4. Summary and Conclusions
In this work, we present the exposure concentration and potential respiratory tract deposition dose (RDD) of equivalent black carbon (eBC) in different transport microenvironments (TMEs) in the high-altitude cities of La Paz and El Alto, Bolivia. TMEs investigated were divided into two modes: active (walking), and passive (riding in microbuses and cable cars). We found that commuting amidst peak traffic hours increases commuters’ eBC exposure and RDD by up to four times more than travel during off-peak traffic hours. On a commute inside a microbus, the proximity to emission source (tailpipe emissions) and high infiltration of the pollutants due to open windows resulted in large variability in measured eBC exposure concentrations. Despite the higher mean exposure concentration of eBC inside microbuses than during walking and cable car rides (12.8 μg m−3 vs. 4.9 μg m−3 vs. 2.8 μg m−3, respectively), the pedestrians were found to experience the highest RDD of eBC per trip (6.3 μg vs. 3.3 μg (microbus) vs. 0.5 μg (cable car)). This is due to higher minute ventilation and the longer commute time while walking. It is also notable that, in order to achieve a similar reduction in RDD of eBC, reduction of exposure concentrations in high-altitude cities must be 1.4 to 1.8 times as stringent as in sea-level cities. The shortest time spent in travel and a low proximity to the vehicle exhaust (thus reduced exposure) were found for commuting in cable car cabins, thus providing the lowest RDD of eBC. Although cable car as a public transportation system is not commonly practiced in many developing cities, the results of this study provide an insight into the possible reduction in commuters’ exposure to and respiratory deposition dose of traffic-related pollutants if such mode of transportation is used.
The results presented in this study increase the knowledge about eBC pollution levels in developing regions, specifically, providing insights into eBC exposure concentrations and RDD in La Paz and El Alto, which can be used to assess health risks from environmental pollutants in high-altitude regions. Moreover, for the first time, we showed that cable cars might be a viable mode of transportation used to not only improve citizens’ mobility and reduce street congestion and pollution, but also contribute to lessening personal exposure and RDD of eBC. Future studies shall further focus on this promising mode of transportation, revealing its advantages and shortcomings.
Supplementary Materials
The following are available online at https://www.mdpi.com/2073-4433/11/6/598/s1, Table S1: review of related literature, Table S2: energy expenditure per activity, Table S3: exposure concentrations at local conditions; Figure S1a–c: spatial variability of eBC exposure concentration in different TMEs.
Author Contributions
Conceptualization, L.M., S.K., M.A. and A.W.; Data curation, L.M. and S.K.; Formal analysis, L.M.; Funding acquisition, M.A. and A.W.; Investigation, L.M. and S.K.; Methodology, L.M. and S.K.; Resources, M.A. and A.W.; Software, L.M.; Supervision, S.K.; Validation, L.M.; Visualization, L.M.; Writing—original draft, L.M.; Writing—review & editing, L.M., S.K., M.A. and A.W. All authors have read and agreed to the published version of the manuscript.
Funding
The research leading to these results received funding from the European Union H2020 programme PAPILA (GA 777544).
Acknowledgments
We greatly acknowledge the help from the scientific staff and the students of the Laboratory for Atmospheric Physics, IIF-UMSA, for joining us in the experiment. We would also like to thank the Institut de Reserche pour le Développment (IRD) for all the logistic support, and Paolo Laj and Gaelle Uzu for their help and scientific advice.
Conflicts of Interest
The authors declare no conflict of interest.
References
- Greenbaum, D. HEI Panel on the Health Effects of Traffic-Related Air Pollution. In Traffic-Related Air Pollution: A Critical Review of the Literature on Emissions, Exposure, and Health Effects; HEI Special Report 17. 386; Health Effects Institute: Boston, MA, USA, 2010. [Google Scholar]
- Landrigan, P. Air Pollution And Health. Lancet Public Health 2017, 2, e4–e5. [Google Scholar] [CrossRef] [Green Version]
- Loomis, D.; Grosse, Y.; Lauby-Secretan, B.; El Ghissassi, F.; Bouvard, V.; Benbrahim-Tallaa, L.; Guha, N.; Baan, R.; Mattock, H.; Straif, K. The carcinogenicity of outdoor air pollution. Lancet Oncol. 2013, 14, 1262–1263. [Google Scholar] [CrossRef]
- World Health Organization. Ambient Air Quality Database; WHO: Geneva, Switzerland, 2018; Available online: http://www9.who.int/entity/airpollution/data/aap_air_quality_database_2018_v9.xlsx (accessed on 15 March 2020).
- Cui, Y.; Zhang, Z.; Froines, J.R.; Zhao, J.; Wang, H.; Yu, S.-Z.; Detels, R. Air pollution and case fatality of SARS in the People’s Republic of China: An ecologic study. Environ. Health 2003, 2, 15. [Google Scholar] [CrossRef] [Green Version]
- Wu, X.; Nethery, R.C.; Sabath, B.M.; Braun, D.; Dominici, F. Exposure to air pollution and COVID-19 mortality in the United States: A nationwide cross-sectional study. medRxiv 2020. [Google Scholar] [CrossRef] [Green Version]
- Kumar, P.; Rivas, I.; Singh, A.P.; Ganesh, V.J.; Ananya, M.; Frey, H.C. Dynamics of coarse and fine particle exposure in transport microenvironments. npj Clim. Atmos. Sci. 2018, 1, 1. [Google Scholar] [CrossRef]
- De Nazelle, A.; Fruin, S.; Westerdahl, D.; Martinez, D.; Ripoll, A.; Kubesch, N.; Nieuwenhuijsen, M. A travel mode comparison of commuters’ exposures to air pollutants in Barcelona. Atmos. Environ. 2012, 59, 151–159. [Google Scholar] [CrossRef]
- Rivas, I.; Kumar, P.; Hagen-Zanker, A. Exposure to air pollutants during commuting in London: Are there inequalities among different socio-economic groups? Environ. Int. 2017, 101, 143–157. [Google Scholar] [CrossRef] [Green Version]
- Dons, E.; Panis, L.I.; Van Poppel, M.; Theunis, J.; Wets, G. Personal exposure to Black Carbon in transport microenvironments. Atmos. Environ. 2012, 55, 392–398. [Google Scholar] [CrossRef]
- Ham, W.; Vijayan, A.; Schulte, N.; Herner, J.D. Commuter exposure to PM2.5, BC, and UFP in six common transport microenvironments in Sacramento, California. Atmos. Environ. 2017, 167, 335–345. [Google Scholar] [CrossRef]
- Vouitsis, I.; Taimisto, P.; Kelessis, A.; Samaras, Z. Microenvironment particle measurements in Thessaloniki, Greece. Urban Clim. 2014, 10, 608–620. [Google Scholar] [CrossRef]
- Li, B.; Lei, X.-N.; Xiu, G.; Gao, C.-Y.; Gao, S.; Qian, N.-S. Personal exposure to black carbon during commuting in peak and off-peak hours in Shanghai. Sci. Total. Environ. 2015, 524, 237–245. [Google Scholar] [CrossRef] [PubMed]
- Williams, R.D.; Knibbs, L.D. Daily personal exposure to black carbon: A pilot study. Atmos. Environ. 2016, 132, 296–299. [Google Scholar] [CrossRef] [Green Version]
- Okokon, E.; Yli-Tuomi, T.; Turunen, A.W.; Taimisto, P.; Pennanen, A.; Vouitsis, I.; Samaras, Z.; Voogt, M.; Keuken, M.; Lanki, T. Particulates and noise exposure during bicycle, bus and car commuting: A study in three European cities. Environ. Res. 2017, 154, 181–189. [Google Scholar] [CrossRef]
- Shiraiwa, M.; Selzle, K.; Pöschl, U. Hazardous components and health effects of atmospheric aerosol particles: Reactive oxygen species, soot, polycyclic aromatic compounds and allergenic proteins. Free Radic. Res. 2012, 46, 927–939. [Google Scholar] [CrossRef]
- Madueño, L.; Kecorius, S.; Birmili, W.; Müller, T.; Simpas, J.; Vallar, E.; Galvez, M.C.; Cayetano, M.G.; Wiedensohler, A. Aerosol Particle and Black Carbon Emission Factors of Vehicular Fleet in Manila, Philippines. Atmosphere 2019, 10, 603. [Google Scholar] [CrossRef] [Green Version]
- WHO. Health Effects of Black Carbon. 2012. Available online: http://www.euro.who.int/__data/assets/pdf_file/0004/162535/e96541.pdf (accessed on 7 May 2020).
- Löndahl, J.; Massling, A.; Pagels, J.; Swietlicki, E.; Vaclavik, E.; Loft, S. Size-Resolved Respiratory-Tract Deposition of Fine and Ultrafine Hydrophobic and Hygroscopic Aerosol Particles During Rest and Exercise. Inhal. Toxicol. 2007, 19, 109–116. [Google Scholar] [CrossRef]
- U.S. Environmental Protection Agency. Exposure Factors Handbook. 2011. Available online: https://www.epa.gov/sites/production/files/2015-09/documents/efh-chapter06.pdf (accessed on 7 May 2020).
- Rode, P.; Floater, G.; Thomopoulos, N.; Docherty, J.; Schwinger, P.; Mahendra, A.; Fang, W.; Meyer, G.; Shaheen, S. Accessibility in Cities: Transport and Urban Form; Springer: Berlin/Heidelberg, Germany, 2017; pp. 239–273. [Google Scholar] [CrossRef] [Green Version]
- Bocarejo, J.P.; Portilla, I.J.; Velasquez, J.M.; Cruz, M.N.; Pena, A.; Oviedo, D.R. An innovative transit system and its impact on low income users: The case of the Metrocable in Medellín. J. Transp. Geogr. 2014, 39, 49–61. [Google Scholar] [CrossRef]
- Insituto Nacional de Estadística. Available online: https://www.ine.gob.bo/ (accessed on 15 April 2020).
- Bürger, J. Comparison of Urban Transportation Mmodes in La Paz and Strategies toward a Data-driven, Adaptive Multimodal Intelligent Transport System, Technical Report. Available online: https://www.researchgate.net/publication/334429746_Comparison_of_Urban_Transportation_Modes_in_La_Paz_and_Strategies_toward_a_Data-Driven_Adaptive_Multimodal_Intelligent_Transport_System (accessed on 7 May 2020).
- Madueño, L.; Kecorius, S.; Löndahl, J.; Müller, T.; Pfeifer, S.; Haudek, A.; Mardoñez, V.; Wiedensohler, A. A new method to measure real-world respiratory tract deposition of inhaled ambient black carbon. Environ. Pollut. 2019, 248, 295–303. [Google Scholar] [CrossRef]
- Targino, A.C.; Rodrigues, M.; Krecl, P.; Cipoli, Y.A.; Ribeiro, J.P.M. Commuter exposure to black carbon particles on diesel buses, on bicycles and on foot: A case study in a Brazilian city. Environ. Sci. Pollut. Res. 2017, 25, 1132–1146. [Google Scholar] [CrossRef]
- Londähl, J. Experimental Determination of the Deposition of Aerosol Particles in the Human Respiratory Tract. Ph.D. Thesis, Department of Physics, Lund University, Lund, Sweden, 27 February 2009. [Google Scholar]
- Betancourt, R.M.; Galvis, B.; Balachandran, S.; Ramos-Bonilla, J.; Sarmiento, O.L.; Gallo-Murcia, S.; Contreras, Y. Exposure to fine particulate, black carbon, and particle number concentration in transportation microenvironments. Atmos. Environ. 2017, 157, 135–145. [Google Scholar] [CrossRef]
- Merritt, A.-S.; Georgellis, A.; Andersson, N.; Bedada, G.B.; Bellander, T.; Johansson, C. Personal exposure to black carbon in Stockholm, using different intra-urban transport modes. Sci. Total. Environ. 2019, 674, 279–287. [Google Scholar] [CrossRef]
- Milledge, J.S. The Control of Breathing at High Altitude. Ph.D. Thesis, University of Birmingham, Birmingham, UK, 1968. [Google Scholar]
- Bennett, W.D.; Zeman, K.L.; Jarabek, A.M. Nasal Contribution to Breathing and Fine Particle Deposition in Children Versus Adults. J. Toxicol. Environ. Health Part A 2007, 71, 227–237. [Google Scholar] [CrossRef]
- Foos, B.; Marty, M.; Schwartz, J.; Bennett, W.; Moya, J.; Jarabek, A.M.; Salmon, A.G. Focusing on children’s inhalation dosimetry and health effects for risk assessment: An introduction. J. Toxicol. Environ. Health A 2008, 71, 149–165. [Google Scholar] [CrossRef] [PubMed]
- Horiuchi, M.; Kirihara, Y.; Fukuoka, Y.; Pontzer, H. Sex differences in respiratory and circulatory cost during hypoxic walking: Potential impact on oxygen saturation. Sci. Rep. 2019, 9, 9550. [Google Scholar] [CrossRef]
- Schoene, R.B. Limits of human lung function at high altitude. J. Exp. Boil. 2001, 204, 3121–3127. [Google Scholar]
- Lahiri, S.; Kao, F.; Velásquez, T.; Martinez, C.; Pezzia, W. Respiration of man during exercise at high altitude: Highlander vs lowlander. Respir. Physiol. 1970, 8, 361–375. [Google Scholar] [CrossRef]
- Alvarez, H.B.; Echeverria, R.S.; Alvarez, P.S.; Krupa, S. Air Quality Standards for Particulate Matter (PM) at high altitude cities. Environ. Pollut. 2013, 173, 255–256. [Google Scholar] [CrossRef] [PubMed]
- Alas, H.D.C.; Weinhold, K.; Costabile, F.; Di Ianni, A.; Müller, T.; Pfeifer, S.; Di Liberto, L.; Turner, J.R.; Wiedensohler, A. Methodology for high-quality mobile measurement with focus on black carbon and particle mass concentrations. Atmos. Meas. Tech. 2019, 12, 4697–4712. [Google Scholar] [CrossRef] [Green Version]
- Wiedensohler, A.; Andrade, M.; Weinhold, K.; Müller, T.; Birmili, W.; Velarde, F.; Moreno, I.; Forno, R.; Sanchez, M.; Laj, P.; et al. Black carbon emission and transport mechanisms to the free troposphere at the La Paz/El Alto (Bolivia) metropolitan area based on the Day of Census (2012). Atmos. Environ. 2018, 194, 158–169. [Google Scholar] [CrossRef]
- Cepeda, M.; Schoufour, J.; Freak-Poli, R.; Koolhaas, C.M.; Dhana, K.; Bramer, W.M.; Franco, O.H. Levels of ambient air pollution according to mode of transport: A systematic review. Lancet Public Health 2017, 2, e23–e34. [Google Scholar] [CrossRef] [Green Version]
- Kecorius, S.; Madueño, L.; Vallar, E.; Alas, H.; Betito, G.; Birmili, W.; Cambaliza, M.O.; Catipay, G.; Gonzaga-Cayetano, M.; Galvez, M.C.; et al. Aerosol particle mixing state, refractory particle number size distributions and emission factors in a polluted urban environment: Case study of Metro Manila, Philippines. Atmos. Environ. 2017, 170, 169–183. [Google Scholar] [CrossRef]
- Briggs, D.J.; De Hoogh, K.; Morris, C.; Gulliver, J. Effects of travel mode on exposures to particulate air pollution. Environ. Int. 2008, 34, 12–22. [Google Scholar] [CrossRef] [PubMed]
- Goel, R.; Gani, S.; Guttikunda, S.K.; Wilson, D.; Tiwari, G. On-road PM2·5 pollution exposure in multiple transport microenvironments in Delhi. Atmos. Environ. 2015, 123, 129–138. [Google Scholar] [CrossRef]
- Ghazikhani, M.; Feyz, M.E.; Mahian, O.; Sabazadeh, A. Effects of altitude on the soot emission and fuel consumption of a light-duty diesel engine. Transport 2013, 28, 130–139. [Google Scholar] [CrossRef]
- Wang, X.; Ge, Y.; Yu, L. Combustion and Emission Characteristics of a Heavy-Duty Diesel Engine at Idle at Various Altitudes. SAE Int. J. Engines 2013, 6, 1145–1151. [Google Scholar] [CrossRef]
- Cloke, L.; Harris, G.; Latham, S.; Quimby, A.; Smith, E.; Baughan, C. Reducing the Environmental Impact of Driving: A Review of Training and In-Vehicle Technologies; Transport Res. Lab.: Crowthorne, UK, 1999. [Google Scholar]
- Zhang, K.; Batterman, S. Air pollution and health risks due to vehicle traffic. Sci. Total. Environ. 2013, 450, 307–316. [Google Scholar] [CrossRef] [Green Version]
- Global Fleet. Available online: https://www.globalfleet.com/en/wikifleet/bolivia (accessed on 29 May 2020).
- Panis, L.I.; De Geus, B.; Vandenbulcke, G.; Willems, H.; Degraeuwe, B.; Bleux, N.; Mishra, V.; Thomas, I.; Meeusen, R. Exposure to particulate matter in traffic: A comparison of cyclists and car passengers. Atmos. Environ. 2010, 44, 2263–2270. [Google Scholar] [CrossRef]
- Wang, Z.; Wu, T.; Duan, X.; Wang, S.; Zhang, W.; Wu, X.; Yu, Y. Research on Inhalation Rate Exposure Factors of Chinese Residents in Environmental Health Risk Assessment; Research of Environmental Sciences 10; Chinese Research Academy of Environmental Sciences: Beijing, China, 2009. [Google Scholar]
- Zuurbier, M.; Hoek, G.; Hazel, P.V.D.; Brunekreef, B. Minute ventilation of cyclists, car and bus passengers: An experimental study. Environ. Health 2009, 8, 48. [Google Scholar] [CrossRef] [Green Version]
Figure 1.
Map of La Paz and El Alto City in Bolivia with the selected commuting routes highlighted in the blue line. Time spent and distance traversed per mode of travel in each street segment is enumerated for walking, cable car, and microbus rides, respectively.
Figure 1.
Map of La Paz and El Alto City in Bolivia with the selected commuting routes highlighted in the blue line. Time spent and distance traversed per mode of travel in each street segment is enumerated for walking, cable car, and microbus rides, respectively.

Figure 2.
Equivalent black carbon exposure concentrations at STP conditions in different TMEs by travel time in each measurement routes. The top and bottom of the box-plot, respectively, correspond to the 25–75th percentiles, the horizontal bar shows the median, and mean values are represented by circles.

Figure 3.
Normalized eBC RDD in different TMEs along different routes at different sampling times. Box plots with medians are shown in the figure, where the box corresponds to the 25–75th percentiles and circles represent mean values.
Figure 3.
Normalized eBC RDD in different TMEs along different routes at different sampling times. Box plots with medians are shown in the figure, where the box corresponds to the 25–75th percentiles and circles represent mean values.

Figure 4.
Sample time-series for cable car, walking and microbus measurements corresponding to round (going + return) morning and afternoon trips from two cities: (left) La Paz and (right) El Alto. Note the different scales of eBC mass concentration in the two cities. Background color indicates the location of the experiment and the time spent per mode of travel. Missing data on the time series were the omitted data due to waiting times to get inside the cable car and/or microbus ride.

Figure 5.
Median eBC mass concentration in TMEs during all morning peak traffic measurements in Street 1. Shapes correspond to walking (circle), microbus (diamond), and cable car (oblong). Symbols signify a bus stop, major intersection, and merging road (left to right).
Figure 5.
Median eBC mass concentration in TMEs during all morning peak traffic measurements in Street 1. Shapes correspond to walking (circle), microbus (diamond), and cable car (oblong). Symbols signify a bus stop, major intersection, and merging road (left to right).


Table 1.
Characteristics of the selected commuting routes in La Paz and El Alto City, Bolivia.
| Segment ID | Street 1 | Street 2 | Street 3 | Street 4 | Street 5 |
|---|---|---|---|---|---|
| City | LP | LP | EA | EA | EA |
| Street Name | Busch | Arce | 6 de Marzo | Juan Pablo II | 16 de Julio |
| Type | Residential | Commercial | Commercial | Commercial | Residential |
| Lanes | 4 | 4 | 8 | 10 | 4 |
| Travel Mode | W, CC, MB | W, MB | W, MB | MB | W, CC |
| Distance (km) | 2 | 2.5 | 1 | 4 | 2, 4.7 |
LP: La Paz City; EA: El Alto City; W: Walking; CC: Cable Car; MB: Microbus.
Table 2.
Comparison of minute ventilation from different literature for various activity levels.
| Minute Ventilation (10−2 m3 min−1) | |||||
|---|---|---|---|---|---|
| Activity * | Male | Female | |||
| Sitting | 1.39 a | 0.51 b | 1.89 c | 1.04 a | 0.42 b |
| Walking | 2.33 a | 2.92 b | 4.76 c | 1.92 a | 2.29 b |
* Table S2 provides detail on the metabolic equivalent of work or energy expenditure per activity. a Horiuchi et al. [33]. The age ranges of males and females were 19 to 27 and 18 to 30 years old, respectively. Hypobaric and normobaric laboratory-based experiment. b US-EPA [20]. The age range of males and females is 21 to <31 years old. Normobaric laboratory-based experiment.c Milledge [30]. The age range of male Himalayans was 22 to 35 years old. Hypobaric and normobaric field experiment.
Table 3.
Descriptive statistics showing the data availability, arithmetic mean (Mn), standard deviation (SD in parenthesis), arithmetic median (Mdn in square bracket) of exposure concentration (μg m−3) at STP conditions on each of the routes, mode of transport, and sampling period. n = number of data points (1 min average); # trips = number of one-way trips; ratio of median values in reference to cable car ride.
| Mode | Variable | Street 1 | Street 2 | Street 3 | Street 4 | Street 5 |
|---|---|---|---|---|---|---|
| Cable Car | AM | 6.6 (4.2) | - | - | - | 5.1 (2.1) |
| PM | 1.9 (1.3) | - | - | - | 1.6 (1.5) | |
| Overall * | 3.7 (3.1) [2.8] | |||||
| n (eBC, 1 min) | 900 | |||||
| # trips | 62 | |||||
| Kruskal–Wallis test | ** | |||||
| Walk | AM | 15.5 (23.1) | 13.9 (21.8) | 18.9 (39.9) | - | 7.0 (10.7) |
| PM | 5.8 (18.0) | 7.8 (17.4) | 8.3 (11.5) | - | 3.0 (5.1) | |
| Overall * | 10.3 (21.6) [4.9] | |||||
| n (eBC, 1 min) | 4832 | |||||
| # trips | 179 | |||||
| Kruskal–Wallis test | ** | |||||
| W/CC Ratio (dimensionless) | 1.75 | |||||
| Microbus | AM | 11.8 (16.2) | 34.0 (41.3) | 22.4 (25.0) | 40.7 (74.5) | - |
| PM | 12.2 (23.8) | 17.7 (28.8) | 7.3 (12.5) | 15.9 (24.9) | - | |
| Overall * | 24.9 (44) [12.8] | |||||
| n (eBC, 1 min) | 1628 | |||||
| # trips | 104 | |||||
| Kruskal–Wallis test | ** | |||||
| MB/CC Ratio (dimensionless) | 4.6 | |||||
* Statistics over all streets and sampling periods (peak traffic: AM, off-peak traffic: PM). **: p-value < 0.05.
Table 4.
Descriptive statistics showing the arithmetic mean (standard deviation, SD) [median] of potential respiratory deposited dose, using eBC exposure concentration at STP conditions and minute ventilation from Milledge [30] on each of the routes, mode of transport, and sampling time. Conversion of eBC RDD to local conditions can be calculated by multiplying the values by 0.68 [36].
| Potential Respiratory Deposition Dose (μg) | ||||||
|---|---|---|---|---|---|---|
| Mode | Overall * | Street 1 | Street 2 | Street 3 | Street 4 | Street 5 |
| Cable Car | 0.6 (0.5) [0.5] | |||||
| AM | 1.1 (0.7) [0.9] | - | - | - | 0.8 (0.4) [0.8] | |
| PM | 0.3 (0.2) [0.3] | - | - | - | 0.3 (0.2) [0.2] | |
| Walk | 13 (27) [6.3] | |||||
| AM | 20 (29) [11] | 17 (28) [11] | 24 (50) [12] | - | 8.8 (14) [5.9] | |
| PM | 7.4 (23) [3.3] | 10 (21) [4.5] | 11 (15) [5.7] | - | 3.8 (6.4) [2.0] | |
| Microbus | 6.6 (11) [3.3] | |||||
| AM | 3.4 (1.5) [3.5] | 9.0 (11) [5.5] | 6.0 (6.7) [3.6] | 11 (20) [5.7] | - | |
| PM | 3.1 (4.3) [1.5] | 4.7 (7.6) [2.0] | 1.9 (3.3) [1.0] | 4.2 (6.6) [2.4] | - | |
* Statistics over all streets and sampling period (peak traffic: AM, off-peak traffic: PM).
Table 5.
Summary of minute ventilation (MV), eBC exposure and normalized eBC RDD (Norm. eBC RDD) from different studies. The table presents black carbon mass concentration measured by micro-aethalometer as eBC.
Table 5.
Summary of minute ventilation (MV), eBC exposure and normalized eBC RDD (Norm. eBC RDD) from different studies. The table presents black carbon mass concentration measured by micro-aethalometer as eBC.
| Year Published | Location | Elevation (masl) | Minute Ventilation | eBC Exposure | Norm. eBC RDD | |||
|---|---|---|---|---|---|---|---|---|
| (10−2 m3 min−1) | (μg m−3) | (μg min−1) | ||||||
| Walk | Bus | Walk | Bus | Walk | Bus | |||
| 2012 | Barcelona, Spain [8] | 12 | 3.41 | 2.01 | 6.3 | 7.6 | 0.22 | 0.16 |
| 2012 | Mol, Belgium [10] | 16 | 4.92 | 1.61 | 3.6 | 6.6 | 0.1 | 0.08 |
| 2014 | Thessaloniki, Greece [12] | 0 | - | 2.01 | - | 5.5 | - | 0.11 |
| 2015 | Shanghai, China [13] | 4 | 1.05 | 0.78 | 5.59 | 7.3 | 0.06 | 0.13 |
| 2017 | Sacramento, California [11] | 9 | - | 1.18 | - | 0.95 | - | 0.01 |
| 2017 | London, UK [9] | 11 | 2.27 | 1.11 | 2.6 | 5.4 | 0.08 | 0.04 |
| 2018 | Londrina, Brazil [26] | 610 | 2.68 | 1.22 | 4.1 | 10.3 | 0.07 | 0.07 |
| 2019 | Stockholm, Sweden [29] | 0 | 1.9 | 1.3 | 1.7 | 2.7 | 0.03 | 0.03 |
| 2020 | This Study (La Paz; El Alto) | 3600; 4100 | 4.8 | 1.9 | 10.3 | 24.9 | 0.48 | 0.46 |
© 2020 by the authors. Licensee MDPI, Basel, Switzerland. This article is an open access article distributed under the terms and conditions of the Creative Commons Attribution (CC BY) license (http://creativecommons.org/licenses/by/4.0/).
Share and Cite
MDPI and ACS Style
Madueño, L.; Kecorius, S.; Andrade, M.; Wiedensohler, A. Exposure and Respiratory Tract Deposition Dose of Equivalent Black Carbon in High Altitudes. Atmosphere 2020, 11, 598. https://doi.org/10.3390/atmos11060598
AMA Style
Madueño L, Kecorius S, Andrade M, Wiedensohler A. Exposure and Respiratory Tract Deposition Dose of Equivalent Black Carbon in High Altitudes. Atmosphere. 2020; 11(6):598. https://doi.org/10.3390/atmos11060598
Chicago/Turabian StyleMadueño, Leizel, Simonas Kecorius, Marcos Andrade, and Alfred Wiedensohler. 2020. "Exposure and Respiratory Tract Deposition Dose of Equivalent Black Carbon in High Altitudes" Atmosphere 11, no. 6: 598. https://doi.org/10.3390/atmos11060598
Note that from the first issue of 2016, this journal uses article numbers instead of page numbers. See further details here.