Differences and Similarities of Central Asian, African, and Arctic Dust Composition from a Single Particle Perspective

 , , , , ,
Abstract
:1. Introduction
2. Experiments
3. Results and Discussion
4. Conclusions
Author Contributions
Funding
Acknowledgments
Conflicts of Interest
Appendix A
Scheme of Calculating the Feldspar Indices as Chemical Fingerprint for Identifying Particles Consisting Probably of Feldspar
References
- Knippertz, P.; Stuut, J.-B. (Eds.) Mineral Dust: A Key Player in the Earth System; Springer: Berlin/Heidelberg, Germany, 2014; p. 509. [Google Scholar] [CrossRef]
- Textor, C.; Schulz, M.; Guibert, S.; Kinne, S.; Balkanski, Y.; Bauer, S.; Berntsen, T.; Berglen, T.; Boucher, O.; Chin, M.; et al. Analysis and quantification of the diversities of aerosol life cycles within AeroCom. Atmos. Chem. Phys. 2006, 6, 1777–1813. [Google Scholar] [CrossRef] [Green Version]
- Myhre, G.; Shindell, D.; Bréon, F.-M.; Collins, W.; Fuglestvedt, J.; Huang, J.; Koch, D.; Lamarque, J.-F.; Lee, D.; Mendoza, B.; et al. Anthropogenic and Natural Radiative Forcing. In Climate Change 2013: The Physical Science Basis. Contribution of Working Group I to the Fifth Assessment Report of the Intergovernmental Panel on Climate Change; Stocker, T.F., Qin, D., Plattner, G.-K., Tignor, M., Allen, S.K., Boschung, J., Nauels, A., Xia, Y., Bex, V., Midgley, P.M., Eds.; Cambridge University Press: Cambridge, UK; New York, NY, USA, 2013; pp. 659–740. [Google Scholar]
- Boucher, O.; Randall, D.; Artaxo, P.; Bretherton, C.; Feingold, G.; Forster, P.; Kerminen, V.-M.; Kondo, Y.; Liao, H.; Lohmann, U.; et al. Clouds and Aerosols. In Climate Change 2013: The Physical Science Basis. Contribution of Working Group I to the Fifth Assessment Report of the Intergovernmental Panel on Climate Change; Stocker, T.F., Qin, D., Plattner, G.-K., Tignor, M., Allen, S.K., Boschung, J., Nauels, A., Xia, Y., Bex, V., Midgley, P.M., Eds.; Cambridge University Press: Cambridge, UK; New York, NY, USA, 2013; pp. 571–657. [Google Scholar]
- Sokolik, I.N.; Toon, O.B. Incorporation of mineralogical composition into models of the radiative properties of mineral aerosol from UV to IR wavelengths. J. Geophys. Res. 1999, 104, 9423–9444. [Google Scholar] [CrossRef]
- Moosmüller, H.; Engelbrecht, J.P.; Skiba, M.; Frey, G.; Chakrabarty, R.K.; Arnott, W.P. Single scattering albedo of fine mineral dust aerosols controlled by iron concentration. J. Geophys. Res. 2012, 117, D11210. [Google Scholar] [CrossRef] [Green Version]
- Di Biagio, C.; Formenti, P.; Balkanski, Y.; Caponi, L.; Cazaunau, M.; Pangui, E.; Journet, E.; Nowak, S.; Caquineau, S.; Andreae, M.O.; et al. Global scale variability of the mineral dust long-Wave refractive index: A new dataset of in situ measurements for climate modeling and remote sensing. Atmos. Chem. Phys. 2017, 17, 1901–1929. [Google Scholar] [CrossRef] [Green Version]
- Sokolik, I.N.; Toon, O.B. Modeling the radiative characteristics of airborne mineral aerosols at infrared wavelengths. J. Geophys. Res. 1998, 103, 8813–8826. [Google Scholar] [CrossRef]
- Yin, Y.; Chen, L. The effects of heating by transported dust layers on cloud and precipitation: A numerical study. Atmos. Chem. Phys. 2007, 7, 3497–3505. [Google Scholar] [CrossRef] [Green Version]
- Zimmermann, F.; Weinbruch, S.; Schütz, L.; Hofmann, H.; Ebert, M.; Kandler, K.; Worringen, A. Ice nucleation properties of the most abundant mineral dust phases. J. Geophys. Res. 2008, 113, D23204. [Google Scholar] [CrossRef]
- Yakobi-Hancock, J.D.; Ladino, L.A.; Abbatt, J.P.D. Feldspar minerals as efficient deposition ice nuclei. Atmos. Chem. Phys. 2013, 13, 11175–11185. [Google Scholar] [CrossRef] [Green Version]
- Hoose, C.; Möhler, O. Heterogeneous ice nucleation on atmospheric aerosols: A review of results from laboratory experiments. Atmos. Chem. Phys. 2012, 12, 9817–9854. [Google Scholar] [CrossRef] [Green Version]
- Yin, Y.; Levin, Z.; Reisin, T.G.; Tzivion, S. The effects of giant cloud condensation nuclei on the development of precipitation in convective clouds—A numerical study. Atmos. Res. 2000, 53, 91–116. [Google Scholar] [CrossRef]
- Usher, C.R.; Michel, A.E.; Grassian, V.H. Reactions on Mineral Dust. Chem. Rev. 2003, 103, 4883–4940. [Google Scholar] [CrossRef] [PubMed]
- Ullerstam, M.; Vogt, R.; Langer, S.; Ljungström, E. The kinetics and mechanism of SO2 oxidation by O3 on mineral dust. Phys. Chem. Chem. Phys. 2002, 4, 4694–4699. [Google Scholar] [CrossRef]
- Cwiertny, D.M.; Young, M.A.; Grassian, V.H. Chemistry and Photochemistry of Mineral Dust Aerosol. Annu. Rev. Phys. Chem. 2008, 59, 27–51. [Google Scholar] [CrossRef] [PubMed]
- Ndour, M.; Conchon, P.; D′Anna, B.; Ka, O.; George, C. Photochemistry of mineral dust surface as a potential atmospheric renoxification process. Geophys. Res. Lett. 2009, 36, L05816. [Google Scholar] [CrossRef]
- Gatz, D.F.; Barnard, W.R.; Stensland, G.J. The role of alkaline materials in precipitation chemistry: A brief review of the issues. Water Air Soil Pollut. 1986, 30, 245–251. [Google Scholar] [CrossRef]
- Rastogi, N.; Sarin, M.M. Chemistry of aerosols over a semi-Arid region: Evidence for acid neutralization by mineral dust. Geophys. Res. Lett. 2006, 33, L23815. [Google Scholar] [CrossRef]
- Paytan, A.; Mackey, K.R.M.; Chen, Y.; Lima, I.D.; Doney, S.C.; Mahowald, N.; Labiosa, R.; Post, A.F. Toxicity of atmospheric aerosols on marine phytoplankton. Proc. Natl. Acad. Sci. USA 2009, 106, 4601–4605. [Google Scholar] [CrossRef] [Green Version]
- Swap, R.; Garstang, M.; Greco, S.; Talbot, R.; Kållberg, P. Saharan dust in the Amazon Basin. Tellus 1992, 44B, 133–149. [Google Scholar] [CrossRef] [Green Version]
- Eger, A.; Almond, P.C.; Condron, L.M. Phosphorus fertilization by active dust deposition in a super-Humid, temperate environment—Soil phosphorus fractionation and accession processes. Glob. Biogeochem. Cycles 2013, 27, 108–118. [Google Scholar] [CrossRef] [Green Version]
- Mahowald, N.; Jickells, T.D.; Baker, A.R.; Artaxo, P.; Benitez-Nelson, C.R.; Bergametti, G.; Bond, T.C.; Chen, Y.; Cohen, D.D.; Herut, B.; et al. Global distribution of atmospheric phosphorus sources, concentrations and deposition rates, and anthropogenic impacts. Glob. Biogeochem. Cycle 2008, 22, GB4026. [Google Scholar] [CrossRef] [Green Version]
- Okin, G.S.; Baker, A.R.; Tegen, I.; Mahowald, N.M.; Dentener, F.J.; Duce, R.A.; Galloway, J.N.; Hunter, K.; Kanakidou, M.; Kubilay, N.; et al. Impacts of atmospheric nutrient deposition on marine productivity: Roles of nitrogen, phosphorus, and iron. Glob. Biogeochem. Cycle 2011, 25, GB2022. [Google Scholar] [CrossRef]
- Shi, Z.; Krom, M.D.; Jickells, T.D.; Bonneville, S.; Carslaw, K.S.; Mihalopoulos, N.; Baker, A.R.; Benning, L.G. Impacts on iron solubility in the mineral dust by processes in the source region and the atmosphere: A review. Aeolian Res. 2012, 5, 21–42. [Google Scholar] [CrossRef]
- Journet, E.; Desboeufs, K.V.; Caquineau, S.; Colin, J.-L. Mineralogy as a critical factor of dust iron solubility. Geophys. Res. Lett. 2008, 35, L07805. [Google Scholar] [CrossRef] [Green Version]
- Lindqvist, H.; Jokinen, O.; Kandler, K.; Scheuvens, D.; Nousiainen, T. Single scattering by realistic, inhomogeneous mineral dust particles with stereogrammetric shapes. Atmos. Chem. Phys. 2014, 14, 143–157. [Google Scholar] [CrossRef] [Green Version]
- Nousiainen, T.; Kandler, K. Light scattering by atmospheric mineral dust particles. In Light Scattering Reviews 9. Light Scattering and Radiative Transfer; Kokhanovsky, A.A., Ed.; Springer Praxis: Berlin, Germany, 2015; pp. 3–52. [Google Scholar] [CrossRef]
- Ito, A.; Feng, Y. Role of dust alkalinity in acid mobilization of iron. Atmos. Chem. Phys. 2010, 10, 9237–9250. [Google Scholar] [CrossRef] [Green Version]
- Formenti, P.; Schütz, L.; Balkanski, Y.; Desboeufs, K.; Ebert, M.; Kandler, K.; Petzold, A.; Scheuvens, D.; Weinbruch, S.; Zhang, D. Recent progress in understanding physical and chemical properties of mineral dust. Atmos. Chem. Phys. 2011, 11, 8231–8256. [Google Scholar] [CrossRef] [Green Version]
- Scheuvens, D.; Schütz, L.; Kandler, K.; Ebert, M.; Weinbruch, S. Bulk composition of northern African dust and its source sediments-A compilation. Earth-Sci. Rev. 2013, 116, 170–194. [Google Scholar] [CrossRef]
- Perlwitz, J.P.; Pérez García-Pando, C.; Miller, R.L. Predicting the mineral composition of dust aerosols–Part 2: Model evaluation and identification of key processes with observations. Atmos. Chem. Phys. 2015, 15, 11629–11652. [Google Scholar] [CrossRef] [Green Version]
- Waza, A.; Schneiders, K.; May, J.; Rodríguez, S.; Epple, B.; Kandler, K. Field comparison of dry deposition samplers for collection of atmospheric mineral dust: Results from single-Particle characterization. Atmos. Meas. Tech. Discuss. 2019, 2019, 1–40. [Google Scholar] [CrossRef] [Green Version]
- Kandler, K.; Schütz, L.; Deutscher, C.; Hofmann, H.; Jäckel, S.; Knippertz, P.; Lieke, K.; Massling, A.; Schladitz, A.; Weinzierl, B.; et al. Size distribution, mass concentration, chemical and mineralogical composition, and derived optical parameters of the boundary layer aerosol at Tinfou, Morocco, during SAMUM 2006. Tellus 2009, 61B, 32–50. [Google Scholar] [CrossRef] [Green Version]
- Kandler, K.; Deutscher, C.; Schütz, L.; Schneiders, K.; Heuser, J. Microphysics and Chemical Composition of Particulate Dry Deposition Measured in Tinfou, Morocco. PANGAEA 2019. [Google Scholar] [CrossRef]
- Kandler, K.; Benker, N.; Bundke, U.; Cuevas, E.; Ebert, M.; Knippertz, P.; Rodríguez, S.; Schütz, L.; Weinbruch, S. Chemical composition and complex refractive index of Saharan Mineral Dust at Izaña, Tenerife (Spain) derived by electron microscopy. Atmos. Environ. 2007, 41, 8058–8074. [Google Scholar] [CrossRef]
- Kandler, K.; Schneiders, K.; Heuser, J.; Cuevas, E. Microphysics and chemical composition of particulate dry deposition measured in Izaña, Tenerife, Spain. PANGAEA 2019. [Google Scholar] [CrossRef]
- Waza, A.; Schneiders, K.; Kandler, K. Daily dust deposition fluxes at Izana, Tenerife collected by different techniques: Particle size and composition from single particle electron microscopy. PANGAEA 2019. [Google Scholar] [CrossRef]
- Kandler, K.; Lieke, K.; Benker, N.; Emmel, C.; Küpper, M.; Müller-Ebert, D.; Ebert, M.; Scheuvens, D.; Schladitz, A.; Schütz, L.; et al. Electron microscopy of particles collected at Praia, Cape Verde, during the Saharan Mineral dust experiment: Particle chemistry, shape, mixing state and complex refractive index. Tellus 2011, 63B, 475–496. [Google Scholar] [CrossRef]
- Kandler, K.; Deutscher, C.; Lieke, K.; Schütz, L. Microphysics and chemical composition of particulate dry deposition measured in Praia, Santiago, Cape Verde. PANGAEA 2019. [Google Scholar] [CrossRef]
- Kandler, K.; Lieke, K.; Schneiders, K.; Heuser, J. Microphysics and chemical composition of particulate dry deposition measured at Fogo, Cape Verde. PANGAEA 2019. [Google Scholar] [CrossRef]
- Kandler, K.; Schneiders, K.; Ebert, M.; Hartmann, M.; Weinbruch, S.; Prass, M.; Pöhlker, C. Composition and mixing state of atmospheric aerosols determined by electron microscopy: Method development and application to aged Saharan dust deposition in the Caribbean boundary layer. Atmos. Chem. Phys. 2018, 18, 13429–13455. [Google Scholar] [CrossRef] [Green Version]
- Kandler, K.; Althausen, D.; Hofer, J.; Abdullaev, S.F.; Makhmudov, A.N. Microphysics and chemical composition of particulate dry deposition measured at Dushanbe, Tajikistan. PANGAEA 2019. [Google Scholar] [CrossRef]
- Kandler, K.; Schneiders, K.; Heuser, J. Microphysics and chemical composition of particulate dry deposition measured in Longyearbyen, Svalbard, Norway. PANGAEA 2019. [Google Scholar] [CrossRef]
- Léon, J.-F.; Legrand, M. Mineral dust sources in the surroundings of the north Indian Ocean. Geophys. Res. Lett. 2003, 30. [Google Scholar] [CrossRef]
- Rezazadeh, M.; Irannejad, P.; Shao, Y. Climatology of the Middle East dust events. Aeolian Res. 2013, 10, 103–109. [Google Scholar] [CrossRef]
- Ginoux, P.; Prospero, J.M.; Gill, T.E.; Hsu, N.C.; Zhao, M. Global-Scale attribution of anthropogenic and natural dust sources and their emission rates based on MODIS Deep Blue aerosol products. Rev. Geophys. 2012, 50, RG3005. [Google Scholar] [CrossRef]
- Moridnejad, A.; Karimi, N.; Ariya, P.A. A new inventory for middle east dust source points. Environ. Monit. Assess. 2015, 187, 582. [Google Scholar] [CrossRef]
- Engelbrecht, J.P.; Derbyshire, E. Airborne Mineral Dust. Elements 2010, 6, 241–246. [Google Scholar] [CrossRef]
- Arnalds, O.; Dagsson-Waldhauserova, P.; Olafsson, H. The Icelandic volcanic aeolian environment: Processes and impacts—A review. Aeolian Res. 2016, 20, 176–195. [Google Scholar] [CrossRef] [Green Version]
- Di Biagio, C.; Formenti, P.; Balkanski, Y.; Caponi, L.; Cazaunau, M.; Pangui, E.; Journet, E.; Nowak, S.; Andreae, M.O.; Kandler, K.; et al. Complex refractive indices and single scattering albedo of global dust aerosols in the shortwave spectrum and relationship to iron content and size. Atmos. Chem. Phys. Discuss. 2019, 2019, 1–42. [Google Scholar] [CrossRef] [Green Version]
- Ebert, M.; Weinbruch, S.; Rausch, A.; Gorzawski, G.; Helas, G.; Hoffmann, P.; Wex, H. Complex refractive index of aerosols during LACE 98 as derived from the analysis of individual particles. J. Geophys. Res. 2002, 107, 8121. [Google Scholar] [CrossRef]
- Engelbrecht, J.P.; Moosmüller, H.; Pincock, S.; Jayanty, R.K.M.; Lersch, T.; Casuccio, G. Technical note: Mineralogical, chemical, morphological, and optical interrelationships of mineral dust re-Suspensions. Atmos. Chem. Phys. 2016, 16, 10809–10830. [Google Scholar] [CrossRef] [Green Version]
- Chiapello, I.; Bergametti, G.; Gomes, L.; Chatenet, B.; Dulac, F.; Pimenta, J.; Santos Suares, E. An additional low layer transport of Sahelian and Saharan dust over the North-Eastern Tropical Atlantic. Geophys. Res. Lett. 1995, 22, 3191–3194. [Google Scholar] [CrossRef] [Green Version]
- Van der Does, M.; Korte, L.F.; Munday, C.I.; Brummer, G.J.A.; Stuut, J.B.W. Particle size traces modern Saharan dust transport and deposition across the equatorial North Atlantic. Atmos. Chem. Phys. 2016, 16, 13697–13710. [Google Scholar] [CrossRef] [Green Version]
- Karyampudi, V.M.; Palm, S.P.; Reagen, J.A.; Fang, H.; Grant, W.B.; Hoff, R.M.; Moulin, C.; Pierce, H.F.; Torres, O.; Browell, E.; et al. Validation of the Saharan Dust Plume Conceptual Model Using Lidar, Meteosat, and ECMWF Data. Bull. Am. Met. Soc. 1999, 80, 1045–1075. [Google Scholar] [CrossRef] [Green Version]
- Jackson, M.L.; Tyler, S.A.; Willis, A.L.; Bourbeau, G.A.; Pennington, R.P. Weathering Sequence of Clay-Size Minerals in Soils and Sediments. I. Fundamental Generalizations. J. Phys. Colloid Chem. 1948, 52, 1237–1260. [Google Scholar] [CrossRef]
- Weinzierl, B.; Ansmann, A.; Prospero, J.M.; Althausen, D.; Benker, N.; Chouza, F.; Dollner, M.; Farrell, D.; Fomba, W.K.; Freudenthaler, V.; et al. The Saharan Aerosol Long-Range Transport and Aerosol–Cloud-Interaction Experiment: Overview and Selected Highlights. Bull. Am. Meteorol. Soc. 2017, 98, 1427–1451. [Google Scholar] [CrossRef] [Green Version]
- Middleton, N.J.; Goudie, A.S. Saharan dust: Sources and trajectories. Trans. Inst. Br. Geogr. 2001, 26, 165–181. [Google Scholar] [CrossRef]
- Prospero, J.M.; Lamb, P.J. African Droughts and Dust Transport to the Caribbean: Climate Change Implications. Science 2003, 302, 1024–1027. [Google Scholar] [CrossRef]
- Schütz, L. Long range transport of desert dust with special emphasis on the Sahara. Ann. N.Y. Acad. Sci. 1980, 338, 515–532. [Google Scholar] [CrossRef]
- Scheuvens, D.; Kandler, K.; Küpper, M.; Lieke, K.; Zorn, S.; Ebert, M.; Schütz, L.; Weinbruch, S. Individual-Particle analysis of airborne dust samples collected over Morocco in 2006 during SAMUM 1. Tellus 2011, 63B, 512–530. [Google Scholar] [CrossRef] [Green Version]
- Jeong, G.Y.; Achterberg, E.P. Chemistry and mineralogy of clay minerals in Asian and Saharan dusts and the implications for iron supply to the oceans. Atmos. Chem. Phys. 2014, 14, 12415–12428. [Google Scholar] [CrossRef] [Green Version]
- Deboudt, K.; Gloter, A.; Mussi, A.; Flament, P. Red-ox speciation and mixing state of iron in individual African dust particles. J. Geophys. Res. 2012, 117, D12307. [Google Scholar] [CrossRef] [Green Version]
- Ivlev, L.S.; Popova, S.I. The complex refractive indices of substances in the atmospheric-Aerosol dispersed phase. Izv. Atmos. Oceanic Phys. 1973, 9, 587–591. [Google Scholar]
- Atkinson, J.D.; Murray, B.J.; Woodhouse, M.T.; Whale, T.F.; Baustian, K.J.; Carslaw, K.S.; Dobbie, S.; O’Sullivan, D.; Malkin, T.L. The importance of feldspar for ice nucleation by mineral dust in mixed-Phase clouds. Nature 2013, 498, 355–358. [Google Scholar] [CrossRef] [PubMed]
- Harrison, A.D.; Whale, T.F.; Carpenter, M.A.; Holden, M.A.; Neve, L.; O′Sullivan, D.; Vergara Temprado, J.; Murray, B.J. Not all feldspars are equal: A survey of ice nucleating properties across the feldspar group of minerals. Atmos. Chem. Phys. 2016, 16, 10927–10940. [Google Scholar] [CrossRef] [Green Version]
- Shi, Z.; Krom, M.D.; Bonneville, S.; Baker, A.R.; Jickells, T.D.; Benning, L.G. Formation of Iron Nanoparticles and Increase in Iron Reactivity in Mineral Dust during Simulated Cloud Processing. Environ. Sci. Technol. 2009, 43, 6592–6596. [Google Scholar] [CrossRef] [PubMed]
- Müller, K.; Lehmann, S.; van Pinxteren, D.; Gnauk, T.; Niedermeier, N.; Wiedensohler, A.; Herrmann, H. Particle characterization at the Cape Verde atmospheric observatory during the 2007 RHaMBLe intensive. Atmos. Chem. Phys. 2010, 10, 2709–2721. [Google Scholar] [CrossRef] [Green Version]
- Hamdi-Aissa, B.; Valles, V.; Aventurier, A.; Ribolzi, O. Soils and Brine Geochemistry and Mineralogy of Hyperarid Desert Playa, Ouargla Basin, Algerian Sahara. Arid Land Res. Manag. 2004, 18, 103–126. [Google Scholar] [CrossRef]
- Wu, F.; Zhang, D.; Cao, J.; Xu, H.; An, Z. Soil-Derived sulfate in atmospheric dust particles at Taklimakan desert. Geophys. Res. Lett. 2012, 39, L24803. [Google Scholar] [CrossRef] [Green Version]
- Stegmann, P.G.; Yang, P. A regional, size-Dependent, and causal effective medium model for Asian and Saharan mineral dust refractive index spectra. J. Aerosol Sci. 2017, 114, 327–341. [Google Scholar] [CrossRef]


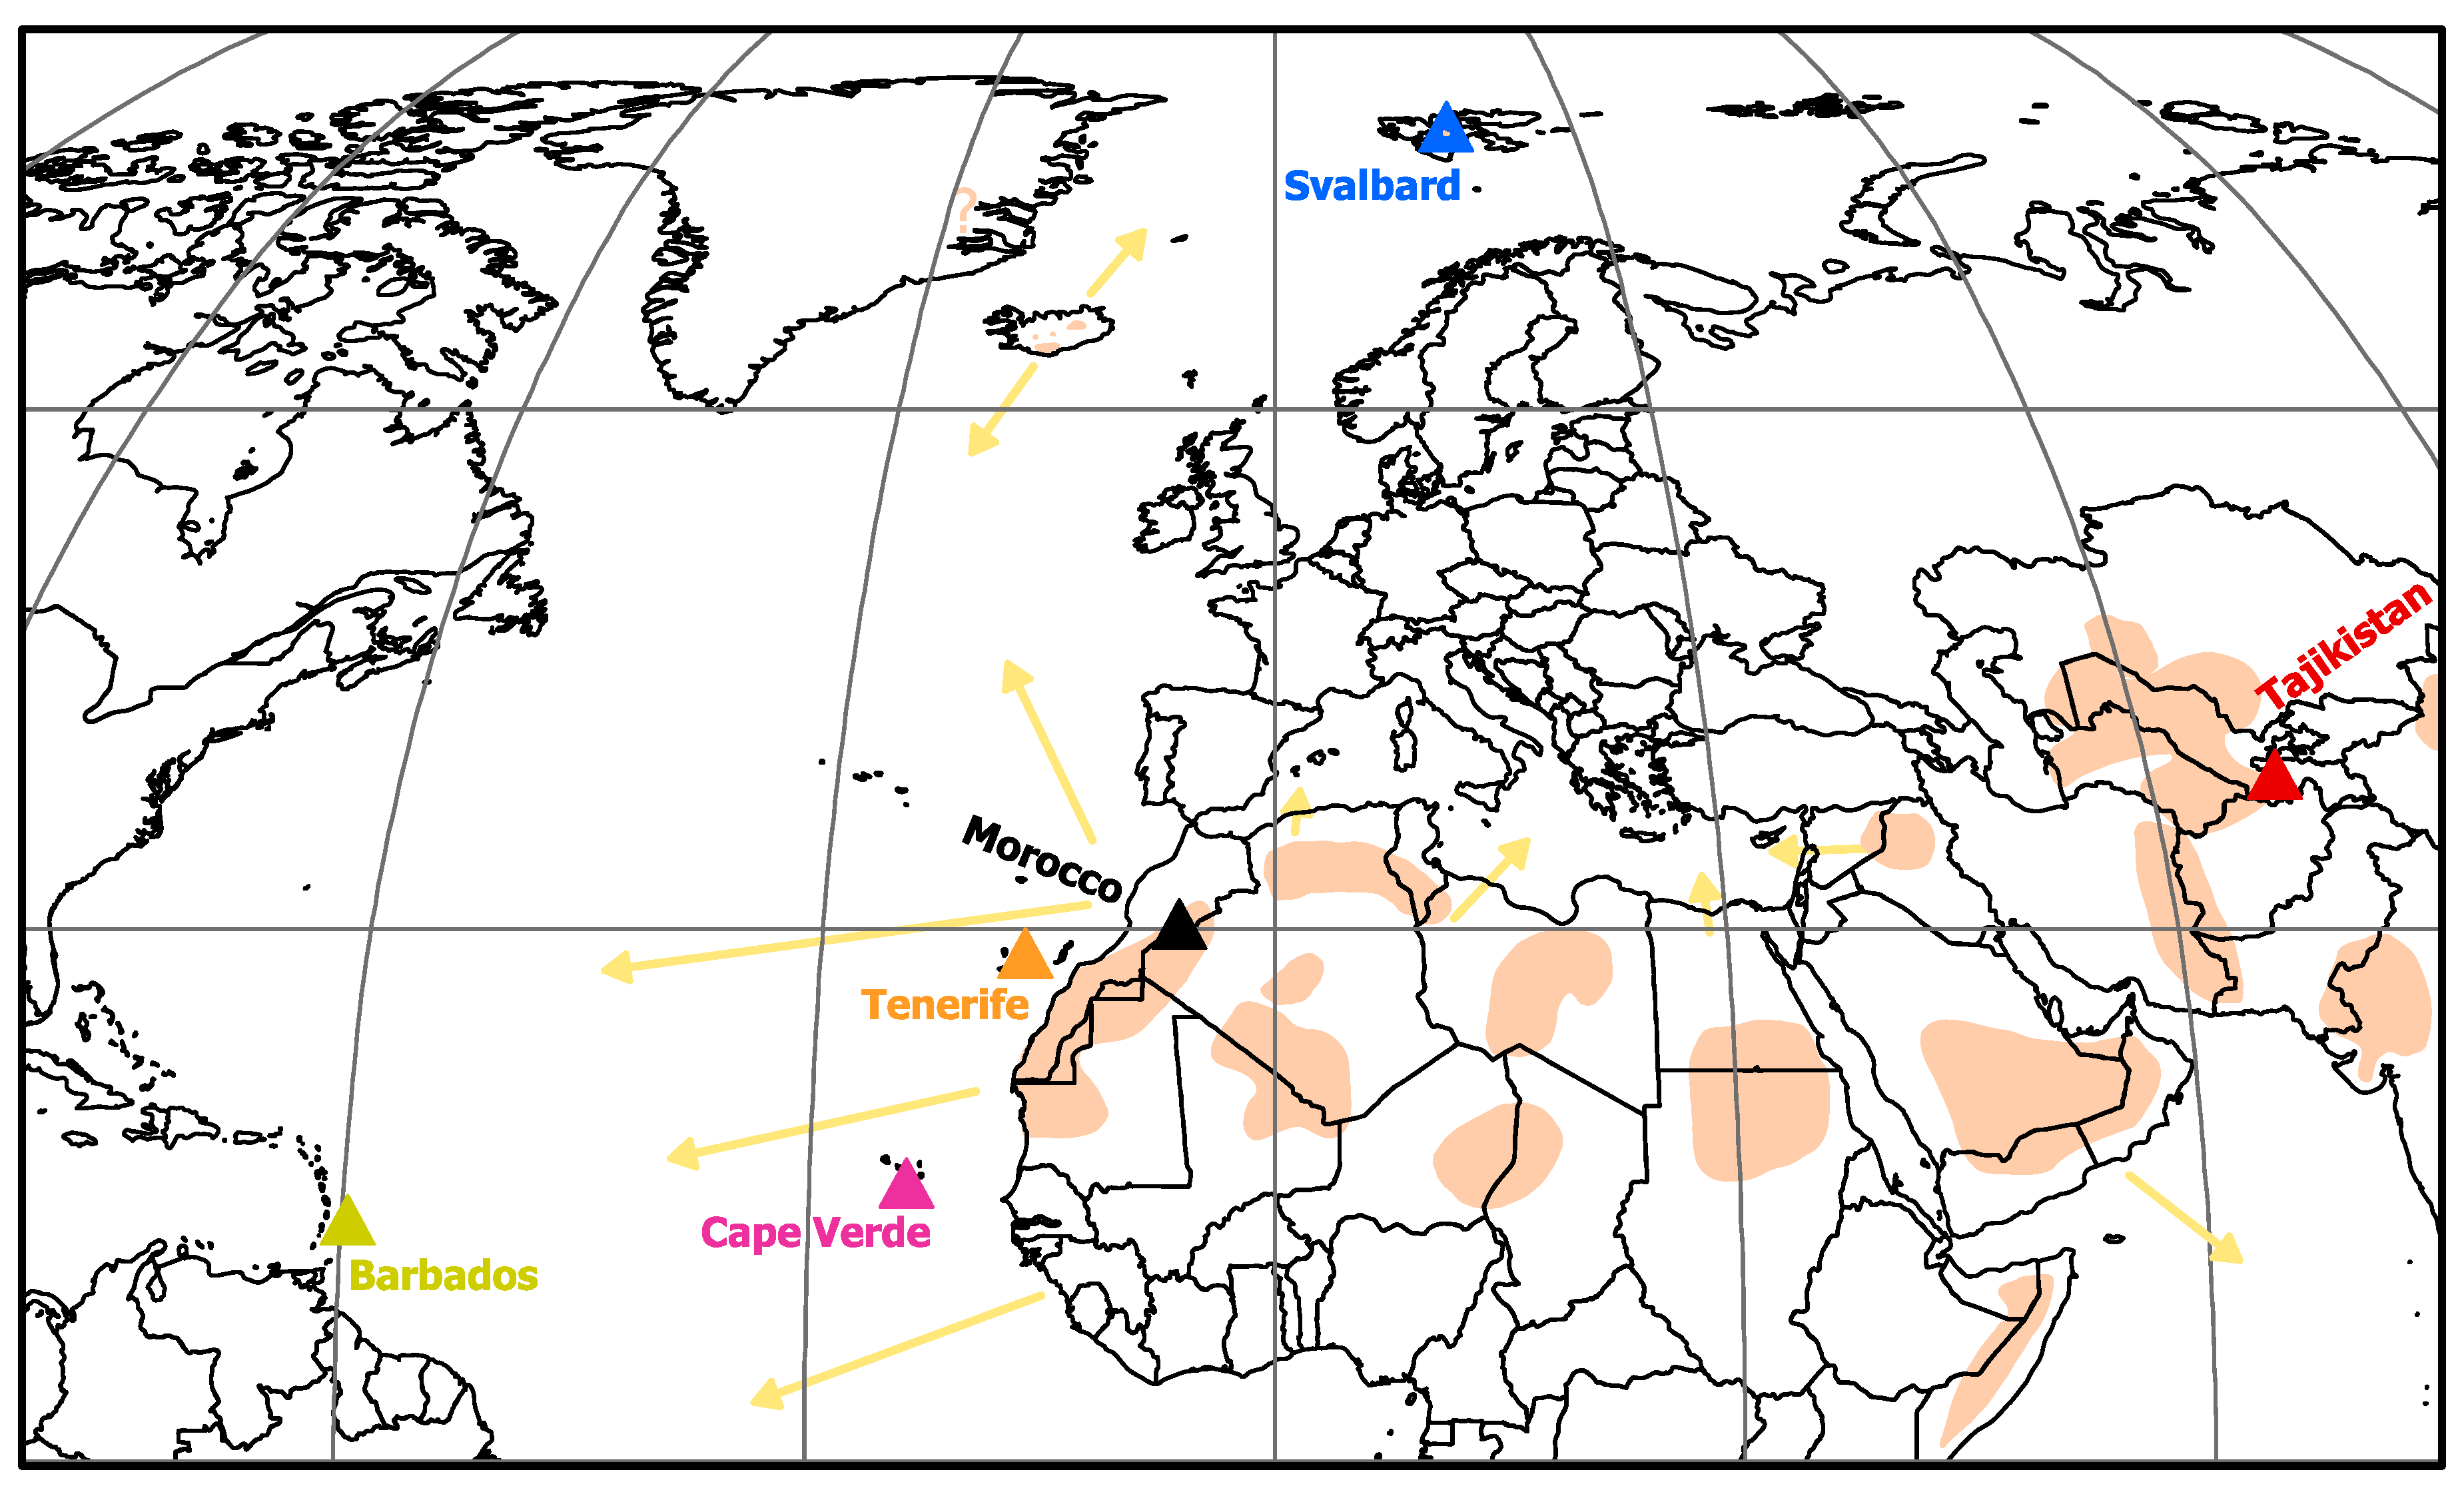
| Location | Time Period | Geogr. Coordinates | Alt. | Sampler Type | Samples | Particles | Reference(s) |
|---|---|---|---|---|---|---|---|
| Tinfou, Morocco | 12 May–6 June 2006 | 30.2378° N, 5.6079° W | 680 | Sigma-2 | 13 | 35,200 | [34,35] |
| Izaña, Tenerife, Spain 1 | 8 July–8 Aug 2005 | 28.3094° N, 16.4992° W | 2390 | Sigma-2 | 9 | 11,800 | [36,37] |
| Izaña, Tenerife, Spain 2 | 16 July–23 Aug 2017 | 28.3086° N, 16.4995° W | 2370 | Flat plate | 14 | 37,900 | [33,38] |
| Santiago, Cape Verde | 13 Jan–10 Feb 2008 | 14.9475° N, 23.4845° W | 100 | Sigma-2 | 15 | 24,600 | [39,40] |
| Fogo, Cape Verde | 28 May–8 Jun 2008 | 14.9759° N, 24.3379° W | 1630 | Sigma-2 | 5 | 23,100 | this study [41] |
| Ragged Point, Barbados 1 | 14 Jun–15 Jul 2013 | 13.1651° N, 59.4321° W | 50 | Flat plate | 22 | 22,900 | [42] |
| Ragged Point, Barbados 2 | 6–27 Aug 2016 | 13.1651° N, 59.4321° W | 50 | Flat plate | 26 | 26,200 | [42] |
| Dushanbe, Tajikistan | 28 Aug–7 Sep 2016 | 38.5594° N, 68.8561° E | 870 | Flat plate | 16 | 18,100 | this study [43] |
| Longyearbyen, Svalbard | 1–24 Sep 2017 | 78.2227° N, 15.6510° E | 30 | Flat plate | 20 | 16,700 | this study [44] |
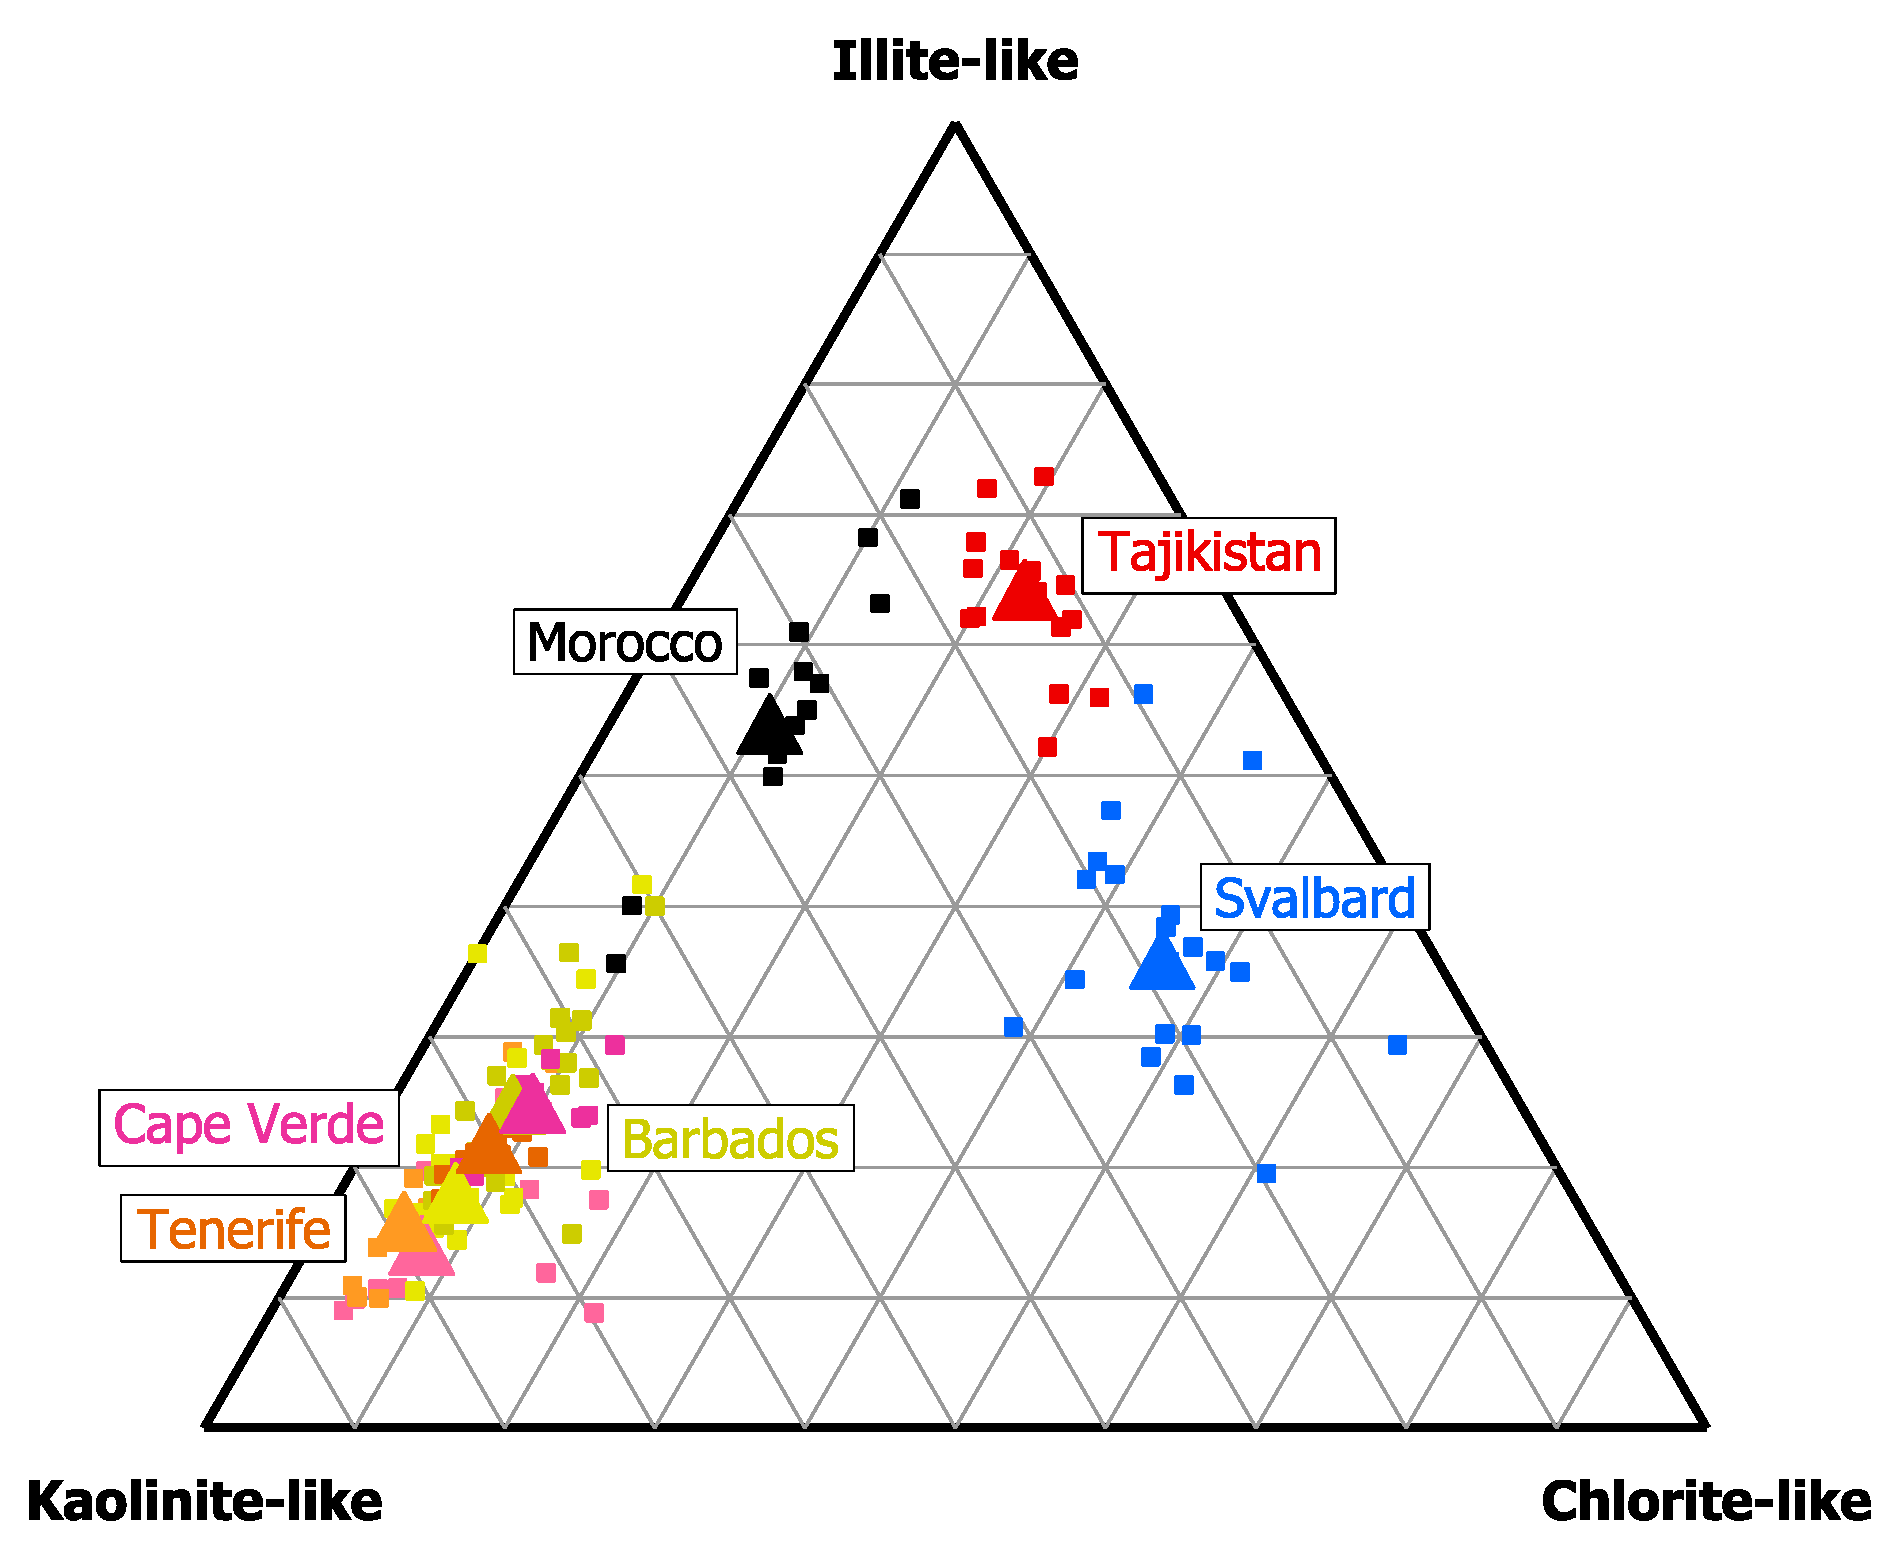
| Class Name | Conditions for Being Positively Classified |
|---|---|
| Kaolinite-like | ; ; ; ; ; ; |
| Illite-like | ; ;; ; ; ; |
| Chlorite-like | ; ; ; |
© 2020 by the authors. Licensee MDPI, Basel, Switzerland. This article is an open access article distributed under the terms and conditions of the Creative Commons Attribution (CC BY) license (http://creativecommons.org/licenses/by/4.0/).
Share and Cite
Kandler, K.; Schneiders, K.; Heuser, J.; Waza, A.; Aryasree, S.; Althausen, D.; Hofer, J.; Abdullaev, S.F.; Makhmudov, A.N. Differences and Similarities of Central Asian, African, and Arctic Dust Composition from a Single Particle Perspective. Atmosphere 2020, 11, 269. https://doi.org/10.3390/atmos11030269
Kandler K, Schneiders K, Heuser J, Waza A, Aryasree S, Althausen D, Hofer J, Abdullaev SF, Makhmudov AN. Differences and Similarities of Central Asian, African, and Arctic Dust Composition from a Single Particle Perspective. Atmosphere. 2020; 11(3):269. https://doi.org/10.3390/atmos11030269
Chicago/Turabian StyleKandler, Konrad, Kilian Schneiders, Johannes Heuser, Andebo Waza, Sudharaj Aryasree, Dietrich Althausen, Julian Hofer, Sabur F. Abdullaev, and Abduvosit N. Makhmudov. 2020. "Differences and Similarities of Central Asian, African, and Arctic Dust Composition from a Single Particle Perspective" Atmosphere 11, no. 3: 269. https://doi.org/10.3390/atmos11030269