Nanofiber-Based Materials for Persistent Organic Pollutants in Water Remediation by Adsorption


Institute for Frontier Materials, Deakin University, Geelong VIC 3220, Australia
*
Author to whom correspondence should be addressed.
Appl. Sci. 2018, 8(2), 166; https://doi.org/10.3390/app8020166
Submission received: 22 December 2017
/
Revised: 17 January 2018
/
Accepted: 17 January 2018
/
Published: 24 January 2018
(This article belongs to the Special Issue Nanotechnology in Wastewater Treatment Technology)
Abstract
:Fresh water is one of the most precious resources for our society. As a cause of oxygen depletion, organic pollutants released into water streams from industrial discharges, fertilizers, pesticides, detergents or consumed medicines can raise toxicological concerns due to their long-range transportability, bio-accumulation and degradation into carcinogenic compounds. The Stockholm Convention has named 21 persistent organic pollutants (POP) so far. As opposed to other separation techniques, adsorption, typically performed with activated carbons, offers opportunities to combine low operation costs with high performance as well as fast kinetics of capture if custom-designed with the right choice of adsorbent structure and surface chemistry. Nanofibers possess a higher surface to volume ratio compared to commercial macro-adsorbents, and a higher stability in water than other adsorptive nanostructures, such as loose nanoparticles. This paper highlights the potential of nanofibers in organic pollutant adsorption and thus provides an up-to-date overview of their employment for the treatment of wastewater contaminated by disinfectants and pesticides, which is benchmarked with other reported adsorptive structures. The discussion further investigates the impact of adsorbent pore geometry and surface chemistry on the resulting adsorption performance against specific organic molecules. Finally, insight into the physicochemical properties required for an adsorbent against a targeted pollutant is provided.
1. Introduction
Organic water pollution from synthesized chemical pesticides has been increasing over the past 50 years [1]. As a counter-measure, 21 non-polar organic molecules have been classified as persistent organic pollutants (POPs) by the Stockholm Convention (2001, 2017), to be banned or restricted globally [2]. Organochlorines (OCs) account for a large group of POPs, including aldrin or DDT pesticides, but also industrial chemicals such as the family of polychlorinated biphenyls (PCBs), as well as byproducts [1]. The list of POPs also includes several organophosphorus (OPs) pesticides, and among recently added compounds, flame retardants and polyaromatic hydrocarbons (PAHs) [1,2].
The release of POPs is associated with major toxicity concerns for both the environment and human health [3,4]. Their partial degradability affects the chemical oxygen demand (COD) of streams, causing oxygen depletion by consuming oxygen at a greater rate than its replenishment [4]. For some POPs, such as Heptachlor, it is the compound formed after reaction in water, Heptachlor epoxide, that causes threat to human life [5]. The persistency of POPs in the environment can be measured by their half-life duration (DT50). For instance, organochlorine DDT pesticide has a DT50 that, depending on the environment, ranges from 2 to 15 years [6]. The presence of POPs in the environment also affects human health, through the ability of POPs to bio-accumulate in organisms and bio-magnify throughout the food chain [3]. Exposure of humans to POP can eventually occur through drinking water, via the leaching of pollutants from treated soil into aquifers. Detected levels of POPs in human blood were shown to lead, in some scenarios, to reproductive disorders, immune system alteration, and/or increased risk of cancer [3].
Long-range transportability is another concern associated with POPs [7,8,9]. As most POPs are semi-volatile compounds, they are able to cycle among air, water and soil [8]. Characteristics such as subcooled liquid vapour pressure and octanol-water (log Kow) partition coefficients, the latter defining the molecule hydrophilicity as well as temperature of condensation, enable the determination of the mobility of a persistent pollutant through a transportation cycle in the atmosphere, ocean or soil [7,8]. Warm temperatures, as experienced in tropical regions, enable the evaporation of POPs, while colder temperatures, at higher latitudes, enable the deposition of POPs from the atmosphere onto the ocean or continent [7]. POPs emitted in tropical to temperate regions may therefore be transported to one of the Earth poles, via successive evaporation–deposition cycles, also called the grasshopper phenomenon, determined by seasonal temperature changes at temperate latitudes. POPs emitted at high latitudes, however, are less subject to mobility due to lower temperatures [7]. Polar regions therefore act as an environmental sink for POP compounds [7,9]. However, as global warming is strongly affecting the polar climate, the possibility of a reverse in the deposition cycle of POP raises concerns [9].
To limit the environmental sink effect, local removal techniques must be put in place to remove pesticides from water. Advanced oxidation processes (AOP), including ozonation, enzyme digestion or catalysis, have been sought after to combine efficiency and fast kinetics [10,11,12]. These processes offer to date the most efficient alternative to conventional treatments, in terms of reduction of the total organic carbon (TOC) count in contaminated effluents. Several reviews cover the organic pollutant water decontamination via AOPs and provide a performance benchmark for this study [11,12]. The main roadblock to the implementation of AOPs is the increase of the effluent toxicity after treatment. For instance, the catalytic degradation of the triazine molecule Atrazine may release carcinogen amine groups in water [13]. Adsorption has been considered an alternative method of capture and removal of pesticide molecules from wastewaters [4]. Even though lower decreases in water TOC have been obtained by adsorption compared to AOPs, the effluent toxicity after treatment is still undetermined. However, there is a need for a specific adsorbent material able to combine over 95% removal efficiency, fast kinetics, recyclability and low fabrication cost.
Among common materials, activated carbons have been widely used against organic compounds and showed high adsorption capacities for a range of initial contamination varying between 15 µg/L and 80 mg/L as reported in the literature [4,14,15]. However, alternatives are being sought to yield more cost-effective adsorbents. Biomass as an inexpensive but abundant material source for biosorption has been considered, yet the biosorbent non-regenerability and pollutant disposal is of a concern [4,16,17,18]. Over the past decade, nanomaterials have been tested for organic adsorption [19,20,21]. Their high surface to volume ratio reduces the required adsorbent dose and favours surface reactivity and therefore adsorption kinetics [19]. Nanofiber webs have been designed as a novel adsorptive material solution for water remediation, to benefit from the increased surface reactivity, with an easy handling and water-stable behaviour, as opposed to free nanotubes and nanoparticles, respectively [22]. Furthermore, electrospinning as a nanofiber web fabrication route ensures a high fiber diameter homogeneity and offers versatile web morphologies design [23].
This paper reviews the employment of nanofibers in the adsorption of selected organic pollutants. The first section is dedicated to common pesticides of moderate hydrophobicity, for water contamination levels over 1 mg/L. Selected pesticides are Alachlor, Atrazine, Chlorpyrifos and Diazinon. The second section concerns the adsorption of disinfectants such as phenol and selected chlorophenols, namely 2- and penta-. As phenol adsorption has been widely reported in the literature, phenol has been included in this study to benchmark the performance of nanofibers in the adsorption of phenolic compounds. Furthermore, this inclusion allows for the investigation of the impact of the molecule chlorine number onto the adsorbent uptake. The last section deals with persistent pollutants, highly hydrophobic, including most of the POPs selected for this study. The pesticides reviewed in this section are aliphatic alicyclic organochlorines Aldrin, Dieldrin, Endrin, Chlordane, Heptachlor, Heptachlor epoxide, and Toxaphene 8. Other types of POP selected include polychlorinated biphenyls (PCBs) 2-, 3-, 4-, 5-, 6-, 28-, 77-. Polyaromatic hydrocarbon (PAH) Phenantrene was also considered in this section for performance comparison.
Compared to other pesticide removal by adsorption reviews, the present paper gives exhaustive and up-to-date insight into the performance of nanofibers for the removal of several contaminants of different classes [4,24,25]. This study aims to help with the design of an efficient adsorbent for a targeted organic pollutant. Therefore, the influence of adsorbent physicochemical properties and adsorption conditions on the resulting performance was investigated in order to determine a specific range of adsorbent surface properties and advantageous test conditions to favour pollutant capture. Finally, a comparison of the adsorptive performance pondered by the proportion range order between adsorbent dose and initial contaminant concentration was made here to help with the design of a cost-efficient material solution.
Adsorbents’ surface properties, performance and test conditions are reported in Section 2.3, Section 3.3 and Section 4.3 for the adsorption of moderately hydrophobic pollutants, phenolic compounds and highly hydrophobic pollutants, respectively. When either adsorption capacity or removal efficiency was not reported, it has been calculated from the reported performance result. When room temperature was reported, a temperature of 22 °C was chosen. Langmuir and Freundlich were considered among the isotherm models. Concerning kinetic models, pseudo first- and second-order, intra-particle diffusion and linear models were here reported.
2. Moderately Hydrophobic Pesticides
In this section, the adsorptive performance of nanofiber-based adsorbents is reviewed and benchmarked against other reported adsorbents for Alachlor, Atrazine, Chlorpyrifos and Diazinon pesticides. After presenting the adsorbate molecules’ characteristics, an analysis of the adsorbent structure-performance relationships will be given. First, the influence of adsorbent specific and contact surface area as well as pore volume will be reviewed. Then, the range order between adsorbent dose, initial concentration and obtained adsorption capacity will be highlighted.
2.1. Adsorbate Properties
Table 1 presents the molecular characteristics of the four pesticides considered in this section, namely Alachlor, Atrazine, Chlorpyrifos and Diazinon. Both Alachlor and Atrazine are organochlorine pesticides (OCPs). Alachlor is composed of an aniline aromatic structure, bound to an oxoacid and a chloroacetamide group via a central nitrogen group. Atrazine possesses a chlorotriazine aromatic structure, bound to two dimethylamine groups on the aromatic carbon atoms. Although Chlorpyrifos also possesses chlorine terminal groups, it is commonly classified with Diazinon as organophosphorus pesticides (OPPs). Chlorpyrifos aromatic structure is made of a ring of trichloropyridine, with attachment of the three chlorine groups on three of the ring’s carbon atoms. To form Chlorpyrifos, the chloropyridine is bound to an organophosphate structure, composed of a modified phosphate group, which is double-bonded to a sulphur atom, also called phosphorothioate. Diazinon shares the same sulphur–phosphate structure, which is here bound to a pyrimidine or 1,3-diazine aromatic ring [26].
The reported molecular weights range from 216 g/mol for Atrazine up to 351 g/mol for Chlorpyrifos, with each of the pesticides carrying a different molecular configuration. In terms of molecular size, Atrazine followed by Alachlor are smaller than organophosphates Chlorpyrifos and Diazinon, which is of interest for the study of the molecule diffusion in an adsorbent material with reported pore features.
Hydrogen bond acceptor and donor counts are reported here to discuss the influence of chemisorption by H-bonding on the pesticide uptake by nanofiber adsorbents. Both Alachlor and Atrazine have an H-bond acceptor count of 2 due to their longer carbon chains. Atrazine, Chlorpyrifos and Diazinon have an H-bond donor count of 5, 5 and 6, respectively. H-bond donor groups are formed by amide and nitrogen groups in the case of Atrazine, and by nitrogen groups, as well as sulphur and oxygen atoms from the organophosphate backbone, as in the case of Chlorpyrifos and Diazinon. As each of the adsorbate molecules possesses an aromatic structure, adsorption by electron interaction through π–π stacking between the adsorbent surface unsaturated bonds and the molecule aromatic ring is believed to play a significant role in the pesticide uptake here [26,27].
Finally, the octanol-water partition coefficients are reported to point out the less hydrophobic character of the selected pesticides compared to persistent-classified pesticides, such as the here reviewed aliphatic organochlorines. Solubility in water at ambient temperature was also reported to give an insight into the maximum levels of water contamination achievable by these pesticides.
2.2. Nanofibers for Pesticide Adsorption
2.2.1. Impact of Adsorbent Specific and Contact Surface Area
Figure 1 shows the impact of the adsorbent specific surface area (BET) on the adsorption removal. The removal percentage was overall found to decrease with increasing adsorbent specific surface area for both Alachlor and Diazinon, yet was found to increase in the case of Atrazine removal.
Indeed, for Alachlor, as shown in Figure 1A, the maximum reported removal performance reached 80% for acid-activated beideillite clay particulates grafted with organosilanes for a BET of 221 m2/g (Table 2, N5). In comparison, the largest specific surface area of 608 m2/g of an activated charcoal adsorbent removed 40% of Alachlor (Table 2, N4). Nanofiber adsorbents made of alumina with surface-grafted organosilanes showed the second best performance with 58% removal for a specific surface area of 252 m2/g (Table 2, N1). The higher performance of organosilane-grafted clays and alumina nanofibers suggests that there is competition between adsorption via hydrophobic interactions and via electrostatic interactions as the most efficient mechanism for Alachlor uptake [28,29]. Indeed, organosilane grafting provides the adsorbent with a hydrophobic surface more amenable to pesticides [28]. Each adsorbent reported in this study for the adsorption of Alachlor differs in both structure and composition. Figure 1B shows the different compositions of Alachlor adsorbents, revealing here a lower performance for carbon-based adsorbents (Table 2, N3) followed by biomass adsorbents made of kernels and leaves (Table 2, N6–N15). Several factors may explain the lower performance of activated charcoal, such as unsuitable surface pore characteristics not reported in the literature. A different structure than crystalline honeycomb carbon adsorbent may also impact the arrangement and coordination of adsorbate molecules on the charcoal surface, virtually decreasing the proportion in active sites compared to nitrogen adsorption, as well as discourage adsorption by electron interaction due to the absence of unsaturated bonds. Biomass adsorbents had a specific surface area between 275 and 394 m2/g, with vegetal-based adsorbents of a lower BET than kernel or stone-based adsorbents (Table 2, N13, N7). The lower BET and fibrous aspect of leaf material, allowing for a better diffusion of the pesticide, may contribute to the increased performance compared to kernel particulates.
A similar decreasing trend can be observed in the case of Diazinon removal in Figure 1C, although not enough data has been reported in the literature to accurately analyse the impact of adsorbent specific surface area on removal capacity. Adsorbents with lower specific surface areas such as 208 m2/g for iron oxide and silica nanocrystals were able to completely remove Diazinon, for an initial contamination of 400 µg/L and adsorbent dose of 6 g/L (Table 3, N4). The differences in levels of initial contamination and dose of adsorbents may impact the adsorptive performance comparison. Nanofiber adsorbents such as activated carbon nanofibers with manganese and alumina nanoparticles of a respective BET of 550 m2/g and 600 m2/g showed average removal around 55% (Table 3, N1, N2). The highest BET of the reported materials at 1112 m2/g for activated carbons led to the lowest adsorption performance amongst the series at 16.3% (Table 3, N6). Most of the adsorbent reported fitted the Langmuir isotherm model and the pseudo-second-order kinetic model well, which suggests a homogenous monolayer surface adsorption process that is rate-limited by chemisorption, and hence surface saturation [30]. Figure 1D presents different adsorbent compositions, showing the preferential adsorption of Diazinon on ceramic surfaces over ceramic–carbonaceous adsorbents.
Concerning Atrazine removal, as represented in Figure 1E, the lower BET value reported at 110 m2/g for carbon nanofibers reached the least adsorption performance with a removal of 10.2% (Table 4, N1). Carbon nanotube–nanofiber composites and carbon nanotubes, however, reached a removal of 90.4% and 35% for a specific surface area of 310 m2/g and 300 m2/g, respectively (Table 4, N6, N7). Higher specific surface areas of 2235 m2/g for activated carbons led to complete contaminant removal (Table 4, N13). As carbon-based materials are among the highest-performing adsorbents, this suggests that π–π electron interactions and electrostatic interactions are preferential adsorption mechanisms for the removal of Atrazine. Figure 1F shows the Atrazine adsorbents’ composition and other carbon-based structures; biomass absorbance has been reported in this form or extracted from shells, kernels and leaves. For a similar range of specific surface area, kernel and shell adsorbents here showed better performance compared to their leaf counterparts, with over 99% and 89% highest removal percentages, respectively (Table 4, N20, N25). This difference in performance suggests that the adsorbent structure can significantly influence the Atrazine adsorption. Furthermore, all biomass adsorbents fitted the Freundlich isotherm and pseudo-first-order kinetic models well (R2 > 0.85), suggesting a heterogeneously distributed adsorption on the biosorbent surface and physisorption as the reaction rate-limiting step [30]. This may suggest that Atrazine could not diffuse as much nitrogen into the adsorbent surface pores or between fibers’ interstitial spaces.
The different trends of performance increase for Alachlor and Diazinon and decrease for Atrazine with increasing specific surface areas may be explained by the molecular geometry of the adsorbates and preferential adsorption mechanisms. Indeed, both Alachlor and Diazinon are planar molecules, while Atrazine is non-planar. Molecule planar geometry may favour the alignment of an adsorbate molecule onto an adsorptive site, while allowing other pesticide molecules to diffuse; a non-planar molecule when adsorbed might in a certain configuration form a blockage to other pesticide molecules. In such a scenario, a lower density of functional sites and consequently a lower specific surface area can result in improved adsorptive performance. Pesticide molecule polarity could also influence the localized adsorption on the adsorbent surface, limiting adsorption performance via hydrophobic interactions.
Figure 2 shows the variation in adsorption capacity related to the adsorbent diameter or sheet thickness, in the adsorption of Atrazine. An exponential-type decreasing trend of the adsorption capacity for increasing material size can be observed. Indeed, carbon nanotubes of 40 nm diameter demonstrated a capacity of 105 mg/g (Table 4, N7). On the other hand, granular activated carbon of 37 µm size showed a capacity below 10 mg/g (Table 4, N12). Carbon nanofibers and polyacrylonitrile nanofibers, both with a mean diameter of 160 nm, showed a capacity of 2.2 mg/g and 1.6 mg/g, respectively (Table 4, N1, N5). All adsorbents represented here are carbonaceous, and diameters below 200 nm were reported for nanomaterials adsorbents. A higher contact surface area, and hence a lower diameter, would thus increase the proportion of electron vacancies on the nano-adsorbent surface by decreasing the volume of bulk material. As carbon-based adsorbents are prone to adsorb by electron interaction, such as π–π stacking between adsorbent and adsorbate respective unsaturated bonds, more electron vacancies and hence a lower adsorbent diameter would result in improved performance. The choice of adsorbent structure does not seem to impact on the performance, suggesting that the surface chemistry and charge distribution play a major role in the adsorptive performance. In this study, adsorbent diameters below 100 nm on average led to adsorption capacities over 20 mg/g for the removal of Atrazine.
2.2.2. Impact of Adsorbent Pore Size and Pore Volume
Figure 3 shows adsorption capacity related to the adsorbent pore volume in the removal of Atrazine. A global trend of increasing capacity for an increased pore volume up to 1.1 cm3/g can be noticed (Table 4, N9). This overall trend may be explained by the higher number of atrazine molecules diffusing in a higher number of surface pores across larger pore channels. However, several factors can imply lower performance for a higher pore volume. Adsorbent surface pore size is a critical factor for pesticide diffusion. For instance, surface pores twice as large as the adsorbate molecule cross section could still allow pesticide diffusion if one molecule was adsorbed along one pore wall, and could even allow two molecules to adsorb side to side. Yet, a larger pore channel would not favour the adsorption along pore walls due to a lower promiscuity. Furthermore, a higher pore volume could also translate to a higher proportion of pores with a smaller size distribution falling below the pesticide molecule size or cross section, hence hindering the adsorbate diffusion. Also, dead-end pores would affect the determination of pore volume. Nevertheless, the overall trend indicates that a pore volume around 1.0 ± 0.1 cm3/g is preferential for increased performance in the removal of Atrazine.
Concerning the adsorbent pore size, not enough data were found in the literature to enable a study of a preferential pore diameter for a specific pollutant among the ones considered in this section. In the case of Alachlor adsorption, organosilane-grafted beideillite clay and alumina nanofibers were reported to have a pore diameter of 6.44 nm and 11.4 nm, respectively, and showed an efficiency of 80% and 58% (Table 2, N1, N5) [28,29]. These results may suggest that an 11.4 nm wide pore channel does not offer enough promiscuity for the adsorption of Alachlor molecules, combined with a possible decrease in the efficiency of silane grafting along the adsorbent pore walls, thus impeding adsorption via hydrophobic interactions. Indeed, organosilane compounds considered for alumina nanofiber grafting include CPTES (3-chloro-propyl-triethoxysilane) and OTES (octyl-triethoxysilane), both of a weight comparable to Alachlor, 241 g/mol and 277 g/mol, of single-molecule orientation and longer carbon chain.
2.2.3. Nanofiber Performance Comparison Regarding Initial Pesticide Concentration and Adsorbent Dose
Figure 4 shows bar charts representing the adsorption capacity with the corresponding tests conditions of initial pesticide concentration and adsorbent dose for each pesticide, nanofiber adsorbent and selected benchmark adsorbents. It can be noticed from all the charts that nanofibers delivered an adsorption performance on average in the range of other benchmarked adsorbents. Indeed, nanofiber adsorption capacities ranged from 5.8 to 19.5 mg/g (Table 2, N1 and Table 4, N6), for a similar range of initial dye concentration around 10 mg/L compared to benchmark materials, yet for an adsorbent dose on average below 1 g/L. Other macro-adsorbents were reported for a dose on average over 3 g/L. The lower adsorbent dose required for nano-adsorbents compared to macrostructures should be taken into consideration when calculating the material fabrication cost and regeneration volumes.
In the case of organochlorines, Organo-layered double hydroxide nanohybrids and single walled carbon nanotubes showed the highest adsorption capacities of 113 mg/g and 130 mg/g against Alachlor and Atrazine, respectively (Table 2, N2 and Table 4, N9). However, other ceramic and carbon adsorptive nanostructures showed a lower performance for the same adsorbate respectively. Indeed, organosilane/alumina nanofibers demonstrated a capacity of 5.8 mg/g against Alachlor (Table 2, N1), and carbon nanofiber/carbon nanotube composites showed a capacity of 19.5 mg/g against Atrazine (Table 4, N6). Other than the action of other adsorption mechanisms, these performance differences for similar adsorbent sizes and compositions may also be explained by a different adsorbent pore structure that is hindering the diffusion of the pesticides, as in the case of modified alumina nanofibers, for example. Nevertheless, the predominant efficiency of carbon and metal oxide adsorbent surfaces suggests that π–π electron and electrostatic interactions are the most efficient adsorption mechanisms towards selected pesticides, compared to hydrophobic interactions, which by comparison reached average performance when serving as the predominant mechanism at stake [29]. Furthermore, carbon nanofibers were reported to show adsorptive affinity for other contaminants, such as sulfamethoxazole, in a multi-contaminant flow through adsorption test, demonstrating the versatility of carbonaceous adsorbents towards organic molecules with unsaturated bonds such as aromatic rings [39]. Polystyrene molecular imprinted nanofibers showed limited performance against Atrazine and Chlorpyrifos (Table 4, N2 and Table 5, N1). Although polyester is a hydrophobic polymer and is thus supposed to show affinity to the pesticides studied here, it is suggested that adsorption may be limited by an unsuitable solution pH, conferring on both adsorbent and adsorbate a similar surface charge [40]. Nylon-Poly(pyrrole) core-shell nanofibers showed an adsorption capacity of 2.77 mg/g, corresponding to an efficiency of 27% (Table 4, N3). The aromatic ring of Poly(pyrrole) enables π–π interaction with the Atrazine triazine ring, while nylon does not have unsaturated bonds [41]. Experiments here were reported for a neutral solution pH. However, the Poly(pyrrole) isoelectric point has been reported around 10, meaning that at neutral pH both adsorbent and atrazine exhibited a positive surface charge [41]. It was concluded that a pH slightly above 10 would favour adsorption with a negative Poly(pyrrole) surface and still slightly protonated atrazine [41].
In the case of organophosphates, benchmark adsorbents tested in similar conditions to nanofiber adsorbents could rarely be found. For instance, activated carbon nanofibers modified with either magnesium or aluminium oxide nanoparticles showed a capacity of 0.1 mg/g against Diazinon (Table 3, N1, N2). Still, against Diazinon, granular activated carbon (GAC) modified with iron oxide particles reached a capacity of 65 mg/g (Table 3, N6). Although iron oxide would be more reactive than magnesium or aluminium oxides, the large difference in applied adsorbent dose (1g/L for nanofibers and 0.1 g/L for GAC) and in initial concentration (200 µg/L for nanofibers and 40 mg/L for GAC) would significantly impact on the difference in performance. This influence stems from the equation used to determine the adsorption capacity. Adsorptive studies carried out on adsorbent dose and level of contamination in similar conditions to those reported for the polystyrene nanofiber study could not be found in the literature (Table 5, N1).
It can be noticed from Figure 4 that higher adsorbent doses, above 5 g/L, result on average in poorer adsorption capacities, falling below 1 mg/g (Table 2, N4). Similarly, for an average adsorbent dose around 1 g/L, a lower initial dye concentration below 0.5 mg/L tends to result in a lower adsorption capacity (Table 4, N2). These tendencies can be explained by the theory used to calculate the adsorption capacity, which will be reduced for higher adsorbent doses or lower initial dye concentrations, yet have the same removal efficiency. The optimal adsorbent dose required for a given initial concentration and a target removal efficiency could be more consistently investigated among the adsorptive studies to enable a rigorous performance comparison.
3. Phenolic Compounds
This section reviews the performance of nanofibers reported in the adsorption of phenol, 2- and penta-chlorophenol. Other than adsorptive performance relationships with adsorbent specific surface area and pore characteristics, the influence of the adsorbate chlorine number on adsorption will be investigated. Finally, test conditions such as pH, initial contamination and adsorbent dose will be taken into consideration.
3.1. Adsorbate Properties
Table 6 presents the molecular characteristics of Phenol, 2-Chlorophenol and Pentachlorophenol. Phenol, or carbolic acid, is a base molecule for phenolic compounds, such as explosive nitrophenols or persistent pentachlorophenol. All three compounds considered in this study have been used as disinfectants. The phenol molecule is composed of an aromatic ring derived from benzene and bound to one hydroxyl group. Phenol’s smallest cross section has been calculated at 0.43 nm. The 2-chlorophenol molecule is derived from phenol, with one chlorine group attachment on the aromatic ring, at position 2. Pentachlorophenol possesses five chlorine attachments to the aromatic ring, the sixth being the hydroxyl group, a component of the phenol molecule [26]. All three molecules possess three unsaturated bonds, conferred by the benzene-like aromatic structure, thus favouring adsorption via electron π–π stacking, provided on the adsorbent surface chemistry.
The number of chlorine groups influences not only the molecular weight but also molecule water solubility, decreasing from 67 to 14 mg/L for phenol and pentachlorophenol, respectively (25 °C). A decrease in water solubility results in an increase in the octanol-water partition coefficient. The higher chlorine number is also believed to promote the action of hydrophobic interactions on the capture of chlorophenol molecules, providing more surface area to react with a hydrophobic adsorbent. Finally, these three molecules possess a hydroxyl termination group as part of the phenol molecule, meaning each molecule possesses one hydrogen bond donor or acceptor group [26]. As a consequence, electrostatic interactions between the adsorbent surface and the contaminant hydroxyl group could also influence the adsorbent adsorption performance.
3.2. Nanofibers for Disinfectant Adsorption
3.2.1. Impact of Adsorbent Specific and Contact Surface Area
Figure 5 shows the adsorption performance of phenol and chlorophenols related to the adsorbent specific surface area. A near-linear trend of increase in the adsorption capacity for increasing adsorbent specific surface area can be observed in the case of phenol adsorption, as shown in Figure 5A. This near-linearity can be bound to a near-homogeneous surface saturation process, with a higher proportion in adsorptive sites, i.e., BET proportionally corresponding to a higher adsorption capacity. In over 80% of the reported kinetic and isotherm studies for phenol adsorption, adsorbents were found to follow pseudo-second order and Langmuir models, translating into a surface monolayer adsorption reaction that is limited by chemisorption, hence further suggesting homogeneous surface saturation (Table 7). Plain carbon nanofibers and iron-oxide-decorated carbon nanofibers demonstrated a capacity of 0.842 and 1.684 mg/g for a specific surface area of 40.7 and 72.4 m2/g, respectively (Table 7, N17, N18). However, activated carbon nanofibers showed a higher performance of 256.1 mg/g for a higher BET of 2921 m2/g (Table 7, N20). Figure 5B details the adsorbent composition used for phenol capture, showing a majority of carbon or carbon-based adsorbents following the near-linear adsorption trend. An explanation of this adsorption performance trend formed by carbonaceous adsorbents relies on the donor–acceptor electron complex adsorption mechanism. Actors in the electron interaction for adsorption are the carbonyl groups on the carbon-adsorbent surface (electron donor), the proportion of which influences the specific surface area, and the phenol compound aromatic ring (electron acceptor) [4].
The observed preference for the Langmuir isotherm model can further be linked to the role of π–π dispersion forces between the aromatic rings of phenol and activated carbon. Indeed, a process of localized monolayer adsorption could signify that each site is accommodating a single molecule with repulsive interactions between adsorbed molecules [4]. Ceramic and clay adsorbents, although less reported, also showed to follow the adsorption trend. Therefore, adsorbent structure rather than composition is affecting the performance for a given BET. Styrene divinylbenzene particles, here reported under polymer adsorbents and not following the trend, have a particle size in the macro-range, and offered a capacity of 8.83 mg/g for a BET of 1000 m2/g (Table 7, N32). In the case of carbon nanotubes, which do not fit the global performance trend, their capacity of 166.58 mg/g for a BET of 357 m2/g (Table 7, N25) may be explained by their hollow structure. Variations in test conditions may also significantly affect the adsorbent performance for a given specific surface area. For instance, temperature was shown to act as a catalyst for phenol adsorption on doped cryptomelane manganese nanofibers, with faster metal oxide surface hydroxylation reported for temperatures from 140 °C (Table 7, N19). The created surface hydroxyl groups can bind to phenol and form phenolic complexes, thus enhancing the adsorption capacity even for a relatively low specific surface area of 40 m2/g, impeded by the higher density of metals compared to carbon atoms [47].
On the other hand, no clear trend can be pulled out in the case of 2- and pentachlorophenol adsorption, presented in Figure 5C–F respectively. Although fewer data are available, it can be seen that the higher the chlorine number on the adsorbate, the smaller the range of obtained adsorption capacities. Carbon nanofibers with a BET of 2326 m2/g showed the maximum capacity of 167 mg/g for 2-chlorophenol adsorption (Table 8, N1). In the case of pentachlorophenol, carbon black with a specific surface area of 511 m2/g was reported to show a capacity of 250 mg/g (Table 9, N6). However, over 90% of the adsorbents showed a capacity between 44.7 and 98 mg/g for a BET ranging from 3.7 to 958 m2/g for the capture of pentachlorophenol (Table 9, N1, N5, N12). The gradual decrease in observed performance for an increasing number of chlorine groups on the phenol molecule can be explained by the larger structure and the modified surface polarity of the molecule. Indeed, the chlorine group, being an electron-withdrawing group, lowers the aromatic ring electron density, or deactivates the ring, thus potentially hindering adsorption onto carbon or metal oxide surfaces by electron interaction and hindering hydrophobic interactions.
3.2.2. Impact of Adsorbent Pore Size
The impact of adsorbent pore size on the adsorption capacity against phenol is illustrated on Figure 6. There is a noticeable trend, characterised by an exponential-type decrease in the adsorption capacity with the increase of adsorbent pore size.
For phenol capture, adsorbent pore size was reported from 0.43 nm (activated carbon nanofibers, Table 7, N20) to 15 nm (diatomite nanocomposites, Table 7, N23), corresponding to an adsorption capacity of 256.1 and 2 mg/g, respectively, being the maximal and minimal capacities here reported. Maximum adsorption capacities were observed for a pore size in a range between 0.43 and 2.2 nm (Table 7, N20, N4). The optimum pore size range of the adsorbent can be linked to the kinetics of pore blocking (i.e., phenol diffusion rate), adsorbent pore geometry and the single orientation of the phenol molecule (Table 6). Considering that the smallest cross section of the phenol molecule is 0.43 nm, mesopores (from 2 to 50 nm) may insufficiently promote adsorbent/adsorbate contact, thus resulting in a potentially lower performance depending on the adsorption mechanisms at stake (Table 7, N7, N32). On the other hand, activated carbon nanofibers were shown to possess an open pore structure and a dual pore size repartition of 0.43 nm and 0.8 nm, allowing the penetration of one or two phenol molecules, respectively (Table 7, N20). Dual pore size distribution on adsorbent surfaces can be further advocated by the fitting of the adsorption reaction to a Freundlich isotherm.
Furthermore, average adsorbent pore size has been calculated from a Barrett-Joyner-Halenda (BJH) method, and may not accurately reflect the adsorbent pore size distribution, depending on the actual pore tortuosity. However, a pore size calculated by BJH method and falling in the optimal range defined above may suggest an increased volume of micropores enhancing phenol adsorption. Using a BET/BJH method, the presence of micropores leads to an isotherm of type I, with increased nitrogen adsorption at low pressures [53]. Similarly to a Langmuir isotherm, the height of the plateau on the isotherm would reflect the volume of micropores, also called micropore capacity at the adsorbent surface. The extension of the isotherm hysteresis to relatively low pressures would give an indication of the micropores’ diameter [53].
Beside the adsorbent morphology, voids between the nanofibers in the case of fibrous mats could also impact the diffusion of the phenol molecules; however, over 95% of the studies reported a nanofiber web fabrication by a solution blowing or electrospinning process, hence ensuring webs of high porosity and of suitably large pore sizes to enable phenol diffusion. This last aspect is critical as the hydrodynamics of the solution diffusion, and therefore the impact of the webs’ wettability, is critical to the design of nanofibrous adsorbents.
3.2.3. Impact of Adsorbent Surface Charge and Solution pH
Adsorbent isoelectric point (IEP) corresponds to the pH at which the adsorbent carries no net electrical charge and is used to determine adsorbent global surface charge in an aqueous medium in function of the solution pH. As phenol and phenolic compounds are polar molecules, the adsorbent surface charge can significantly enhance the phenolic compound adsorptive performance with the attraction of two opposite charges between adsorbent and adsorbate. Phenol adsorption up to pH 7 has been experimented on with carbon nanofibers, resulting in a 31% removal capacity [89]. Nevertheless, the adsorbent IEP was not reported. Considering that phenol is a weak acid with a pKa of 9.95 (Table 6), an iso-electric point between pH 4 and pH 6.5 would be ideal to get the phenol molecule to bind to a carbon adsorbent surface for a reaction pH slightly below the adsorbent theoretical IEP and the phenol pKa. Adsorption studies at a reaction pH superior to the adsorbate pKa have been carried out for meta-aramid/polyacrylic acid nanofibers on another phenol compound, namely 2,4-dichlorophenol [90]. It was reported that the phenol compound dissociated into chlorophenolate anions, thus impeding the adsorption performance, given the electrostatic repulsion between identical charged target molecules and fiber active sites [90]. Solution pH therefore plays a determinant role in the efficiency of adsorption by electrostatic interaction. Ionic strength also has an impact on the adsorption process. Indeed, electrical double layers can form on the adsorbent surface [41]. In a case of a neutral pH, when falling below the adsorbent isoelectric point the adsorbent surface would carry a positive charge, and would therefore attract the anions present in the solution to the interface to form what is called a stern layer. The protonated contaminant would also carry a positive surface charge and would be found in the diffuse layer, attracted by anions in the stern layer. The thickness of the electrical double layers can prevent the adsorption reaction. However, when the ionic strength increases, the electrolyte will compress the electrical double layer and thus influence electrostatic interactions between adsorbate and adsorbent [41].
Figure 7 shows the variation in adsorption performance in function of the solution pH. It can be seen from all graphs that, starting from a solution pH of 6, the performance decreases with increasing pH. A solution pH between 4.5 and 6 seems to be the optimal window for metal oxide- and carbon-based adsorbents, confirming the theory explained above. The microfiber/nanofiber carbon composite adsorbent was surface-functionalized with ammonia [57]. It was reported that the inclusion of nitrogen groups on the adsorbent surface increased the adsorbent basicity, thus facilitating phenol adsorption at a close to neutral pH [57].
Horseradish peroxidase immobilized on polymer nanofibers was tested in the adsorption of Pentachlorophenol in several solution pH conditions (Table 9, N1). Sorption capacities were reported of 15.27 mg/L, 14.33 mg/L and 11.85 mg/L for an increasing pH of 2, 3, and 4, with no sorption occurring at pH 5 [78]. This direct proportion to solution acidity can be related to the protonation degree of Pentachlorophenol [78]. Since the hydrophobicity of Pentachlorophenol was found to influence the sorption rate, hydrophobic interactions can be identified as a significant capture mechanism. Other mechanisms reported π–π electron interactions between the Pentachlorophenol benzene ring and π electrons of the ketone group from the polymer molecular skeleton, as well as hydrogen bonding between the polymer ketone groups and Pentachlorophenol hydroxyl group [78].
3.2.4. Kinetic Performance of Nanofiber Adsorbents
Figure 8 shows the relationship between adsorption capacity and reaction equilibrium time for different adsorptive structures against phenol. These graphs aim to show the average shorter equilibrium times (under 5 h) reported for nanostructures compared to macro-adsorbents, as can be noticed in Figure 8A, as well as the yield of higher adsorption capacities for nanofibers compared to other nano-structures, with, for instance, activated carbon nanofibers reaching a capacity of 256.1 mg/g after 1.3 h (Table 7, N20). The difference in adsorptive performance and kinetics can be explained by the stability of nanofibers in water, while nanoparticle adsorbents tend to agglomerate under the effect of surface interactions such as Van der Waals, hence hindering the adsorption reaction. The difference in kinetics between nanofibers and macro-structures can be the result of the higher surface to volume ratio of nanofibers. Figure 8B details the composition of the reported adsorbents, revealing a combination of faster kinetics and higher performance for carbonaceous adsorbents, hence suggesting electron interaction as the most efficient predominant adsorption mechanism in the capture of phenol [91].
3.2.5. Nanofiber Performance Comparison Regarding Initial Contaminant Concentration and Adsorbent Dose
Figure 9 shows bar charts representing the adsorption capacity with the corresponding test conditions of initial disinfectant concentration and adsorbent dose for each nanofiber adsorbent and selected benchmark adsorbents. Comparatively to relatively hydrophilic pesticides, nanofiber adsorbents demonstrated an adsorption capacity in the range of the one performed by activated carbon adsorbents, yet for a lower adsorbent dose. For instance, in the case of phenol capture, activated carbon treated with potassium permanganate demonstrated a capacity of 142.15 mg/g for a contamination of 100 mg/L and a dose of 1 g/L (Table 7, N6). For the same initial contamination, activated carbon microfiber–nanofiber composites showed a capacity of 150 mg/g for a dose of 0.6 g/L (Table 7, N16). It can be seen from all charts that carbon-based adsorbents are amongst the best against phenol and chlorophenols.
4. Persistent Organic Pollutants
In this section, the adsorptive performance of nanofiber-based adsorbents is benchmarked and reviewed for the capture of selected aliphatic organochlorines, and selected aromatic compounds from the PCBs and PAHs families. Adsorbate molecules considered in this section are classified POPs (persistent pesticides) and industrial products. Characteristics of the adsorbate shall first be discussed, followed by reported adsorbent structure-performance relationships.
4.1. Aliphatic Organochlorines
4.1.1. Adsorbate Properties
Table 10 shows the physico-chemical characteristics of selected aliphatic organochlorines in this review, namely Aldrin, Dieldrin, Endrin, Chlordane, Heptachlor, Heptachlor epoxide, and Toxaphene 8. Drin pesticides possess an alicyclic structure with 6 chlorine groups. The Aldrin molecule is formed by reaction of norbornadiene, a bicyclic hydrocarbon, and hexachlorocyclopentadiene, also called C-56. In specific conditions, such as in living organisms, Aldrin can be oxidised to form Dieldrin. Endrin is a stereoisomer of Dieldrin, differing in the spatial orientation of the oxygen group, as well as one hydrogen and one chlorine bond. Cyclodiene compounds selected in this study also comprise Chlordane and Heptachlor. Also derived from hexachlorocyclopentadiene, Chlordane and Heptachlor have eight and seven chlorine atoms, respectively, surrounding the polycyclic organic structure. It has been observed that when Heptachlor penetrates the soil, it can be turned into Heptachlor epoxide by soil microorganisms in an epoxy reaction. Toxaphene is another polycyclic organochlorine compound, formed by the chlorination of camphene, usually by chlorine gas. Also called camphechlor or polychlorocamphene, Toxaphene 8 possesses eight chlorine groups [26].
Except for Toxaphene, all molecules present one unsaturated bond, enabling adsorption via π–π stacking of electrons with suitable adsorbents. Dieldrin and Endrin present three chlorine groups at proximity, while other molecules show two chlorine groups, except for Aldrin, which does not show any hydrophobic group near the unsaturated bond.
Selected organochlorine POPs are of a similar weight, ranging from 365 g/mol for Aldrin to 414 g/mol for Toxaphene; however, they differ in their spatial orientation. Apolar molecules have a solubility in water below 0.6 mg/L, with octanol-water partition coefficients over 5. Dieldrin, Endrin and Heptachlor epoxide are only slightly polar molecules due to the presence of one oxygen group (an electron acceptor group), which significantly improves their water affinity (0.019 mg/L for Aldrin and 0.19 mg/L for Dieldrin) and is believed to improve binding with adsorbents by electrostatic interaction.
4.1.2. Nanofibers for Pesticide Adsorption
Figure 10 shows the relationship between adsorption capacity and test conditions of initial contaminant concentration and adsorbent dose for Aldrin, Dieldrin, Endrin pesticides plus Heptachlor and its epoxide. Polystyrene (PES) nanofibers decorated with titania nanoparticles showed limited adsorptive performance for these pesticides, as well as against Chlordane, showing a capacity of 0.02 mg/g (Table 11, N1) [92]. Adsorbent surface properties were not reported, yet the poor affinity of hydrophobic polyester for hydrophobic organochlorines could have impacted the performance, with adsorption reaction localized on the titania surface. In the case of Dieldrin removal, bromopropyl functionalised silica nanofibers revealed an adsorption capacity of 0.19 mg/g for contamination and adsorbent dose of 20 µg/L and 0.1 g/L, respectively (Table 12, N1). In comparison, untreated silica nanofibers achieved a capacity of 0.014 mg/g (Table 12, N2). The addition of a dense bromopropyl layer on silica nanofibers produced a hydrophobic adsorbent surface, with chemical affinity with pesticide chlorine groups.
Concerning Aldrin removal, vegetal activated carbon showed a relatively high performance with a capacity of 0.38 mg/g for a contamination of 2 mg/L, yet for a relatively large dose of 5 g/L (Table 13, N2). Vegetal activated carbon performed a similar role in the case of Dieldrin adsorption, in the same conditions (Table 12, N8). Against Heptachlor epoxide, the vegetal activated carbon was reported to show a capacity of 0.42 mg/g for a contamination of 2.2 mg/L for a similar dose of 5 g/L (Table 14, N7). Finally, in the case of Endrin, powdered activated carbon was reported to show a capacity of 0.085 mg/g for a contamination of 0.8 µg/L, and a relatively large dose of 0.2 g/L (Table 15, N6). These results show that although adsorbent specific surface area and pore channels could be adapted to improve the adsorptive performance, activated carbons yield removal efficiencies over 95%. However, compared to nanomaterial adsorbents, a large adsorbent dose is required.
Acid-treated date and olive stones showed a significantly improved performance over non-treated biomass adsorbents. For instance, acid-treated date stones showed a capacity of 0.45 mg/g in the removal of Aldrin, while untreated date stones yielded 0.05 µg/g for conditions of contamination and adsorbent dose of respectively 500 µg/L, 1 g/L and 0.5 µ g/L and 10 g/L (Table 13, N9, N12). Date stones were thermally treated with hydrochloric acid, thus creating a hydrophobic layer on the adsorbent surface, and facilitating the anchorage of organochlorines [93]. In the adsorption of Dieldrin and Endrin, acid-treated date stones showed a capacity of 0.44 mg/g and 0.40 mg/g, in the same conditions as Aldrin capture (Table 12, N18 and Table 15, N10). The lower performance in the adsorption of Endrin compared to Dieldrin can be explained by the spatial organization of the Endrin molecule, with several orientations. The similar adsorption capacities of Aldrin and Dieldrin indicate that the pesticide oxide groups of Dieldrin and Endrin do not significantly influence the adsorption reaction, meaning electrostatic interactions played a minor role in the capture of these pesticides. Finally, cellulose nanofibers modified with manganese oxide have been reported to yield 96.5% removal against Toxaphene 8, highlighting the potential of metal oxide-based nanofiber adsorbents (Table 16, N1).
4.2. Polychlorinated Biphenyls (PCBs) and Polyaromatic Hydrocarbons (PAHs)
4.2.1. Adsorbate Properties
Table 17 presents the different molecular structures for the selected polychlorinated biphenyls PCBs in this study, which are namely 2 to 6 -PCB, PCB 28 and PCB 77. PCBs are polycyclic aromatic organochlorines of chemical formula C12H10−xClx. The PCB structure is composed of two benzene rings, thus sharing the aromatic structure of phenols molecules, and decorated by a number of chlorine groups. PCBs 2 and 3, also called 2- and 3-chlorobiphenyls, possess one chlorine group attached on position 2 and 3, respectively, on one of the benzene rings. Sharing a molecular weight of 188.7 g/mol, water solubility was determined at 1.45 mg/L (25 °C), corresponding to a Log Kow of 4.54. PCBs 4–6 possess two chlorine groups, for a weight of 223.1 g/mol. Their chemical names are 2,2′- 2,3- and 2,3′-dichlorobiphenyls, respectively, corresponding to the chlorine groups’ respective positions on one or both benzene rings. PCB 28, called 2,4,4′-trichlorobiphenyl, possesses three chlorine groups for a weight of 257.5 g/mol. PCB 77, called 3,3′,4,4′-tetrachlorobiphenyl, possesses four chlorine group for a weight of 292.0 g/mol. Compared to monochloro-biphenyls, PCB 77 water solubility decreased to 0.18 mg/L (25 °C, log Kow 6.72). All molecules are apolar.
Table 18 presents selected characteristics of the Phenantrene molecule, non-POP-classified, from the family of polycyclic aromatic hydrocarbon compounds. Of a molecular weight in the same order as monochlorinated biphenyls, its water solubility was determined to be 1.15 mg/L (25 °C). An apolar molecule, Phenantrene is composed of three fused benzene rings.
4.2.2. Nanofibers for Pesticide Adsorption
Figure 11 shows the adsorption capacity related to the adsorbent dose and initial contamination for adsorbents of PCBs and Phenantrene. Oriented porous magnetite nanofibers were tested in the adsorption of PCB 77 and showed a capacity of 0.18 mg/g in hexane for a contamination of 30 µg/L and a dose of 0.15 g/L (Table 19, N8). However, activated carbon showed the largest adsorption capacity of 649 mg/g for a contamination of 4 mg/L and a relatively small dose of 0.015 g/L (Table 19, N1). To study the influence of the adsorbate aromatic structure on the adsorption performance, Phenantrene, with three aromatic cycles, has been considered here. Cellulose acetate unmodified nanofibers showed limited performance in the capture of Phenantrene, which could be due to the hydrophilic nature of cellulose acetate; they are thus poorly adapted for the adsorption of apolar compounds [112]. Cyclodextrin-grafted cellulose acetate nanofibers were tested for the capture of Phenantrene via molecular filtration, by inclusion–complexation of the hydrophobic contaminants in the apolar cyclodextrin cavity [112]. Hydrophobic interactions led to a contaminant removal of 97% (Table 20, N2). Cross-linking of cellulose acetate nanofibers with benzene rings by polybenzoxazine provided a hydrophobic adsorptive structure [113]. The adsorbent benzene rings further enabled π–π interactions with Phenantrene aromatic rings, thus leading to 98.5% contaminant removal (Table 20, N1).
Activated carbons and carbon nanotubes however, demonstrated an adsorption capacity of 85 mg/g for a dose of 4 mg/L (initial concentration was not reported) (Table 20, N7). It can be suggested that π–π electron interaction between the unsaturated Phenantrene aromatics and the carbon adsorbent surface is the predominant reaction mechanism; in that sense, a higher carbon content and full crystalline structure would lead to an increased specific surface area and, for a large pore volume of adapted size, Phenantrene adsorption. Among the reported carbon-based materials, granular activated carbon possessed a BET of 706 m2/g and a pore volume of 0.711 cm3/g, yielding the highest performance. On the other hand, carbon nanotubes with a higher pore volume of 0.818 cm3/g but a lower BET of 537 m2/g showed a capacity of 75 mg/g (Table 20, N4). Furthermore, activated carbon fibers with the highest BET of 949 m2/g but the lowest pore volume of 0.381 cm3/g yielded a lower capacity of 60 mg/g (Table 20, N6), indicating a synergetic effect of pore volume and surface area (BET).
5. Adsorbent Regenerability
Two studies reported the adsorbent desorption and recyclability capacity for further use in the industry, and are reviewed below.
Nylon 6–Poly(pyrrole) core-shell nanofibers have been investigated for atrazine desorption and adsorbent regenerability [41]. The desorption procedure consisted of successive washing in methanol and deionized water for 5 min each to elute atrazine, followed by air-drying of nanofibers at room temperature. With this procedure, Nylon-Poly(pyrrole) nanofibers demonstrated the same capacity of 2.77 mg/g over five cycles, with a slight decrease of 0.2 mg/g in adsorption capacity observed at the 6th cycle (Table 4, N3) [41]. With an adsorption plateau reached after 5 h and a desorption procedure estimated around 3 h, such an adsorbent has a life-span of 37 h at its maximal efficiency. Electrostatic interaction and π–π stacking of electrons had been identified as the two adsorption mechanisms at stake in the uptake of Atrazine by Nylon-Poly(pyrrole) nanofibers [41]. Although absorption of Atrazine would be a recyclability limitation, the methanol wash procedure might also imply methanol adsorption.
Manganese oxide–cellulose fiber nanocomposites were investigated for the desorption of Toxaphene (Table 16, N1). Desorption rates were shown to be of 12%, 13% and 25%, respectively, at pH 3, 7, and 11 [111]. The preferential affinity for alkaline pH could suggest the reversibility of the adsorption reaction. Indeed, cellulose and manganese oxide (MnO2) were reported in the literature to have an isoelectric point of 2.5 and below 5.1, respectively [119,120]. At pH 11, both components of the adsorbent material therefore carry a strong negative surface charge, while the decreasing protonation of Toxaphene with increasing pH could suggest that both adsorbent and adsorbate carry a negative surface charge, hence the desorption. However, the desorption protocol followed was not reported [111].
6. Recommendations and Conclusions
Nanofiber-based materials showed their fast adsorption kinetics and required low adsorbent dose compared to benchmark adsorbents in this study. For instance, polyacrylonitrile nanofibers attained equilibrium after 0.5 h in the adsorption of Atrazine, for an adsorbent dose of 1 g/L (Table 4, N5) [41]. Regarding the adsorption performance, engineered nanofibers yielded over 95% removal efficiency with high adsorption capacities comparable to granular activated carbons and acid-treated biomass. For example, activated carbon nanofibers against Phenol showed a capacity of 256.1 mg/g (Table 7, N20), and cross-linked cellulose acetate-polybenzoxazine nanofibers demonstrated against Phenantrene 98.5% removal (Table 20, N1) [61,113]. Such a nanofiber web presented adequate structural and chemical surface characteristics for the adsorption of organic contaminants.
Essential structural characteristics for a nanofiber adsorbent were found to be surface pores and density of functional sites. Indeed, the size of pores across the fiber surface was shown to have a major impact on the saturation of the adsorbent, with pore channels engineered to take into account the size or cross section of the contaminant showing higher performance. Activated carbon nanofibers for phenol adsorption present a dual pore repartition of 0.4 nm and 0.8 nm, adapted to the phenol molecule size, with a smallest cross section of 0.43 nm [61]. Molecular orientation of the contaminant is also considered to prevent size-exclusion effects when one molecule is already adsorbed along a pore wall, as highlighted by the performance comparison of Dieldrin and stereoisomer Endrin adsorption [73]. Adsorbent contact surface area ruled by the nanofiber average diameter impacted on the contaminant capture, with diameters below 150 nm yielding higher performance in the capture of Atrazine [39]. Higher surface specific areas led in general to higher adsorption capacities, provided there was contaminant diffusion along the surface pore channels. Activated carbon nanofibers demonstrated a high BET of 2921 m2/g [61].
Regarding adsorbent surface chemistry, a total hydrophobic surface is preferable to show affinity for adsorption—in the case of surface grafting of hydrophobic groups, adsorption may be impeded along the pore walls [28]. Compared to hydrophobic interactions, electrostatic interactions and foremost electron interactions were shown to be more efficient adsorption mechanisms [41,113]. To this end, adsorbent isoelectric point should be systematically determined to improve the contribution of electrostatic interactions in the contaminant capture. Electron interaction in this study happens via π–π stacking of electrons between adsorbate and adsorbent unsaturated bonds, justifying the high efficiency of carbon-based adsorbents [61]. Other than pore and surface area characteristics, carbon adsorbent crystallinity and carbon content are features of interest that could be investigated in order to improve adsorption by electron interaction. The tuning of the carbon adsorbent surface chemistry to shift its isoelectric point could also be investigated to improve the contaminant adsorption by electrostatic interaction contribution. Other structures such as cellulose acetate crosslinked with polybenzoxazine lead to a highly hydrophobic surface presenting unsaturated bonds, resulting in high performance in the capture of Phenantrene [113]. Material functionalisation to reach a surface chemistry allowing the three adsorption mechanism defined above could be the focus of future research in order to yield complete contaminant removal.
Testing conditions in terms of initial contaminant concentration were found to vary between 0.5 µg/L and 700 mg/L in this study [16,81]. The initial level of contamination should be justified by the occurrence of the selected contaminant in the environment rather than chosen as a function of the available solution characterisation technique, as adsorbent performance may be affected by a significant change in contaminant concentration. Isotherm analysis was found to be in over 80% of the reported isotherm studies fitted to Langmuir and Freundlich models, with in more than 40% of cases a report of the Freundlich constant with a correlation coefficient below 0.90 for performance comparison with other adsorbents. Adsorption isotherms reflecting the adsorption mechanisms at stake should be more carefully studied to avoid inconsistent performance comparisons.
So far, engineered nanofibers showed the highest performance in the one-off removal of pesticides and disinfectants. However, these adsorbents also show versatility in the capture of contaminants. Ways to create selectivity for a target molecule, such as fiber layers of different pore channels and surface chemistry, could be further investigated. Adsorption being a conventional water treatment technique, the adsorbent material fabrication and operational costs are critical to the implementation of any new classes of materials. Industrial applications of nanofiber adsorbent material solutions should be rigorously assessed and benchmarked against commercially available fabrication routes. The adsorption kinetics and material dosage are also to be considered when evaluating adsorbent life cycle and operational costs. Industrial-scale nanofiber fabrication devices by electrospinning or multi-component fiber extrusion were reported to yield mass output varying between 0.02 kg/h and 0.2 kg/h, and up to 6.5 kg/h, respectively, with a production cost of $2–5/kg [121,122]. Other competitive techniques such as force-spinning have been developed to simultaneously increase mass output and fiber quality [123]. Furthermore, to develop a sustainable industry, adsorbent recyclability must be further investigated. As the best-performing materials in the removal of POP may not offer the best recyclability, it is critical to systematically investigate the adsorbent hysteresis of adsorption–desorption. Regeneration of the adsorbent without increasing toxicity concerns linked to adsorbed contaminants must also be investigated.
Acknowledgments
This work was supported by Deakin University and the Australian Research Council with the ARC Linkage Project LP140100374. LD also thanks the ARC for awarding his DECRA 2018 DE180100130 fellowship.
Author Contributions
Elise des Ligneris performed the literature survey, did a major part of the analysis and paper writing. Ludovic F. Dumée contributed in the data analysis and paper writing. Lingxue Kong helped to conceive the paper structure and in the discussion orientation.
Conflicts of Interest
The authors declare no conflict of interest.
References
- Jones, K.C.; de Voogt, P. Persistent organic pollutants (POPs): State of the science. Environ. Pollut. 1999, 100, 209–221. [Google Scholar] [CrossRef]
- United Nations Environment Programme (UNEP). Stockholm Convention. Available online: http://chm.pops.int/ (accessed on 19 September 2017).
- World Health Organization (WHO). Persistent Organic Pollutants (POPs). Available online: http://www.who.int/foodsafety/areas_work/chemical-risks/pops/en/ (accessed on 19 September 2017).
- Rashed, M.N. Adsorption technique for the removal of organic pollutants from water and wastewater. In Organic Pollutants—Monitoring, Risk and Treatment; Rashed, M.N., Ed.; InTech: Rijeka, Croatia, 2013; Chapter 7. [Google Scholar]
- World Health Organization (WHO). Heptachlor and Heptachlor Epoxide in Drinking-Water; World Health Organization: Geneva, Switzerland, 2004. [Google Scholar]
- Extension Toxicology Network (EXTOXNET). Ddt (Dichlorodiphenyltrichloroethane). Available online: http://pmep.cce.cornell.edu/profiles/extoxnet/carbaryl-dicrotophos/ddt-ext.html (accessed on 19 September 2017).
- Wania, F.; MacKay, D. Peer reviewed: Tracking the distribution of persistent organic pollutants. Environ. Sci. Technol. 1996, 30, 390A–396A. [Google Scholar] [CrossRef] [PubMed]
- Breivik, K.; Armitage, J.M.; Wania, F.; Sweetman, A.J.; Jones, K.C. Tracking the global distribution of persistent organic pollutants accounting for e-waste exports to developing regions. Environ. Sci. Technol. 2016, 50, 798–805. [Google Scholar] [CrossRef] [PubMed] [Green Version]
- Bigot, M.; Muir, D.C.G.; Hawker, D.W.; Cropp, R.; Dachs, J.; Teixeira, C.F.; Bengtson Nash, S. Air–seawater exchange of organochlorine pesticides in the southern ocean between australia and antarctica. Environ. Sci. Technol. 2016, 50, 8001–8009. [Google Scholar] [CrossRef] [PubMed]
- Andreozzi, R.; Caprio, V.; Insola, A.; Marotta, R. Advanced oxidation processes (AOP) for water purification and recovery. Catal. Today 1999, 53, 51–59. [Google Scholar] [CrossRef]
- Gomes, J.; Costa, R.; Quinta-Ferreira, R.M.; Martins, R.C. Application of ozonation for pharmaceuticals and personal care products removal from water. Sci. Total Environ. 2017, 586, 265–283. [Google Scholar] [CrossRef] [PubMed]
- Oller, I.; Malato, S.; Sánchez-Pérez, J.A. Combination of advanced oxidation processes and biological treatments for wastewater decontamination—A review. Sci. Total Environ. 2011, 409, 4141–4166. [Google Scholar] [CrossRef] [PubMed]
- Köhler, A.; Hellweg, S.; Escher, B.I.; Hungerbühler, K. Organic pollutant removal versus toxicity reduction in industrial wastewater treatment: The example of wastewater from fluorescent whitening agent production. Environ. Sci. Technol. 2006, 40, 3395–3401. [Google Scholar] [CrossRef] [PubMed]
- Ellerie, J.R.; Apul, O.G.; Karanfil, T.; Ladner, D.A. Comparing graphene, carbon nanotubes, and superfine powdered activated carbon as adsorptive coating materials for microfiltration membranes. J. Hazard. Mater. 2013, 261, 91–98. [Google Scholar] [CrossRef] [PubMed]
- Kakavandi, B.; Jahangiri-rad, M.; Rafiee, M.; Esfahani, A.R.; Babaei, A.A. Development of response surface methodology for optimization of phenol and p-chlorophenol adsorption on magnetic recoverable carbon. Microporous Mesoporous Mater. 2016, 231, 192–206. [Google Scholar] [CrossRef]
- El Bakouri, H.; Morillo, J.; Usero, J.; Ouassini, A. Natural attenuation of pesticide water contamination by using ecological adsorbents: Application for chlorinated pesticides included in european water framework directive. J. Hydrol. 2009, 364, 175–181. [Google Scholar] [CrossRef]
- Aksu, Z. Application of biosorption for the removal of organic pollutants: A review. Process Biochem. 2005, 40, 997–1026. [Google Scholar] [CrossRef]
- Bhatnagar, A.; Sillanpää, M. Utilization of agro-industrial and municipal waste materials as potential adsorbents for water treatment—A review. Chem. Eng. J. 2010, 157, 277–296. [Google Scholar] [CrossRef]
- Rani, M.; Shanker, U.; Jassal, V. Recent strategies for removal and degradation of persistent & toxic organochlorine pesticides using nanoparticles: A review. J. Environ. Manag. 2017, 190, 208–222. [Google Scholar]
- Peng, X.; Jia, J.; Luan, Z. Oxidized carbon nanotubes for simultaneous removal of endrin and Cd(π) from water and their separation from water. J. Chem. Technol. Biotechnol. 2009, 84, 275–278. [Google Scholar] [CrossRef]
- Shi, B.; Zhuang, X.; Yan, X.; Lu, J.; Tang, H. Adsorption of atrazine by natural organic matter and surfactant dispersed carbon nanotubes. J. Environ. Sci. 2010, 22, 1195–1202. [Google Scholar] [CrossRef]
- Balamurugan, R.; Sundarrajan, S.; Ramakrishna, S. Recent trends in nanofibrous membranes and their suitability for air and water filtrations. Membranes 2011, 1, 232–248. [Google Scholar] [CrossRef] [PubMed]
- Ramakrishna, S.; Fujihara, K.; Teo, W.-E.; Yong, T.; Ma, Z.; Ramaseshan, R. Electrospun nanofibers: Solving global issues. Mater. Today 2006, 9, 40–50. [Google Scholar] [CrossRef]
- Amin, M.T.; Alazba, A.A.; Manzoor, U. A review of removal of pollutants from water/wastewater using different types of nanomaterials. Adv. Mater. Sci. Eng. 2014, 2014, 24. [Google Scholar] [CrossRef]
- Anjum, M.; Miandad, R.; Waqas, M.; Gehany, F.; Barakat, M.A. Remediation of wastewater using various nano-materials. Arab. J. Chem. 2016. [Google Scholar] [CrossRef]
- National Center for Biotechnology Information (NCBI). Pubchem. Available online: https://pubchem.ncbi.nlm.nih.gov/ (accessed on 19 September 2017).
- Björk, J.; Hanke, F.; Palma, C.-A.; Samori, P.; Cecchini, M.; Persson, M. Adsorption of aromatic and anti-aromatic systems on graphene through π−π stacking. J. Phys. Chem. Lett. 2010, 1, 3407–3412. [Google Scholar] [CrossRef]
- Paul, B.; Martens, W.N.; Frost, R.L. Surface modification of alumina nanofibres for the selective adsorption of alachlor and imazaquin herbicides. J. Colloid Interface Sci. 2011, 360, 132–138. [Google Scholar] [CrossRef] [PubMed] [Green Version]
- Paul, B.; Martens, W.N.; Frost, R.L. Organosilane grafted acid-activated beidellite clay for the removal of non-ionic alachlor and anionic imazaquin. Appl. Surf. Sci. 2011, 257, 5552–5558. [Google Scholar] [CrossRef]
- Faust, S.D.; Aly, O.M. 2-Adsorption models. In Adsorption Processes for Water Treatment; Butterworth-Heinemann: Oxford, UK, 1987; pp. 25–64. [Google Scholar]
- Chaara, D.; Bruna, F.; Ulibarri, M.A.; Draoui, K.; Barriga, C.; Pavlovic, I. Organo/layered double hydroxide nanohybrids used to remove non ionic pesticides. J. Hazard. Mater. 2011, 196, 350–359. [Google Scholar] [CrossRef] [PubMed]
- Hnatukova, P.; Kopecka, I.; Pivokonsky, M. Adsorption of cellular peptides of microcystis aeruginosa and two herbicides onto activated carbon: Effect of surface charge and interactions. Water Res. 2011, 45, 3359–3368. [Google Scholar] [CrossRef] [PubMed]
- Bosetto, M.; Arfaioli, P.; Fusi, P. Adsorption of the herbicides alachlor and metolachlor on two activated charcoals. Sci. Total Environ. 1992, 123–124, 101–108. [Google Scholar] [CrossRef]
- Behnam, R.; Morshed, M.; Tavanai, H.; Ghiaci, M. Destructive adsorption of diazinon pesticide by activated carbon nanofibers containing Al2O3 and mgo nanoparticles. Bull. Environ. Contam. Toxicol. 2013, 91, 475–480. [Google Scholar] [CrossRef] [PubMed]
- Esfandian, H.; Samadi-Maybodi, A.; Parvini, M.; Khoshandam, B. Development of a novel method for the removal of diazinon pesticide from aqueous solution and modeling by artificial neural networks (ANN). J. Ind. Eng. Chem. 2016, 35, 295–308. [Google Scholar] [CrossRef]
- Farmany, A.; Mortazavi, S.S.; Mahdavi, H. Ultrasond-assisted synthesis of Fe3O4/SiO2 core/shell with enhanced adsorption capacity for diazinon removal. J. Magn. Magn. Mater. 2016, 416, 75–80. [Google Scholar] [CrossRef]
- Moussavi, G.; Hosseini, H.; Alahabadi, A. The investigation of diazinon pesticide removal from contaminated water by adsorption onto nh4cl-induced activated carbon. Chem. Eng. J. 2013, 214, 172–179. [Google Scholar] [CrossRef]
- Hassan, A.F.; Elhadidy, H.; Abdel-Mohsen, A.M. Adsorption and photocatalytic detoxification of diazinon using iron and nanotitania modified activated carbons. J. Taiwan Inst. Chem. Eng. 2017, 75, 299–306. [Google Scholar] [CrossRef]
- Peter, K.T.; Vargo, J.D.; Rupasinghe, T.P.; De Jesus, A.; Tivanski, A.V.; Sander, E.A.; Myung, N.V.; Cwiertny, D.M. Synthesis, optimization, and performance demonstration of electrospun carbon nanofiber–carbon nanotube composite sorbents for point-of-use water treatment. ACS Appl. Mater. Interfaces 2016, 8, 11431–11440. [Google Scholar] [CrossRef] [PubMed]
- Ruggieri, F.; D’Archivio, A.A.; Di Camillo, D.; Lozzi, L.; Maggi, M.A.; Mercorio, R.; Santucci, S. Development of molecularly imprinted polymeric nanofibers by electrospinning and applications to pesticide adsorption. J. Sep. Sci. 2015, 38, 1402–1410. [Google Scholar] [CrossRef] [PubMed]
- Yang, B.-Y.; Cao, Y.; Qi, F.-F.; Li, X.-Q.; Xu, Q. Atrazine adsorption removal with nylon6/polypyrrole core-shell nanofibers mat: Possible mechanism and characteristics. Nanoscale Res. Lett. 2015, 10, 207. [Google Scholar] [CrossRef] [PubMed]
- Yan, X.M.; Shi, B.Y.; Lu, J.J.; Feng, C.H.; Wang, D.S.; Tang, H.X. Adsorption and desorption of atrazine on carbon nanotubes. J. Colloid Interface Sci. 2008, 321, 30–38. [Google Scholar] [CrossRef] [PubMed]
- Lupul, I.; Yperman, J.; Carleer, R.; Gryglewicz, G. Adsorption of atrazine on hemp stem-based activated carbons with different surface chemistry. Adsorption 2015, 21, 489–498. [Google Scholar] [CrossRef]
- Zhou, Y.; Zhang, F.; Tang, L.; Zhang, J.; Zeng, G.; Luo, L.; Liu, Y.; Wang, P.; Peng, B.; Liu, X. Simultaneous removal of atrazine and copper using polyacrylic acid-functionalized magnetic ordered mesoporous carbon from water: Adsorption mechanism. Sci. Rep. 2017, 7, 43831. [Google Scholar] [CrossRef] [PubMed]
- Zhang, C.; Zhang, R.Z.; Ma, Y.Q.; Guan, W.B.; Wu, X.L.; Liu, X.; Li, H.; Du, Y.L.; Pan, C.P. Preparation of cellulose/graphene composite and its applications for triazine pesticides adsorption from water. ACS Sustain. Chem. Eng. 2015, 3, 396–405. [Google Scholar] [CrossRef]
- Suciu, N.A.; Capri, E. Adsorption of chlorpyrifos, penconazole and metalaxyl from aqueous solution by modified clays. J. Environ. Sci. Health Part B 2009, 44, 525–532. [Google Scholar] [CrossRef] [PubMed]
- Hu, B.; Chen, C.-H.; Frueh, S.J.; Jin, L.; Joesten, R.; Suib, S.L. Removal of aqueous phenol by adsorption and oxidation with doped hydrophobic cryptomelane-type manganese oxide (K−OMS-2) nanofibers. J. Phys. Chem. C 2010, 114, 9835–9844. [Google Scholar] [CrossRef]
- Srihari, V.; Ashutosh, D. Adsorption of phenol from aqueous media by an agro-waste (Hemidesmus indicus) based activated carbon. Appl. Ecol. Environ. Res. 2009, 7, 13–23. [Google Scholar] [CrossRef]
- Gundogdu, A.; Duran, C.; Senturk, H.B.; Soylak, M.; Ozdes, D.; Serencam, H.; Imamoglu, M. Adsorption of phenol from aqueous solution on a low-cost activated carbon produced from tea industry waste: Equilibrium, kinetic, and thermodynamic study. J. Chem. Eng. Data 2012, 57, 2733–2743. [Google Scholar] [CrossRef]
- Biglari, H.; Afsharnia, M.; Javan, N.; Sajadi, S.A. Phenol removal from aqueous solutions by adsorption on activated carbon of miswak’s root treated with KMnO4. Iran. J. Health Sci. 2016, 4, 20–30. [Google Scholar] [CrossRef]
- Al-Malack, M.H.; Dauda, M. Competitive adsorption of cadmium and phenol on activated carbon produced from municipal sludge. J. Environ. Chem. Eng. 2017, 5, 2718–2729. [Google Scholar] [CrossRef]
- Gupta, V.K.; Sharma, M.; Singh, K.; Vyas, R.K. Reactive adsorption of phenol onto Fe-GAC: Parallel pore batch modeling and experimental studies. J. Taiwan Inst. Chem. Eng. 2016, 63, 116–124. [Google Scholar] [CrossRef]
- Haghseresht, F.; Lu, G.Q. Adsorption characteristics of phenolic compounds onto coal-reject-derived adsorbents. Energy Fuels 1998, 12, 1100–1107. [Google Scholar] [CrossRef]
- Ania, C.O.; Parra, J.B.; Pis, J.J. Effect of texture and surface chemistry on adsorptive capacities of activated carbons for phenolic compounds removal. Fuel Process. Technol. 2002, 77, 337–343. [Google Scholar] [CrossRef]
- Cheng, W.P.; Gao, W.; Cui, X.; Ma, J.H.; Li, R.F. Phenol adsorption equilibrium and kinetics on zeolite X/activated carbon composite. J. Taiwan Inst. Chem. Eng. 2016, 62, 192–198. [Google Scholar] [CrossRef]
- Lorenc-Grabowska, E.; Diez, M.A.; Gryglewicz, G. Influence of pore size distribution on the adsorption of phenol on pet-based activated carbons. J. Colloid Interface Sci. 2016, 469, 205–212. [Google Scholar] [CrossRef] [PubMed]
- Chakraborty, A.; Deva, D.; Sharma, A.; Verma, N. Adsorbents based on carbon microfibers and carbon nanofibers for the removal of phenol and lead from water. J. Colloid Interface Sci. 2011, 359, 228–239. [Google Scholar] [CrossRef] [PubMed]
- Larous, S.; Meniai, A.H. The use of sawdust as by product adsorbent of organic pollutant from wastewater: Adsorption of phenol. Energy Procedia 2012, 18, 905–914. [Google Scholar]
- Arellano-Cárdenas, S.; Gallardo-Velázquez, T.; Osorio-Revilla, G.; del Socorro López-Cortéz, M.; Gómez-Perea, B. Adsorption of phenol and dichlorophenols from aqueous solutions by porous clay heterostructure (PCH). J. Mex. Chem. Soc. 2005, 49, 287–291. [Google Scholar]
- Asmaly, H.A.; Abussaud, B.; Ihsanullah; Saleh, T.A.; Gupta, V.K.; Atieh, M.A. Ferric oxide nanoparticles decorated carbon nanotubes and carbon nanofibers: From synthesis to enhanced removal of phenol. J. Saudi Chem. Soc. 2015, 19, 511–520. [Google Scholar] [CrossRef]
- Tao, X.; Zhou, G.; Zhuang, X.; Cheng, B.; Li, X.; Li, H. Solution blowing of activated carbon nanofibers for phenol adsorption. RSC Adv. 2015, 5, 5801–5808. [Google Scholar] [CrossRef]
- Lin, K.; Pan, J.; Chen, Y.; Cheng, R.; Xu, X. Study the adsorption of phenol from aqueous solution on hydroxyapatite nanopowders. J. Hazard. Mater. 2009, 161, 231–240. [Google Scholar] [CrossRef] [PubMed]
- Abd El Salam, H.M.; Younis, S.A.; Ali, H.R.; Zaki, T. Statistical modeling and optimization of phenol adsorption from water by modified Cu3(BTC)2: Kinetic, isotherm, and thermodynamic analysis. Microporous Mesoporous Mater. 2017, 241, 210–217. [Google Scholar] [CrossRef]
- Yu, Y.; Hu, Z.; Wang, Y.; Gao, H. Magnetic sn-functionalized diatomite for effective removals of phenols. Int. J. Miner. Process. 2017, 162, 1–5. [Google Scholar] [CrossRef]
- Changmai, M.; Purkait, M.K. Kinetics, equilibrium and thermodynamic study of phenol adsorption using NiFe2O4 nanoparticles aggregated on PAC. J. Water Process Eng. 2017, 16, 90–97. [Google Scholar] [CrossRef]
- Lin, D.; Xing, B. Adsorption of phenolic compounds by carbon nanotubes: Role of aromaticity and substitution of hydroxyl groups. Environ. Sci. Technol. 2008, 42, 7254–7259. [Google Scholar] [CrossRef] [PubMed]
- Soni, U.; Bajpai, J.; Singh, S.K.; Bajpai, A.K. Evaluation of chitosan-carbon based biocomposite for efficient removal of phenols from aqueous solutions. J. Water Process Eng. 2017, 16, 56–63. [Google Scholar] [CrossRef]
- Han, T.; Xiao, Y.; Tong, M.; Huang, H.; Liu, D.; Wang, L.; Zhong, C. Synthesis of CNT@MIL-68(Al) composites with improved adsorption capacity for phenol in aqueous solution. Chem. Eng. J. 2015, 275, 134–141. [Google Scholar] [CrossRef]
- Dehghani, M.H.; Mostofi, M.; Alimohammadi, M.; McKay, G.; Yetilmezsoy, K.; Albadarin, A.B.; Heibati, B.; AlGhouti, M.; Mubarak, N.M.; Sahu, J.N. High-performance removal of toxic phenol by single-walled and multi-walled carbon nanotubes: Kinetics, adsorption, mechanism and optimization studies. J. Ind. Eng. Chem. 2016, 35, 63–74. [Google Scholar] [CrossRef]
- Norzilah, A.H.; Fakhru’l-Razi, A.; Choong, T.S.Y.; Chuah, A.L. Surface modification effects on CNTs adsorption of methylene blue and phenol. J. Nanomater. 2011, 2011, 18. [Google Scholar] [CrossRef]
- Wang, X.; Lu, M.; Wang, H.; Pei, Y.; Rao, H.; Du, X. Three-dimensional graphene aerogels–mesoporous silica frameworks for superior adsorption capability of phenols. Separ. Purif. Technol. 2015, 153, 7–13. [Google Scholar] [CrossRef]
- Ipek, I.; Kabay, N.; Yüksel, M. Separation of bisphenol a and phenol from water by polymer adsorbents: Equilibrium and kinetics studies. J. Water Process Eng. 2017, 16, 206–211. [Google Scholar] [CrossRef]
- Li, X.; Chen, S.; Fan, X.; Quan, X.; Tan, F.; Zhang, Y.; Gao, J. Adsorption of ciprofloxacin, bisphenol and 2-chlorophenol on electrospun carbon nanofibers: In comparison with powder activated carbon. J. Colloid Interface Sci. 2015, 447, 120–127. [Google Scholar] [CrossRef] [PubMed]
- Aktaş, Ö.; Çeçen, F. Adsorption, desorption and bioregeneration in the treatment of 2-chlorophenol with activated carbon. J. Hazard. Mater. 2007, 141, 769–777. [Google Scholar] [CrossRef] [PubMed]
- Peng, S.; Tang, Z.; Jiang, W.; Wu, D.; Hong, S.; Xing, B. Mechanism and performance for adsorption of 2-chlorophenol onto zeolite with surfactant by one-step process from aqueous phase. Sci. Total Environ. 2017, 581–582, 550–558. [Google Scholar] [CrossRef] [PubMed]
- Soltani, T.; Lee, B.-K. Mechanism of highly efficient adsorption of 2-chlorophenol onto ultrasonic graphene materials: Comparison and equilibrium. J. Colloid Interface Sci. 2016, 481, 168–180. [Google Scholar] [CrossRef] [PubMed]
- Huong, P.-T.; Lee, B.-K.; Kim, J. Improved removal of 2-chlorophenol by a synthesized Cu-nano zeolite. Process Saf. Environ. Prot. 2016, 100, 272–280. [Google Scholar] [CrossRef]
- Niu, J.; Xu, J.; Dai, Y.; Xu, J.; Guo, H.; Sun, K.; Liu, R. Immobilization of horseradish peroxidase by electrospun fibrous membranes for adsorption and degradation of pentachlorophenol in water. J. Hazard. Mater. 2013, 246–247, 119–125. [Google Scholar] [CrossRef] [PubMed]
- Leyva-Ramos, R.; Diaz-Flores, P.E.; Leyva-Ramos, J.; Femat-Flores, R.A. Kinetic modeling of pentachlorophenol adsorption from aqueous solution on activated carbon fibers. Carbon 2007, 45, 2280–2289. [Google Scholar] [CrossRef]
- Abdel Salam, M.; Burk, R.C. Thermodynamics of pentachlorophenol adsorption from aqueous solutions by oxidized multi-walled carbon nanotubes. Appl. Surf. Sci. 2008, 255, 1975–1981. [Google Scholar] [CrossRef]
- Domínguez-Vargas, J.R.; Navarro-Rodríguez, J.A.; de Heredia, J.B.; Cuerda-Correa, E.M. Removal of chlorophenols in aqueous solution by carbon black low-cost adsorbents. Equilibrium study and influence of operation conditions. J. Hazard. Mater. 2009, 169, 302–308. [Google Scholar] [CrossRef] [PubMed]
- Devi, P.; Saroha, A.K. Synthesis of the magnetic biochar composites for use as an adsorbent for the removal of pentachlorophenol from the effluent. Bioresour. Technol. 2014, 169, 525–531. [Google Scholar] [CrossRef] [PubMed]
- Devi, P.; Saroha, A.K. Simultaneous adsorption and dechlorination of pentachlorophenol from effluent by ni–zvi magnetic biochar composites synthesized from paper mill sludge. Chem. Eng. J. 2015, 271, 195–203. [Google Scholar] [CrossRef]
- Zhu, D.; Zhang, H.; Tao, Q.; Xu, Z.; Zheng, S. Surface functionalized mesoporous silicas as adsorbents for aromatic contaminants in aqueous solution. Environ. Toxicol. Chem. 2009, 28, 1400–1408. [Google Scholar] [CrossRef] [PubMed]
- Yang, B.; Xu, D.; Wu, X.; Li, Z.; Lei, L.; Zhang, X. Efficient removal of pentachlorophenol from wastewater by novel hydrophobically modified thermo-sensitive hydrogels. J. Ind. Eng. Chem. 2015, 25, 67–72. [Google Scholar] [CrossRef]
- Zhang, Y.; Long, Y.; Yuancheng, Z.; Zhu, Y.; Wang, H.; Wu, H.; Lu, W. Effect of a mixed anionic-nonionic surfactant adsorption on bentonite structure and on distribution of pentachlorophenol. Appl. Clay Sci. 2012, 69, 93–98. [Google Scholar] [CrossRef]
- Estevinho, B.N.; Ratola, N.; Alves, A.; Santos, L. Pentachlorophenol removal from aqueous matrices by sorption with almond shell residues. J. Hazard. Mater. 2006, 137, 1175–1181. [Google Scholar] [CrossRef] [PubMed]
- Mathialagan, T.; Viraraghavan, T. Biosorption of pentachlorophenol from aqueous solutions by a fungal biomass. Bioresour. Technol. 2009, 100, 549–558. [Google Scholar] [CrossRef] [PubMed]
- Atieh, M.A. Removal of phenol from water different types of carbon—A comparative analysis. APCBEE Procedia 2014, 10, 136–141. [Google Scholar] [CrossRef]
- Zhou, Q.; Xu, R. Adsorption of 2,4-dichlorophenol on meta-aramid/poly (acrylic acid) composite nanofibrous membranes. Adv. Mater. Res. 2013, 610–613, 551–555. [Google Scholar]
- Salame, I.I.; Bandosz, T.J. Role of surface chemistry in adsorption of phenol on activated carbons. J. Colloid Interface Sci. 2003, 264, 307–312. [Google Scholar] [CrossRef]
- Youssef, A.M.; Malhat, F.M.; Abd El-Hakim, A.F.A. Preparation and utilization of polystyrene nanocomposites based on TiO2 nanowires. Polym. Plast. Technol. Eng. 2013, 52, 228–235. [Google Scholar] [CrossRef]
- El Bakouri, H.; Usero, J.; Morillo, J.; Rojas, R.; Ouassini, A. Drin pesticides removal from aqueous solutions using acid-treated date stones. Bioresour. Technol. 2009, 100, 2676–2684. [Google Scholar] [CrossRef] [PubMed]
- Yue, X.; Feng, S.; Li, S.; Jing, Y.; Shao, C. Bromopropyl functionalized silica nanofibers for effective removal of trace level dieldrin from water. Colloids Surf. A Physicochem. Eng. Asp. 2012, 406, 44–51. [Google Scholar] [CrossRef]
- Huo, J.; Wang, Y. Preparation and characteristics of novel fibers based on cellulose acetate and soy lecithin for attracting and binding pops. J. Geosci. Environ. Prot. 2015, 3, 1–8. [Google Scholar] [CrossRef]
- Shrivas, K.; Ghosale, A.; Nirmalkar, N.; Srivastava, A.; Singh, S.K.; Shinde, S.S. Removal of endrin and dieldrin isomeric pesticides through stereoselective adsorption behavior on the graphene oxide-magnetic nanoparticles. Environ. Sci. Pollut. Res. Int. 2017, 24, 24980–24988. [Google Scholar] [CrossRef] [PubMed]
- Jia, R.; Liu, H.; Qu, J.; Qu, A.; Dai, R. Characterization and adsorption behavior of a novel triolein-embedded activated carbon composite adsorbent. Chin. Sci. Bull. 2005, 50, 2788–2790. [Google Scholar] [CrossRef]
- Bandala, E.R.; Andres-Octaviano, J.; Pastrana, P.; Torres, L.G. Removal of aldrin, dieldrin, heptachlor, and heptachlor epoxide using activated carbon and/or pseudomonas fluorescens free cell cultures. J. Environ. Sci. Health Part B 2006, 41, 553–569. [Google Scholar] [CrossRef] [PubMed]
- Zolfaghari, G. B-cyclodextrin incorporated nanoporous carbon: Host–guest inclusion for removal of p-nitrophenol and pesticides from aqueous solutions. Chem. Eng. J. 2016, 283, 1424–1434. [Google Scholar] [CrossRef]
- Liu, H.; Ru, J.; Qu, J.; Dai, R.; Wang, Z.; Hu, C. Removal of persistent organic pollutants from micro-polluted drinking water by triolein embedded absorbent. Bioresour. Technol. 2009, 100, 2995–3002. [Google Scholar] [CrossRef] [PubMed]
- Feng, S.; Ma, F.; Liu, R.; Li, S.; Li, X.; Jin, Y.; Fu, G.; Yue, X. Highly efficient removal of trace level dieldrin from water resources utilizing a cerasomal strategy. J. Mater. Chem. A 2016, 4, 10263–10273. [Google Scholar] [CrossRef]
- Mac Rae, I.C. Removal of chlorinated hydrocarbons from water and wastewater by bacterial cells adsorbed to magnetite. Water Res. 1986, 20, 1149–1152. [Google Scholar] [CrossRef]
- Liu, H.; Sha, W.; Cooper, A.T.; Fan, M. Preparation and characterization of a novel silica aerogel as adsorbent for toxic organic compounds. Colloids Surf. A Physicochem. Eng. Asp. 2009, 347, 38–44. [Google Scholar] [CrossRef]
- Gebrekidan, A.; Nicolai, H.; Vincken, L.; Teferi, M.; Asmelash, T.; Dejenie, T.; Zerabruk, S.; Gebrehiwet, K.; Bauer, H.; Deckers, J.; et al. Pesticides removal by filtration over cactus pear leaves: A cheap and natural method for small-scale water purification in semi-arid regions. CLEAN Soil Air Water 2013, 41, 235–243. [Google Scholar] [CrossRef]
- El Bakouri, H.; Usero, J.; Morillo, J.; Ouassini, A. Adsorptive features of acid-treated olive stones for drin pesticides: Equilibrium, kinetic and thermodynamic modeling studies. Bioresour. Technol. 2009, 100, 4147–4155. [Google Scholar] [CrossRef] [PubMed]
- Ozcan, S.; Tor, A.; Aydin, M.E. An investigation on the sorption behaviour of montmorillonite for selected organochlorine pesticides from water. Environ. Technol. 2012, 33, 1239–1245. [Google Scholar] [CrossRef] [PubMed]
- Sprynskyy, M.; Ligor, T.; Buszewski, B. Clinoptilolite in study of lindane and aldrin sorption processes from water solution. J. Hazard. Mater. 2008, 151, 570–577. [Google Scholar] [CrossRef] [PubMed]
- Seyhi, B.; Drogui, P.; Gortares-Moroyoqui, P.; Estrada-Alvarado, M.I.; Alvarez, L.H. Adsorption of an organochlorine pesticide using activated carbon produced from an agro-waste material. J. Chem. Technol. Biotechnol. 2014, 89, 1811–1816. [Google Scholar] [CrossRef]
- Ratola, N.; Botelho, C.; Alves, A. The use of pine bark as a natural adsorbent for persistent organic pollutants—Study of lindane and heptachlor adsorption. J. Chem. Technol. Biotechnol. 2003, 78, 347–351. [Google Scholar] [CrossRef]
- Peng, X.; Wang, J.; Fan, B.; Luan, Z. Sorption of endrin to montmorillonite and kaolinite clays. J. Hazard. Mater. 2009, 168, 210–214. [Google Scholar] [CrossRef] [PubMed]
- Gupta, V.K.; Fakhri, A.; Agarwal, S.; Sadeghi, N. Synthesis of MnO2/cellulose fiber nanocomposites for rapid adsorption of insecticide compound and optimization by response surface methodology. Int. J. Biol. Macromol. 2017, 102, 840–846. [Google Scholar] [CrossRef] [PubMed]
- Celebioglu, A.; Demirci, S.; Uyar, T. Cyclodextrin-grafted electrospun cellulose acetate nanofibers via “click” reaction for removal of phenanthrene. Appl. Surf. Sci. 2014, 305, 581–588. [Google Scholar] [CrossRef] [Green Version]
- Ertas, Y.; Uyar, T. Fabrication of cellulose acetate/polybenzoxazine cross-linked electrospun nanofibrous membrane for water treatment. Carbohydr. Polym. 2017, 177, 378–387. [Google Scholar] [CrossRef] [PubMed]
- Perrard, A.; Descorme, C. Static and dynamic adsorption studies of polychlorobiphenyls (PCBs) over activated carbons. Chemosphere 2016, 145, 528–534. [Google Scholar] [CrossRef] [PubMed]
- Barreca, S.; Orecchio, S.; Pace, A. The effect of montmorillonite clay in alginate gel beads for polychlorinated biphenyl adsorption: Isothermal and kinetic studies. Appl. Clay Sci. 2014, 99, 220–228. [Google Scholar] [CrossRef]
- Zeng, S.; Gan, N.; Weideman-Mera, R.; Cao, Y.; Li, T.; Sang, W. Enrichment of polychlorinated biphenyl 28 from aqueous solutions using fe3o4 grafted graphene oxide. Chem. Eng. J. 2013, 218, 108–115. [Google Scholar] [CrossRef]
- Han, C.; Cai, W.; Tang, W.; Wang, G.; Liang, C. Protein assisted hydrothermal synthesis of ultrafine magnetite nanoparticle built-porous oriented fibers and their structurally enhanced adsorption to toxic chemicals in solution. J. Mater. Chem. 2011, 21, 11188–11196. [Google Scholar] [CrossRef]
- Cho, E.; Tahir, M.N.; Choi, J.M.; Kim, H.; Yu, J.-H.; Jung, S. Novel magnetic nanoparticles coated by benzene- and β-cyclodextrin-bearing dextran, and the sorption of polycyclic aromatic hydrocarbon. Carbohydr. Polym. 2015, 133, 221–228. [Google Scholar] [CrossRef] [PubMed]
- Morimoto, T.; Kittaka, S. Isoelectric point of manganese oxide. Bull. Chem. Soc. Jpn. 1974, 47, 2. [Google Scholar] [CrossRef]
- Sookne, A.; Harris, M. Surface characteristics of cotton fibers, as indicated by electrophoretic studies. J. Res. Natl. Bur. Stand. 1941, 26, 65–69. [Google Scholar] [CrossRef]
- Electrospintech. Electrospinning Mass Production Output. Available online: http://electrospintech.com/production-level.html#.Wl2WIGeW58E (accessed on 15 January 2018).
- Luo, C.J.; Stoyanov, S.D.; Stride, E.; Pelan, E.; Edirisinghe, M. Electrospinning versus fibre production methods: From specifics to technological convergence. Chem. Soc. Rev. 2012, 41, 4708–4735. [Google Scholar] [CrossRef] [PubMed]
- Sarkar, K.; Gomez, C.; Zambrano, S.; Ramirez, M.; de Hoyos, E.; Vasquez, H.; Lozano, K. Electrospinning to forcespinning™. Mater. Today 2010, 13, 12–14. [Google Scholar] [CrossRef]
Figure 1.
Adsorption removal (%) related to adsorbent specific surface area for different adsorptive structures and for different adsorbent compositions against Alachlor (A,B), Atrazine (C,D) and Diazinon (E,F).
Figure 1.
Adsorption removal (%) related to adsorbent specific surface area for different adsorptive structures and for different adsorbent compositions against Alachlor (A,B), Atrazine (C,D) and Diazinon (E,F).

Figure 2.
Adsorption capacity (mg/g) related to the adsorbent diameter against Atrazine.

Figure 3.
Adsorption capacity (mg/g) related to the adsorbent pore volume against Atrazine.

Figure 4.
Relation between adsorbent dose (blue column, left scale), initial pesticide concentration (green column, middle right scale) and adsorption capacity (red scatter, far left scale) in the adsorption of Alachlor (A); Atrazine (B); Chlorpyrifos (C) and Diazinon (D).
Figure 4.
Relation between adsorbent dose (blue column, left scale), initial pesticide concentration (green column, middle right scale) and adsorption capacity (red scatter, far left scale) in the adsorption of Alachlor (A); Atrazine (B); Chlorpyrifos (C) and Diazinon (D).

Figure 5.
Adsorption capacity related to adsorbent specific surface area for different adsorptive structures and different adsorbent compositions against Phenol (A,B); 2-Chlorophenol (C,D) and Pentachlorophenol (E,F).
Figure 5.
Adsorption capacity related to adsorbent specific surface area for different adsorptive structures and different adsorbent compositions against Phenol (A,B); 2-Chlorophenol (C,D) and Pentachlorophenol (E,F).


Figure 6.
Phenol adsorption capacity related to the pore size of different adsorbent structures (A) and compositions (B).
Figure 6.
Phenol adsorption capacity related to the pore size of different adsorbent structures (A) and compositions (B).

Figure 7.
Adsorption performance related to the adsorption test pH for several adsorbents compositions, against Phenol (A); 2-Chlorophenol (B); and Pentachlorophenol (C).
Figure 7.
Adsorption performance related to the adsorption test pH for several adsorbents compositions, against Phenol (A); 2-Chlorophenol (B); and Pentachlorophenol (C).


Figure 8.
Adsorption performance related to the adsorption test equilibrium time against Phenol, for several adsorbents structures (A) and compositions (B).
Figure 8.
Adsorption performance related to the adsorption test equilibrium time against Phenol, for several adsorbents structures (A) and compositions (B).

Figure 9.
Relationship between adsorbent dose (blue column, left scale), initial pesticide concentration (green column, middle right scale) and adsorption capacity (red scatter, far left scale) in the adsorption of Phenol (A); 2-Chlorophenol (B) and Pentachlorophenol (C).
Figure 9.
Relationship between adsorbent dose (blue column, left scale), initial pesticide concentration (green column, middle right scale) and adsorption capacity (red scatter, far left scale) in the adsorption of Phenol (A); 2-Chlorophenol (B) and Pentachlorophenol (C).

Figure 10.
Relationship between adsorbent dose (blue column, left scale), initial pesticide concentration (green column, middle right scale) and adsorption capacity (red scatter, far left scale) in the adsorption of Aldrin (A); Dieldrin (B); Endrin (C); and Heptachlor/epoxide (D). Insufficient data reported for Chlordane and Toxaphene.

Figure 11.
Graphs showing the proportion between adsorbent dose (blue column, left scale), initial pesticide concentration (green column, middle right scale) and adsorption capacity (red scatter, far left scale) in the adsorption of PCBs (A) and Phenantrene (B).
Figure 11.
Graphs showing the proportion between adsorbent dose (blue column, left scale), initial pesticide concentration (green column, middle right scale) and adsorption capacity (red scatter, far left scale) in the adsorption of PCBs (A) and Phenantrene (B).


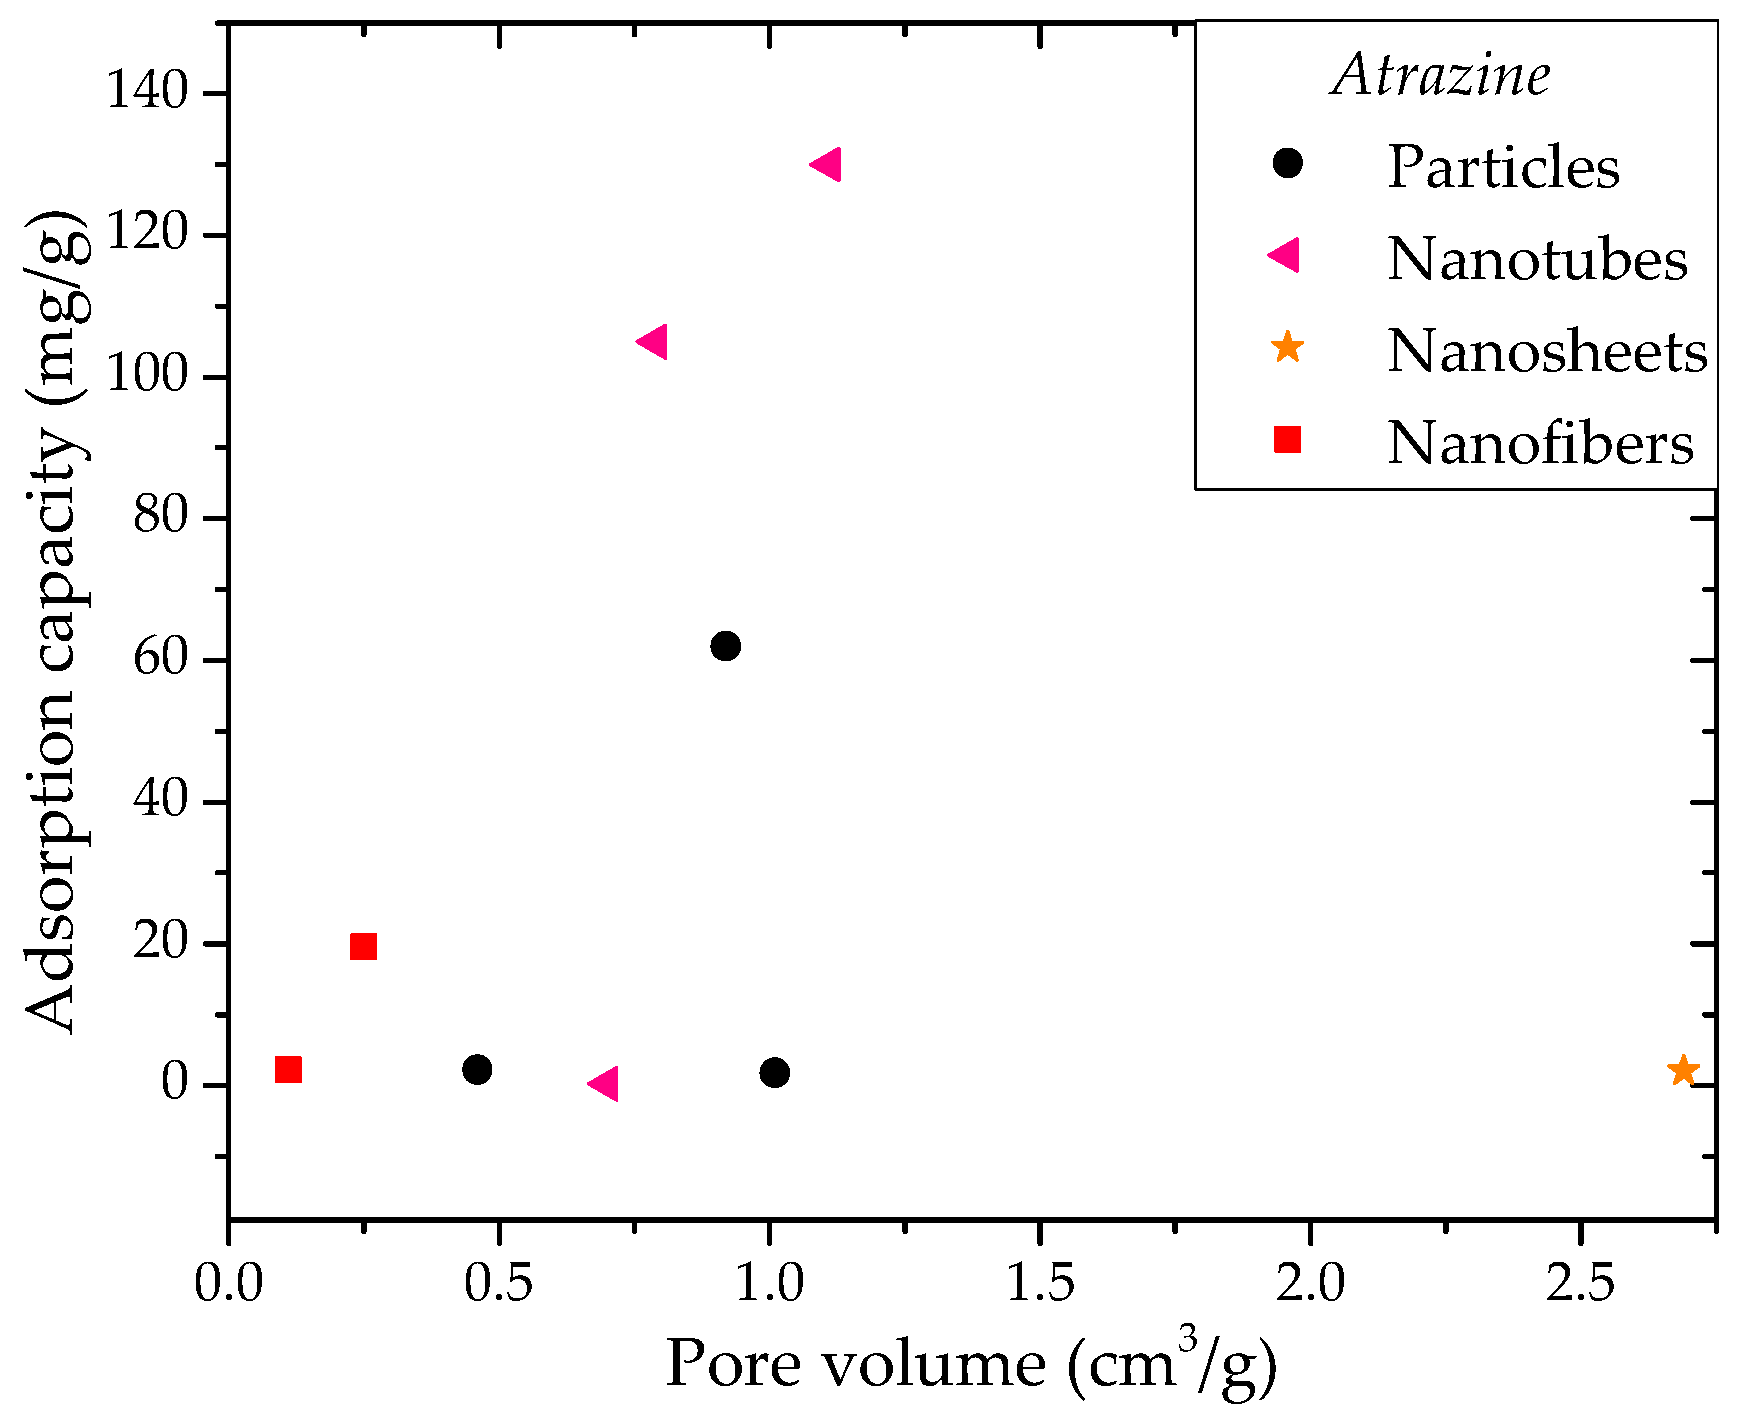
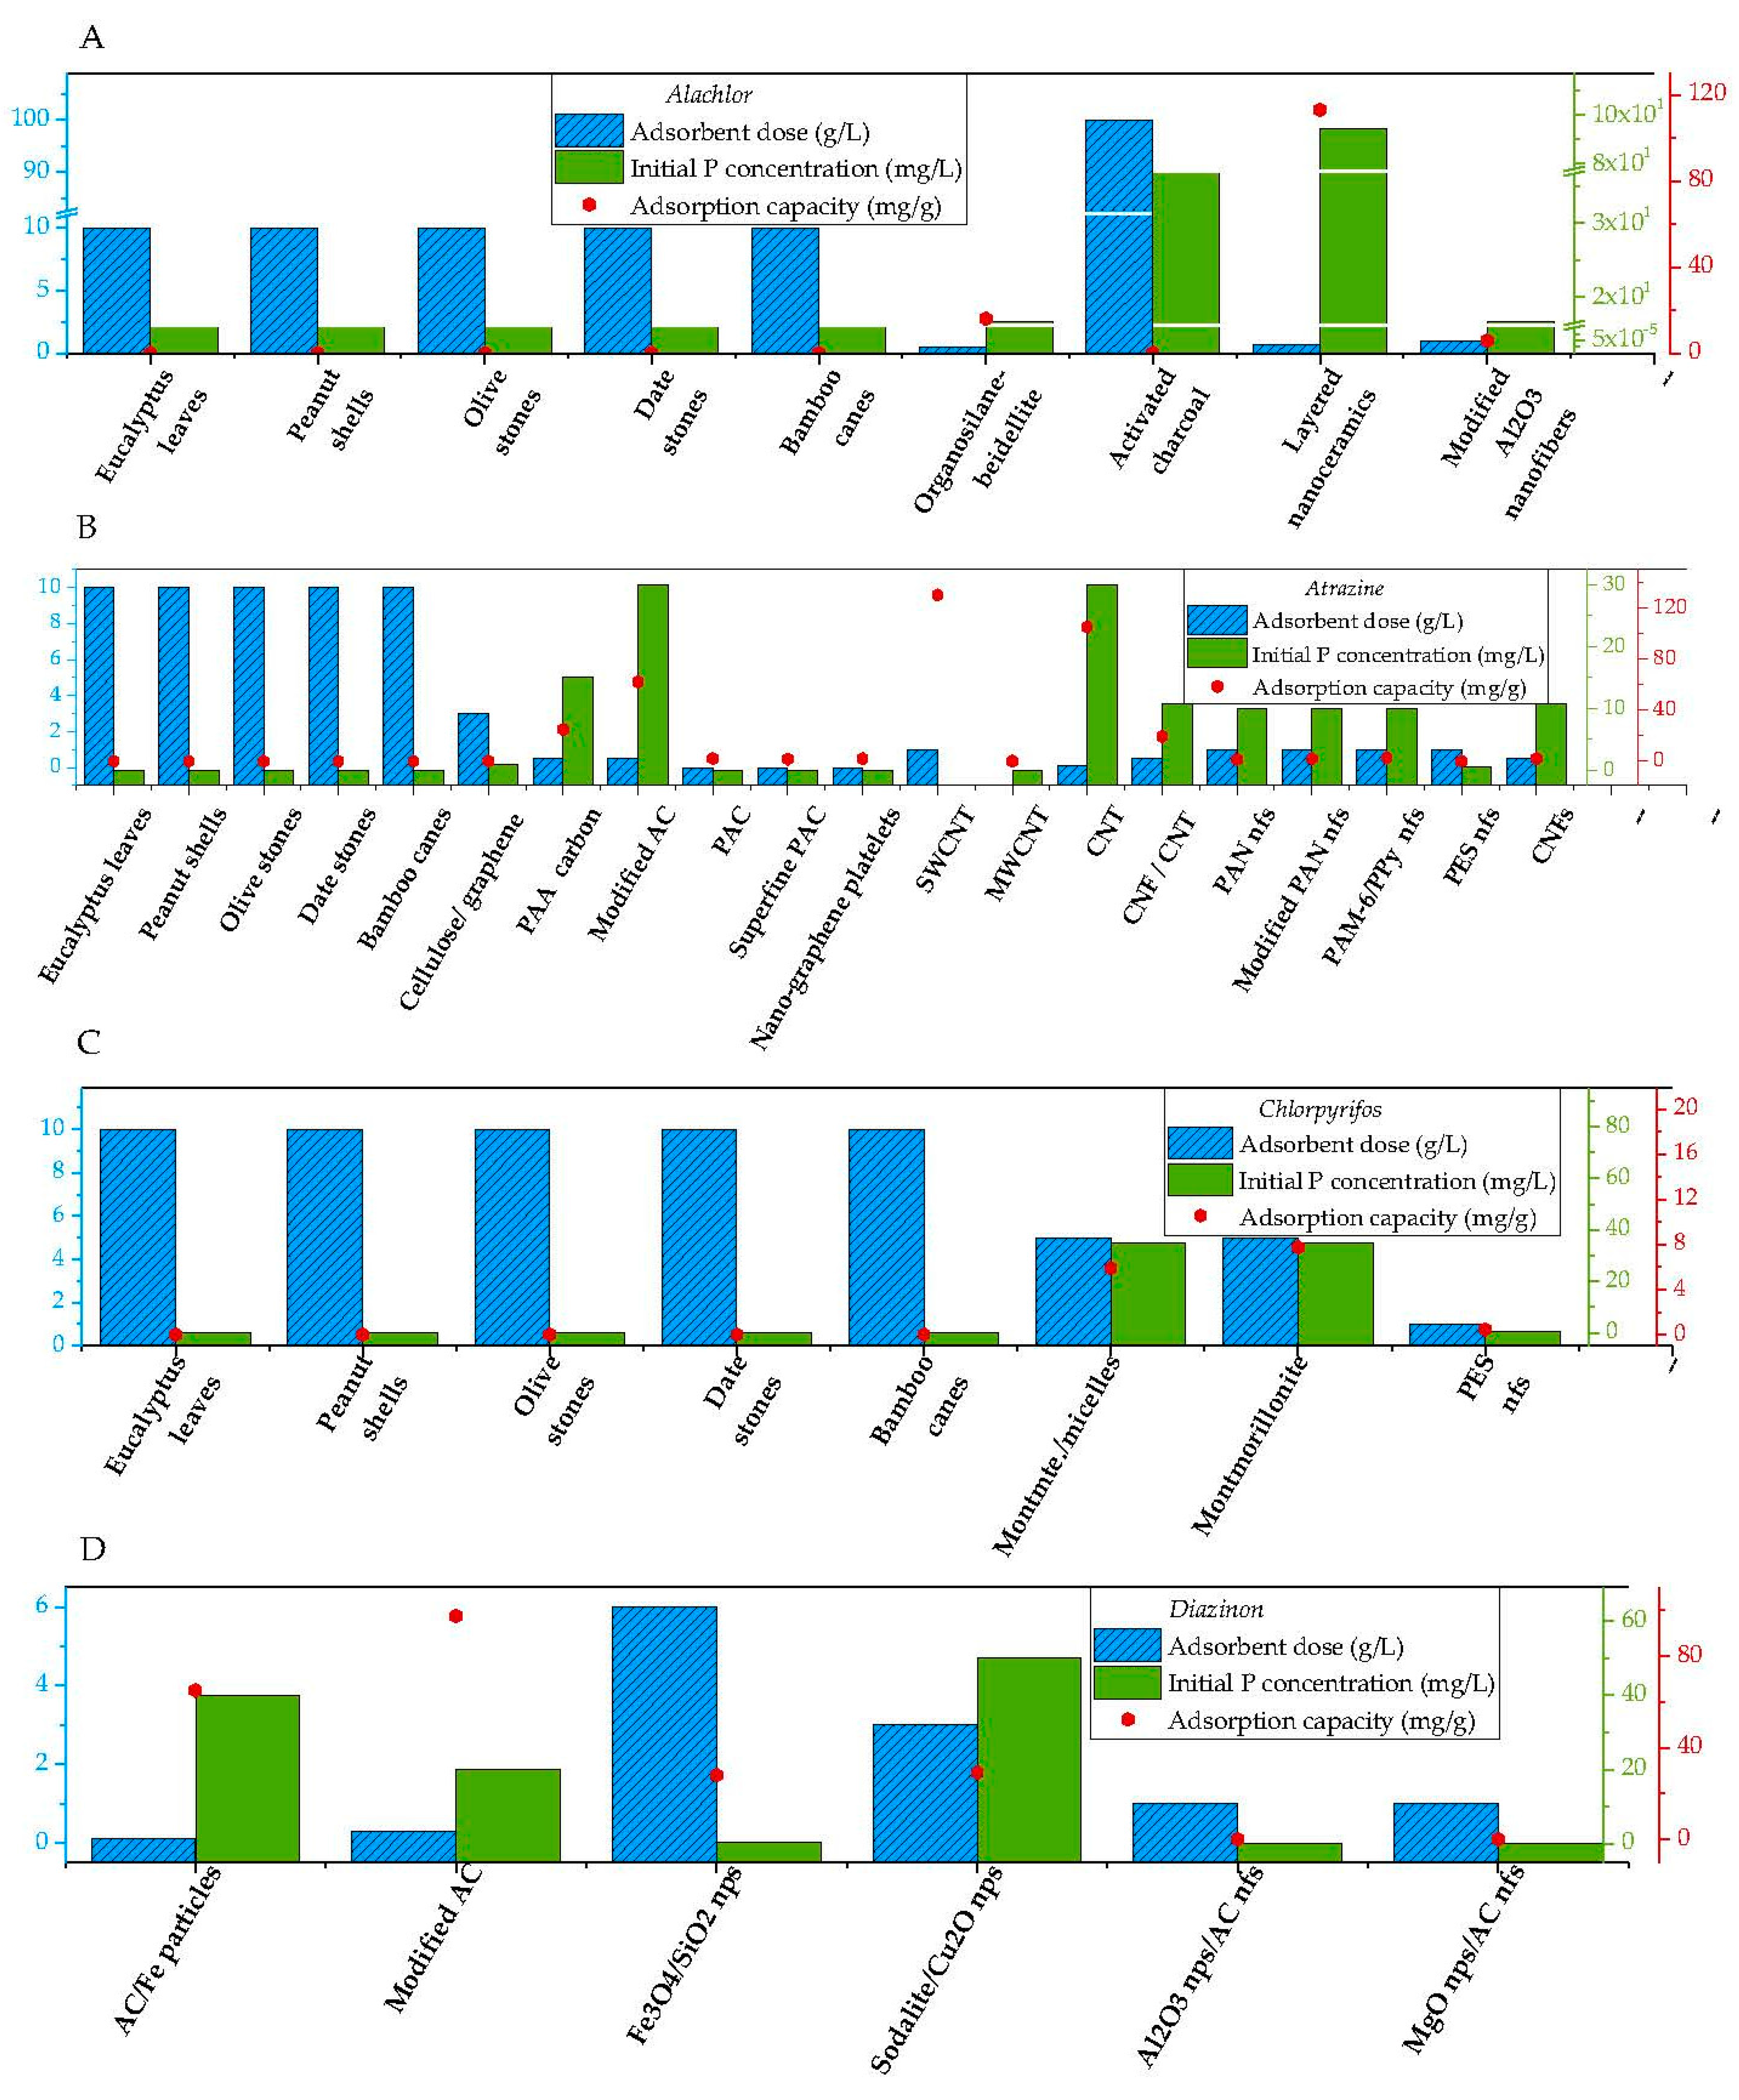
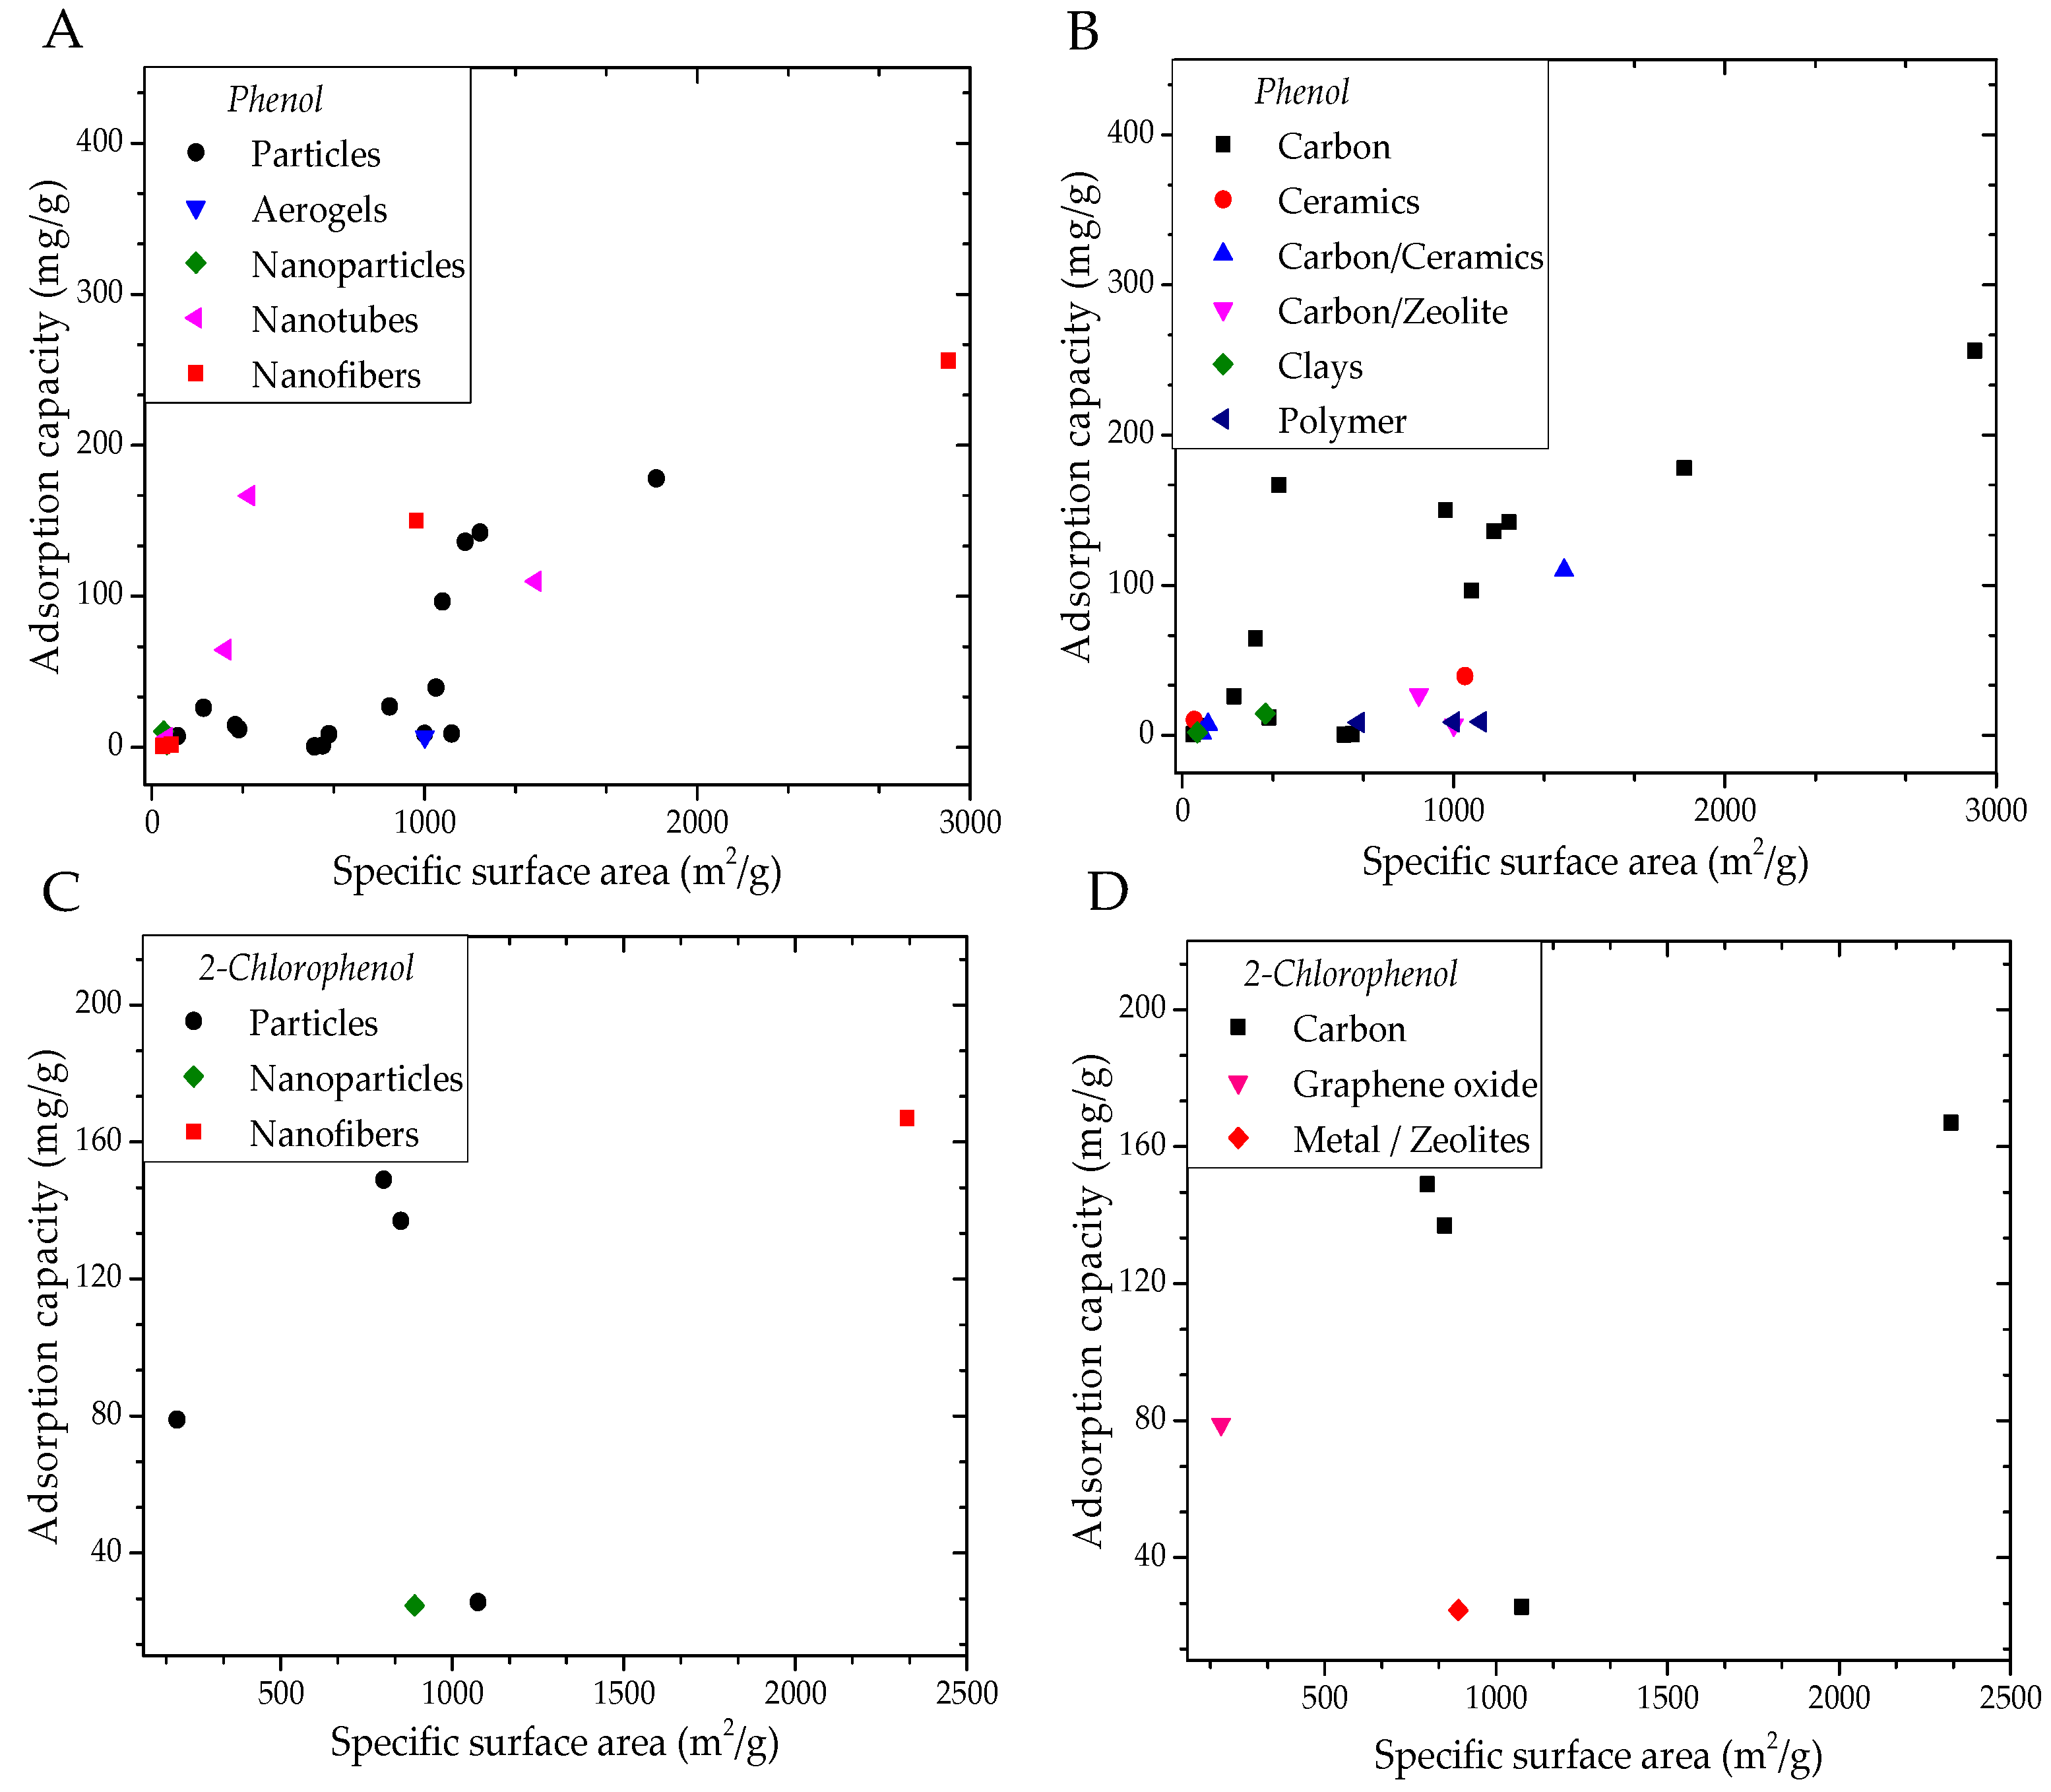
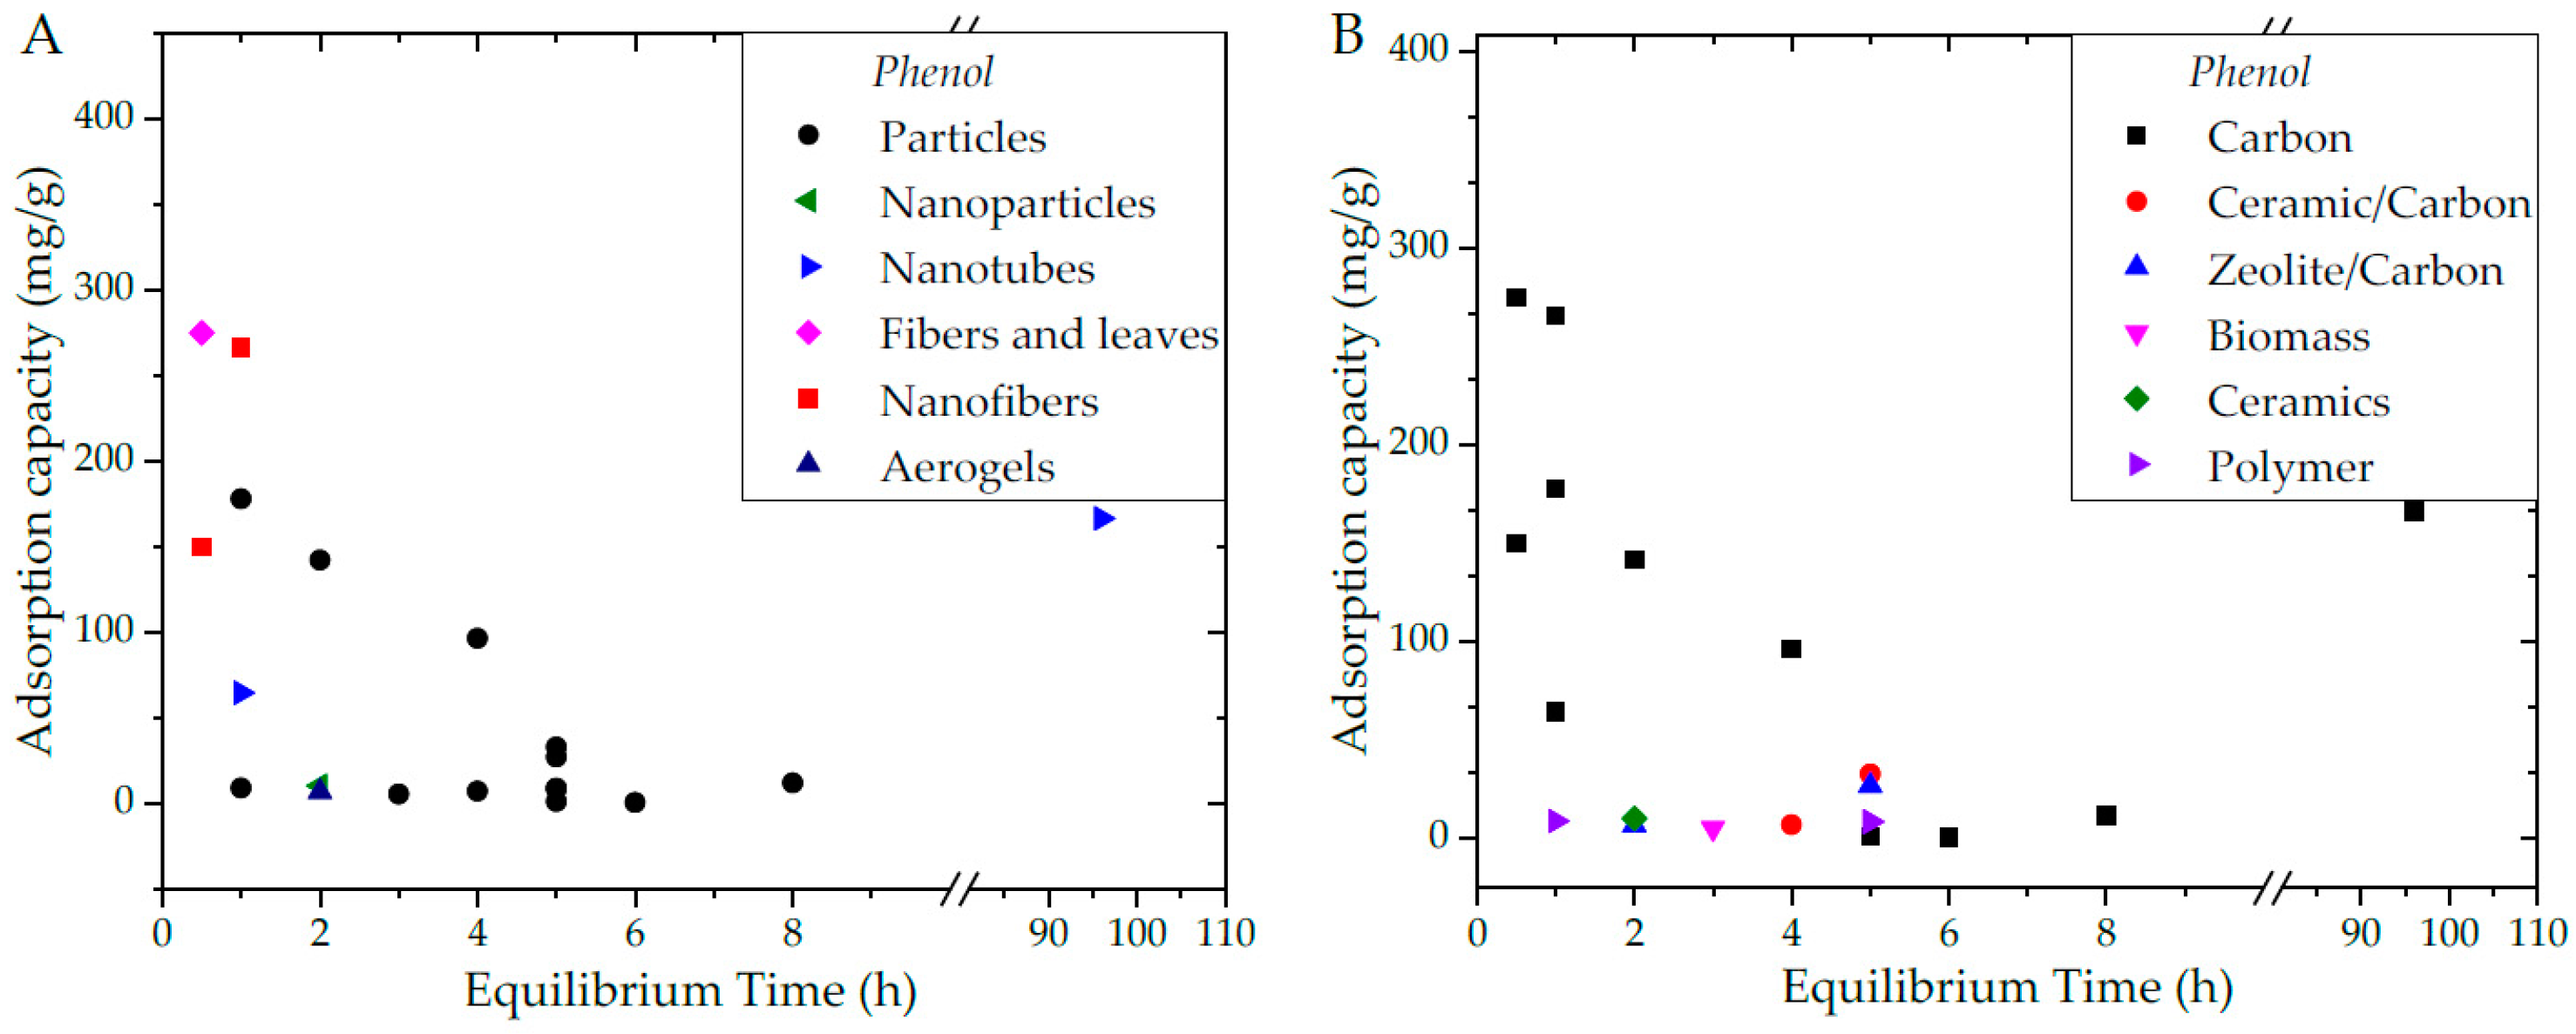
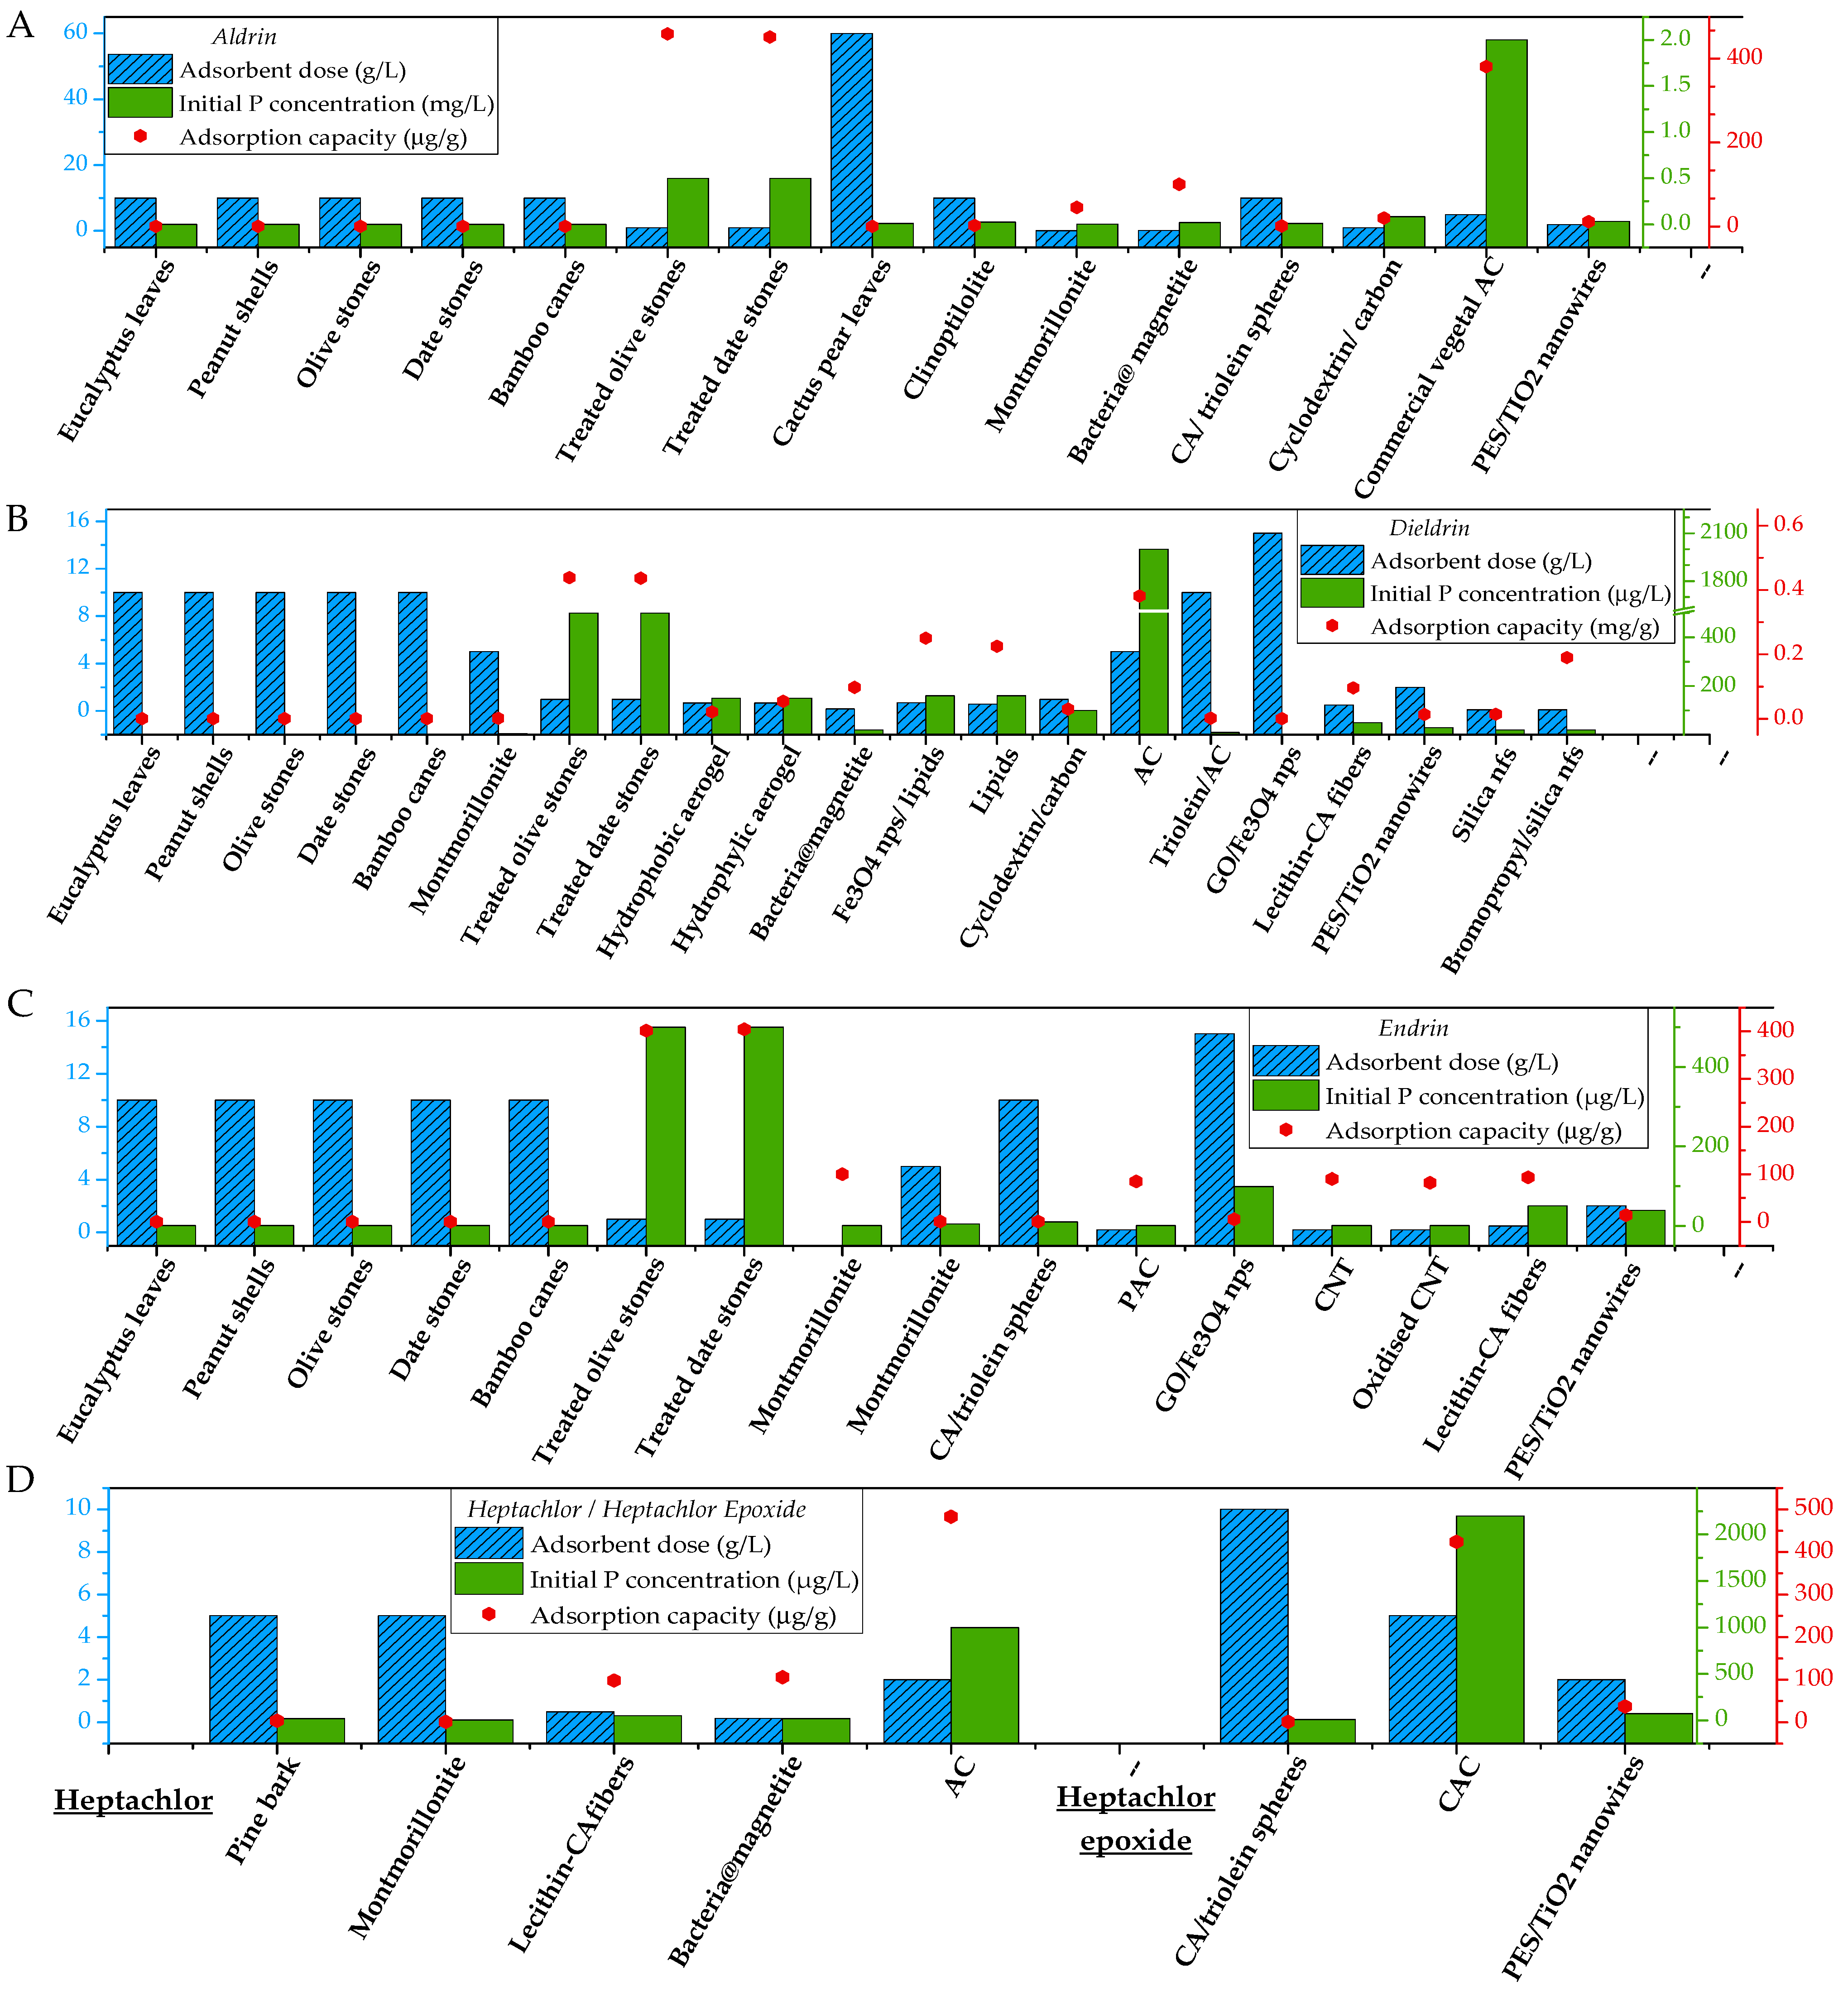
Table 1.
Characteristics of Alachlor, Atrazine, Chlorpyrifos and Diazinon [26].
Table 1.
Characteristics of Alachlor, Atrazine, Chlorpyrifos and Diazinon [26].
| Name | Molecular | Log Kow | Solubility in Water (mg/L, 25 °C) | 2D Structure | H Bound Count | ||
|---|---|---|---|---|---|---|---|
| Weight (g/mol) | Formula | Donor | Acceptor | ||||
| Alachlor | 269.769 | C14H20ClNO2 | 3.52 | 240 |  | 0 | 2 |
| Atrazine | 215.685 | C8H14ClN5 | 2.61 | 34.7 |  | 5 | 2 |
| Chlorpyrifos | 350.575 | C9H11Cl3NO3PS | 4.96 | 1.4 |  | 5 | 0 |
| Diazinon | 304.345 | C12H21N2O3PS | 3.81 | 60 |  | 6 | 0 |
Table 2.
Nanofibrous adsorbent properties and adsorption conditions for the removal of Alachlor. BET: specific surface area.
Table 2.
Nanofibrous adsorbent properties and adsorption conditions for the removal of Alachlor. BET: specific surface area.
| N | Adsorbent | Adsorbent Properties | Adsorption Capacity (mg/g) | Adsorption Conditions | Removal (%) | Ref. | ||||||||
|---|---|---|---|---|---|---|---|---|---|---|---|---|---|---|
| BET (m2/g) | Pore Volume (cm³/g) | Pore Diameter (nm) | Initial P Concentration (µg/L) | Adsorbent Dose (g/L) | pH | Temperature (°C) | Eq. Time (h) | Kinetic Model | Isotherm Model | |||||
| 1 | Organosilane-grafted alumina nanofibers | 252 | 1 | 11.4 | 5.8 | 10,000 | 1 | 23 | 2.6 | 58 | [28] | |||
| 2 | Organo/layered double hydroxide nanohybrids | 113 | 94,000 | 0.67 | 25 | 2.5 | 80.5 | [31] | ||||||
| 3 | Activated carbon | 1110 | 0.7 | 90 | 100 | 5 | [32] | |||||||
| 4 | Activated charcoal | 608 | 0.16 | 40,000 | 100 | 35 | Langmuir | 39.7 | [33] | |||||
| 5 | Organosilane-grafted acid-activated beidellite clay | 221 | 0.36 | 6.44 | 16 | 10,000 | 0.5 | 23 | 24 | 80 | [29] | |||
| 6 | Bamboo canes | 381 | 0.000018 | 0.5 | 10 | 6 | 40 | 7 | Pseudo I order | Freundlich | 35.7 | [16] | ||
| 7 | Date stones | 394 | 0.000012 | 0.5 | 10 | 6 | 40 | 7 | Pseudo I order | Freundlich | 24.0 | [16] | ||
| 8 | Olive stones | 379 | 0.000027 | 0.5 | 10 | 6 | 40 | 7 | Pseudo I order | Freundlich | 54.9 | [16] | ||
| 9 | Peanut shells | 368 | 0.000014 | 0.5 | 10 | 6 | 40 | 7 | Pseudo I order | Freundlich | 27.6 | [16] | ||
| 10 | Avocado stones | 342 | 0.000023 | 0.5 | 10 | 6 | 40 | 7 | Pseudo I order | Freundlich | 46.7 | [16] | ||
| 11 | Eucalyptus gomphocephala | 289 | 0.000021 | 0.5 | 10 | 6 | 40 | 7 | Pseudo I order | Freundlich | 41.5 | [16] | ||
| 12 | Raphanus raphanistrum | 296 | 0.000022 | 0.5 | 10 | 6 | 40 | 7 | Pseudo I order | Freundlich | 45.4 | [16] | ||
| 13 | Nerium oleander | 275 | 0.000022 | 0.5 | 10 | 6 | 40 | 7 | Pseudo I order | Freundlich | 45.2 | [16] | ||
| 14 | Origanum compactum | 306 | 0.000022 | 0.5 | 10 | 6 | 40 | 7 | Pseudo I order | Freundlich | 43.7 | [16] | ||
| 15 | Cistus landaniferus | 311 | 0.000027 | 0.5 | 10 | 6 | 40 | 7 | Pseudo I order | Freundlich | 54.4 | [16] | ||
Table 3.
Nanofibrous adsorbent properties and adsorption conditions for the removal of Diazinon.
| N | Adsorbent | Adsorbent Properties | Adsorption Capacity (mg/g) | Adsorption Conditions | Removal (%) | Ref. | ||||||||
|---|---|---|---|---|---|---|---|---|---|---|---|---|---|---|
| BET (m2/g) | Pore Volume (cm³/g) | pHZPC | Initial P Concentration (µg/L) | Adsorbent Dose (g/L) | pH | Temperature (°C) | Eq. Time (h) | Kinetic Model | Isotherm Model | |||||
| 1 | Activated carbon nanofibers with MgO nanoparticles | 600 | 0.9 | 0.11 | 200 | 1 | 0.5 | 55 | [34] | |||||
| 2 | Activated carbon nanofibers with Al2O3 nanoparticles | 550 | 0.9 | 0.1 | 200 | 1 | 0.5 | 50 | [34] | |||||
| 3 | Sodalite zeolite coated with Cu2O nanoparticles | 29.15 | 50,000 | 0.3 | 6 | 20 | 2 | Pseudo II order | Langmuir | 97.2 | [35] | |||
| 4 | Fe3O4/SiO2 nanocrystals | 208 | 2.8 | 28 | 400 | 6 | 6 | 25 | 0.8 | Pseudo II order | Langmuir | 100 | [36] | |
| 5 | NH4Cl modified activated carbon | 97.5 | 20,000 | 0.3 | 7 | 0.5 | Langmuir | 97.5 | [37] | |||||
| 6 | Activated carbon modified with Fe particles | 1112 | 0.663 | 4.01 | 65 | 40,000 | 0.1 | 6.5 | 25 | 2 | Pseudo II order | Langmuir | 16.3 | [38] |
Table 4.
Nanofibrous adsorbent properties and adsorption conditions for the removal of Atrazine.
| N | Adsorbent | Adsorbent Properties | Adsorption Capacity (mg/g) | Adsorption Conditions | Removal (%) | Ref. | |||||||||
|---|---|---|---|---|---|---|---|---|---|---|---|---|---|---|---|
| BET (m2/g) | Fiber Diameter (nm) | Pore Volume (cm³/g) | pHZPC | Initial P Concentration (µg/L) | Adsorbent Dose (g/L) | pH | Temperature (°C) | Eq. Time (h) | Kinetic Model | Isotherm Model | |||||
| 1 | Carbon nanofibers | 110 | 160 | 0.11 | 2.2 | 10,784 | 0.5 | 7 | 1 | 10.2 | [39] | ||||
| 2 | Polystyrene nanofibers | 0.095 | 500 | 1 | Lang. | 19.0 | [40] | ||||||||
| 3 | Nylon/Polypyrrole core shell nanofibers | 2.77 | 10,000 | 1 | 7 | 25 | 5 | Pseudo II order | Freund. | 27.7 | [41] | ||||
| 4 | Acid-modified polyacrylonitrile nanofibers | 180 | 2.02 | 10,000 | 1 | 25 | 0.5 | 20.2 | [41] | ||||||
| 5 | Polyacrylonitrile nanofibers | 160 | 1.6 | 10,000 | 1 | 25 | 0.5 | 15.8 | [41] | ||||||
| 6 | Carbon nanofiber/carbon nanotube composites | 310 | 100 | 0.25 | 19.5 | 10,784 | 0.5 | 7 | 1 | 90.4 | [39] | ||||
| 7 | Carbon nanotubes | 300 | 40 | 0.79 | 4.1 | 105 | 30,000 | 0.1 | 7.8 | 30 | 6 | Lang. | 35.0 | [42] | |
| 8 | Multi-walled carbon nanotubes | 174 | 29 | 0.7 | 3.9 | 0.2 | 15 | 0.007 | Freund. | [14] | |||||
| 9 | Single-walled carbon nanotubes | 406 | 2 | 1.11 | 130 | 1 | 25 | [21] | |||||||
| 10 | Nano-graphene platelets | 624 | 5000 | 2.69 | 9.5 | 1.99 | 15 | 0.007 | Freund. | 92.9 | [14] | ||||
| 11 | Superfine powdered activated carbon | 773 | 240 | 1.01 | 5.7 | 1.78 | 15 | 0.007 | Freund. | 83.1 | [14] | ||||
| 12 | Powdered activated carbon | 900 | 37,000 | 0.46 | 6.1 | 2.21 | 15 | 0.007 | Freund. | 99.9 | [14] | ||||
| 13 | Modified activated carbon | 2135 | 0.919 | 6.6 | 62 | 30,000 | 0.5 | 25 | 4 | 99.9 | [43] | ||||
| 14 | Polyacrylic acid modified mesoporous carbon | 25 | 15,000 | 0.5 | 5 | 30 | 83.3 | [44] | |||||||
| 15 | Cellulose/graphene composites | 0.32 | 1000 | 3 | 9 | 25 | 0.2 | Lang. | 96.0 | [45] | |||||
| 16 | Bamboo canes | 381 | 0.000025 | 0.5 | 10 | 6 | 40 | 7 | Pseudo I order | Freund. | 49.8 | [16] | |||
| 17 | Date stones | 394 | 0.000033 | 0.5 | 10 | 6 | 40 | 7 | Pseudo I order | Freund. | 65.6 | [16] | |||
| 18 | Olive stones | 379 | 0.000046 | 0.5 | 10 | 6 | 40 | 7 | Pseudo I order | Freund. | 91.8 | [16] | |||
| 19 | Peanut shells | 368 | 0.000013 | 0.5 | 10 | 6 | 40 | 7 | Pseudo I order | Freund. | 25.9 | [16] | |||
| 20 | Avocado stones | 342 | 0.000050 | 0.5 | 10 | 6 | 40 | 7 | Pseudo I order | Freund. | 99.9 | [16] | |||
| 21 | Eucalyptus gomphocephala | 289 | 0.000017 | 0.5 | 10 | 6 | 40 | 7 | Pseudo I order | Freund. | 33.7 | [16] | |||
| 22 | Raphanus raphanistrum | 296 | 0.000044 | 0.5 | 10 | 6 | 40 | 7 | Pseudo I order | Freund. | 88.9 | [16] | |||
| 23 | Nerium oleander | 275.02 | 0.000012 | 0.5 | 10 | 6 | 40 | 7 | Pseudo I order | Freund. | 24.4 | [16] | |||
| 24 | Origanum compactum | 306.28 | 0.000018755 | 0.5 | 10 | 6 | 40 | 7 | Pseudo I order | Freund. | 37.5 | [16] | |||
| 25 | Cistus landaniferus | 311.42 | 0.000044605 | 0.5 | 10 | 6 | 40 | 7 | Pseudo I order | Freund. | 89.2 | [16] | |||
Table 5.
Nanofibrous adsorbent properties and adsorption conditions for the removal of Chlorpyrifos.
Table 5.
Nanofibrous adsorbent properties and adsorption conditions for the removal of Chlorpyrifos.
| N | Adsorbent | Adsorbent Properties | Adsorption Capacity (µg/g) | Adsorption Conditions | Removal (%) | Ref. | ||||||
|---|---|---|---|---|---|---|---|---|---|---|---|---|
| BET (m2/g) | Initial P Concentration (µg/L) | Adsorbent Dose (g/L) | pH | Temperature (°C) | Eq. Time (h) | Kinetic Model | Isotherm Model | |||||
| 1 | Polystyrene nanofibers | 450 | 500 | 1 | Langmuir | 90 | [40] | |||||
| 2 | Modified montmorillonite | 7760 | 35,000 | 5 | 35 | Freundlich | 100 | [46] | ||||
| 3 | Montmorillonite–micelles composite | 5910 | 35,000 | 5 | 20 | Freundlich | 84.4 | [46] | ||||
| 4 | Bamboo canes | 382 | 0.032 | 0.5 | 10 | 6 | 40 | 7 | Pseudo I order | Freundlich | 63.3 | [16] |
| 5 | Date stones | 394 | 0.036 | 0.5 | 10 | 6 | 40 | 7 | Pseudo I order | Freundlich | 71.63 | [16] |
| 6 | Olive stones | 379 | 0.047 | 0.5 | 10 | 6 | 40 | 7 | Pseudo I order | Freundlich | 93.71 | [16] |
| 7 | Peanut shells | 368 | 0.030 | 0.5 | 10 | 6 | 40 | 7 | Pseudo I order | Freundlich | 60.1 | [16] |
| 8 | Avocado stones | 342 | 0.049 | 0.5 | 10 | 6 | 40 | 7 | Pseudo I order | Freundlich | 97.4 | [16] |
| 9 | Eucalyptus gomphocephala | 289 | 0.040 | 0.5 | 10 | 6 | 40 | 7 | Pseudo I order | Freundlich | 79.94 | [16] |
| 10 | Raphanus raphanistrum | 296 | 0.044 | 0.5 | 10 | 6 | 40 | 7 | Pseudo I order | Freundlich | 88.36 | [16] |
| 11 | Nerium oleander | 275 | 0.043 | 0.5 | 10 | 6 | 40 | 7 | Pseudo I order | Freundlich | 85.74 | [16] |
| 12 | Origanum compactum | 306 | 0.036 | 0.5 | 10 | 6 | 40 | 7 | Pseudo I order | Freundlich | 71.89 | [16] |
| 13 | Cistus landaniferus | 311 | 0.032 | 0.5 | 10 | 6 | 40 | 7 | Pseudo I order | Freundlich | 64.49 | [16] |
Table 6.
Characteristics of Phenol, 2-Chlorophenol, and Pentachlorophenol [26].
Table 6.
Characteristics of Phenol, 2-Chlorophenol, and Pentachlorophenol [26].
| Name | Molecular | Log Kow | Solubility in Water (mg/L, 25 °C) | 2D Structure | |
|---|---|---|---|---|---|
| Weight (g/mol) | Formula | ||||
| Phenol | 94.113 | C6H6O | 1.46 | 67 |  |
| 2-Chlorophenol | 128.555 | C6H4ClOH | 2.15 | 28 |  |
| Pentachlorophenol | 266.323 | C6HCl5OH | 5.12 | 14 |  |
Table 7.
Nanofibrous adsorbent properties and adsorption conditions for the removal of Phenol.
| N | Adsorbent | Adsorbent Properties | Adsorption Capacity (mg/g) | Adsorption Conditions | Ref. | |||||||||
|---|---|---|---|---|---|---|---|---|---|---|---|---|---|---|
| BET (m2/g) | Fiber Diameter (nm) | Pore Volume (cm3/g) | Pore Diameter (nm) | Initial P Concentration (mg/L) | Adsorbent Dose (g/L) | pH | Temperature (°C) | Eq. Time (h) | Kinetic Model | IsoT. Model | ||||
| 1 | Commercial Activated Carbon | 596 | 0.57 | 30 | 6.8 | 20 | 6 | Pseudo II order | Freund. | [48] | ||||
| 2 | Activated carbon extracted from agro-waste (Hemidesmus indicus) | 627 | 1.04 | 30 | 6.8 | 20 | 5 | Pseudo II order | Freund. | [48] | ||||
| 4 | Activated carbon extracted from tea industrial waste | 1066 | 0.58 | 2.18 | 96.5 | 400 | 2 | 6 | 4 | Pseudo II order | Lang. | [49] | ||
| 6 | Activated carbon extracted from Miswak root treated with KMnO4 | 1204 | 142.15 | 100 | 1 | 5 | 30 | 2 | Freund. | [50] | ||||
| 7 | Activated carbon produced from sludge | 319.5 | 4 | 12 | 100 | 6 | 5.5 | 25 | 8 | Pseudo II order | Freund. | [51] | ||
| 8 | Iron modified granular activated carbon | 95 | 0.083 | 7.2 | 50 | 10 | 6.5 | 30 | 4 | Pseudo I order | Lang. | [52] | ||
| 9 | Ammonia-treated coal reject | 190 | 0.78 | 26.1 | 240 | 5 | 6 | 25 | [53] | |||||
| 10 | Powdered activated carbon | 1149 | 0.644 | 136 | 200 | 30 | [54] | |||||||
| 11 | Zeolite X/activated carbon composites | 872 | 0.59 | 27.06 | 240 | 6 | 6.5 | 25 | 5 | Pseudo II order | [55] | |||
| 12 | PET-based activated carbons | 1850 | 0.743 | 0.8 | 178 | 150 | 5 | 24 | 1 | Pseudo II order | Lang. | [56] | ||
| 13 | Ammonia-treated activated carbon microfibers | 275 | 100 | 0.6 | 38 | 0.5 | Freund. | [57] | ||||||
| 14 | Sawdust | 5.5 | 100 | 10 | 5.8 | 22 | 3 | [58] | ||||||
| 15 | Porous clay | 305.5 | 3.7 | 14.5 | 450 | 8 | 5.5 | 25 | Lang. | [59] | ||||
| 16 | Activated carbon microfibers/carbon nanofibers composite | 970 | 0.537 | 150 | 100 | 0.6 | 38 | 0.5 | Freund. | [57] | ||||
| 17 | Carbon nanofibers decorated with ferric oxide nanoparticles | 72.4 | 1.684 | 2 | 7 | Lang. | [60] | |||||||
| 18 | Carbon nanofibers | 40.7 | 0.842 | 2 | 7 | Lang. | [60] | |||||||
| 19 | Doped hydrophobic Cryptomelane type manganese oxide nanofibers | 40 | 0.19 | 2060 | 5000 | 1 | 25 | 2 | [47] | |||||
| 20 | Activated carbon nanofibers | 2921 | 2.7 | 0.43 | 256.1 | 300 | 0.5 | 38 | 1.3 | Pseudo II order | Freund. | [61] | ||
| 21 | Hydroxyapaxite nanopowders | 43.75 | 10.33 | 400 | 1 | 6.4 | 60 | 2 | Pseudo II order | Freund. | [62] | |||
| 22 | Ni/Cu MOF composites | 1042.1 | 0.6241 | 39.47 | 50 | 1 | 5 | 30 | [63] | |||||
| 23 | Magnetic and cationic surfactant diatomite nanocomposite | 55.7 | 15 | 2 | 10 | 0.5 | Lang. | [64] | ||||||
| 24 | NiFe2O4 nanoparticles aggregated on powdered activated carbon | 33 | 200 | 0.6 | 8 | 25 | 5 | Pseudo II order | Lang. | [65] | ||||
| 25 | Carbon nanotubes | 357 | 0.142 | 166.58 | 500 | 2.5 | 23 | 96 | Freund. | [66] | ||||
| 26 | Chitosan/Carbon nanocomposite particles | 409 | 800 | 5 | 30 | 1 | Pseudo II order | Freund. | [67] | |||||
| 27 | Carbon nanotubes/MIL-68 (Al) composites | 1407 | 109.9 | 500 | 1 | 30 | [68] | |||||||
| 28 | Multi-walled carbon nanotubes | 270 | 64.6 | 50 | 2 | 4.65 | 1 | Pseudo II order | Freund. | [69] | ||||
| 29 | Ethanol and heat treated carbon nanotubes | 55.4 | 0.18 | 6.39 | 50 | 0.5 | 25 | [70] | ||||||
| 30 | 3D graphene aerogels—mesoporous silica frameworks | 1000.8 | 0.93 | 1.87 | 6.95 | 4.4 | 2 | 25 | 2 | Pseudo II order | Freund. | [71] | ||
| 31 | Commercial Styrene divinylbenzene particles—Dowex Optipore L493 | 1100 | 4.6 | 8.97 | 38 | 10 | 25 | 1 | Pseudo II order | Freund. | [72] | |||
| 32 | Commercial Styrene divinylbenzene particles—Diaion SP825 | 1000 | 12 | 8.83 | 38 | 10 | 25 | 5 | Pseudo II order | Freund. | [72] | |||
| 33 | Commercial Brominated styrene divinylbenzene particles—Diaion SP207 | 650 | 10.5 | 8.63 | 38 | 10 | 25 | 5 | Pseudo II order | Freund. | [72] | |||
Table 8.
Nanofibrous adsorbent properties and adsorption conditions for the removal of 2-chlorophenol.
Table 8.
Nanofibrous adsorbent properties and adsorption conditions for the removal of 2-chlorophenol.
| N | Adsorbent | Adsorbent Properties | Adsorption Capacity (mg/g) | Adsorption Conditions | Removal (%) | Ref. | |||||||||
|---|---|---|---|---|---|---|---|---|---|---|---|---|---|---|---|
| BET (m2/g) | Fiber Diameter (nm) | Pore Volume (cm³/g) | pHZPC | Initial P Concentration (mg/L) | Adsorbent Dose (g/L) | pH | Temperature (°C) | Eq. Time (h) | Kinetic Model | Isotherm Model | |||||
| 1 | Carbon nanofibers | 2326 | 500 | 1.36 | 4.4 | 167 | 10 | 0.05 | 6.5 | 25 | 5 | 84 | [73] | ||
| 2 | Powdered activated carbon | 800 | 0.8 | 149 | 200 | 1 | 25 | 75 | [74] | ||||||
| 3 | Granular activated carbon | 850 | 1.19 | 137 | 200 | 1 | 25 | 69 | [74] | ||||||
| 4 | Powdered activated carbon | 1075 | 0.78 | 2.8 | 25.7 | 10 | 0.05 | 6.5 | 25 | 5 | 13 | [73] | |||
| 5 | Zeolite | 46.1 | 65 | 1 | 9.3 | 25 | 2 | Pseudo II order | 71 | [75] | |||||
| 6 | Modified graphene oxide | 198 | 79 | 50 | 0.6 | 5.5 | 25 | Freund. | 97 | [76] | |||||
| 7 | Cu-nano zeolite | 890 | 0.18 | 24.7 | 50 | 0.6 | 6 | 2.5 | Pseudo II order | Freund. | 95 | [77] | |||
Table 9.
Nanofibrous adsorbent properties and adsorption conditions for the removal of Pentachlorophenol.
Table 9.
Nanofibrous adsorbent properties and adsorption conditions for the removal of Pentachlorophenol.
| N | Adsorbent | Adsorbent Properties | Adsorption Capacity (mg/g) | Adsorption Conditions | Ref. | |||||||||
|---|---|---|---|---|---|---|---|---|---|---|---|---|---|---|
| BET (m2/g) | Pore Volume (cm³/g) | Pore Diameter (nm) | Initial P Concentration (µg/L) | Adsorbent Dose (g/L) | pH | Temperature (°C) | Eq. Time (h) | Kinetic Model | Isotherm Model | Removal (%) | ||||
| 1 | Encapsulated horseradish peroxidase in PEO-PPO nanofibers | 3.73 | 44.7 | 10,000 | 0.5 | 3 | 25 | Pseudo II order | 83 | [78] | ||||
| 2 | Activated carbon fiber | 175 | 300,000 | 0.5 | 12 | 25 | Intra. diffusion | Langmuir | 29.2 | [79] | ||||
| 3 | H2O2-oxidised multi walled carbon nanotubes | 144 | 3.5 | 1200 | 0.2 | 35 | 58.2 | [80] | ||||||
| 4 | Magnetic powdered activated carbon | 743.6 | 64 | 80,000 | 1 | 5.75 | 20 | 1 | Pseudo II order | Langmuir | 80.0 | [15] | ||
| 5 | Powdered activated carbon | 958 | 58 | 80,000 | 1 | 5.75 | 20 | 1 | Pseudo II order | Langmuir | 72.5 | [15] | ||
| 6 | Carbon black | 511 | 1.42 | 250 | 700,000 | 7 | 20 | Langmuir | [81] | |||||
| 7 | Zero valent iron ZVI magnetic biochar composites | 101 | 0.079 | 4.78 | 49.3 | 10,000 | 0.2 | 7 | 8 | 84 | [82] | |||
| 8 | Ni-ZVI magnetic biochar composites | 168 | 0.087 | 2.32 | 49 | 10,000 | 0.2 | 6 | 25 | 1 | Pseudo I order | 98 | [83] | |
| 9 | Hexagonal mesoporous silicas HMS | 755 | 0.84 | 3.2 | 190 | 6 | 25 | Freundlich | 4 | [84] | ||||
| 10 | Aminopropyl-modified HMS | 706 | 0.4 | 3.6 | 190 | 6 | 25 | Freundlich | 25 | [84] | ||||
| 11 | Hydrophobically modified thermo sensitive hydrogels | 2.3 | 2663 | 1.67 | 3 | 25 | 5 | Pseudo II order | Langmuir | 95 | [85] | |||
| 12 | Bentonite | 29 | 0.072 | 3.81 | 92 | 300,000 | 5 | 25 | Langmuir | 100 | [86] | |||
| 13 | Almond shell residue | 13 | 0.005 | 100 | 10 | 30 | 24 | 93 | [87] | |||||
| 14 | Fungal biomass | 1.4 | 0.094 | 1000 | 10 | 5 | 20 | 2 | Pseudo II order | Langmuir | 94 | [88] | ||
Table 10.
Characteristics of Aldrin, Dieldrin, Endrin, Chlordane, Heptachlor, Heptachlor epoxide, Toxaphene 8 [26].
Table 10.
Characteristics of Aldrin, Dieldrin, Endrin, Chlordane, Heptachlor, Heptachlor epoxide, Toxaphene 8 [26].
| Name | Molecular | Log Kow | Solubility in Water (mg/L, 25 °C) | 2D Structure | H Bound Count | ||
|---|---|---|---|---|---|---|---|
| Weight (g/mol) | Formula | Donor | Acceptor | ||||
| Aldrin | 364.896 | C12H8Cl6 | 5.6 | 0.027 |  | 0 | 0 |
| Dieldrin | 380.895 | C12H8Cl6O | 5.4 | 0.19 |  | 0 | 1 |
| Endrin | 380.895 | C12H8Cl6O | 5.2 | 0.23 |  | 0 | 1 |
| Chlordane | 409.758 | C10H6Cl8 | 5.16 | 0.1 |  | 0 | 0 |
| Heptachlor | 373.3 | C10H5Cl7 | 6.10 | 0.18 |  | 0 | 0 |
| Heptachlor epoxide | 389.299 | C10H5Cl7O | 5.40 | 0.35 |  | 0 | 1 |
| Toxaphene 8 | 413.79 | C10H10Cl8 | 5.9 | 0.55 |  | 0 | 0 |
Table 11.
Nanofibrous adsorbent properties and adsorption conditions for the removal of Chlordane.
| N | Adsorbent | Adsorbent Properties | Adsorption Capacity (mg/g) | Adsorption Conditions | Removal (%) | Ref. | ||||||||
|---|---|---|---|---|---|---|---|---|---|---|---|---|---|---|
| BET (m2/g) | Pore Volume (cm³/g) | Pore Diameter (nm) | Initial P Concentration (µg/L) | Adsorbent Dose (g/L) | pH | Temperature (°C) | Eq. Time (h) | Kinetic Model | Isotherm Model | |||||
| 1 | TiO2 nanowires/Polystyrene nanocomposites | 0.021 | 57 | 2 | 73.7 | [92] | ||||||||
Table 12.
Nanofibrous adsorbent properties and adsorption conditions for the removal of Dieldrin.
| N | Adsorbent | Adsorbent Properties | Adsorption Capacity (mg/g) | Adsorption Conditions | Removal (%) | Ref. | ||||||||
|---|---|---|---|---|---|---|---|---|---|---|---|---|---|---|
| BET (m2/g) | Pore Volume (cm³/g) | Pore Diameter (nm) | Initial P Concentration (µg/L) | Adsorbent Dose (g/L) | pH | Temperature (°C) | Eq. Time (h) | Kinetic Model | Isotherm Model | |||||
| 1 | Bromopropyl–silica nanofibers | 0.19 | 20 | 0.1 | 25 | 8 | Freundlich | 91.0 | [94] | |||||
| 2 | Silica nanofibers | 0.014 | 20 | 0.1 | 25 | 8 | 20.9 | |||||||
| 3 | TiO2 nanowires/Polystyrene nanocomposites | 0.013 | 29 | 2 | 89.7 | [92] | ||||||||
| 4 | Lecithin–Cellulose acetate fibers | 0.096 | 50 | 0.5 | 10 | 96 | [95] | |||||||
| 5 | Graphene oxide–iron oxide nanoparticles | 0.00005 | 1 | 15 | 4 | 25 | 0.5 | Pseudo II order | Langmuir | 74 | [96] | |||
| 6 | Commercial granulated activated carbon | 0.073 | 20 | 0.1 | 25 | 8 | 38.7 | [94] | ||||||
| 7 | Triolein embedded activated carbon | 721 | 0.0019 | 10 | 10 | 10 | [97] | |||||||
| 8 | Commercial vegetal activated carbon | 0.38 | 2000 | 5 | 20 | 0.3 | Freundlich | 95.3 | [98] | |||||
| 9 | Cyclodextrin-modified nanoporous carbon | 890 | 1.35 | 5.1 | 0.03 | 100 | 1 | Freundlich | 30 | [99] | ||||
| 10 | Cellulose acetate/triolein spheres | 0.00095 | 10 | 10 | 25 | 13 | 95 | [100] | ||||||
| 11 | Cerasome forming lipid | 0.23 | 160 | 0.6 | 7 | 25 | Langmuir | 84.4 | [101] | |||||
| 12 | Cerasome forming lipid with Fe3O4 nanoparticles | 0.25 | 160 | 0.7 | 7 | 25 | Langmuir | 99.9 | [101] | |||||
| 13 | Bacterial cells adsorbed to magnetite | 0.097 | 20 | 0.185 | 0.25 | 89.9 | [102] | |||||||
| 14 | Hydrophylic silica aerogel | 547 | 2.4 | 17.6 | 0.054 | 150 | 0.67 | 25 | 22 | 21.5 | [103] | |||
| 15 | Hydrophobic silica aerogel | 907 | 2.95 | 21 | 0.021 | 150 | 0.67 | 25 | 6 | Freundlich | 92.3 | [103] | ||
| 16 | Xerogel | 988 | 0.64 | 3.2 | 0.0067 | 150 | 0.67 | 25 | 22 | 3.0 | [103] | |||
| 17 | Cactus pear leaves | 0.0001 | 10 | 60 | 7 | 23 | 0.15 | 60 | [104] | |||||
| 18 | Acid-treated date stones | 421 | 0.44 | 500 | 1 | 25 | 4.2 | Pseudo II order | Freundlich | 87.2 | [93] | |||
| 19 | Acid-treated olive stones | 479 | 0.44 | 500 | 1 | 25 | 5 | Pseudo II order | Langmuir | 87.6 | [105] | |||
| 20 | Montmorillonite | 18.5 | 0.00099 | 5 | 5 | 1 | 25 | 2 | Pseudo II order | Freundlich | 99 | [106] | ||
| 21 | Bamboo canes | 3818 | 0.000044 | 0.5 | 10 | 6 | 40 | 7 | Pseudo I order | Freundlich | 86.2 | [16] | ||
| 22 | Date stones | 394.3 | 0.000041 | 0.5 | 10 | 6 | 40 | 7 | Pseudo I order | Freundlich | 83.9 | [16] | ||
| 23 | Olive stones | 379.1 | 0.000047 | 0.5 | 10 | 6 | 40 | 7 | Pseudo I order | Freundlich | 94.9 | [16] | ||
| 24 | Peanut shells | 367.8 | 0.00004 | 0.5 | 10 | 6 | 40 | 7 | Pseudo I order | Freundlich | 80.4 | [16] | ||
| 25 | Avocado stones | 342.2 | 0.000048 | 0.5 | 10 | 6 | 40 | 7 | Pseudo I order | Freundlich | 95.8 | [16] | ||
| 26 | Eucalyptus gomphocephala | 289.5 | 0.000025 | 0.5 | 10 | 6 | 40 | 7 | Pseudo I order | Freundlich | 49.9 | [16] | ||
| 27 | Raphanus raphanistrum | 296.2 | 0.000045 | 0.5 | 10 | 6 | 40 | 7 | Pseudo I order | Freundlich | 89.4 | [16] | ||
| 28 | Nerium oleander | 275.0 | 0.000037 | 0.5 | 10 | 6 | 40 | 7 | Pseudo I order | Freundlich | 72.8 | [16] | ||
| 29 | Origanum compactum | 306.3 | 0.000043 | 0.5 | 10 | 6 | 40 | 7 | Pseudo I order | Freundlich | 87.4 | [16] | ||
| 30 | Cistus landaniferus | 311.4 | 0.000045 | 0.5 | 10 | 6 | 40 | 7 | Pseudo I order | Freundlich | 90.9 | [16] | ||
Table 13.
Nanofibrous adsorbent properties and adsorption conditions for the removal of Aldrin.
| N | Adsorbent | Adsorbent Properties | Adsorption Capacity (mg/g) | Adsorption Conditions | Removal (%) | Ref. | ||||||||
|---|---|---|---|---|---|---|---|---|---|---|---|---|---|---|
| BET (m2/g) | Pore Volume (cm³/g) | Pore Diameter (nm) | Initial P Concentration (µg/L) | Adsorbent Dose (g/L) | pH | Temperature (°C) | Eq. Time (h) | Kinetic Model | Isotherm Model | |||||
| 1 | TiO2 nanowires/Polystyrene nanocomposites | 0.011 | 34 | 2 | 64.7 | [92] | ||||||||
| 2 | Commercial vegetal activated carbon | 0.38 | 2000 | 5 | 20 | 0.3 | 95.3 | [98] | ||||||
| 3 | Cyclodextrin modified nanoporous carbon | 890 | 1.35 | 5.1 | 0.02 | 85 | 1 | Freundlich | 23.5 | [99] | ||||
| 4 | Cellulose acetate/triolein spheres | 0.001 | 10 | 10 | 25 | 3 | 99.9 | [100] | ||||||
| 5 | Bacterial cells adsorbed to magnetite | 0.10 | 20 | 0.185 | 0.25 | 92.9 | [102] | |||||||
| 6 | Montmorillonite | 18.5 | 0.045 | 5 | 0.1 | 6 | 25 | 3.75 | Pseudo II order | Freundlich | 90 | [106] | ||
| 7 | Clinoptilolite | 0.0023 | 25 | 10 | 25 | Pseudo II order | Freundlich | 95 | [107] | |||||
| 8 | Cactus pear leaves | 0.0001 | 10 | 60 | 7 | 23 | 0.15 | 60 | [104] | |||||
| 9 | Acid-treated date stones | 421 | 0.45 | 500 | 1 | 25 | 4.2 | Pseudo II order | Freundlich | 90.2 | [93] | |||
| 10 | Acid-treated olive stones | 479 | 0.46 | 500 | 1 | 25 | 5 | Pseudo II order | Langmuir | 91.7 | [105] | |||
| 11 | Bamboo canes | 381.8 | 0.000047 | 0.5 | 10 | 6 | 40 | 7 | Pseudo I order | Freundlich | 93.7 | [16] | ||
| 12 | Date stones | 394.3 | 0.000048 | 0.5 | 10 | 6 | 40 | 7 | Pseudo I order | Freundlich | 95.9 | [16] | ||
| 13 | Olive stones | 379.1 | 0.000049 | 0.5 | 10 | 6 | 40 | 7 | Pseudo I order | Freundlich | 98.5 | [16] | ||
| 14 | Peanut shells | 367.7 | 0.000047 | 0.5 | 10 | 6 | 40 | 7 | Pseudo I order | Freundlich | 94.9 | [16] | ||
| 15 | Avocado stones | 342.2 | 0.000049 | 0.5 | 10 | 6 | 40 | 7 | Pseudo I order | Freundlich | 97.4 | [16] | ||
| 16 | Eucalyptus gomphocephala | 289.5 | 0.000047 | 0.5 | 10 | 6 | 40 | 7 | Pseudo I order | Freundlich | 93.3 | [16] | ||
| 17 | Raphanus raphanistrum | 296.2 | 0.000045 | 0.5 | 10 | 6 | 40 | 7 | Pseudo I order | Freundlich | 90.5 | [16] | ||
| 18 | Nerium oleander | 275.0 | 0.000047 | 0.5 | 10 | 6 | 40 | 7 | Pseudo I order | Freundlich | 93.0 | [16] | ||
| 19 | Origanum compactum | 306.3 | 0.000046 | 0.5 | 10 | 6 | 40 | 7 | Pseudo I order | Freundlich | 92.3 | [16] | ||
| 20 | Cistus landaniferus | 311.4 | 0.000046 | 0.5 | 10 | 6 | 40 | 7 | Pseudo I order | Freundlich | 91.4 | [16] | ||
Table 14.
Nanofibrous adsorbent properties and adsorption conditions for the removal of Heptachlor and Heptachlor epoxide.
Table 14.
Nanofibrous adsorbent properties and adsorption conditions for the removal of Heptachlor and Heptachlor epoxide.
| N | Adsorbent | Adsorbent Properties | Adsorption Capacity (mg/g) | Adsorption Conditions | Removal (%) | Ref. | ||||||||
|---|---|---|---|---|---|---|---|---|---|---|---|---|---|---|
| BET (m2/g) | Pore Volume (cm³/g) | Pore Diameter (nm) | Initial P Concentration (µg/L) | Adsorbent Dose (g/L) | pH | Temperature (°C) | Eq. Time (h) | Kinetic Model | Isotherm Model | |||||
| Heptachlor | ||||||||||||||
| 1 | Activated carbon from wheat straw | 176 | 0.631 | 0.48 | 1000 | 2 | 7 | 22 | 22 | Pseudo II order | Langmuir | 96.6 | [108] | |
| 2 | Bacterial cells adsorbed to magnetite | 0.11 | 20 | 0.185 | 0.25 | 90.8 | [102] | |||||||
| 3 | Lecithin–Cellulose acetate fibers | 0.098 | 50 | 0.5 | 10 | 98 | [95] | |||||||
| 4 | Montmorillonite | 18.5 | 0.00096 | 5 | 5 | 1 | 25 | 2 | Pseudo II order | Freundlich | 96 | [106] | ||
| 5 | Pine bark | 0.0038 | 20 | 5 | 20 | 1.5 | Freundlich | 93.6 | [109] | |||||
| Heptachlor epoxide | ||||||||||||||
| 6 | TiO2 nanowires/Polystyrene nanocomposites | 0.037 | 74 | 2 | 99.9 | [92] | ||||||||
| 7 | Commercial vegetal activated carbon | 0.42 | 2200 | 5 | 20 | 0.3 | 96.4 | [98] | ||||||
| 8 | Cellulose acetate/triolein spheres | 0.0009 | 10 | 10 | 25 | 13 | 90 | [100] | ||||||
Table 15.
Nanofibrous adsorbent properties and adsorption conditions for the removal of Endrin.
| N | Adsorbent | Adsorbent Properties | Adsorption Capacity (mg/g) | Adsorption Conditions | Removal (%) | Ref. | ||||||||
|---|---|---|---|---|---|---|---|---|---|---|---|---|---|---|
| BET (m2/g) | Pore Volume (cm³/g) | Pore Diameter (nm) | Initial P Concentration (µg/L) | Adsorbent Dose (g/L) | pH | Temperature (°C) | Eq. Time (h) | Kinetic Model | Isotherm Model | |||||
| 1 | TiO2 nanowires/Polystyrene nanocomposites | 0.014 | 39 | 2 | 71.8 | [92] | ||||||||
| 2 | Lecithin–Cellulose acetate fibers | 0.094 | 50 | 0.5 | 10 | 93.5 | [95] | |||||||
| 3 | Oxidized carbon nanotubes | 0.082 | 0.8 | 0.2 | 6 | 20 | Linear | 99.9 | [20] | |||||
| 4 | Carbon nanotubes | 110 | 0.09 | 0.8 | 0.2 | 6 | 20 | Linear | 99.9 | [20] | ||||
| 5 | Graphene oxide- iron oxide nanoparticles | 0.0057 | 99 | 15 | 4 | 25 | 0.5 | Pseudo I order | Langmuir | 86 | [96] | |||
| 6 | Powdered activated carbon | 742.9 | 0.085 | 0.8 | 0.2 | 6 | 20 | Linear | 99.9 | [20] | ||||
| 7 | Cellulose acetate/triolein spheres | 0.0009 | 10 | 10 | 25 | 20 | 90 | [100] | ||||||
| 8 | Montmorillonite | 18.5 | 0.00084 | 5 | 5 | 1 | 25 | 2 | Pseudo II order | Freundlich | 84 | [106] | ||
| 9 | Montmorillonite | 14.1 | 0.038 | 10.9 | 0.1 | 1 | 6.4 | 20 | 24 | Linear | [110] | |||
| 10 | Acid-treated date stones | 421 | 0.40 | 500 | 1 | 25 | 4.2 | Pseudo II order | Freundlich | 80.8 | [93] | |||
| 11 | Acid-treated olive stones | 479 | 0.40 | 500 | 1 | 25 | 5 | Pseudo II order | Langmuir | 80.2 | [105] | |||
| 12 | Bamboo canes | 381 | 0.000042 | 0.5 | 10 | 6 | 40 | 7 | Pseudo I order | Freundlich | 83.0 | [16] | ||
| 13 | Date stones | 394. | 0.000035 | 0.5 | 10 | 6 | 40 | 7 | Pseudo I order | Freundlich | 69.3 | [16] | ||
| 14 | Olive stones | 379 | 0.000046 | 0.5 | 10 | 6 | 40 | 7 | Pseudo I order | Freundlich | 92.9 | [16] | ||
| 15 | Peanut shells | 368 | 0.000039 | 0.5 | 10 | 6 | 40 | 7 | Pseudo I order | Freundlich | 78.8 | [16] | ||
| 16 | Avocado stones | 342 | 0.000048 | 0.5 | 10 | 6 | 40 | 7 | Pseudo I order | Freundlich | 95.9 | [16] | ||
| 17 | Eucalyptus gomphocephala | 289 | 0.000039 | 0.5 | 10 | 6 | 40 | 7 | Pseudo I order | Freundlich | 78.5 | [16] | ||
| 18 | Raphanus raphanistrum | 296 | 0.000041 | 0.5 | 10 | 6 | 40 | 7 | Pseudo I order | Freundlich | 81.9 | [16] | ||
| 19 | Nerium oleander | 275 | 0.000025 | 0.5 | 10 | 6 | 40 | 7 | Pseudo I order | Freundlich | 49.3 | [16] | ||
| 20 | Origanum compactum | 306 | 0.000030 | 0.5 | 10 | 6 | 40 | 7 | Pseudo I order | Freundlich | 60.7 | [16] | ||
| 21 | Cistus landaniferus | 311 | 0.000037 | 0.5 | 10 | 6 | 40 | 7 | Pseudo I order | Freundlich | 73.4 | [16] | ||
Table 16.
Nanofibrous adsorbent properties and adsorption conditions for the removal of Toxaphene 8.
Table 16.
Nanofibrous adsorbent properties and adsorption conditions for the removal of Toxaphene 8.
| N | Adsorbent | Adsorbent Properties | Adsorption Capacity (mg/g) | Adsorption Conditions | Removal (%) | Ref. | ||||||||
|---|---|---|---|---|---|---|---|---|---|---|---|---|---|---|
| BET (m2/g) | Pore Volume (cm³/g) | Pore Diameter (nm) | Initial P Concentration (µg/L) | Adsorbent Dose (g/L) | pH | Temperature (°C) | Eq. Time (h) | Kinetic Model | Isotherm Model | |||||
| 1 | MnO2/Cellulose fiber nanocomposites | 87 | 0.965 | 5000 | 5 | 3 | 25 | 0.5 | Pseudo II order | Langmuir | 96.5 | [111] | ||
Table 17.
Molecular structure of PCB 2, PCB 3, PCB 4, PCB 5, PCB 6, PCB 28, and PCB 77 (obtained from PubChem).
Table 17.
Molecular structure of PCB 2, PCB 3, PCB 4, PCB 5, PCB 6, PCB 28, and PCB 77 (obtained from PubChem).
| 2-PCB | 3-PCB | 4-PCB | 5-PCB | 6-PCB | 28-PCB | 77-PCB |
|---|---|---|---|---|---|---|
 |  |  |  |  |  |  |
Table 18.
Characteristics of Phenantrene (obtained from PubChem).
| Name | Formula | M (g/mol) | Log Kow | Solubility in Water (mg/L, 25°C) | Structure |
|---|---|---|---|---|---|
| Phenantrene | C14H10 | 178.234 | 4.46 | 1.15 |  |
Table 19.
Nanofibrous adsorbent properties and adsorption conditions for the removal of PCBs.
| N | Adsorbent | Adsorbent Properties | Adsorption Capacity (mg/g) | Adsorption Conditions | Removal (%) | Pesticide | Ref. | ||||||||
|---|---|---|---|---|---|---|---|---|---|---|---|---|---|---|---|
| BET (m2/g) | Pore Volume (cm³/g) | Pore Diameter (nm) | Initial P Concentration (µg/L) | Adsorbent Dose (g/L) | pH | Temperature (°C) | Eq. Time (h) | Kinetic Model | Isotherm Model | ||||||
| 1 | Activated carbon extracted from coal | 986 | 0.31 | 649 | 4000 | 0.015 | 25 | 5 | 100 | PCB 2 | [114] | ||||
| 2 | Activated carbon extracted from wood | 1747 | 0.48 | 987 | 4000 | 0.015 | 25 | 5 | 100 | PCB 2 | [114] | ||||
| 3 | Montmorillonite clay in alginate gel beads | 0.0022 | 10 | 10 | 5.5 | 25 | 6.5 | Pseudo II order | 95 | PCB 3 | [115] | ||||
| 4 | Montmorillonite clay in alginate gel beads | 0.0022 | 10 | 10 | 5.5 | 25 | 6.5 | Pseudo II order | 84 | PCB 4 | [115] | ||||
| 5 | Montmorillonite clay in alginate gel beads | 0.0019 | 10 | 10 | 5.5 | 25 | 6.5 | Pseudo II order | 79 | PCB 5 | [115] | ||||
| 6 | Montmorillonite clay in alginate gel beads | 0.0019 | 10 | 10 | 5.5 | 25 | 6.5 | Pseudo II order | 76 | PCB 6 | [115] | ||||
| 7 | Fe3O4 nanoparticles grafted on graphene oxide | 145.8 | 0.71 | 1470 | 0.25 | 25 | 0.5 | Pseudo II order | Linear | 12.1 | PCB 28 | [116] | |||
| 8 | Oriented magnetite porous nanofibers | 123 | 5 | 0.18 | 30 | 0.15 | 0.1 | 90.0 | PCB-77 | [117] | |||||
Table 20.
Nanofibrous adsorbent properties and adsorption conditions for the removal of Phenantrene.
Table 20.
Nanofibrous adsorbent properties and adsorption conditions for the removal of Phenantrene.
| N | Adsorbent | Adsorbent Properties | Adsorption Capacity (mg/g) | Adsorption Conditions | Removal (%) | Ref. | ||||||
|---|---|---|---|---|---|---|---|---|---|---|---|---|
| BET (m2/g) | Diameter (nm) | Pore Volume (cm³/g) | Initial P Concentration (mg/L) | Adsorbent Dose (g/L) | Temperature (°C) | Equilibrium Time (h) | Kinetic Model | |||||
| 1 | Cellulose acetate–polybenzoxazine nanofibers | 450 | 0.592 | 1 | 1.67 | 1 | Pseudo II order | 98.5 | [113] | |||
| 2 | Cyclodextrin-grafted cellulose acetate nanofibers | 1520 | 0.52 | 1.8 | 3.3 | 8 | 97 | [112] | ||||
| 3 | Cellulose acetate nanofibers | 675 | 0.45 | 1.8 | 3.3 | 3 | 83 | [112] | ||||
| 4 | Carbon nanotubes | 537 | 0.818 | 75 | 0.004 | [112] | ||||||
| 5 | Benzene-, dextran- and cyclodextrin-coated magnetic nanoparticles | 250,000 | 0.8 | 25 | 85 | [118] | ||||||
| 6 | Activated carbon fiber | 949 | 0.381 | 60 | 0.004 | [112] | ||||||
| 7 | Granular activated carbon | 706 | 0.711 | 85 | 0.004 | [112] | ||||||
© 2018 by the authors. Licensee MDPI, Basel, Switzerland. This article is an open access article distributed under the terms and conditions of the Creative Commons Attribution (CC BY) license (http://creativecommons.org/licenses/by/4.0/).
Share and Cite
MDPI and ACS Style
Des Ligneris, E.; Dumée, L.F.; Kong, L. Nanofiber-Based Materials for Persistent Organic Pollutants in Water Remediation by Adsorption. Appl. Sci. 2018, 8, 166. https://doi.org/10.3390/app8020166
AMA Style
Des Ligneris E, Dumée LF, Kong L. Nanofiber-Based Materials for Persistent Organic Pollutants in Water Remediation by Adsorption. Applied Sciences. 2018; 8(2):166. https://doi.org/10.3390/app8020166
Chicago/Turabian StyleDes Ligneris, Elise, Ludovic F. Dumée, and Lingxue Kong. 2018. "Nanofiber-Based Materials for Persistent Organic Pollutants in Water Remediation by Adsorption" Applied Sciences 8, no. 2: 166. https://doi.org/10.3390/app8020166
Note that from the first issue of 2016, this journal uses article numbers instead of page numbers. See further details here.