1. Introduction
The Lower Mekong Basin (LMB) consists of four nations, Thailand, Laos, Cambodia and Vietnam, and is home to approximately 60 million people. Whilst all four countries have been elevated to middle-income status as defined by the United Nations Development Programme, relatively high rates of poverty and malnutrition still exist [
1], particularly in Laos and Cambodia, where an average of ~33% of the population lives below the poverty line and ~32% of people are undernourished [
2].
Across the region, it is estimated that around 75–85% of people reside in rural areas [
2] and agriculture is considered the most significant economic enterprise, providing livelihoods for ~60% of the population [
3]. In 2015, the agricultural share of gross domestic product in Laos and Cambodia was ~22 and 26%, respectively [
4]. The main agricultural activity is smallholder production of wet-season rice, which is grown mostly in the lowlands and generally as a monoculture without crop rotation [
5]. These lowland systems occupy approximately 80% of the total rice production area, which, in 2016, equated to a harvested lowland area of ~0.78 million ha and 2.3 million ha in Laos and Cambodia, respectively [
4].
Over the last two to three decades, the intensification of these rice-growing systems has evolved through the adoption of mechanised land preparation [
6], improved variety selection and application of low levels of organic and inorganic fertiliser. However, from an economic perspective, lowland rice production remains a marginal activity that provides limited economic incentive for farmers to intensify production beyond subsistence requirements [
7]. Furthermore, in terms of food security and considering that the population is projected to reach 90 million by 2050 [
8], food production in the short-to-medium term will need to increase by 25%, which will require a substantial transformation of agricultural systems within the region [
9].
Diversification of the lowland systems from rice to dry-season cash crop production presents opportunities to improve livelihoods and increase productivity through better input management, including land and water inputs and alternative crop selection [
5]. However, lowland rice soils of the region are often found to be highly acidic and poorly structured with high soil strength, low water holding capacity, low fertility and biological activity and exhibit high aluminium toxicity [
10,
11,
12,
13,
14,
15], which may limit smallholder production of non-rice crops.
Whilst preliminary experiments conducted in [
16] suggested that soil chemical constraints were the most significant challenge to producing non-rice crops in paddy soils, Mitchell et al. [
14] hypothesised that, in addition to socio-economic factors not discussed in here, the limited adoption of dry-season non-rice crops in the lowland rice-growing regions was due to poor crop performance as a result of waterlogging caused by traditional puddling methods that result in soil compaction and inadequate drainage. Moreover, the authors of [
14] found that the hard pan resulting from traditional tillage practices severely constrained production by limiting root access to water and nutrients in the deeper soil layers. Furthermore, Cheth [
17] discovered that irrigation frequency significantly affected crop performance and water use efficiency of non-rice cultivars.
Water availability during the dry season often limits the yield potential of crops in the lowland production systems. Furthermore, given the poorly structured and compacted nature of the lowland rice-growing soils, we hypothesised that under furrow irrigation, which is a practice generally adopted in these regions to facilitate water delivery and to maintain a largely aerobic environment favourable for the root system, poor lateral soil water movement can be an additional limiting factor for non-rice dry-season crop production. The objectives of this study were to determine: (1) whether on typical lowland rice-growing soils, soil moisture monitoring at the centre of the bed could be a useful method for scheduling irrigation in two of the major non-rice cultivars grown in Cambodia and Laos [
4], being maize (
Zea mays Linnaeus) and peanut (
Arachis hypogaea Linnaeus); (2) the effect of frequency of irrigation on maize and peanut performance in terms of percentage of canopy cover, aboveground biomass (AGB) and yield, and; (3) the water productivity (WP) of these two crops on lowland rice-growing soils of the LMB. Large variability in WP has been reported for maize and peanut at the basin scale (in terms of actual evapotranspiration (ET
a); WPET = kg of yield/ET
a) with lower values obtained in various parts of Cambodia and in the north of Thailand when compared to those obtained in the more fertile soils of the Mekong Delta [
18]. Nevertheless, studies assessing WP of these two crops on lowland rice-growing soils at the field scale are scarce.
2. Materials and Methods
2.1. Study Site Locations
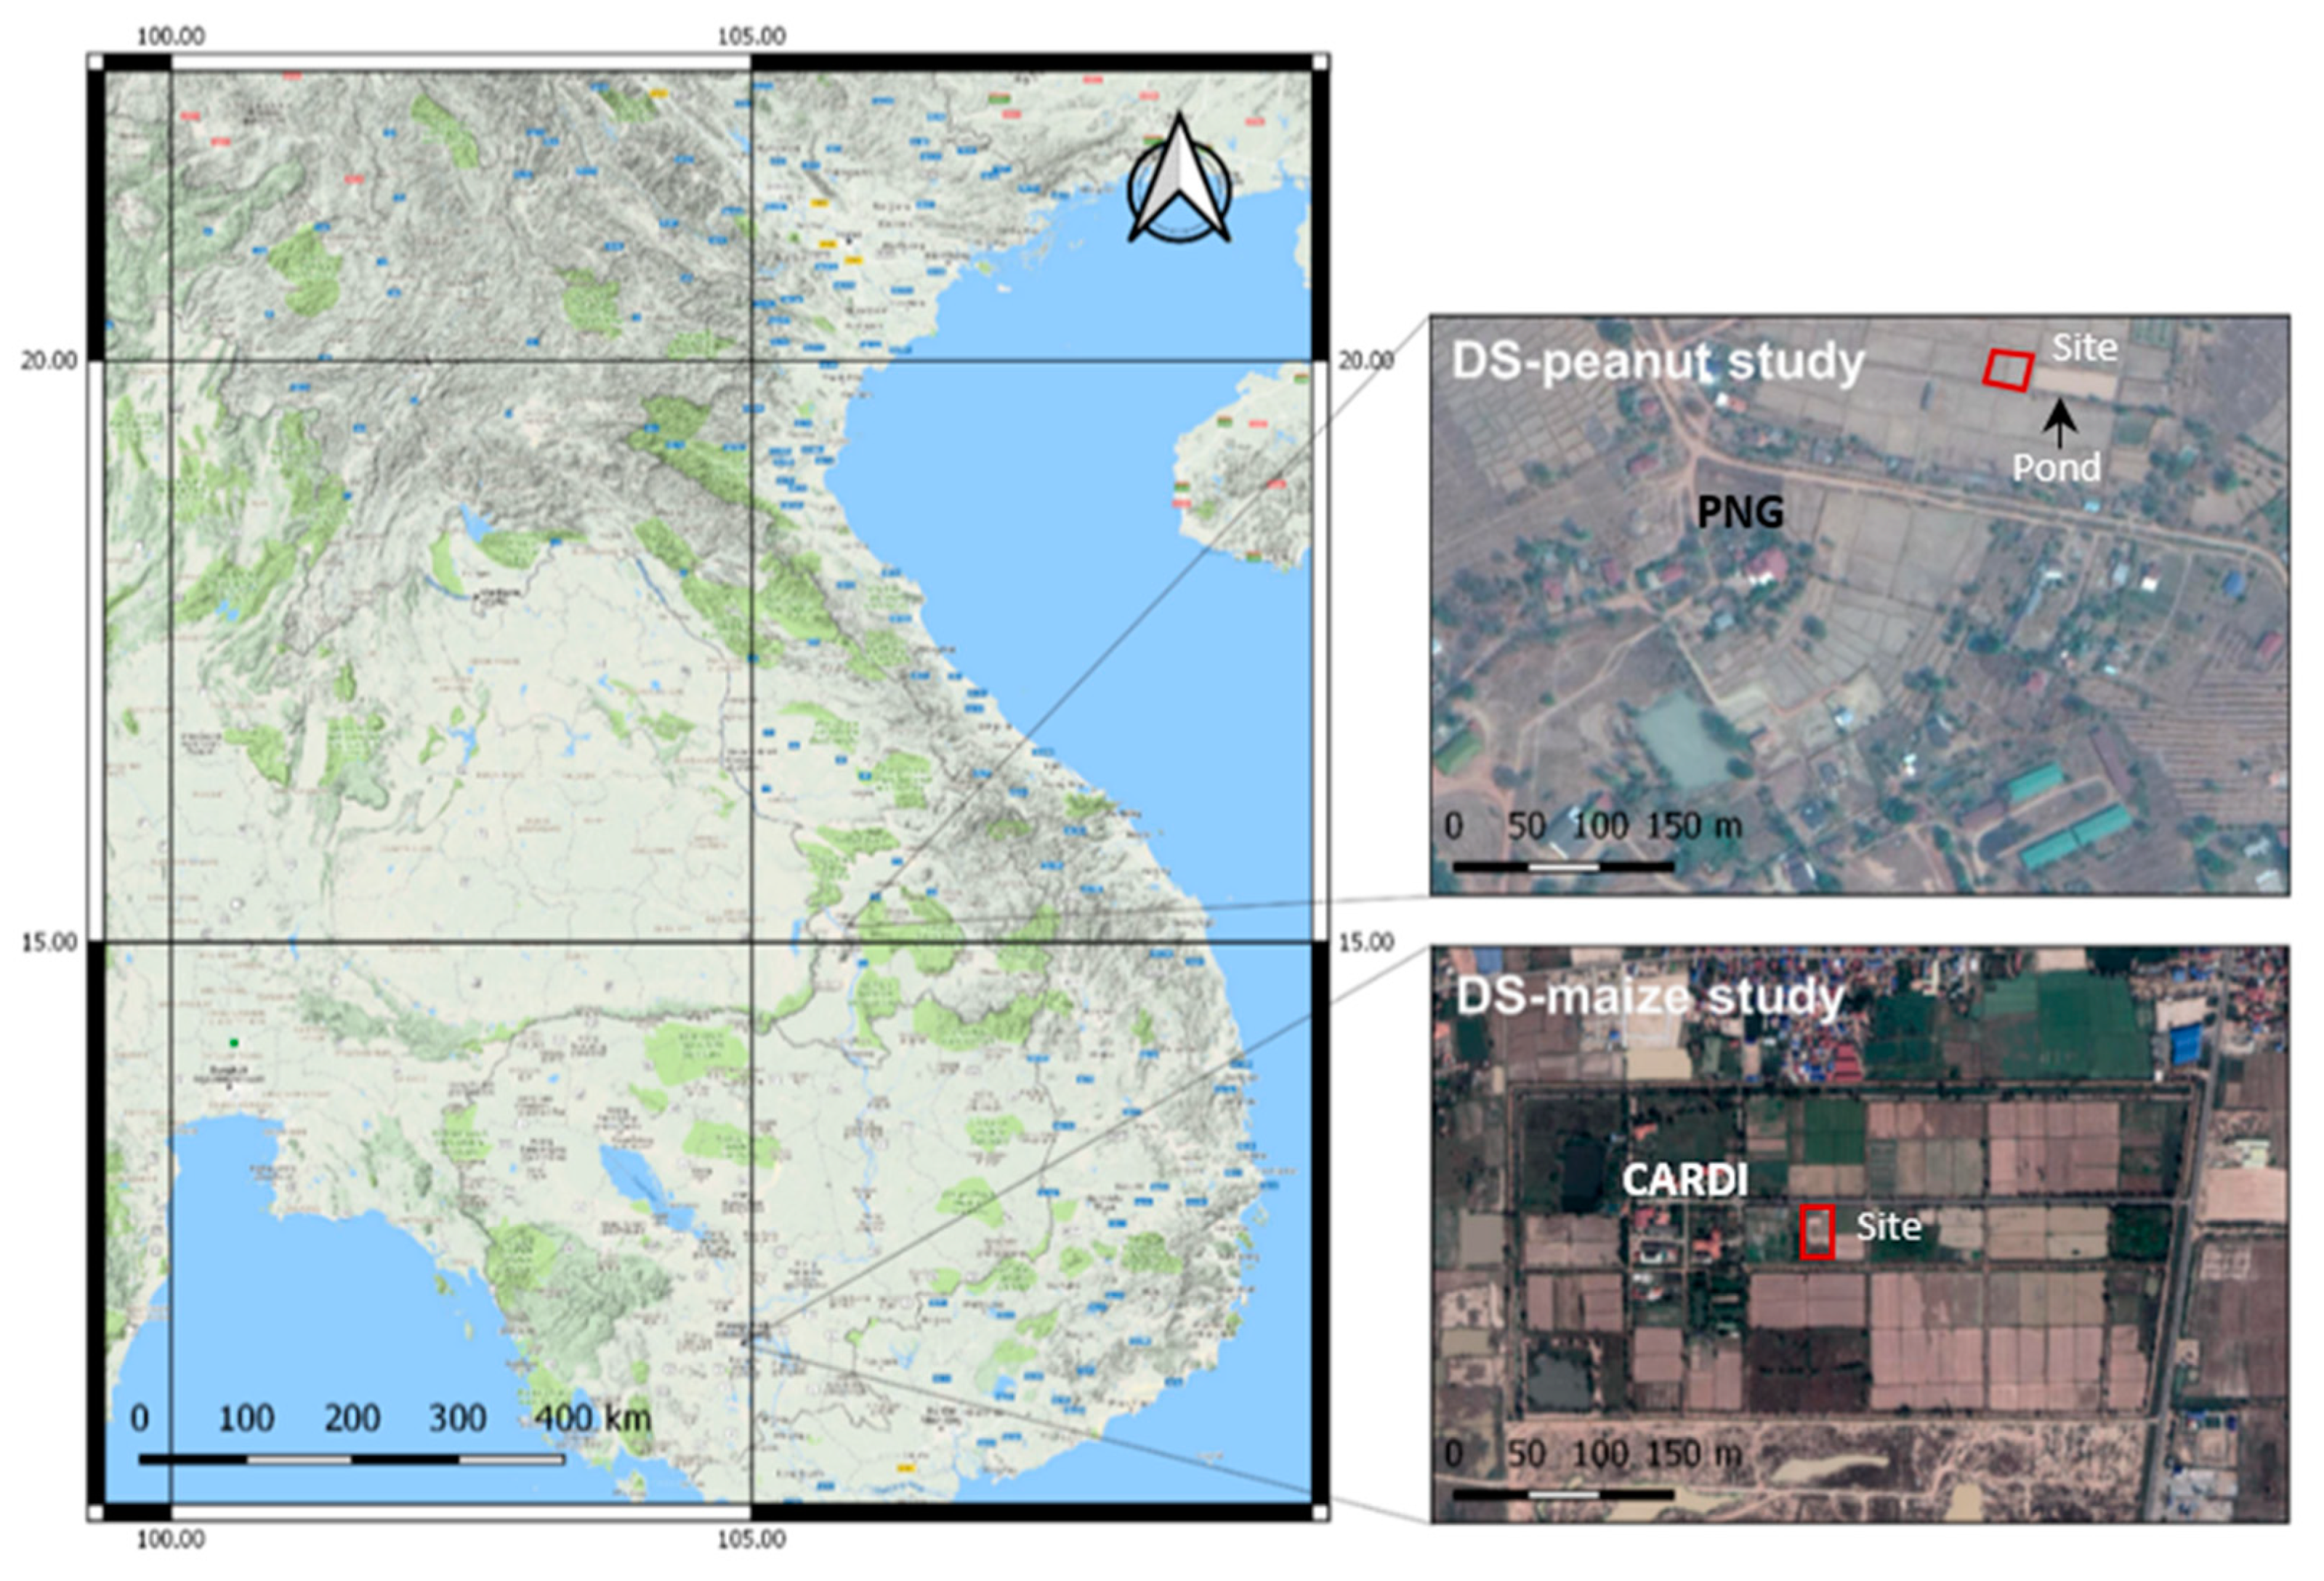
The study was conducted during the 2015/16 dry season at two sites representative of the lowlands located in Cambodia and Laos, where the historical land use is predominantly wet-season rice production (
Figure 1). The first site was located at the Cambodian Agricultural and Research Development Institute (CARDI), Dangkor district, Phnom Penh province (11°28′34.27″ N, 104°48′32.26″ E elevation 17 m). The second site was located at the Phone Ngam Rice Research Centre, PNG (15°08′14.97″ N, 105°47′13.78″ E elevation 101 m), Pakse district, Champasak province in southern Laos.
Both sites experience a tropical monsoonal climate where the long-term average rainfall received is ~1400 mm at CARDI and ~2000 mm at the PNG. The majority of the rainfall falls during the summer-wet season from May to October [
19,
20]. Based on the 1998 FAO\UNESCO (Food and Agricultural Organization of the United Nations\United Nations Educational, Scientific and Cultural Organization) classification, soils at the two locations were identified as Gleyic Acrisols [
21].
2.2. Experimental Design and Agronomic Trial Management
2.2.1. Dry Season Furrow-Irrigated Maize Study (DS-Maize)
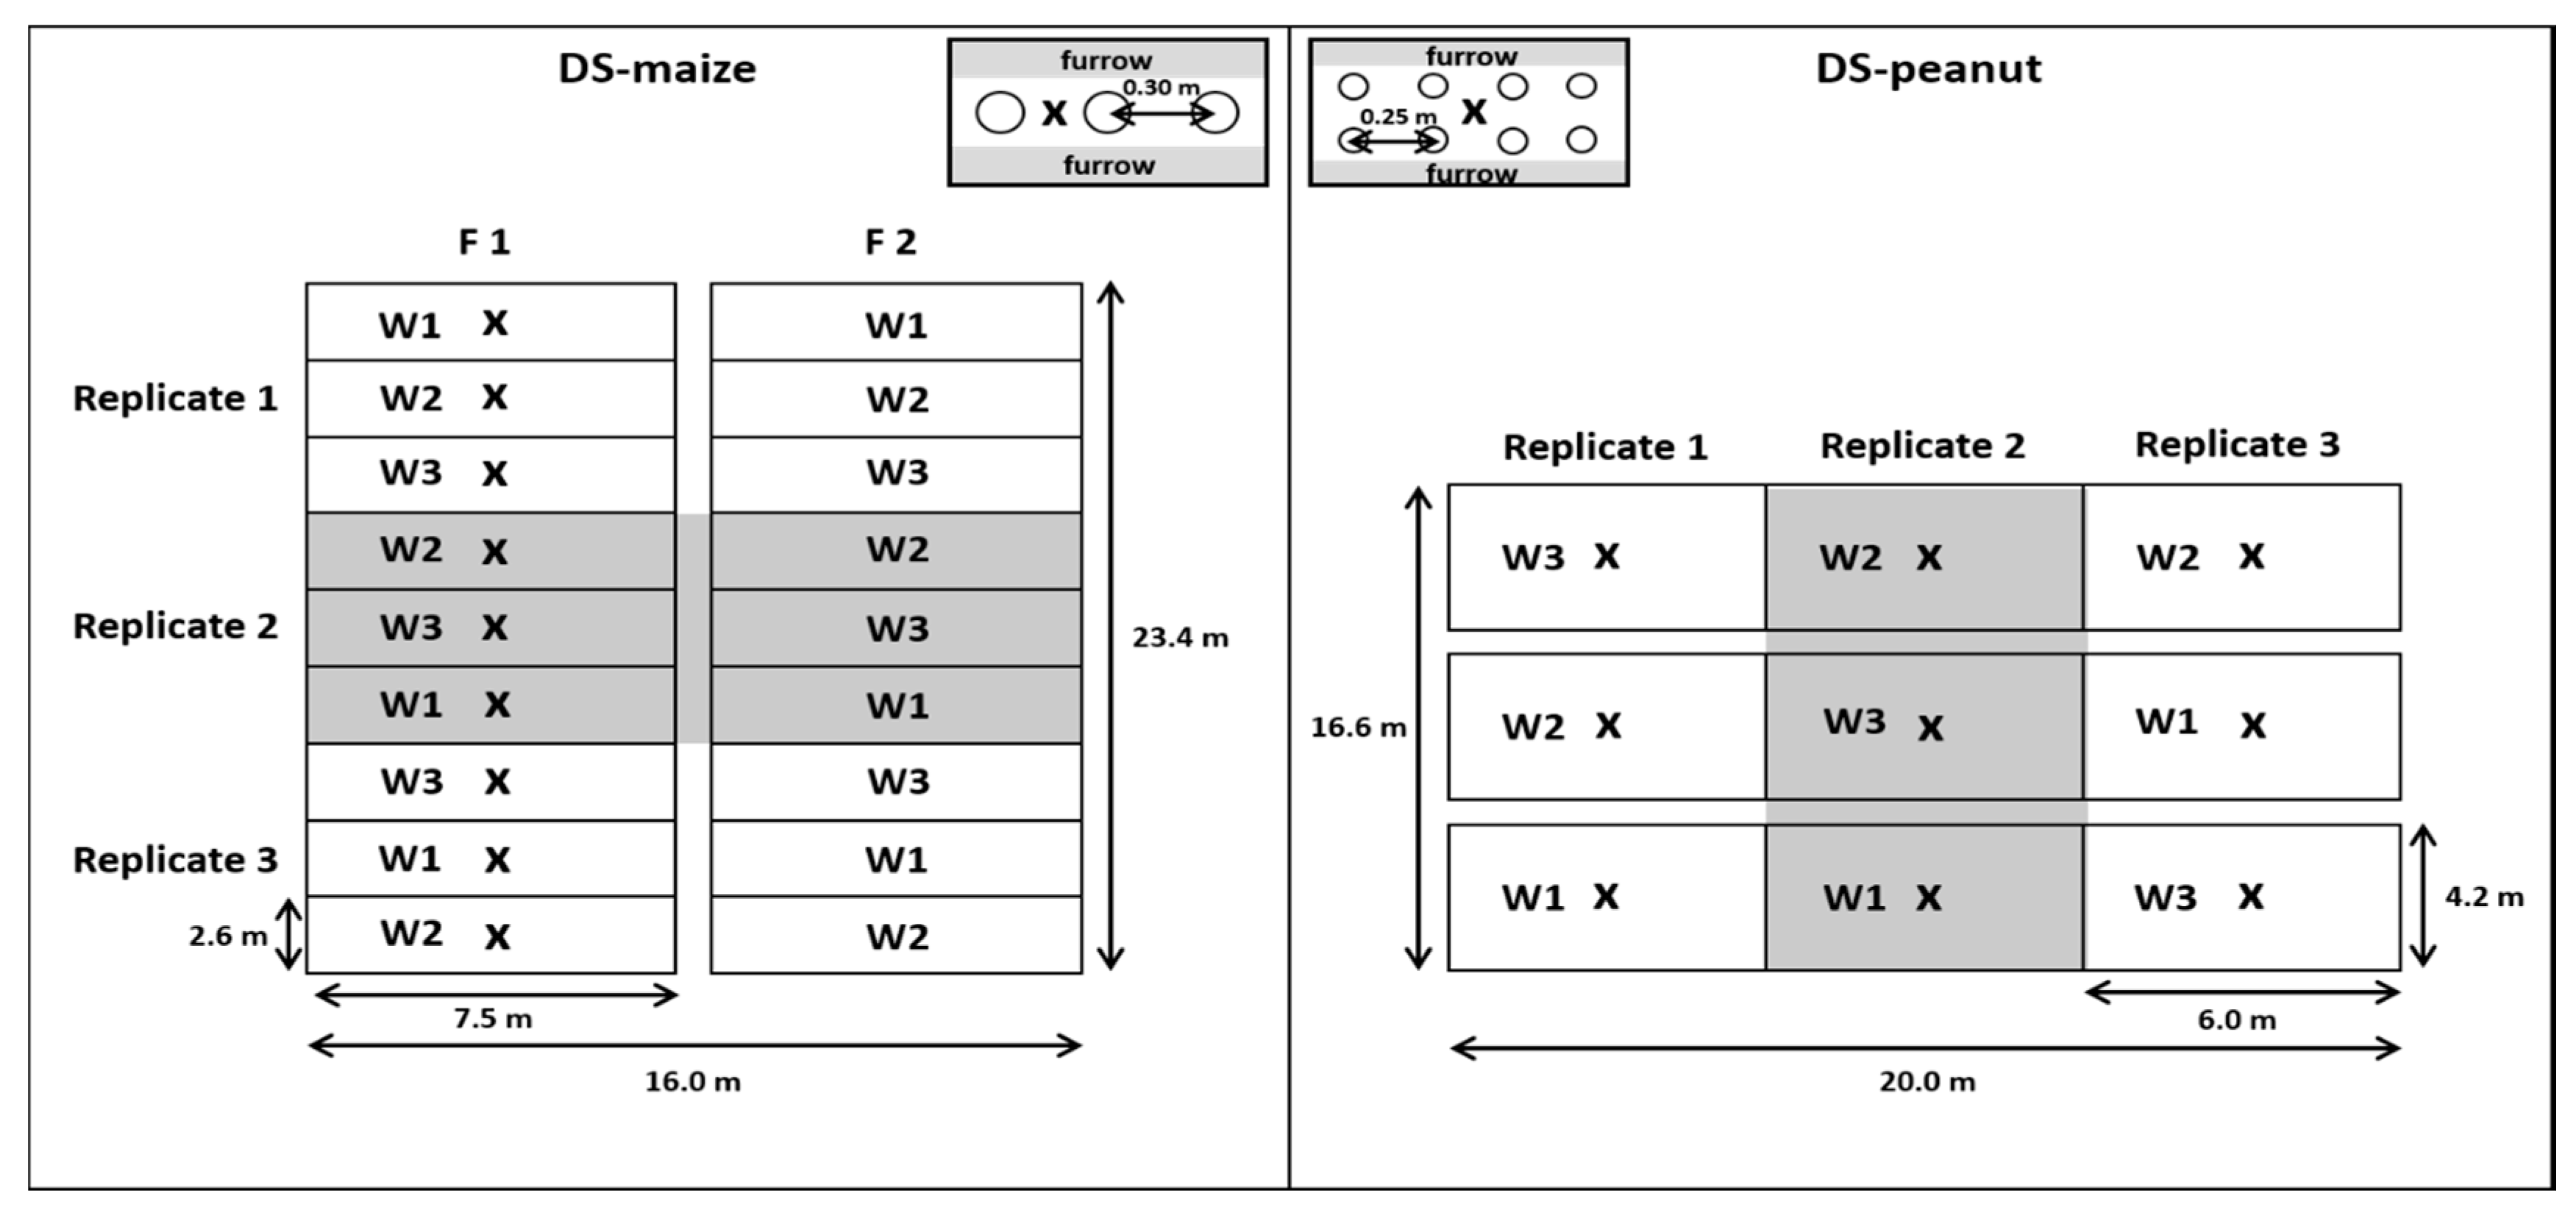
The experimental design was a three by two factorial randomised split plot design with three replicates per treatment (
Figure 2). Each replication (7.5 m × 2.6 m) consisted of four beds of which only central beds were used for the crop performance monitoring.
Seeds of the waxy maize variety CM1 (CM: Cambodian Maize; one ear plant
−1) released in 2015, were hand-sown over the hills on 21 January 2016 into pre-saturated soils leaving three seeds per hollow at approximately 3.0 cm depth (one row per hill). Two weeks later, plants were thinned to leave only one plant per hill. Row and plant spacing along with selected agronomic information about the site (sowing and harvest date, plant density, etc.) are shown in
Table 1.
To facilitate crop establishment after planting, the site was hand watered for approximately 2 weeks post-emergence, after which furrow irrigation was applied according to the specified irrigation regime. At this site, three irrigation treatments were applied, in which irrigation events were originally intended to be triggered when soil matric potential (Ψm) readings at 15 cm depth in the centre of the bed reached −30, −50 or −80 kPa (W1, W2 and W3, respectively). However, very low readings of the gypsum blocks early on in the experiment precluded their use for this purpose and instead irrigation treatments were subsequently based on frequency of irrigation being approximately: every four days, every seven days and every 10 days, respectively. Irrigation water was delivered until the furrows were completely full and the duration of each irrigation event was recorded. The known flow rate of the irrigation pump was then used to estimate irrigation volumes and depth. The electrical conductivity (EC) of the irrigation water was throughout the season ~0.13 mS cm−1.
Two fertiliser rates were also tested in this study: the standard rate recommended by CARDI (F1 90N-60P2O5-30K2O kg ha−1); and one and a half times the recommended rate (F2 135N-90P2O5-45K2O kg ha−1). The day before seeding, fertiliser was applied and incorporated into the planting row as urea (47 kg ha−1 and 70 kg ha−1 in F1 and F2, respectively), diammonium phosphate (DAP; 130 kg ha−1 in F1 and 195 kg ha−1 in F2) and potassium chloride (KCl; 50 kg ha−1 in F1 and 75 kg ha−1 in F2) to supply 50% of the N rate and 100% of the P and K rates as basal fertiliser. The remaining 50% of N was supplied as urea in both treatments four weeks post-emergence. Several applications of pesticide were made throughout the season to prevent damage caused by the Asian corn borer (Ostrinia furnacalis).
2.2.2. Dry Season Furrow-Irrigated Peanut Study (DS-Peanut)
The experimental design was a randomised complete block design replicated three times. Each plot was ~6.0 m × 4.2 m and consisted of seven beds per plot. Plots were separated by a 1 m guard row whilst a 2 m buffer zone was left between replicated blocks (
Figure 2). As in the study conducted at CARDI, the irrigation treatments were originally intended to be triggered by critical Ψ
m readings at 20 cm depth of −30 kPa, −60 kPa and −90 kPa for treatments W1, W2 and W3, respectively. However, very low matric potential values soon after furrow irrigation commenced prevented the use of the gypsum blocks for scheduling irrigation and instead irrigation treatments were subsequently based on frequency of irrigation being every four days, every seven days and every 10 days, respectively.
Irrigation water quality was good and observations of EC across the season remained ≤0.31 mS cm−1.
Prior to bed formation, rice crop residue from the preceding wet season was incorporated into the soil. Lime was then applied at a rate of 1.0 t ha
−1 (for selected agronomic information, please see
Table 1) and incorporated with a rotary hoe. Following bed formation, commonly available chemical fertiliser (15:15:15 NPK) was banded along the centre of each bed at a depth of ~3.0 cm at a rate of 155 kg ha
−1 and the site was hand-sprinkler irrigated. On 19 December 2015, freshly harvested, uninoculated peanut seeds of a local variety were sown into hand-made hollows at a depth of ~2.5 cm along two rows located at the edge of each bed (row and hill spacing was 0.30 m and 0.25 m, respectively).
Pre- and post-planting, the site was hand-watered using water from a nearby pond until 28 January 2016, when furrow irrigation commenced according to the same calendar schedule adopted for the DS-maize study (see
Section 2.2.1). At this site, irrigation volumes applied to individual plots were manually recorded using an inline flow meter (Multi Jet, ARAD Ltd., Dalia, Israel). Water quality (pH, electrical conductivity, salinity and total dissolved solids) was monitored throughout the season using a hand-held meter (Aqua-CP/A, TPS Australia, Brendale, QLD, Australia).
Pesticide was applied on 6 January 2016 after evidence of insect damage was found and hand weeding was conducted approximately every two weeks to reduce water and nutrient competition from volunteer rice and perennial grasses.
2.3. Soil Physiochemical Properties
Soil physical and chemical properties obtained from soil samples taken at three depths (0–20, 20–40 and 40–60 cm) prior to land preparation at both sites (
n = 6 and 27 at the DS-maize and DS-peanut studies, respectively) are shown in
Table 2. The soils at both sites were poor in terms of structure and nutrient availability with exceedingly low cation exchange capacity (CEC). At the DS-maize study site at CARDI, soil texture at 0–40 cm was sandy loam with the mean bulk density of 1.66 Mg m
−3 in the surface layer (0–20 cm). At the DS-peanut site, soil texture was classified as sandy loam (0–40 cm) and sandy clay loam at greater depths (40–60 cm). At this site, mean bulk density varied with depth (from 1.54 to 1.80 Mg m
−3) being significantly lower at 0–20 cm when compared to the deeper layers (
p ≤ 0.0001).
At both sites prior to crop establishment, soils in their native state were moderately acidic in the surface layer, and more so at the DS-peanut site. The pH at both sites increased with depth and remained largely acidic with the exception of samples taken at 20–40 cm at the DS-maize site, where the soils were moderately alkaline. Organic matter was low at both sites in the surface layer (0–20 cm). Generally, the soils were of low salinity (EC1:5 < 0.20 dS m−1 and EC1:5 < ~0.01 dS m−1 for the DS-maize and DS-peanut studies, respectively). At all three sampling depths at the DS-peanut site, CEC calculated as the cumulative total of exchangeable cations (Ca2+, Mg2+, K+, Na+ and Al3+), was exceedingly low. However, CEC increased slightly at depth (40–60 cm: 3.49 meq 100 g−1) in contrast at the two upper depths (0–20 cm and 20–40 cm: 1.62 and 1.84 meq 100 g−1, respectively), due to the increase in clay content in the deeper soil layer.
For the DS-maize study, soil samples were taken at flowering in two plots per treatment (n = 24). At this stage, additional samples were also taken at 60–80 cm depth. A third sampling occurred post-harvest when soil samples were taken at random locations at depths 0–20, 20–40 and 40–60 cm within each plot (n = 27).
For the DS-peanut study, additional soil sampling was also taken at 0–20 cm depth from the centre of a bed within each plot (n = 9) post-fertiliser application.
Soil properties assayed for at both sites included particle size, bulk density, pH, EC, organic matter, ammonium N, nitrate N, Bray available P and exchangeable cations.
2.4. Meteorological Conditions
Local meteorological conditions (wind speed and direction, rainfall, atmospheric pressure, temperature, relative humidity and solar radiation) were monitored using an on-site automatic weather station (AWS) at each site. Data was digitally recorded using a data logger (CR800 at the DS-maize study and CR1000 at the DS-peanut study, Campbell Scientific, Logan, UT, USA).
At the DS-peanut study, data loss occurred due to instrumental/power failure (19–31 December 2015 and 1–21 April 2016) and agroclimatological data obtained from the NASA Langley Research Center POWER (Prediction of Worldwide Energy Resources) Project funded through the NASA Earth Science Directorate Applied Science Program were used to gap-fill the dataset.
At both sites, reference evapotranspiration (ET
o) was calculated using the FAO ET
o Calculator [
22]. Standard crop coefficient values (K
c) were then applied to daily estimates of ET
o to determine seasonal water requirements for each crop [
23].
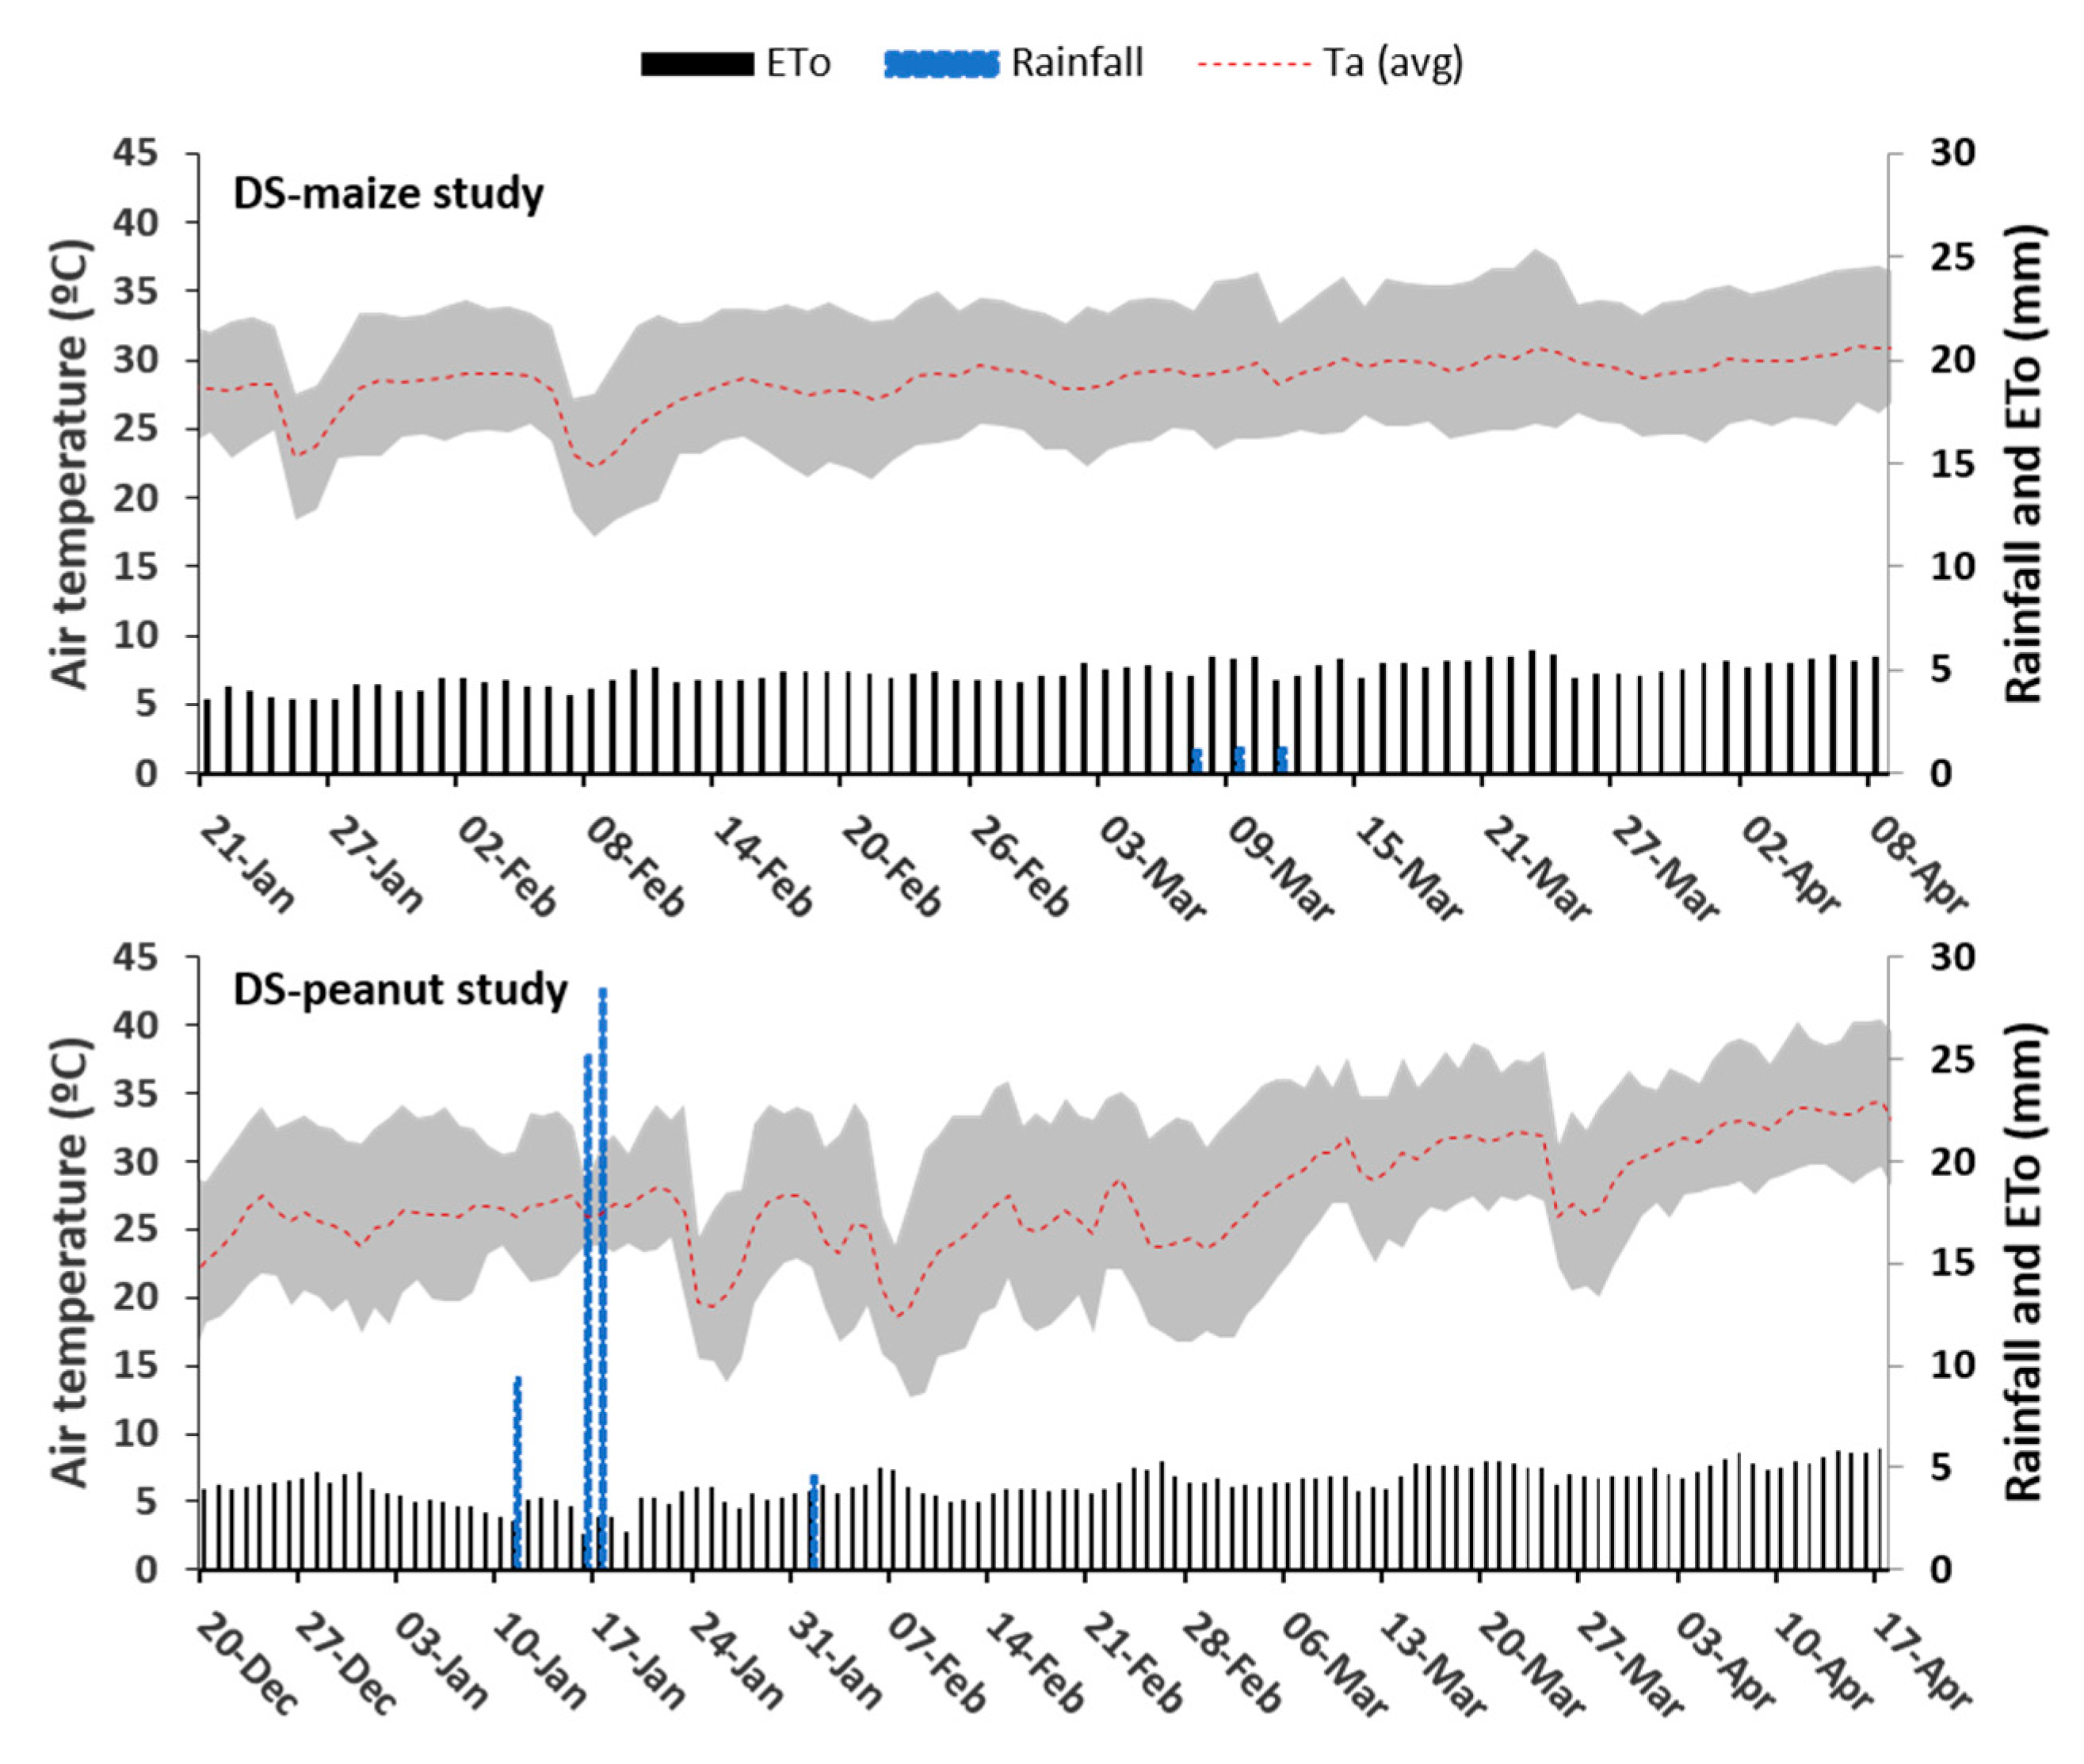
Average, maximum and minimum daily air temperatures (T
a), total daily rainfall and ET
o at both locations during the study are presented in
Figure 3. The average daily T
a for the DS-maize study was 28.7 °C and no rainfall events were recorded during that time. For the DS-peanut study, the average daily T
a over the growing season was 29.8 °C and total rainfall 77.0 mm, 53.6 mm of which were recorded over two days early in the season (16–17 January 2016). The evaporative demand of the atmosphere steadily increased as the season progressed. Estimated seasonal ET
o for the DS-maize and DS-peanut study was 379.3 mm and 529.0 mm, respectively.
2.5. Soil Moisture Monitoring
Gypsum block sensors were installed in both sites for monitoring soil matric potential throughout the season. For the DS-maize study, two individual sensors were installed at 15 cm and 45 cm depth in three plots per irrigation treatment fertilised with the F1 rate (
n = 18). Sensors were located in a representative bed of the plot and between plants as shown in
Figure 2. For the DS-peanut study, two gypsum block sensors were buried at ~20 cm and 40 cm each in the centre of a representative bed in each plot (
n = 18). Data from the sensors was downloaded every 1–4 days using an electronic retriever unit (G-Bug soil moisture datalogger and MEARetriever, Measurement Engineering Australia (MEA), Magill, Australia).
2.6. Crop Development and Biomass Production
Ground canopy cover (CC) was monitored using the freely-available smartphone application Canopeo [
24], whereby images taken at three randomly selected locations within each plot were used to determine the average value. For the DS-maize study, measurements were only taken during the month of February due to limited staff available resources. For the DS-peanut study, measurements were taken twice per week throughout the majority of the growing season (
n = 14).
Phenological development at both sites was also monitored throughout the season and aboveground biomass (AGB) was measured using standard destructive methods when ~50% of plants within each plot reached major phases of development. For the DS-maize study, this included sampling of maize AGB during the vegetative stage as well as at flowering and final harvest. Four plants from pre-defined sampling locations within each plot were taken and fresh weight was recorded. Dry mass was then obtained by oven-drying the plants for 48 h at 80 °C [
25]. At harvest, cobs and stems were separated and weighed individually. Furthermore, canopy height for three individual plants per plot was also recorded at each major development stage.
For the DS-peanut study, AGB was measured at flowering, pegging, pod development and final harvest. A larger plant sample (n = 28) was used in this case to estimate AGB from which sub-samples were taken and fresh weight recorded. The samples were then oven-dried at 70 °C for 48 h and re-weighed to determine dry mass.
Ten weeks after seeding (30 March 2016), soil was excavated and root growth assessed at the DS-maize study in two plots per irrigation treatment (one plot per fertiliser rate). Seven weeks after trial establishment, soils at the DS-peanut study were also excavated to inspect root expansion and confirm nodulation.
2.7. Maturity, Final Yield and Water Productivity
Final harvest for the DS-maize study took place on 8 April 2016. Plant samples were taken within each plot from a sampling area of 4.29 m2 (22 plants) and fresh cob weight and grain yield at 14% moisture determined.
In the DS-Peanut study, harvest dates for each plot were determined based on a maturity assessment that was conducted on 23–24 March 2016 using the pod blasting method described in [
26]. Once harvested, total fresh pod yield was recorded. Dry pod weight was determined by oven-drying a 1 kg sub-sample at ~70 °C for 48 h.
Water productivity (WP) at both sites was calculated as the ratio between grain yield and total amount of irrigation water applied (kg m−3).
2.8. Statistical Analysis
One-way and two-way analyses of variance (ANOVA) were used to determine whether there was a statistically significant difference in crop development and yield among treatments within the DS-maize and DS-peanut studies, and to examine the interaction between irrigation and fertiliser treatments on plant growth in the DS-maize study. Significant differences between treatments was tested using the least significant difference (LSD) post-hoc test; unless otherwise stated, the level of significance was set at p ≤ 0.05.
3. Results
3.1. Soil Properties
Results from the soil analysis conducted at flowering and harvest at the DS-maize site showed that fertiliser application increased the mean concentration of available P within the surface layer of soil profile (0–20 cm) but not the concentration of organic matter or total N (
Table 2). Fertiliser application also increased soil EC as well as the mean concentration of cations, which in the case of Na
+, was significantly higher in the treatment fertilised at one and a half times the recommended rate (e.g., F1 = 0.39 cmol kg
−1; F2 = 0.63 cmol kg
−1). There were no statistically significant differences for the other parameters assessed between fertiliser treatments at post-fertiliser application.
Post-lime application for the DS-peanut study, pH (H
2O) for soils sampled at 0–20 cm increased from 4.7 to 5.9 (
Table 2). There was a statistically significant ten-fold reduction in exchangeable Al from 0.26 to 0.02 cmol kg
−1 associated with the application of lime. The mean concentrations of other exchangeable cations increased significantly (Ca
2+ (Δ = 0.50 cmol kg
−1,
p ≤ 0.0001), Mg
2+ (Δ = 0.31 cmol kg
−1,
p ≤ 0.0001), K
+ (Δ = 0.71 cmol kg
−1,
p ≤ 0.001) and Na
+ (Δ = 0.22 cmol kg
−1,
p ≤ 0.001)).
Prior to the lime and fertiliser applications, the mean concentration of ammonium (NH4+) and available P at 0–20 cm depth was 8.32 and 2.59 mg kg−1, respectively. Mean concentration of nitrate (NO3−) was negligible (0.07 mg kg−1). Concerning post-fertiliser application, there was a statistically significant increase in the mean concentrations of NH4+ (35.31 mg kg−1) and available P (13.48 mg kg−1).
3.2. Irrigation and Crop Water Requirements
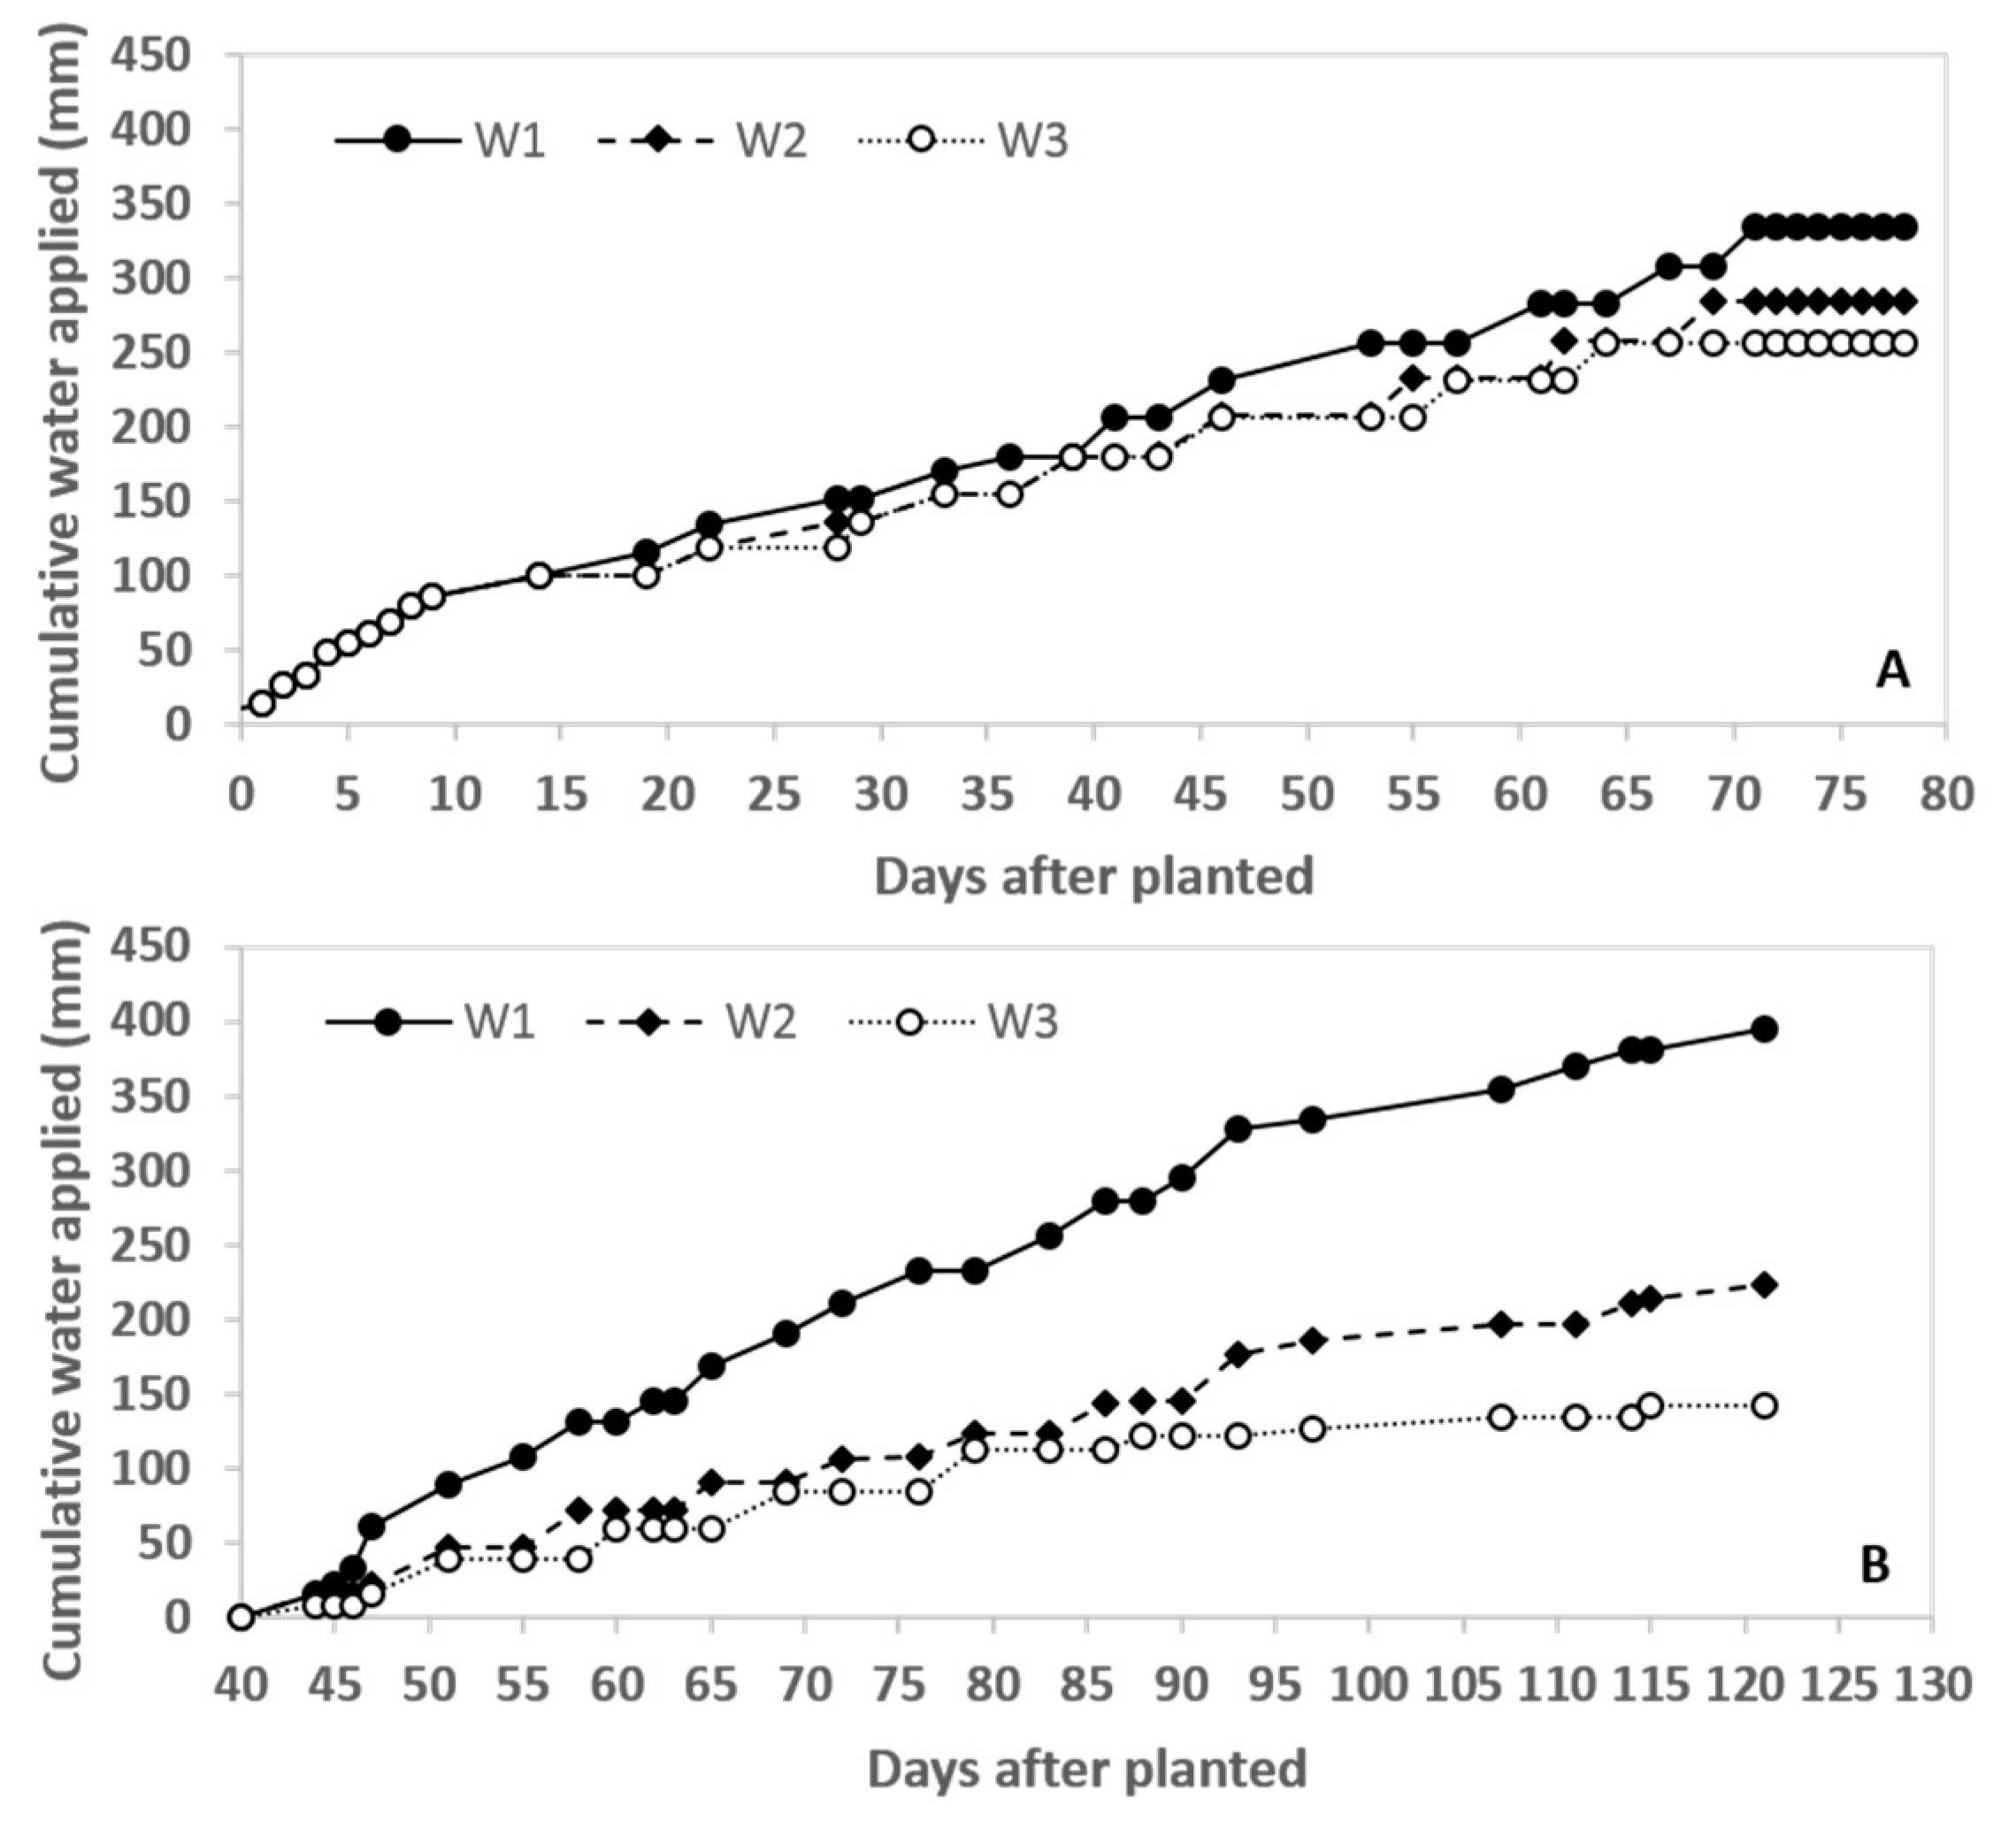
The average cumulative water applied to the W1, W2 and W3 treatments in the DS-maize study was 328 mm, 276 mm and 251 mm, respectively (
Figure 4). The difference in mean total water applied among treatments was statistically significant (
p ≤ 0.05). The estimated seasonal crop water requirement was 295.73 mm, which was met in the W1 treatment, was close in the W2 and short in the W3. For the DS-peanut study, treatments W1, W2 and W3 received on average 403 mm, 231 mm and 149 mm, respectively. The estimated seasonal crop water requirement for DS-peanut production was 431.1 mm and whilst water delivery to the most frequently irrigated treatment was sufficient, the volume of water supplied to the remaining treatments fell well short.
3.3. Soil Matric Potential
Soil matric potential recorded during the crop season at both sites is depicted in
Figure 5. As illustrated, gypsum block readings at both depths remained relatively steady (above −45 kPa in the maize study and above −25 kPa in the DS-peanut study) during the early vegetative stages of production when crop was hand-watered daily.
In the maize study, furrow irrigation commenced on 4 February 2016. Approximately two weeks later, Ψm at 15 cm depth decreased sharply, first in the W3 treatment and then in the W2 and W1 treatments, reaching values < −200 kPa at the end of February in spite of irrigation. Deeper in the soil profile, sensors at 45 cm depth indicated steady Ψm values (between −30 and −49 kPa) in all water treatments until early March, after which values gradually decreased as plant water use increased and soil water was depleted. Notably, soil water at this depth appeared to deplete at a faster rate in the W1 treatment when compared to the other two treatments.
Similar results were observed in the DS-peanut study whereby Ψ
m remained stable (~−15 kPa) at both sensor depths during the period of hand-watering (28 January–6 February 2016). Within the first week of furrow irrigation, there was a rapid decrease in Ψ
m at 20 cm depth in all three water treatments. Note that the average rate of Ψ
m decrease within the mid-frequency irrigation treatment (W2) at both 20 and 40 cm depth was greater when compared to W1 and W3 (
Figure 5). By the end of February, sensors at both depths in all plots did not respond to irrigation events and Ψ
m dropped to values ≤−200 kPa.
3.4. Canopy Cover and Biomass Production
In the DS-maize study, both fertilisation and irrigation treatments had a statistically significant effect on CC (
Table 3). The F2 treatment had a significantly greater percentage of CC than F1 on 11 February 2016. Within irrigation treatments, plots irrigated more frequently (W1) had a higher mean fraction of CC compared to treatments W2 and W3 throughout the measurement period.
Differences became statistically significant on 15 February 2016, when Ψ
m at 15 cm depth began to decline in the W2 and W3 treatments (
Figure 5). On the final date of measurement (23 February 2016), mean CC of W3 was significantly less than that of W1 and W2. Furthermore, a significant interaction was observed between irrigation and fertiliser treatments on 15 February 2016.
Similar to what was observed for CC, irrigation treatment had a statistically significant effect on aboveground dry matter at different stages of crop production (
Table 3). Throughout the season, mean dry matter production was consistently greater for the more frequently irrigated treatment (W1). Differences between the less frequently irrigated treatments (W2 and W3) were only statistically significant during the vegetative stage (25 February 2016) and at the time of harvest maturity (8 April 2016). There were no significant differences in mean AGB between fertiliser treatments, nor was there an interaction between irrigation and fertiliser treatment.
At maturity, mean root length for the W1, W2 and W3 treatments was 17.0, 15.5 and 16.0 cm, respectively. Regarding canopy height, plants from the treatment W1 had the greatest plant height (1.90 m), while plants from the treatment W3 had the least plant height (1.69 m;
Table 3). Fertiliser rate did not have any effect on plant height.
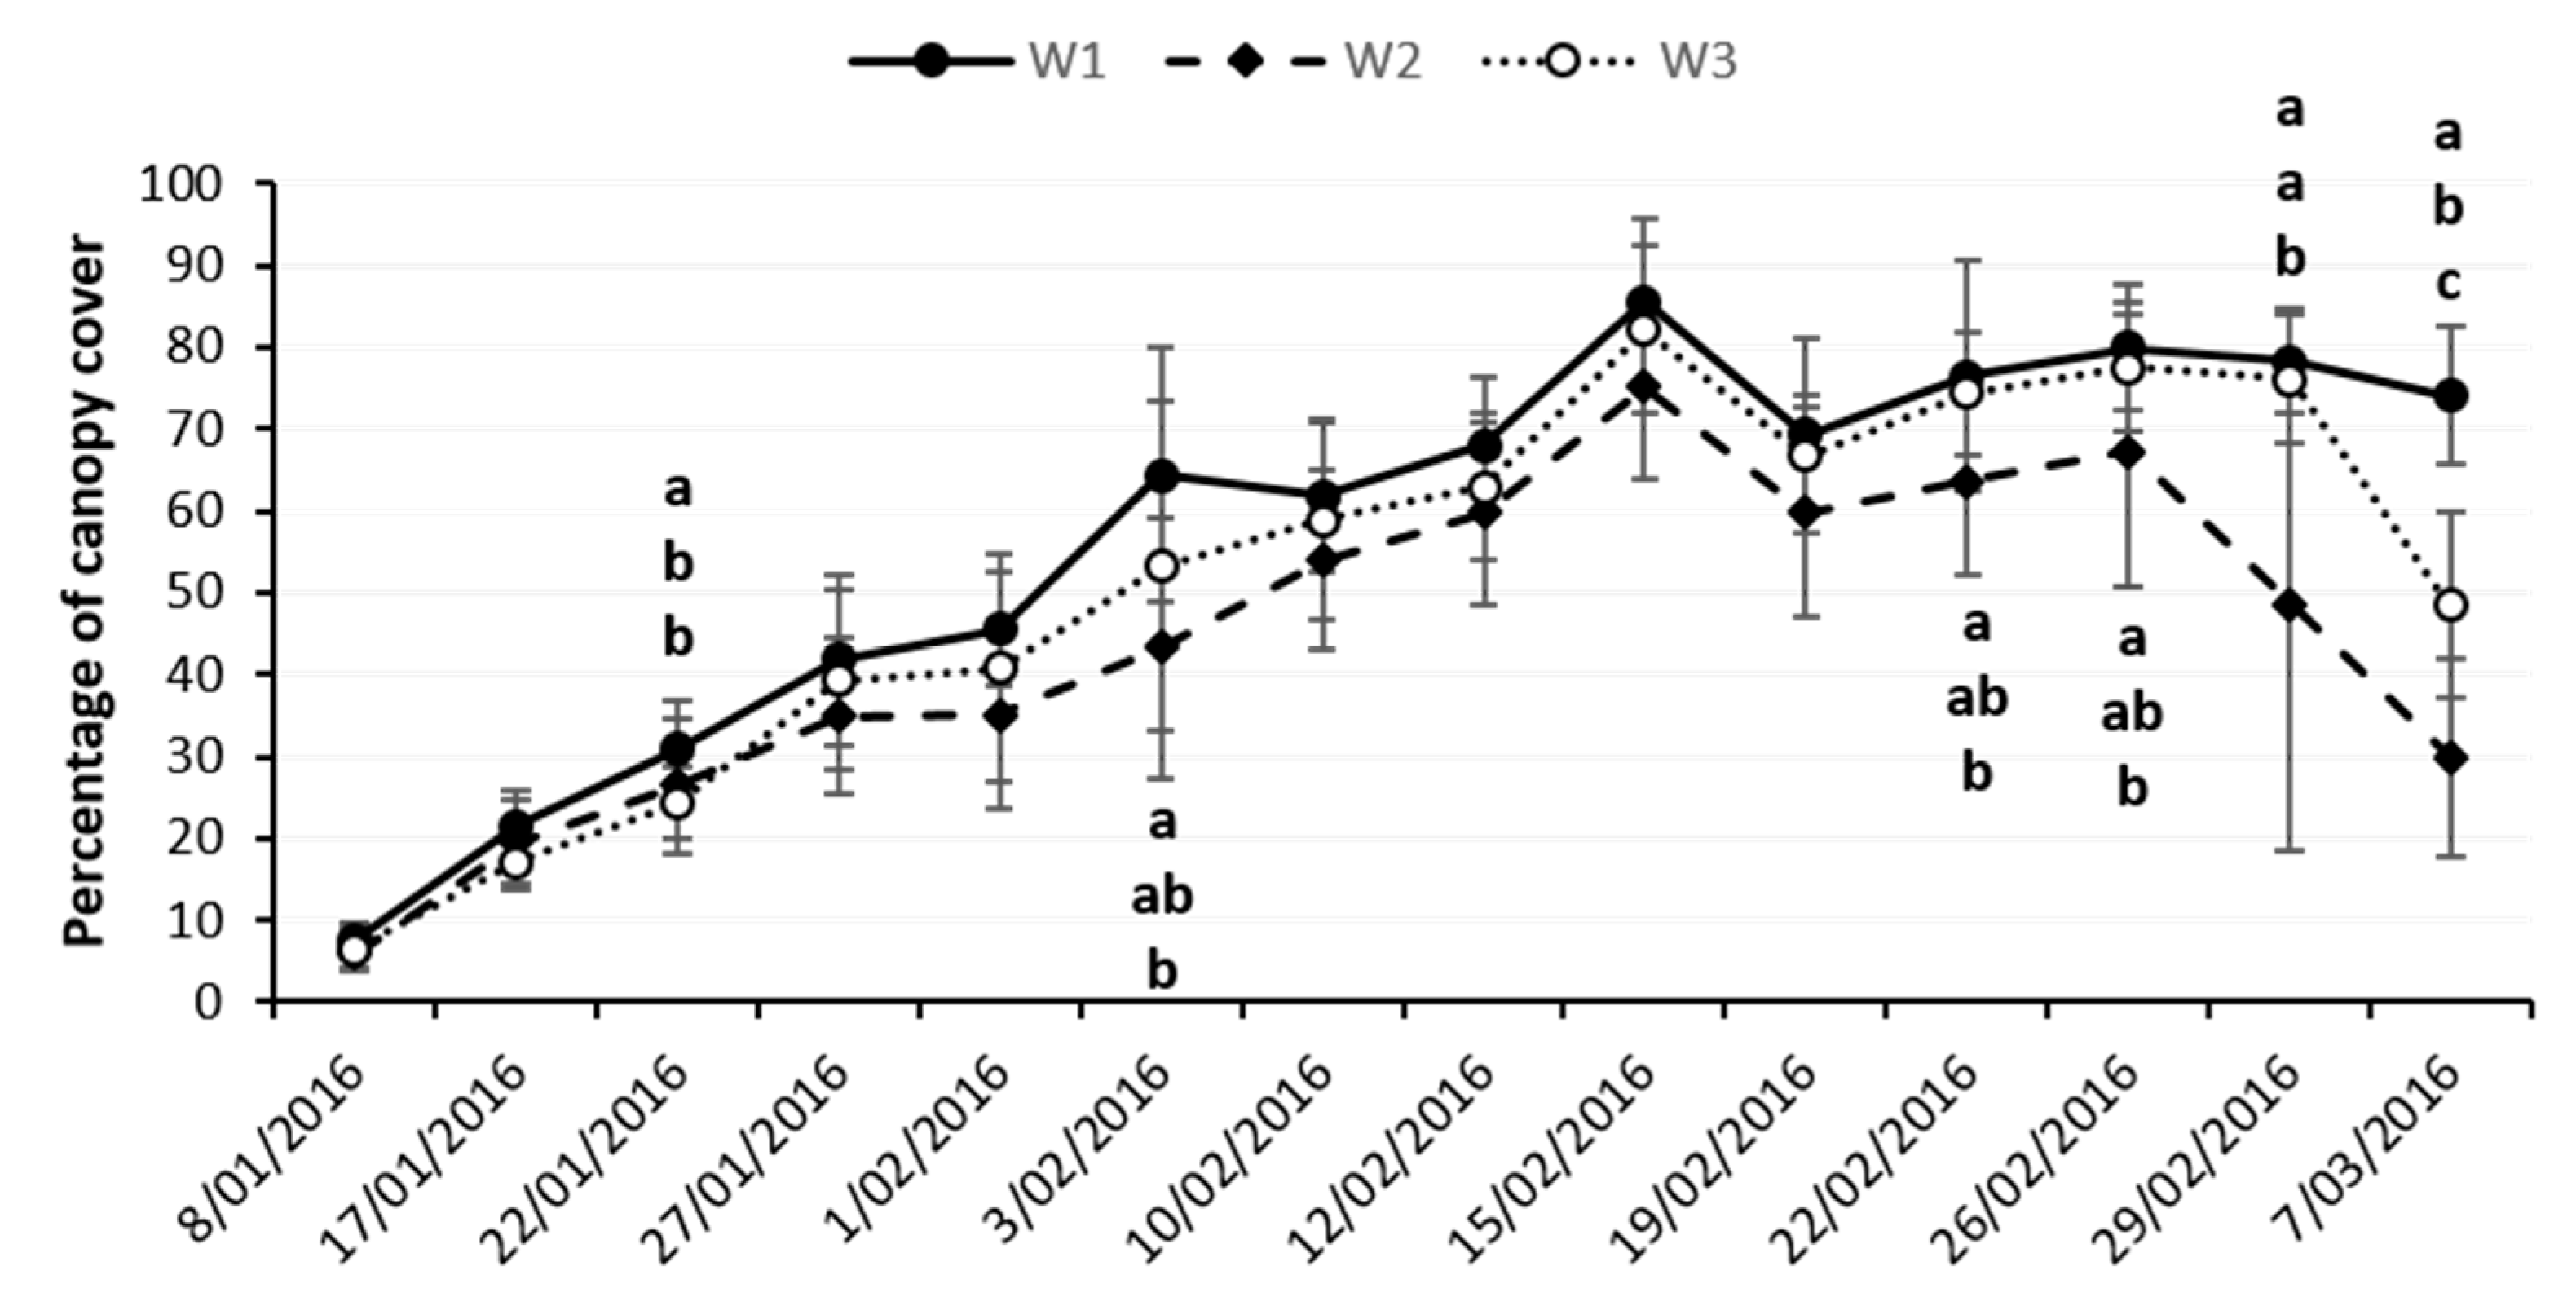
In the DS-peanut study, flowering occurred sequentially at 32 days after sowing (DAS) in W1 (20 January 2016), 34 DAS in W2 (22 January 2016) and 37 DAS in W3 (25 January 2016). There was a statistically significant difference in the mean percentage of CC between treatments on 22 January 2016, 3 February 2016 and from 22 February 2016 through to the end of the observation period (
Figure 6). On 22 January 2016, mean CC of the more frequently irrigated treatment (W1) was significantly greater than in W2 and W3. From this date forward, observed CC for W2 was lower (
p ≤ 0.05) than in W1 on all measurement dates and lower (
p ≤ 0.05) than in W3 on 29 February 2016 and 7 March 2016.
Mean AGB for the DS-peanut study was similar among irrigation treatments at flowering, pegging (9 February 2016) and pod development (7 March 2016), with no statistically significant differences observed between treatments (
Table 4).
3.5. Final Yield, Maturity and Water Productivity
Mean grain yield in the DS-maize study ranged from 2.22 t ha
−1 in the more frequently irrigated treatment (W1) to 1.43 t ha
−1 in the least frequently irrigated treatment (W3). There were no statistically significant differences between these treatments (
Table 3). Average values of WP for all three irrigation treatments were similar. Fertiliser rate treatments did not have an effect on grain yield or WP (
Table 3).
Results for the maturity assessment conducted at the DS-peanut study in late March, indicated that the approximate harvest dates ranged from 29 March–14 April 2016 (101–117 DAS) based on a maturation rate of 3% per day (Wieck, L. personal communications, 24 March 2016). Two plots reached the desired grain ripeness (i.e., 75–85% of seed samples) and were harvested on 31 March 2016. However, the majority of individual plots (n = 7; data not shown), due to be harvested in the first two weeks of April 2016, were left in the field until the Lao New Year Holiday period had passed. These plots were harvested on 21 April 2016. At this point in time, the maturity assessment indicated that the average grain ripeness had reached ~83%, ~51% and ~45% in W1, W2 and W3, respectively.
Irrigation frequency had a statistically significant effect on pod yield (
Table 4). W1 was the treatment with the highest pod yield (1.75 t ha
−1). Pod yield in the treatment W1 was higher (
p < 0.05) than in treatments W2 and W3. Indication of some animal damage was observed in one replicate of the W2 treatment, which may have limited yield. However, results for the pod yield were in accordance with those for AGB, with the treatment W3 having intermediate values and W2 the least values.
In terms of WP, W3 had the most efficient use of water (0.70 kg m
−3), although with no statistically significant differences in the mean value with the remaining treatments (
Table 4).
4. Discussion
Observations at both sites revealed a series of edaphic issues that may negatively affect the performance of non-rice dry-season crops. The observed constraints were mostly related to hard-setting soils, soil acidity, nutrient deficiency, low CEC and negligible organic matter, similar to what has been found elsewhere in the regional lowland systems [
10,
11,
14,
15,
27,
28,
29]. Unlike the aforementioned studies, the work presented here highlights poor lateral soil water movement (see
Section 3.3) as a poorly documented factor that could negatively affect agricultural production of field and horticultural crops in these soils. This is of particular importance when grown on a ‘conventional’ bed and furrow irrigation system, which is the common practice for dry-season crops in both countries Cambodia and Laos.
4.1. Limited Soil Water Availability and Root Expansion
The significant increase in bulk density observed in the subsurface soil layers indicated the presence of a hardpan, which could be clearly seen when soils were excavated. The hardpan is a typical feature of rice-growing soils in Southeast Asia, which is the result of traditional land preparation techniques, i.e., controlled compaction to enable the puddling process required for wet season rice production [
10,
30,
31,
32]. Indeed, mean bulk density values found in this study are in agreement with those reported for similar lowland soils within the region, which ranged from ~1.45–1.75 g cm
−3 at similar depths [
27,
33,
34].
Due to the probable low hydraulic conductivity of the compacted hardpan and possible clay translocation in conjunction with very little soil organic matter, irrigation water at both sites was seen to pool periodically within the furrows, as it was unable to be vertically transported through the system efficiently. This slow drainage is typical of the lowland soils regardless of season [
14]. Furthermore, very low soil matric potential values in response to irrigation events when the crops were furrow irrigated (
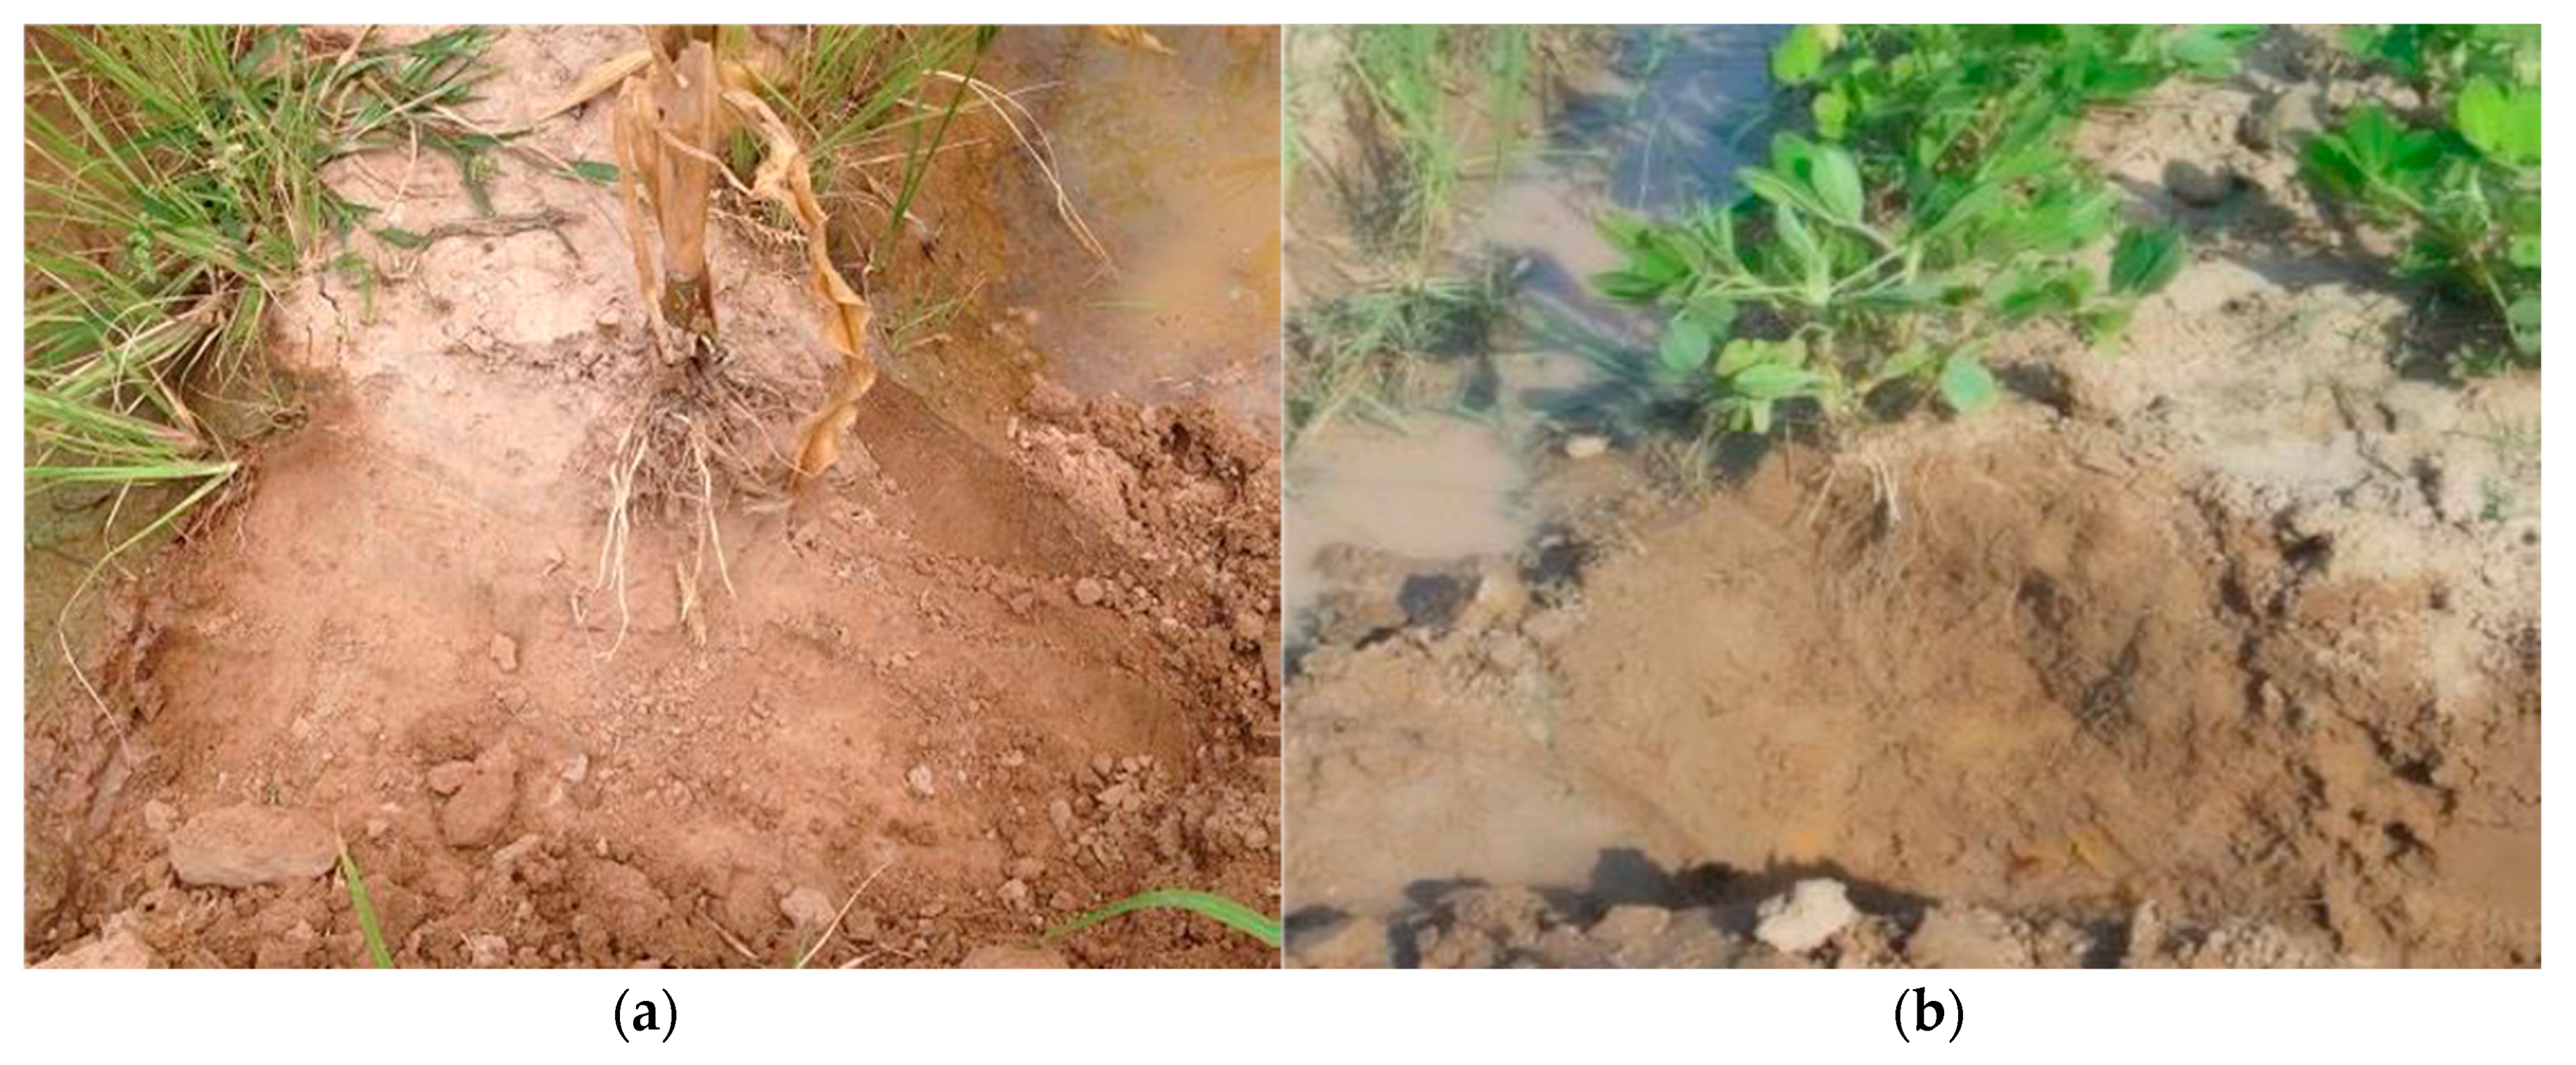
Figure 5), indicated limited lateral movement from furrow to the centre of the beds, which led to the inadequate refilling of the root zone in all treatments across both experiments. This fact was also distinctly evident during visual inspections of the field sites (see
Figure 7), which also demonstrated that vertical root expansion was restricted to the surface layer above the hardpan.
Whilst water balance modelling studies of wet season lowland rice production conducted in Cambodia and Laos suggest that large volumes of water are transmitted across fields via seepage under flooded conditions, and more so in the lower toposequence position [
5,
35,
36,
37], there is very little empirical evidence of the extent of lateral soil water distribution specific to dry-season conditions in the LMB. Therefore, further research to better understand the soil water dynamics of these systems may be justified.
To improve vertical transport of water through the soil profile and increase root access to nutrients in the deeper soil layers, mechanical disruption of the hardpan may be required. However, shallow mechanical disruption in Acrisol soils has not always proved to have an effect on root development and biomass production [
33]. The use of organic amendments has proved to be an effective means of improving soil fertility, and thus agricultural productivity, particularly during the first season of amendment [
38], as demonstrated by [
9] for maize production on Acrisol soils in central Laos. For this purpose, the use of readily available, environmentally sustainable, low-cost amendments could be considered [
9,
39,
40], such as rice husk biochar (which would not cause N tie up) or a clay-manure compost, which have been found to have a significant positive impact on maize yield and thus, on the smallholder household income [
9,
41,
42].
Additionally, periodic biomass sampling and soil excavations of the root zone in the DS-peanut study showed good nodulation, indicative of probable nitrogen fixation. Thus, decomposition of the plant residue and the subsequent N availability for rotated crops in these systems would be anticipated to reduce the need for excessive rates of N addition improving long-term soil fertility [
43].
4.2. Canopy Cover Development, Biomass Production and Yield Response to Irrigation
In the DS-maize study, the most frequently irrigated treatment (W1) had greater mean values of both CC and AGB than the other treatments (
Table 3 and
Table 4, respectively), which was likely the direct result of a greater cumulative irrigation in W1 (treatments W2 and W3 received 15.8% and 23.5% less water, respectively). However, differences in grain yield between irrigation treatments at this site were not statistically significant, most likely because of the high variability observed across W1 (coefficient of variation, CV = 34%). Moreover, linear regression of fresh fruit weight versus grain yield across all treatments showed that these two parameters were positively correlated (
r2 = 0.64;
p < 0.001). Maize grain yield obtained in this study is similar to that obtained in previous CARDI-led farmer field trials of the same variety (CM1) in similar lowland soils where yields of 2.0 t ha
−1 were commonly experienced by growers [
44]. However, these values are lower than the average maize grain yield reported for Cambodia by the FAOSTAT database for 2016 (4.69 t ha
−1), which includes yields obtained in a variety of soil types.
In the DS-peanut study, the less frequently irrigated treatments received ~43% (W2) and ~63% (W3) less water when compared to W1. Despite W2 receiving irrigation more frequently relative to W3, the amount of water applied from 01 to 90 DAS did not differ significantly between these treatments (
Figure 4b). However, during this time and for reasons unknown, the average Ψ
m observed in W2 plots was considerably less, thus the soil is drier than in W1 and W3 (
Figure 5), which most likely led to a decrease in canopy expansion in W2 as illustrated in
Figure 6.
The more frequently irrigated treatment (W1) had significantly higher dry pod yield than W2 and W3, which compared between them had a similar yield. Additionally, the maturity assessment at final harvest revealed that grain ripeness was less than the desired fraction for W2 and W3 and could be the result of either: (i) decreased maturation rate (<3% per day), based on growing degree days (Wright G, personal communications, 22 May 2018); or (ii) the partitioning of carbohydrates would probably preference leafy biomass production rather than grain-fill after the indication of animal damage in late March/early April. Based on these field conditions, it is difficult to draw any sound conclusions regarding the effect of irrigation frequency between treatments W2 and W3 at this site. However, preliminary investigations into the effect of furrow irrigation frequency (4, 8, 12 and 16 days) on mungbean and peanut production at CARDI showed that irrigation intervals of 16 days were found to significantly reduce plant height, root depth, AGB and grain yield in both crops, and more so for peanut due to the relatively larger water requirements. In addition, relatively short irrigation intervals (4 days) often resulted in waterlogging, which led to a reduction in plant density and water use efficiency.
The results here presented may be limited by the fact that they were obtained from small-scale plot experiments conducted in two countries for a single year. Further on-farm research, preferably across multiple seasons, should be conducted to further corroborate the results here obtained.
4.3. Water Productivity
In the DS-maize study, no differences were observed in irrigation WP, which ranged between 0.56 kg m
−3 and 0.67 kg m
−3. Similar results were reported for dry season maize production in a lowland rice system of Laos [
45], where increased furrow irrigation intervals did not improve WP (ranging from 0.84 kg m
−3 to 1.42 kg m
−3) due to a corresponding decrease in yield in the less frequently irrigated treatments. With respect to the DS-peanut, mean WP was higher (although not statistically significant) in the less frequently irrigated treatment (W3) when compared to the more frequently irrigated treatments and ranged between 0.27 kg m
−3 and 0.49 kg m
−3. Note these values are expressed as grain yield rather than pod yield (kernel-to-pod ratio is estimated to be 0.70; White G., personal communications, 4 May 2017). This result corresponds with those found by [
17] for dry season peanut production studies, whereby irrigation every 12 days increased WP of peanut when compared to four-day irrigation intervals which was attributed to waterlogging.
In the context of this study, the soil characteristics typical of the rice-growing lowland soils of the LMB such as nutrient deficiency, limited soil water distribution and root expansion may also have a large impact on WP. In addition to alternative water application methods such as drip or sprinkler-irrigation, soil and water management approaches could improve nutrient availability and enhance soil water infiltration and distribution; thus, root development such as those described in
Section 4.1 might improve WP and warrants further investigation.
5. Conclusions
This work shows that non-rice dry-season production on typical soils of the lowlands of the LMB (Acrisol soils) under furrow irrigation can be limited by a poor lateral movement of water in the soil that prevents the complete refilling of the root zone. The lack of lateral soil water movement was evidenced at both sites by the low soil matric potential values recorded in the centre of the beds soon after furrow irrigation commenced. This result also indicated that soil moisture monitoring at the centre of the beds is not a useful methodology for scheduling irrigation under these conditions.
The limited lateral soil water movement in these soils is poorly documented in the literature and it is most likely attributed to compaction and negligible accumulation of organic matter found within the soil environment. The work also confirms other limitations for dry-season non-rice crop production reported on studies conducted on these soils, such as soil acidity, low nutrient availability and CEC, and the presence of a hardpan at about 20–40 cm depth.
Shorter intervals of irrigation (~every four days) had a positive effect on yield, particularly at the DS-peanut study, although low yields were obtained at both sites because of the unsuitable refilling of the root zone, limited nutrient availability and poor root expansion. Under these conditions, mean WP at field scale was up to 0.67 kg m−3 and 0.49 kg m−3 in the DS-maize and DS-peanut study, respectively. Fertiliser placement closer to the plant should be considered under these irrigation systems to increase nutrient availability due to the limitations of the poor lateral water movement. In order to corroborate the results presented in this on-station small-scale plot experiment, larger on-farm experiments would be recommended.

 ,
, 


