 Benjamin Barzel1,2
 Jacquelyn M. Weir1
 Peter J. Meikle1Sandra L. Burke1
 James A. Armitage1,2,3†
 Geoffrey A. Head1,4*†
- 1Neuropharmacology Laboratory, BakerIDI Heart and Diabetes Institute, Melbourne, VIC, Australia
- 2Department of Anatomy and Developmental Biology, Monash University, Melbourne, VIC, Australia
- 3School of Medicine (Optometry), Deakin University, Geelong, VIC, Australia
- 4Department of Pharmacology, Monash University, Melbourne, VIC, Australia
Although the association between obesity and hypertension is well-known, the underlying mechanism remains elusive. Previously, we have shown that 3 week fat feeding in rabbits produces greater visceral adiposity, hypertension, tachycardia and elevated renal sympathetic nerve activity (RSNA) compared to rabbits on a normal diet. Because hyperinsulinaemia, hyperleptinemia, and dyslipidaemia are independent cardiovascular risk factors associated with hypertension we compared plasma insulin, leptin, and lipid profiles in male New Zealand White rabbits fed a normal fat diet (NFD 4.3% fat, n = 11) or high fat diet (HFD 13.4% fat, n = 13) at days 1, 2, 3 and weeks 1, 2, 3 of the diet. Plasma concentrations of diacylglyceride (DG), triacylglyceride (TG), ceramide and cholesteryl esters (CE) were obtained after analysis by liquid chromatography mass spectrometry. Plasma insulin and glucose increased within the first 3 days of the diet in HFD rabbits (P < 0.05) and remained elevated at week 1 (P < 0.05). Blood pressure and heart rate (HR) followed a similar pattern. By contrast, in both groups, plasma leptin levels remained unchanged during the first few days (P > 0.05), increasing by week 3 in fat fed animals alone (P < 0.05). Concentrations of total DG, TG, CE, and Ceramide at week 3 did not differ between groups (P > 0.05). Our data show plasma insulin increases rapidly following consumption of a HFD and suggests that it may play a role in the rapid rise of blood pressure. Dyslipidaemia does not appear to contribute to the hypertension in this animal model.
Introduction
Obesity is associated with increased mean arterial pressure (MAP) and renal sympathetic nerve activity (RSNA). Accumulating evidence suggests these changes are due to greater circulating concentrations of the adipokine leptin (Burke et al., 2013; Lim et al., 2013) which strongly correlate with RSNA and MAP in animal models of obesity (Prior et al., 2010; Burke et al., 2013). Consumption of a high fat diet (HFD) augments MAP and heart rate (HR) within the first few days of the diet, prior to any change in bodyweight (Burke et al., 2013). However, levels of circulating leptin are proportional to adiposity (Considine et al., 1996) and only begin to increase by the end of the first week of a HFD (Armitage et al., 2012). Thus, rapid changes in cardiovascular parameters suggest that a separate, leptin independent mechanism initiates the pressor response to a HFD. Plasma insulin concentrations increase within hours of meal consumption (Cummings et al., 2001) and are greater in both obese animals and humans (Bagdade et al., 1967; Lim et al., 2013) as well as patients with essential hypertension (Sobotka et al., 2011). Importantly, insulin is known to signal at the arcuate nucleus of the hypothalamus, the same nucleus at which a multitude of peripheral signals, including leptin, act to regulate energy and haemodynamic homeostasis (Benoit et al., 2004). Central administration of insulin attenuates food intake (Air et al., 2002) and augments sympathetic output (Muntzel et al., 1994). We have previously shown that insulin signaling is one of the factors responsible for the development of obesity related hypertension which is later maintained by slowly rising circulating leptin concentrations (Lim et al., 2013).
The association between dyslipidaemia and obesity is important given several lipid species are associated with a number of cardiovascular risk factors (Siri-Tarino et al., 2010). In addition, a single high-fat meal has been shown to reduce endothelial-dependent vasodilation up to 4 h post consumption in healthy normotensive individuals (Vogel et al., 1997). It has been suggested that endothelial-mediated vasodilatory mechanisms are impaired by triacylglycerides (TG) and free fatty acids (Doi et al., 1998; Lundman et al., 2001). Thus, it is possible that diet-induced changes in lipid profiles may play an early role in the development of obesity related hypertension. Lipid profiles have received scant attention in the fat-fed rabbit model of obesity related hypertension and only after several weeks of fat feeding (Eppel et al., 2013). The contribution of dyslipidaemia to the progression of disease is well-documented. Increased circulating ceramide concentrations are known to increase in obesity and are inversely correlated with insulin resistance (Haus et al., 2009). In addition, circulating levels of TG and cholesteryl esters (CE) are also elevated in obesity and have been shown to affect fasting glucose and insulin sensitivity (Sassolas et al., 1981; Cameron et al., 2008). In the present study the effect of HFD consumption on plasma insulin, leptin, and plasma lipid profiles was assessed in order to elucidate the contribution of each to the rapid rise in MAP observed within the first week of the diet.
Materials and Methods
Animals and Diets
Experiments were approved by the Alfred Medical Research Education Precinct Animal Ethics Committee and conducted in accordance with the Australian Code of Practice for Scientific Use of Animals. Experiments were conducted in 24 conscious male New Zealand White rabbits (2.76–2.90 kg). Rabbits were housed in individual cages with a telemetry blood pressure receiver (model RLA 1020, Data Sciences International, St. Paul, MN, U.S.A) fitted to the door, under controlled light (6:00–18:00) and temperature (22°C ± 2°C) conditions. Rabbits were initially fed a restricted (150 g daily) normal-fat diet (NFD; 4.3 % total fat, 2.63 kcal/g, Specialty Feeds, Glen Forest, Australia) but after baseline recordings were randomized into two dietary groups and given free access to either a NFD or a high-fat diet (HFD; 13.4 % total fat, 3.34 kcal/g, Specialty Feeds) for 3 weeks. Daily food intake was determined by weighing the contents of the food hopper daily as well as weighing the food added.
Experimental Procedures
A subset of rabbits underwent a preliminary operation under isoflurane anesthesia (3–4% in 1L/min oxygen; Abbot, Botany, NSW, Australia) following induction with propofol (10 mg/kg, Fresenius Kabi, Pymble, NSW, Australia). A radiotelemetry transmitter (model TA11PA-D70, Data Sciences) and catheter was implanted in the aorta via a small branch of the left iliac artery. Carprofen (3 mg/kg, Pfizer, Noth Ryde, NSW, Australia) was given before and 24 h after surgery for analgesia. After 1 week recovery, baseline MAP and HR were measured in the laboratory both by telemetry and by a catheter in the central ear artery. The telemetry signal was calibrated to the ear artery signal and this adjustment was applied to MAP measured in the home cage to minimize the possibility of drift of the signal with time. Baseline home cage MAP and HR were recorded for 1–2 days before rabbits were allocated to a group to receive either NFD or HFD. Home cage measurements were made continuously over 2 weeks.
Plasma Collection and Analysis
In order to avoid the effects of recent food consumption, animals were fasted for 4 h before blood samples were collected. Blood was collected before and on days 1, 2, 3, 7, 14, and 21 following the start of the HFD. Small samples of blood were used to measure blood glucose concentrations (Optium Xceed, Abbott, Doncaster, Victoria, Australia). Arterial blood (4 ml) was drawn into vacuum sealed cylinders containing K3EDTA (Vacuette Premium, Greiner bio-one, Wemmel, Belgium) and spun at 4°C for 10 min at 3000 RPM. Plasma aliquots (100 μl) were snap frozen in liquid nitrogen and stored at −80°C until use. Plasma lipid species were extracted into chloroform/methanol and quantified using high performance liquid chromatography-tandem mass spectrometry (Weir et al., 2013). Lipid species identified were diacylglycerides (DG), TG, ceramides (Cer), and CE. Total lipids within each class were calculated from the sum of the individual species. Plasma insulin and leptin concentrations were assessed using an ultra-sensitive insulin ELISA kit (Crystal Chem, Chicago, USA) with rabbit insulin standard and a radio immunoassay multispecies kit (LINCO Research, St Charles, MO, USA), respectively.
Data Analysis
MAP and HR, derived from the pressure pulse, were digitized online at 500 Hz using an analog-to-digital data acquisition card (National Instruments 6024E, Austin, Texas, USA) and averaged over 2 s. MAP and HR were collected continuously over each 24 h period and averaged over one hourly intervals. Data were analyzed by split-plot repeated measures ANOVA allowing for between and within animal comparisons using excel version 2010 (Microsoft). MAP and HR were analyzed by repeated measures analysis of variance that allowed for within-animal contrasts. Data collected at a single time point were analyzed using a One-Way ANOVA. Bonferroni corrections were used to control for Type 1 error. A two sided probability of P < 0.05 was considered significant. For all statistics shown we refer to the main effect as a subscript, e.g., Pbaseline pertains to comparisons between groups made prior to the consumption of either diet, Pgroup, refers to comparisons between HFD and NFD-fed rabbits during dietary intervention, Pdiet refers to contrasts between baseline and dietary intervention within both NFD and HFD groups, Ptime, refers to comparisons within each group made between baseline and week 3 time points, Pdietxtime pertains to the interaction between diet and time.
Results
Effect of 3 Week Fat Feeding on Plasma Insulin, Glucose and Leptin, Food Intake and Haemodynamics
Baseline plasma insulin concentrations were not different between the dietary groups and averaged 0.46 ± 0.03 ng/ml (Pbaseline > 0.05; Figure 1, Table 1). A 50% increase from baseline in plasma insulin was observed in both NFD and HFD rabbits over the first 2 days of the diet (Pdiet < 0.05 for both groups; Figure 1). A further increase in plasma insulin concentrations on day 3 resulted in 65% greater insulin concentrations in HFD compared with NFD animals at both day 3 and week 1 time points (Pgroup < 0.05; Figure 1). By week 2, insulin concentrations in HFD rabbits had decreased to those observed in NFD rabbits (Pgroup > 0.05; Figure 1). Plasma glucose concentrations at baseline were not different between the dietary groups and averaged 5.5 ± 0.12 mmol/L (Pbaseline > 0.05; Figure 1, Table 1). Plasma glucose concentrations followed a similar pattern to insulin, rising on days 1 and 2 of the diet in both NFD and HFD rabbits (Pdiet < 0.05 for both groups; Figure 1). However, HFD rabbits exhibited a 59% greater increase in plasma glucose concentrations than controls (Pgroup < 0.05). By week 2, glucose concentrations returned to levels observed in NFD rabbits (Pgroup > 0.05; Figure 1). By contrast, plasma leptin concentrations, which were averaged 0.91 ± 0.13 ng/ml at baseline (Pbaseline > 0.05; Figure 1, Table 1), remained unchanged over the first 3 days of the diet in both dietary group (Pdiet > 0.05; Figure 1). However, plasma leptin concentrations in HFD-fed rabbits increased on week 1 of the diet compared with baseline (Pdiet > 0.05; Figure 1) and were 60 % greater than controls by the end of week 3 (Pgroup < 0.05; Figure 1). Food intake was similar in both groups with rabbits consuming 47–51% more food on the first day of both diets (Pdiet < 0.05). Intake in both groups gradually diminished to baseline levels after the first week (Figure 1). HR also increased rapidly on the first day after the start of the HFD to a level 12% greater than baseline (Pdiet < 0.001; Figure 1). HR remained elevated for the first week but had returned to control levels by week 2 (Pdiet > 0.05). By contrast, MAP increased from baseline levels by the 3rd day of the HFD (Pdiet < 0.05; Figure 1) and remained 7–8% elevated at 1–2 weeks (Pdiet < 0.01; Figure 1). Both MAP and HR in HFD fed rabbits were markedly higher over the 2 weeks of measurements than those fed a NFD (Pgroup < 0.001; Figure 1).
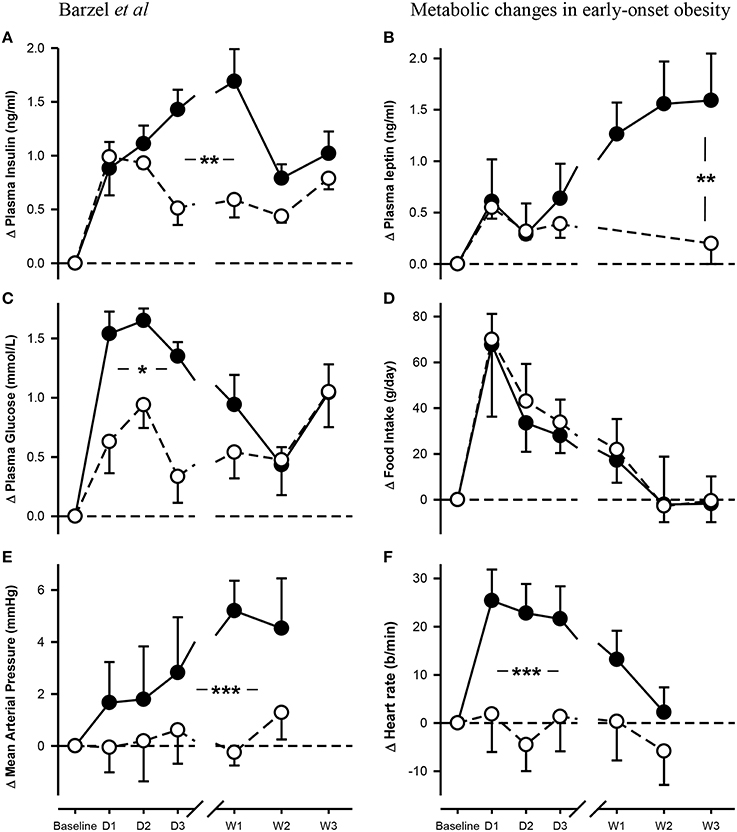
Figure 1. Changes from baseline in levels of plasma insulin (A), leptin (B) and glucose (C) concentrations, food intake (D), mean arterial pressure (E) and heart rate (F) in rabbits fed either a normal fat diet (open circles) or a high-fat diet (closed circles) for 3 weeks. Data are mean difference ± SED, *P < 0.05, **P < 0.01, ***P < 0.001 for differences between dietary groups. Day, D; Week, W.
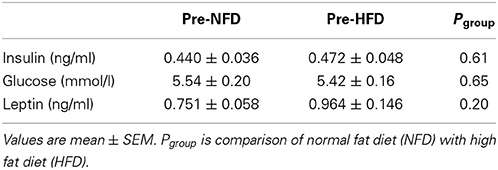
Table 1. Baseline concentrations of insulin, glucose, and leptin.
Effect of HFD Feeding on Plasma Lipid Profiles
After 3 weeks of diet, total plasma DG, TG, Cer, and CE concentrations were not different between the dietary groups (Pgroup > 0.05; Figure 2). Specific DG, TG, and CE species did not change over the 3-week diet in either dietary group (Ptime > 0.05 for both NFD and HFD, Tables 2–5). By contrast, plasma Cer 16:0, 20:0, and 22:0 concentrations increased in HFD-fed rabbits over the 3 week period (Ptime > 0.05; Table 2) yet this was unlikely due to the consumption of the HFD (Pdiet > 0.05; Table 2) as the overall interaction between diet and time did not reach statistical significance (Pdiet× time > 0.05; Table 2). Individual cholesteryl ester species at week 3 were not different between the dietary groups (Pgroup > 0.05; Table 3). Similarly, DG (Pgroup > 0.05; Table 4) and TG (Pgroup > 0.05; Table 5) lipid species were not different between the dietary groups.
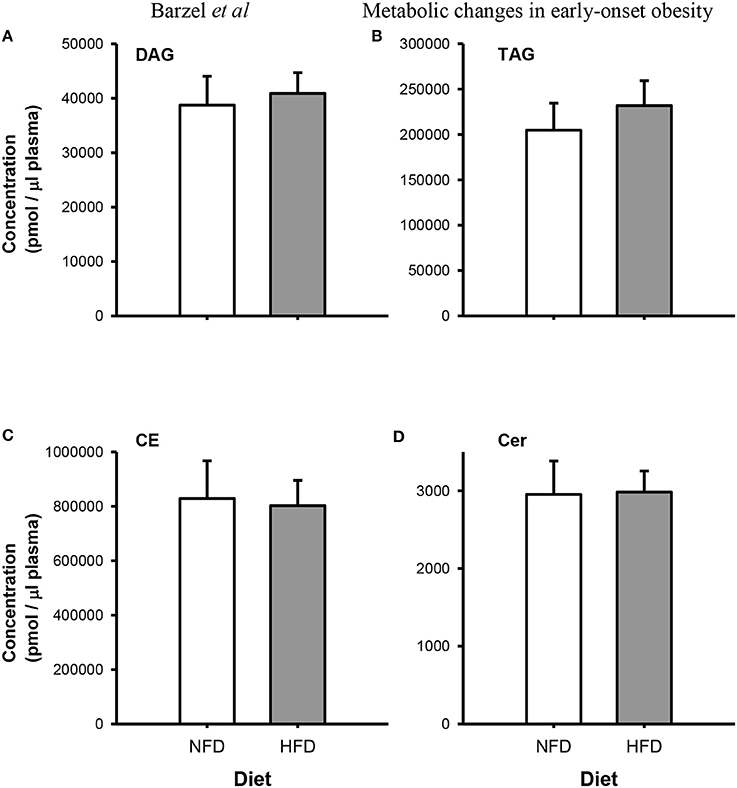
Figure 2. Total Plasma concentrations of diacylglycerides (DG; A), triacylglycerides (TG; B), cholesteryl esters (CE; C) and ceramides (Cer; D) species in normal fat-fed (NFD; white bars) and high fat diet-fed (HFD; gray bars) after 3 weeks of diet. Data are mean ± SEM.
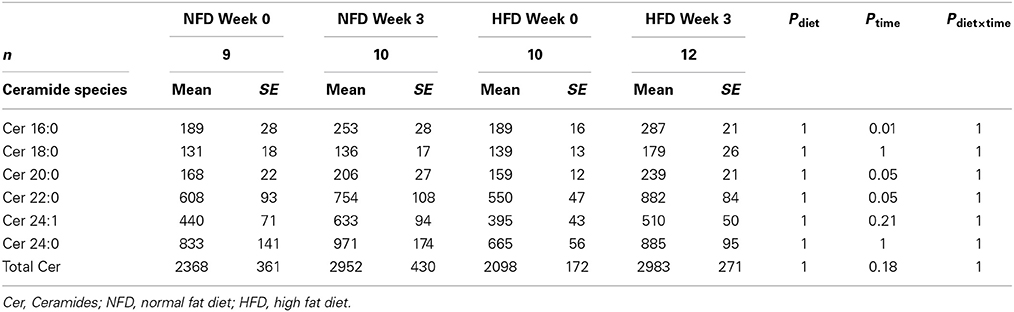
Table 2. Ceramide species at baseline and week 3 in both NFD and HFD–fed rabbits.
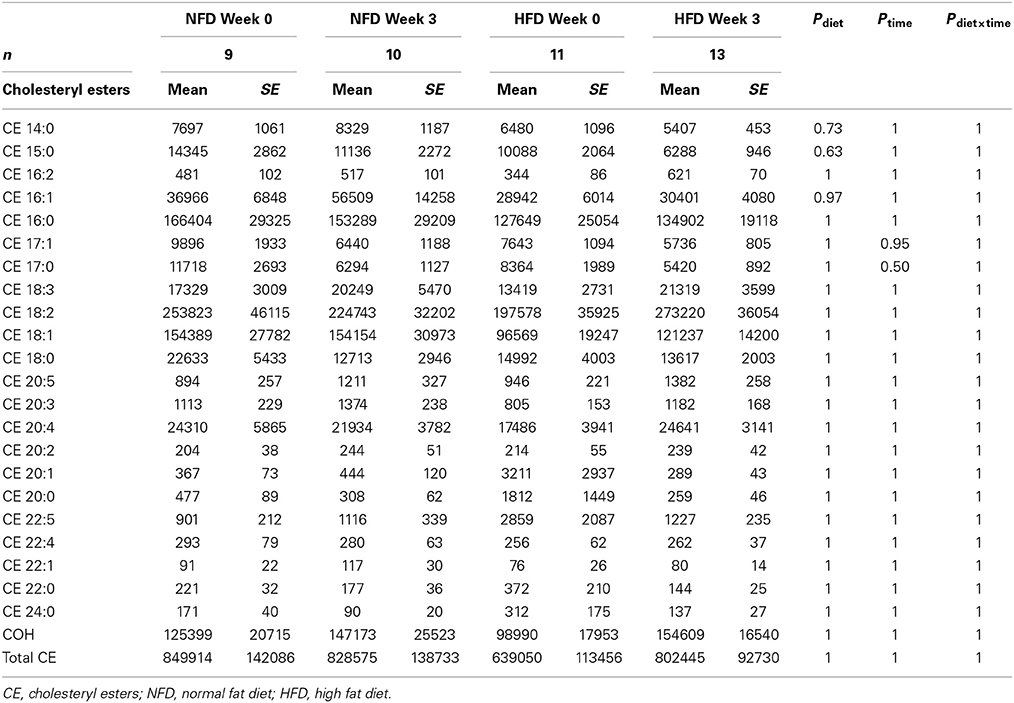
Table 3. Cholesteryl esters at baseline and week 3 in both NFD and HFD–fed rabbits.
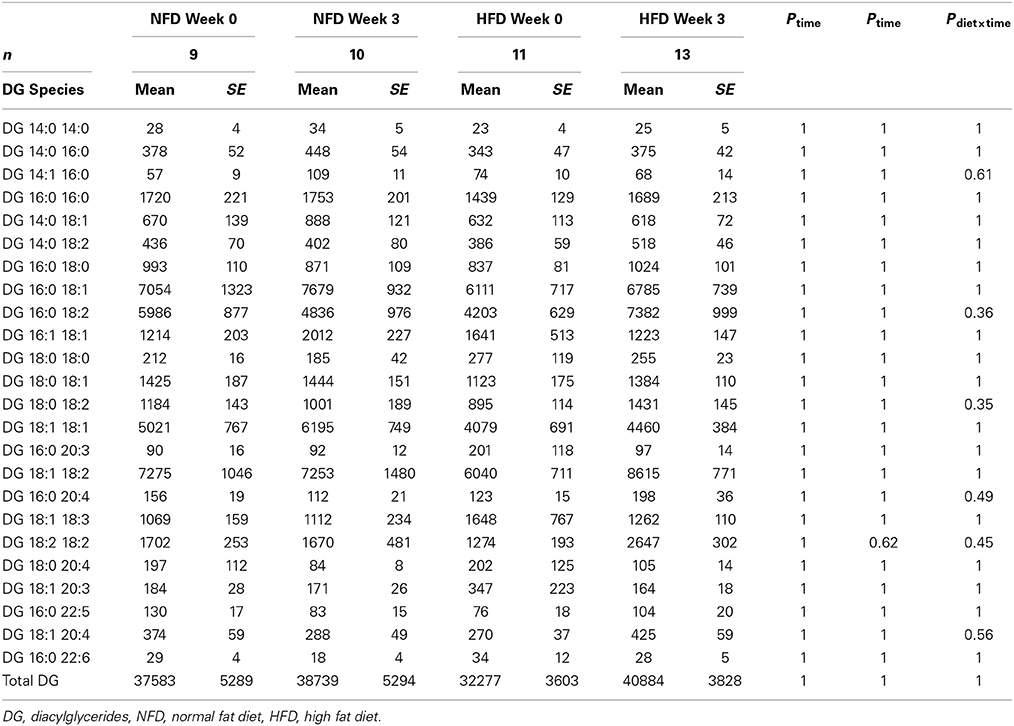
Table 4. Diacylglycerides at baseline and week 3 in both NFD and HFD –fed rabbits.
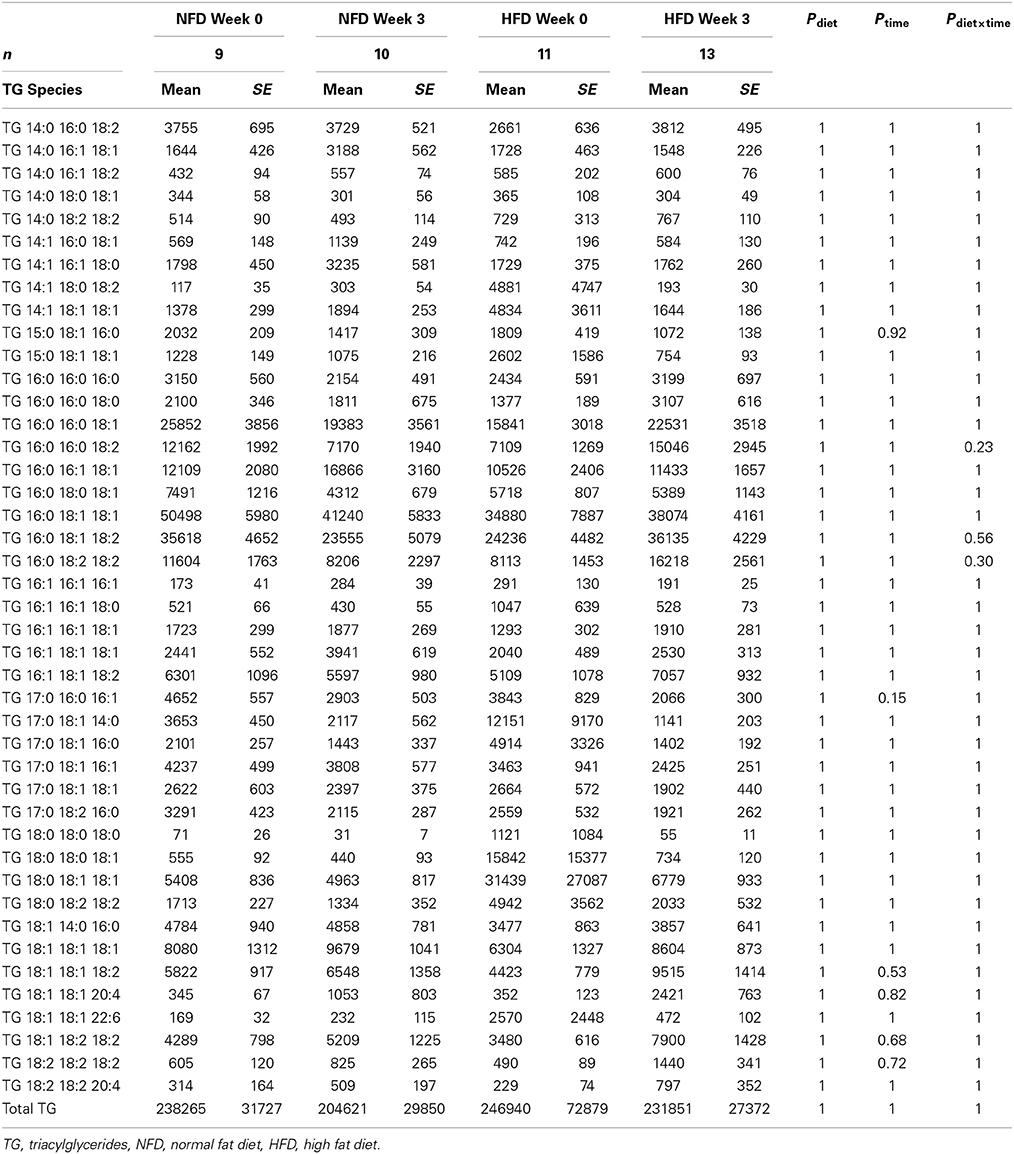
Table 5. Triacylglycerides at baseline and week 3 in both NFD and HFD–fed rabbits.
Discussion
The main findings of the present study were that alongside elevations in blood pressure and HR, plasma glucose and insulin concentrations were increased within the first 3 days of a HFD, remaining elevated for the first week of the diet and returning to control levels thereafter. Notably, circulating leptin concentrations were unaltered by a HFD at day 3 but were markedly increased by week 3 whilst in the same time period, no evidence of dyslipidaemia was found. Together, these data suggest hyperinsulinemia rapidly develops after the commencement of a HFD and is a likely mechanism by which haemodynamics and sympathetic tone may change rapidly in the fat-fed rabbit model of obesity related hypertension.
A considerable body of evidence suggests insulin acts centrally to increase both blood pressure and sympathetic tone (Landsberg, 1996; Straznicky et al., 2010; Ward et al., 2011; Lim et al., 2013). There is a strong association between obesity, hyperinsulinemia and, at a later stage, insulin resistance (Weyer et al., 2001; Yuan et al., 2001). Of note is the apparent delay between the engagement of sympathetic nerve activity in obesity and the development of insulin resistance (Flaa et al., 2008) suggesting sympathetic overactivity may occur in response to very early changes in plasma insulin. Indeed central injections of insulin into the paraventricular nucleus of the hypothalamus produce large increases in lumbar sympathetic nerve activity (Ward et al., 2011). In the present study we observed a near two-fold increase in plasma glucose and insulin concentrations within 3 days of starting the HFD. Importantly, increases in MAP and HR in HFD-fed rabbits also began in the first few days of consumption as do increases in RSNA (Armitage et al., 2012; Burke et al., 2013) suggesting that circulating insulin may be involved in augmenting MAP early in the diet. In support of this are the findings that central administration of an insulin antagonist attenuated MAP after 1 week of a HFD (Lim et al., 2013). It is important to note that in the present study, plasma leptin concentrations in HFD-fed rabbits remained unchanged over the first 3 days of the diet but had increased by week 3. These results help explain our previous findings that central administration of a leptin antagonist to HFD-fed rabbits failed to elicit a reduction in either haemodynamic or sympathetic parameters at week 1 of the diet but produced large sympathoinhibitory and depressor responses at week 3 (Lim et al., 2013). Combined, these observations imply plasma insulin is involved in the remodeling of sympathetic tone within the first few days of consuming a HFD whilst leptin acts as a sympathoexcitatory signal later on in the diet, presumably once adiposity is increased. As both plasma glucose and insulin concentrations normalized by week 2 of the diet, the present observations point to sympathetic output preceding insulin resistance. Moreover, the apparent lack of effect of central administration of insulin on RSNA has been observed by others (Ward et al., 2011) and may in part be due to the direct effect of insulin on baroreflex gain (Pricher et al., 2008).
The present study also sought to establish the presence of dyslipidemia in our obese rabbit model and any subsequent contribution to the development of hypertension observed in these animals. In humans, dyslipidemia is a prominent feature of metabolic syndrome (Bays, 2009) and often appears in conjunction with hypertension (Nguyen et al., 2008). An example of the consequences of dyslipidemia can be found in greater total plasma ceramide concentrations which are known to occur in obesity whilst specific ceramide species are strongly associated with insulin resistance (Haus et al., 2009). In the present study, plasma concentrations of 4 lipid classes (Cer, CE, DG, and TG) were unchanged after 3 weeks of HFD. Our findings are in agreement with those made by Eppel and colleagues who observed no change in total plasma cholesteryl, and total plasma TG in rabbits fed a HFD for 9 weeks (Eppel et al., 2013) and suggests large changes in lipid profiles may take longer to develop in the rabbit model (Hamilton and Carroll, 1976). However, given the rapid haemodynamic and hormonal responses to dietary fat content, we expected to find changes in the expression of individual lipid species which would have been indicative of altered lipid metabolism. It is likely that our study was not powered to detect minute perturbations in the expression of specific plasma lipid species, contributing to our findings that plasma lipid profiles are unchanged by a diet high in fat. However, given that other parameters found in plasma, including insulin and leptin, can be measured accurately, our design is unlikely to be a confounding factor. Thus, our findings discount dyslipidemia as a likely mechanism by which hypertension occurs during 3 weeks of a HFD.
In conclusion, our findings demonstrate plasma insulin is a likely mechanism by which rapid increases in MAP occur over the first few days of consumption of a HFD. In addition, dyslipidaemia does not appear to develop after 3 weeks of fat feeding suggesting plasma lipid profiles do not play a role in the genesis of hypertension in our animal model but may contribute to the development of comorbidities associated with obesity at a later stage.
Conflict of Interest Statement
The authors declare that the research was conducted in the absence of any commercial or financial relationships that could be construed as a potential conflict of interest.
References
Air, E. L., Benoit, S. C., Clegg, D. J., Seeley, R. J., and Woods, S. C. (2002). Insulin and leptin combine additively to reduce food intake and body weight in rats. Endocrinology 143, 2449–2452. doi: 10.1210/endo.143.6.8948
Pubmed Abstract | Pubmed Full Text | CrossRef Full Text | Google Scholar
Armitage, J. A., Burke, S. L., Prior, L. J., Barzel, B., Eikelis, N., Lim, K., et al. (2012). Rapid onset of renal sympathetic nerve activation in rabbits fed a high-fat diet. Hypertension 60, 163–171. doi: 10.1161/HYPERTENSIONAHA.111.190413
Pubmed Abstract | Pubmed Full Text | CrossRef Full Text | Google Scholar
Bagdade, J. D., Bierman, E. L., and Porte, D. Jr. (1967). The Significance of basal insulin levels in the evaluation of the insulin response to glucose in diabetic and nondiabetic subjects. J. Clin. Invest. 46, 1549–1557. doi: 10.1172/JCI105646
Pubmed Abstract | Pubmed Full Text | CrossRef Full Text | Google Scholar
Bays, H. E. (2009). “Sick fat,” metabolic disease, and atherosclerosis. Am. J. Med. 122, S26–S37. doi: 10.1016/j.amjmed.2008.10.015
Pubmed Abstract | Pubmed Full Text | CrossRef Full Text | Google Scholar
Benoit, S. C., Clegg, D. J., Seeley, R. J., and Woods, S. C. (2004). Insulin and leptin as adiposity signals. Recent Prog. Horm. Res. 59, 267–285. doi: 10.1210/rp.59.1.267
Pubmed Abstract | Pubmed Full Text | CrossRef Full Text | Google Scholar
Burke, S. L., Prior, L. J., Lukoshkova, E. V., Lim, K., Barzel, B., Davern, P. J., et al. (2013). Reduced preprandial dipping accounts for rapid elevation of blood pressure and renal sympathetic nerve activity in rabbits fed a high-fat diet. Chronobiol. Int. 30, 726–738. doi: 10.3109/07420528.2013.784771
Pubmed Abstract | Pubmed Full Text | CrossRef Full Text | Google Scholar
Cameron, A. J., Boyko, E. J., Sicree, R. A., Zimmet, P. Z., Soderberg, S., Alberti, K. G., et al. (2008). Central obesity as a precursor to the metabolic syndrome in the ausdiab study and mauritius. Obesity (Silver Spring) 16, 2707–2716. doi: 10.1038/oby.2008.412
Pubmed Abstract | Pubmed Full Text | CrossRef Full Text | Google Scholar
Considine, R. V., Sinha, M. K., Heiman, M. L., Kriauciunas, A., Stephens, T. W., Nyce, M. R., et al. (1996). Serum immunoreactive-leptin concentrations in normal-weight and obese humans. N. Engl. J. Med. 334, 292–295. doi: 10.1056/NEJM199602013340503
Pubmed Abstract | Pubmed Full Text | CrossRef Full Text | Google Scholar
Cummings, D. E., Purnell, J. Q., Frayo, R. S., Schmidova, K., Wisse, B. E., and Weigle, D. S. (2001). A preprandial rise in plasma ghrelin levels suggests a role in meal initiation in humans. Diabetes 50, 1714–1719. doi: 10.2337/diabetes.50.8.1714
Pubmed Abstract | Pubmed Full Text | CrossRef Full Text | Google Scholar
Doi, H., Kugiyama, K., Ohgushi, M., Sugiyama, S., Matsumura, T., Ohta, Y., et al. (1998). Remnants of chylomicron and very low density lipoprotein impair endothelium-dependent vasorelaxation. Atherosclerosis 137, 341–349. doi: 10.1016/S0021-9150(97)00291-8
Pubmed Abstract | Pubmed Full Text | CrossRef Full Text | Google Scholar
Eppel, G. A., Armitage, J. A., Eikelis, N., Head, G. A., and Evans, R. G. (2013). Progression of cardiovascular and endocrine dysfunction in a rabbit model of obesity. Hypertens. Res 36, 588–595. doi: 10.1038/hr.2013.2
Pubmed Abstract | Pubmed Full Text | CrossRef Full Text | Google Scholar
Flaa, A., Aksnes, T. A., Kjeldsen, S. E., Eide, I., and Rostrup, M. (2008). Increased sympathetic reactivity may predict insulin resistance: an 18-year follow-up study. Metabolism 57, 1422–1427. doi: 10.1016/j.metabol.2008.05.012
Pubmed Abstract | Pubmed Full Text | CrossRef Full Text | Google Scholar
Hamilton, R. M., and Carroll, K. K., (1976). Plasma cholesterol levels in rabbits fed low fat, low cholesterol diets: effects of dietary proteins, carbohydrates and fibre from different sources. Atherosclerosis 24, 47–62. doi: 10.1016/0021-9150(76)90063-0
Pubmed Abstract | Pubmed Full Text | CrossRef Full Text | Google Scholar
Haus, J. M., Kashyap, S. R., Kasumov, T., Zhang, R., Kelly, K. R., Defronzo, R. A. et al. (2009). Plasma ceramides are elevated in obese subjects with type 2 diabetes and correlate with the severity of insulin resistance. Diabetes 58, 337–343. doi: 10.2337/db08-1228
Pubmed Abstract | Pubmed Full Text | CrossRef Full Text | Google Scholar
Landsberg, L. (1996). Insulin and the sympathetic nervous system in the pathophysiology of hypertension. Blood Press. Suppl. 1, 25–29.
Lim, K., Burke, S. L., and Head, G. A. (2013). Obesity related hypertension and the role of insulin and leptin in high fat fed rabbits. Hypertension 61, 628–634. doi: 10.1161/HYPERTENSIONAHA.111.00705
Pubmed Abstract | Pubmed Full Text | CrossRef Full Text | Google Scholar
Lundman, P., Tornvall, P., Nilsson, L., and Pernow, J. (2001). A triglyceride-rich fat emulsion and free fatty acids but not very low density lipoproteins impair endothelium-dependent vasorelaxation. Atherosclerosis 159, 35–41. doi: 10.1016/S0021-9150(01)00478-6
Muntzel, M. S., Morgan, D. A., Mark, A. L., and Johnson, A. K. (1994). Intracerebroventricular insulin produces nonuniform regional increases in sympathetic nerve activity. Am. J. Physiol. Regul. Integr. Comp. Physiol. 36, R1350–R1355.
Nguyen, N. T., Magno, C. P., Lane, K. T., Hinojosa, M. W., and Lane, J. S. (2008). Association of hypertension, diabetes, dyslipidemia, and metabolic syndrome with obesity: findings from the national health and nutrition examination survey, 1999 to 2004. J. Am. Coll. Surg. 207, 928–934. doi: 10.1016/j.jamcollsurg.2008.08.022
Pubmed Abstract | Pubmed Full Text | CrossRef Full Text | Google Scholar
Pricher, M. P., Freeman, K. L., and Brooks, V. L. (2008). Insulin in the brain increases gain of baroreflex control of heart rate and lumbar sympathetic nerve activity. Hypertension 51, 514–520. doi: 10.1161/HYPERTENSIONAHA.107.102608
Pubmed Abstract | Pubmed Full Text | CrossRef Full Text | Google Scholar
Prior, L. J., Eikelis, N., Armitage, J. A., Davern, P. J., Burke, S. L., and Montani, J. -P., et al. (2010). Exposure to a high-fat diet alters leptin sensitivity and elevates renal sympathetic nerve activity and arterial pressure in rabbits. Hypertension 55, 862–868. doi: 10.1161/HYPERTENSIONAHA.109.141119
Pubmed Abstract | Pubmed Full Text | CrossRef Full Text | Google Scholar
Sassolas, A., Vincent, M., Benzoni, D., and Sassard, J. (1981). Plasma lipids in genetically hypertensive rats of the lyon strain. J. Cardiovasc. Pharmacol. 3, 1008–1014. doi: 10.1097/00005344-198109000-00011
Pubmed Abstract | Pubmed Full Text | CrossRef Full Text | Google Scholar
Siri-Tarino, P. W., Sun, Q., Hu, F. B., and Krauss, R. M. (2010). Saturated fat, carbohydrate, and cardiovascular disease. Am. J. Clin. Nutr. 91, 502–509. doi: 10.3945/ajcn.2008.26285
Pubmed Abstract | Pubmed Full Text | CrossRef Full Text | Google Scholar
Sobotka, P. A., Mahfoud, F., Schlaich, M. P., Hoppe, U. C., Bohm, M., and Krum, H. (2011). Sympatho-renal axis in chronic disease. Clin. Res. Cardiol. 100, 1049–1057. doi: 10.1007/s00392-011-0335-y
Pubmed Abstract | Pubmed Full Text | CrossRef Full Text | Google Scholar
Straznicky, N. E., Lambert, G. W., and Lambert, E. A. (2010). Neuroadrenergic dysfunction in obesity: an overview of the effects of weight loss. Curr. Opin. Lipidol. 21, 21–30. doi: 10.1097/MOL.0b013e3283329c62
Pubmed Abstract | Pubmed Full Text | CrossRef Full Text | Google Scholar
Vogel, R. A., Corretti, M. C., and Plotnick, G. D. (1997). Effect of a single high-fat meal on endothelial function in healthy subjects. Am. J. Cardiol. 79, 350–354. doi: 10.1016/S0002-9149(96)00760-6
Pubmed Abstract | Pubmed Full Text | CrossRef Full Text | Google Scholar
Ward, K. R., Bardgett, J. F., Wolfgang, L., and Stocker, S. D. (2011). Sympathetic response to insulin is mediated by melanocortin 3/4 receptors in the hypothalamic paraventricular nucleus. Hypertension 57, 435–441. doi: 10.1161/HYPERTENSIONAHA.110.160671
Pubmed Abstract | Pubmed Full Text | CrossRef Full Text | Google Scholar
Weir, J. M., Wong, G., Barlow, C. K., Greeve, M. A., Kowalczyk, A., Almasy, L., et al. (2013). Plasma lipid profiling in a large population-based cohort. J. Lipid Res. 54, 2898–2908. doi: 10.1194/jlr.P035808
Pubmed Abstract | Pubmed Full Text | CrossRef Full Text | Google Scholar
Weyer, C., Funahashi, T., Tanaka, S., Hotta, K., Matsuzawa, Y., Pratley, R. E., et al. (2001). Hypoadiponectinemia in obesity and type 2 diabetes: close association with insulin resistance and hyperinsulinemia. J. Clin. Endocrinol. Metab. 86, 1930–1935. doi: 10.1210/jcem.86.5.7463
Pubmed Abstract | Pubmed Full Text | CrossRef Full Text | Google Scholar
Yuan, M., Konstantopoulos, N., Lee, J., Hansen, L., Li, Z. W., Karin, M., et al. (2001). Reversal of obesity- and diet-induced insulin resistance with salicylates or targeted disruption of Ikkbeta. Science 293, 1673–1677. doi: 10.1126/science.1061620
Pubmed Abstract | Pubmed Full Text | CrossRef Full Text | Google Scholar
Keywords: insulin, leptin, plasma lipids, obesity, hypertension
Citation: Barzel B, Weir JM, Meikle PJ, Burke SL, Armitage JA and Head GA (2014) Short term fat feeding rapidly increases plasma insulin but does not result in dyslipidaemia. Front. Physiol. 5:469. doi: 10.3389/fphys.2014.00469
Received: 10 October 2014; Accepted: 15 November 2014;
Published online: 02 December 2014.
Edited by:
Ovidiu Constantin Baltatu, University Camilo Castelo Branco, BrazilReviewed by:
Jose Cipolla-Neto, University of Sao Paulo, BrazilValter Luis Pereira Junior, Camilo Castelo Branco University, Brazil
Daniel Gaudet, Université de Montréal, Canada
Copyright © 2014 Barzel, Weir, Meikle, Burke, Armitage and Head. This is an open-access article distributed under the terms of the Creative Commons Attribution License (CC BY). The use, distribution or reproduction in other forums is permitted, provided the original author(s) or licensor are credited and that the original publication in this journal is cited, in accordance with accepted academic practice. No use, distribution or reproduction is permitted which does not comply with these terms.
*Correspondence: Geoffrey A. Head, Neuropharmacology Laboratory, Baker IDI Heart and Diabetes Institute, 75 Commercial Road, Melbourne, VIC 3004, Australia e-mail: geoff.head@bakeridi.edu.au
†Joint senior authors.