Sea Ice Microbiota in the Antarctic Peninsula Modulates Cloud-Relevant Sea Spray Aerosol Production
 Manuel Dall’Osto1*
  Dolors Vaqué1
  Ana Sotomayor-Garcia1
  Miguel Cabrera-Brufau1
  Marta Estrada1
  Teresa Buchaca2 Montserrat Soler2
  Sdena Nunes3
  Sebastian Zeppenfeld4
  Manuela van Pinxteren4
  Hartmut Herrmann4 Heike Wex5 Matteo Rinaldi6
  Marco Paglione6 David C. S. Beddows7 Roy M. Harrison7,8
  Elisa Berdalet1
- 1Department of Marine Biology and Oceanography, Institute of Marine Sciences Consejo Superior de Investigaciones Científicas (CSIC), Barcelona, Spain
- 2Centre for Advanced Studies of Blanes, Spanish Research Council (CEAB-CSIC), Integrative Freshwater Ecology Group (IFE), Blanes, Spain
- 3Red Sea Research Center (RSRC), King Abdullah University of Science and Technology (KAUST), Thuwal, Saudi Arabia
- 4Atmospheric Chemistry Department (ACD), Leibniz-Institute for Tropospheric Research (TROPOS), Leipzig, Germany
- 5Experimental Aerosol and Cloud Microphysics Department, Leibniz-Institute for Tropospheric Research (TROPOS), Leipzig, Germany
- 6National Research Council, Institute of Atmospheric Sciences and Climate, Bologna, Italy
- 7National Centre for Atmospheric Science Division of Environmental Health & Risk Management School of Geography, Earth & Environmental Sciences University of Birmingham, Birmingham, United Kingdom
- 8Department of Environmental Sciences/Center of Excellence in Environmental Studies, King Abdulaziz University, Jeddah, Saudi Arabia
Sea spray aerosol (SSA) formation plays a major role in the climate system. The Antarctic Peninsula (AP) is affected by the greatest warming occurring in the Southern Ocean; changes in cryospheric and biological processes are being observed. Whilst there is some evidence that organic material produced by ice algae and/or phytoplankton in the high Arctic contributes to SSA, less is known about Antarctic Sea ice (sympagic) regions. To gain insight into the influence of Antarctic Sea ice biology and biogeochemistry on atmospheric aerosol, we report simultaneous water-air measurements made by means of in situ aerosol chamber experiments. For the first time, we present a methodology showing that the controlled plunging jet aerosol chamber settings do not cause major cell disruption on the studied sea ice ecosystems. Larger sea ice phytoplankton cells (>20 µm; mainly diatoms) tend to sediment at the bottom of the chamber (during the 24h experiment) and likely have a minor role on SSA production. When comparing four chamber experiments - we find that the two producing more SSA are the ones with highest abundance of nanophytoplankton cells (<20 µm; mainly nanoflagellates) as well as viruses. Our marine biogeochemical data show two broad groups of dissolved organic carbon: one rich in carbohydrates and proteic material and one rich in humic-like substances; the latter enhancing SSA production. This work provides unique insights into sea ice productivity that modulates SSA production, with potentially significant climate impacts. Further studies of these types are advised in order to see how microbiology impacts the biogeochemical cycling of elements and how aerosols are formed and processed in cold regions.
1 Introduction
Sea spray aerosols (SSA) are primary marine aerosols emitted into the atmosphere from the sea surface by wave breaking and bubble bursting (Gantt and Meskhidze, 2013; Quinn et al., 2015). The chemical composition, concentration and size distribution of SSA determine their ability to influence climate. Indeed, sea spray aerosols act as cloud condensation nuclei (CCN) and ice nucleating particles (INP) and play a vital role in the climate systems by controlling the atmospheric radiative budget (Cochran et al., 2017). SSA contain a complex mixture of inorganic and organic matter compounds (IM and OM, respectively), they greatly affect the hygroscopic properties of CCN and INP activity (Quinn and Bates, 2011; Gantt and Meskhidze, 2013; Quinn et al., 2014; Quinn et al., 2015; Quinn et al., 2017). It is imperative to better understand the biogeochemical processes that produce OM in ocean surface waters in order to achieve a thorough comprehension of their link with atmospheric processing.
With that aim, significant efforts have been made to identify the role of marine biological activities - specifically phytoplankton related processes - on atmospheric aerosol properties. Still, the obtained results are controversial. On one side, some field studies in the North Atlantic (Vignati et al., 2010) based on chlorophyll a (Chl a) concentration (a proxy of phytoplankton biomass or productivity) estimations, have postulated a direct coupling between phytoplankton biomass and the production of organic-rich marine primary aerosols (; Vignati et al., 2010). However, by analyzing other biological components combined with atmospheric dynamics, Rinaldi et al. (2013) showed a systematic delay between time series of oceanic Chl a and OM concentrations in atmospheric marine aerosols. That research indicated that not only biomass, but the dynamics of biological processes in oceanic surface waters with their respective timescales should be considered when ascertaining the biogenic organic contribution to primary marine aerosols (Rinaldi et al., 2013; Mansour et al., 2020). Other studies speculated that the presence of OM in SSA is linked to the decay of phytoplankton blooms and cell lysis rather than to the initial periods of proliferation and growth (O’Dowd et al., 2015). From estimations of Chl a degradation pigments (namely, chlorophyllide a, Chllide a) Miyazaki et al. (2020) provided some support to this hypothesis by showing that OM in SSA is closely linked to chemical compounds released by senescent algal cells and/or from cell lysis. By contrast, other observations taken in the western North Atlantic (Keene et al., 2007; Russell et al., 2010; Quinn et al., 2014; Kieber et al., 2016; Bates et al., 2020) found almost no relationship with the presence or absence of phytoplankton blooms, concluding that the presence of OM in SSA is related to a large pool of refractory dissolved organic carbon (DOC) in the ocean. Recently, it was argued that the seasonal difference for high latitudes provides some caution against combining both high and low latitude regions, as this may hide the more northerly seasonal dependence (Lewis et al., 2021), implying that marine aerosols may be more complex and more diverse depending on the marine areas sampled.
In order to understand the mechanisms of SSA formation and the potential role of biogeochemical processes, laboratory studies are usually conducted by generating marine aerosols from seawater bubble bursting, and comparing the experimentally produced aerosols with SSA measurements in the ocean. It has been demonstrated that the characteristics of the experimental setups used to generate aerosols determine the characteristics and behaviour of laboratory produced SSAs compared to the natural SSAs. For instance, in early laboratory studies sintered glass filters of different porosity (Martensson et al., 2003; Sellegri et al., 2006; Tyree et al., 2007) and pressurized atomizers (Svenningsson et al., 2006; Taketani et al., 2009) produced SSA with size distributions very different from those of natural aerosols. After detailed investigations (Sellegri et al., 2006; Fuentes et al., 2010; Modini et al., 2013; Prather et al., 2013; Christiansen et al., 2019; Sellegri et al., 2021), the plunging water jet method has become the accepted method to reproduce marine aerosols characteristic of an oceanic whitecap (Stokes et al., 2016, Sellegri et al., 2021; O’Dowd et al., 2015; Stokes et al., 2016; Medina-Pérez et al., 2020). Briefly, air is entrained in the chamber filled with water using a vertical re-circulating water jet. The entrained air forms bubbles that in turn burst to form SSA.
A large body of laboratory studies conducted at the NSF Center for Aerosol Impacts on Chemistry of the Environment (CAICE) is also providing new evidence of the influence of freshly produced OM from blooming algal species on the chemical composition of SSA (Prather et al., 2013; Wang et al., 2015; Cochran et al., 2017).
The Southern Ocean (SO) atmosphere - a unique analogue of pre-industrial environments due to limited continental and anthropogenic influences (Chubb et al., 2016; Fossum et al., 2018), offers a suitable scenario to improve the understanding of the processes linking marine biota, marine aerosols, and cloud droplet number concentrations. Still, the role of primary SSA in regulating cloudiness over the SO - like other oceans - is under debate (McCoy et al., 2015; Chubb et al., 2016; Fossum et al., 2018). Additional complexity arises from sea ice regions composed of multiple habitats hosting rich microbial communities (Arrigo et al., 2009; Arrigo, 2014; Arrigo et al., 2015). Sea ice melting during the Austral summer influences physical and chemical properties of the water column as well as triggers mechanisms sustaining both pelagic and benthic food webs in Antarctic waters (Brierley and Thomas, 2002). Here, “pelagic” refers to (micro) organisms that inhabit the water column whereas the “benthic” ones live on the sea floor. Since 2006 - an estimated 60%–90% of global ocean heat content change associated with global warming occurred in the Southern Ocean - but the warming of its water masses is inhomogeneous. The consequences for Antarctic maritime and coastal environments encompass strengthening of westerly winds, summer sea ice reduction, shifting ranges of bird communities, expanding terrestrial vegetation, increasing glacier melting and freshwater formation over land, etc … The changes in sea ice extent and texture derived from climate warming changes are expected to provide emissions of climate-active substances including SSA aerosols (Holland and Bitz, 2003; Decesari et al., 2020; Lachlan-Cope et al., 2020). Notwithstanding the poorly known physical sea-to-air transfer mechanism, ocean waves, splashes, whirls, turbulent structures interacting with sea ice edges and floes, and bubbles generated by processes below the ocean surface, all result in the emission of sea spray aerosol (SSA) (Held et al., 2011; Boutin et al., 2020).
We previously showed that the microbiota of sea ice and the sea ice-influenced ocean can be a source of atmospheric primary and secondary organic nitrogen (ON), specifically low molecular weight alkylamines (Dall’Osto et al., 2017a; Dall’Osto et al., 2017b; Dall’Osto et al., 2019). Indeed, these organic nitrogen compounds should be considered when assessing secondary aerosol formation processes in Antarctica (Brean et al., 2021). Other follow up studies also claim that the potential impact of the sea ice (sympagic) planktonic ecosystem on aerosol composition were overlooked in past studies, and multiple eco-regions act as distinct aerosol sources around Antarctica (Rinaldi et al., 2020).
In this study, we explored the link of the natural sea ice microbiota composition with SSA production. We collected sea-ice samples from the northernmost margin of the Weddell Sea, which were melted in a bubbling tank designed to produce sea spray.
Our study has two main objectives.
First, we compare sea water properties before and after aerosol production (via bubbling provided by the plunging jet over 24 hours) to test the effect of a potential physical damage of the marine microorganisms via pump shear. Mayer et al. (2020) reviewed the NSF Center for Aerosol Impacts on Chemistry of the Environment (CAICE) studies, showing insights from a decade of ocean–atmosphere experiments in the laboratory. It was stressed that an undesirable side effect of a centrifugal pump currently is the potential to physically damage the marine microorganisms via pump shear, which distorts the biological communities toward the most hardy species (Lee et al., 2015). However, to our understanding this was only briefly mentioned in the text and not extensively discussed or supported with any biological data. By contrast, in this work we systematically look at an extensive number of biogeochemical variables in order to look at all the measured parameters before and after the bubbling chamber experiments. To our knowledge, this is the first marine aerosol chamber study of this type reported in the literature. The production of aerosols from the ocean surface constitutes an important interaction between the ocean and the atmosphere, but it is challenging to individuate which biogeochemical process affect the atmospheric aerosol chemistry of the aerosol produced.
Our second objective is then to compare different bubbled seawaters from Antarctic melted sea ice in order to look at which sympagic (sea ice) ecological and biogeochemical parameters may be more influential in regulating SSA production.
2 Material and Methods
2.1 Sea-Ice and Seawater Collection
Four sea-ice samples were collected during the PI-ICE cruise (25 January 2019 to 4 February 2019) aboard the RV Hesperides, at the Bransfield strait (56.81° S, 63.40° W) in the Weddell Sea. The sea ice samples were collected from four different first year ice floes encountered in the same marginal sea ice zone study area (open pack ice, sea ice concentration of about 30%), about 50 m from each other (Figure S1). The sea ice samples were stored frozen (-20°C) in darkness (for about two weeks) until the aerosolization experiments were performed at the Spanish research station (Base Antártica Española, BAE, 62.66° S, 60.39° W) located in the Johnson Bay on Livingston Island. In addition, a total of 100 L of seawater were obtained from Johnson Bay to be used for melting the sea ice fragments and to run the experiments. The seawater was filtered through 0.2 µm pore (142 mm diameter polycarbonate) filters and stored dark at 4°C until use. The four sea ice pieces were melted with seawater in the proportion (1:3 volume:volume) with a final total seawater volume of approximately 60L. Four successive experiments, so called SI1, SI2, SI3 and SI4, were conducted. Data herein presented refers to the final diluted samples.
2.2 Aerosol Generation Chamber Experiments; Setup and Design
Bubble-bursting SSA generation experiments were performed on a 75 L airtight high-grade stainless-steel cylindric tank (or chamber) illustrated in Figure S1 in Medina-Pérez et al. (2020). The tank (named OLLA) has internal dimensions (50 cm height, 44 cm diameter) designed to allow research on different marine ecosystems requiring a high volume of water for a variety of chemical and biological parameters (e.g. Park et al., 2019; Park et al., 2020; Medina-Pérez et al., 2020). With a peristaltic pump, seawater was circulated through a Teflon tube from the bottom to the top of the tank where it was dropped as a plunging jet over the water surface at a flow rate of 12 L min−1: in this way entrained air formed bubbles that - by bursting processes - produced spray aerosols. The top of the chamber is covered with a colourless polycarbonate plate (3cm thick) allowing light to enter the marine aerosol chamber. Particle-free compressed air was blown into the tank headspace (60 L min−1), which had outlet ports including a PM1 aerosol sampler with air pumped at 38.3 L min−1 flux, a rotameter for air flux monitoring and because only one impactor was available, the rest of the air was eliminated as excess flow. PM1 aerosol was collected on 47 mm Whatman QM-A quartz filters after 24h long experiment of the melted sea ice in the tank. Outlet ports sampled the SSA laden air using a Scanning Mobility Particle Sizer (SMPS; DMA TSI 3080 and CPC TSI 3025, corrected for diffusion losses). Number size distributions of the aerosol, across the 10–500 nm size range, were collected using the SMPS with scan times of 5 minutes.
Samples for the characterization of the biological and chemical properties in the seawater were taken (from the top of the chamber) before the 24h recirculation and bubbling and after this aerosol generation period in experiments SI1, SI2 and SI3. In the case of SI4 seawater was only collected at the beginning of the experiment due to time constrain and experimental setups. The water was collected always from the same point in the marine aerosol chamber, collecting it from the top of the water column. This was chosen for practical reasons and for avoiding any possible deposition at the bottom of the marine aerosol chamber.
One control test (“control case study SI2”) was conducted during the SI2 experiment - in order to have an estimation of the sedimentation of cells (e.g., Estrada and Peters, 2002 and references there in). At the beginning of the SI2 aerosol chamber experiment, ca. 20L of the sea ice melted microbial community was distributed in an additional 30L white carboy installed next to the aerosol generation chamber, with the same temperature and light conditions. The size of the container allowed it to be completely and gently mixed in order to obtain homogeneous seawater samples. From both, the carboy and the aerosol chamber, seawater samples were collected in parallel at the beginning of the experiment, and subsequently at 1.5h, 4h, 9h, 18h and 24h.
In other words, we conducted a parallel experiment (“control”) on a carboy that remained unaffected by the aerosol chamber water pump. This control (control SI2) is used as a point of comparison against the same water being circulated inside the aerosol chamber (SI2). The control SI2 carboy was shaken and homogenized before sampling, allowing to check for potential phytoplankton cell sedimentation. The chosen control parameters were chlorophyll-a (Chl-a, as proxy of the total phytoplankton community biomass), phytoplankton species composition, prokaryote and virus abundances, and DOM (Dissolved Organic Matter).
2.3 Biological and Chemical Parameters Estimated in the Seawater
Seawater samples collected before or after the aerosol generation period were kept frozen until the analyses conducted at the laboratories within six months after collection; only FDOM samples and Chl a were run fresh in the BAE laboratory.
2.3.1 Virus and Prokaryote Abundance
Subsamples (2 mL) for virus and prokaryote (bacteria and archaea) abundances were fixed with glutaraldehyde (0.5% final concentration) and stored at -80°C. Counts were made on a FACSCalibur (Becton & Dickinson, Franklin Lakes, NJ, USA) flow cytometer in the ICM-CSIC laboratory. Virus samples were diluted with TE-buffer (10:1 mM Tris : EDTA), stained with SYBR Green I, and run at a medium flow speed (Brussaard, 2004), with a flow rate of 58–64 µL min-1. Different groups of viruses (VA) were determined in bivariate scatter plots of green fluorescence of stained nucleic acids versus side scatter (Evans et al., 2009). Depending on their fluorescent signal, viruses were classified as low (V1), medium (V2) or high (V3 and V4) fluorescence that correspond to their content in DNA. It is presumed that, fractions V1 and V2 are mainly attributed to bacteriophages, and V3 and V4 to viruses of eukaryotes (Evans et al., 2009). Prokaryote abundance (PA) samples were stained with SYTO13 (SYTOTM13, ThermoFisher) and counted following the protocol of Gasol and Del Giorgio (2000), and high DNA and low DNA content was discerned.
2.3.2 Nanoflagellate Abundance and Biomass
Nanoflagellate abundance was estimated on seawater subsamples (15-20 mL) fixed with glutaraldehyde (1% final concentration). After ca. 1 hour fixation at 4°C, the samples were filtered through 0.6 µm black polycarbonate filters, and stained with 4,6-diamidino-2-phenylindole (DAPI) at a final concentration of 5 µg mL-1 (Sieracki et al., 1985). The filters were mounted on porta-slides, with immersion oil, and frozen at -20°C until observation at the ICM-CSIC. Cell counts were conducted epifluorescence microscopy (Olympus BX40-102/E at 1000X), with blue wavelength excitation (BP 460–490 nm) and barrier (BA 510–550 nm) filters, and an ultraviolet excitation (BP 360–370 nm) and barrier (BA 420–460 nm) filters. Cell counts were conducted on three transects per 5mm of each collected filter.
Phototrophic nanoflagellates (PNF) could be distinguished from heterotrophic nanoflagellates (HNF), based on red fluorescence emission by plastidic structures upon blue light excitation. When possible, identification at the taxa was conducted at genus or order level. HNF and PNF cell size measures were conducted and four size classes were established (≤2 µm, 2-5 µm, 5-10 µm and 10-20 µm) with an inferred average radius (considering cells as spheres) of 0.75µm, 1.5µm, 3µm and 6µm, respectively. The contribution of HNF and PNF to the carbon biomass (μg C L-1) was estimated by the corresponding carbon-volume ratio, namely, pgC cell-1 = 0.216* (V)^0.939 described in Mender-Deuer and Lessard (2000).
2.3.3 Phytoplankton Identification, Abundance, and Biomass
Seawater samples (100 mL) were collected in amber glass bottles, fixed with hexamine buffered formalin (4% final concentration) and preserved dark at 4°C for quantification of phytoplankton taxa using the method as described, for instance, by Edler and Elbrächter (2005). Samples were gentle shaken and poured in 50 mL methacrylate cylinders of settling chambers. After sedimentation for 24h, samples were counted using an inverted XSB-1A microscope equipped with 4, 10, 25 and 40x flat optics objectives and 10x eyepieces with a 1.25x intermediate lens. The entire base of the settling chambers was scanned at 125x magnification to quantify the organisms less abundant and larger size of the microphytoplankton (>20 µm) and transects (2 minimum) at 312x magnification to quantify the most abundant organisms and nanoplankton (<20 µm). The identification was made at the most precise possible species or genus level. Phytoplankton results are expressed in number of cells per liter. Empty cells were not considered in this study.
For each taxon, its contribution to particulate carbon was calculated from biovolume measures following Mender-Deuer and Lessard (2000). Cells dimensions (length, width and thickness, in µm) estimations were performed using a digital camera and Scope Photo software, calibrated accordingly to the used microscope. For each identified species, cell volume was calculated from average length and width values using the formula of the closest geometric figures approximation. Setae and expansions (horns, wings, etc.) dimensions were excluded; in the case of the flattened organisms, manual corrections of the thickness were applied.
2.3.4 Chlorophyll a
For Chl a concentration estimation, 100 mL of seawater were filtered through 25 mm diameter GF/F glass fiber filter (Whatman). The contribution of the nanophytoplankton was determined by collecting the seawater in the GF/F filters after a previous filtration through 5µm Millipore polycarbonate filters. Chl a was extracted in 90% acetone for 24 hours in the dark at 4°C. Concentrations were determined by fluorimetry with a calibrated Turner Designs fluorometer following the method developed by Holm-Hansen et al. (1965).
2.3.5 Photosynthetic pigments
For the determination of photosynthetic pigments, samples (250 - 350 mL) were collected using the same procedure than for the fluorometric estimation of Chl a. Filters were stored at -80°C and extracted on 4 mL acetone with a probe sonicator (Sonopuls GM70 Delft, The Netherlands) (50 W, 2 min). The extract was centrifuged (4 min at 3000 rpm, 4°C) and filtered through Whatman Anodisc 25 (0.1 µm). A volume of 1.3 mL is introduced in glass vials and evaporated in a Biotage TurboVap LV evaporator. Once the sample is completely evaporated, 75 µL of 90% acetone are added and analysed by Acquity UPLC H-Class (Waters Corporation) instrument following the protocol by Buchaca and Catalan (2007) adapted to an Ultra High Performance Liquid Chromatography. Pigment standards were from DHI Water and Environment (Hørsholm, Denmark). Chl a, its epimers and allomers are presented as total TChl a.
2.3.6 Inorganic and Organic Nutrients
Dissolved inorganic nutrients (nitrate, phosphate and silicate) were measured with standard segmented flow analysis with colorimetric detection, using a SEAL Auto Analyzer AA3 HR (BBMO) or Bran + Luebe autoanalyser.
2.3.7 DOC
For dissolved organic carbon (DOC) analysis 30mL of seawater were filtered through precombusted (450°C, 24h) 47mm GF/F glass fiber filters (Whatman), in a filtration system under controlled pressure conditions with nitrogen gas. The filter was prewashed with milliQ water, and the collecting flask was rinsed three times with filtered sample water before use. The sample was stored frozen (-20°C) until analysis in the laboratory. Following the elimination of inorganic carbon by the acidification of the sample, determination of DOC in seawater was conducted by high temperature catalytic oxidation (680°C) as described in Álvarez-Salgado and Miller, 1998. Measurements were conducted with the TOC-V CSH Shimadzu autoanalyzer that holds a NDIR (non-dispersive infrared) detector using Milli-Q water as a blank, potassium hydrogen phthalate as the calibration standard, and deep Sargasso Sea water as the reference (Hansell Laboratory. University of Miami, RSMAS). Concentrations are expressed as µmol C L-1.
2.3.8 FDOM
Samples for fluorescent dissolved organic matter (FDOM) characterization were filtered in the same manner as those of DOC and immediately analysed using a Horiba Aqualog spectrofluorometer. Excitation-emission matrices (EEMs) were collected in the excitation/emission range 240-600/240-600nm with 3nm increments in excitation and emission integrated every ~3.3nm over 8 seconds in high gain mode. Absorbance spectra were collected simultaneously to EEM over the same excitation range and intervals. Data processing was performed with the staRdom package in R (Pucher et al., 2019): briefly, blank EEMs of ultrapure Milli-Q water were subtracted, inner filter effects were corrected using the absorbance data (Kothawala et al., 2013), fluorescence was normalized using the integrated Raman peak of blanks (Lawaetz and Stedmon, 2009) and Rayleigh and Raman scatter were nullified as well as instrumental artifacts (when needed) after visual inspection of EEMs. A PARAFAC model was fitted using 55 EEMs of melted sea ice samples from all experiments and non-negativity constrains. After model validation through split half analysis (Figure S3) and inspection of residuals (Murphy et al., 2013), a five component model was selected and its fluorescent components compared visually with common fluorescence peaks (Coble, 2007) and with other PARAFAC components through the Openfluor database (Murphy et al., 2014). Fluorescence intensities are expressed in Raman Units (RU) (Figure S2 and Table S4).
2.3.9 POC
For POC (particulate organic carbon) analysis, seawater samples (1000 mL) were filtered through precombusted (4h, 450°C) 25mm GF/F glass fiber filters (Whatman) which were immediately frozen at -80°C and subsequently maintained at −20°C until further processing. Filters were dried and analysed with an elemental analyser (Perkin-Elmer 2400 CHN). Concentrations are expressed as µmol C L-1.
2.3.10 TEP and CSP
Samples for determination of the concentration of Transparent Exopolymer (TEP) and Coomassie Stainable Particles (CSP) were collected in triplicate by very gentle filtration (~150 mmHg vacuum) on 25mm diameter 0.4 µm pore size polycarbonate filters (DHI). TEP concentration was determined following the colorimetric method described by Passow and Alldredge (1995) and the analogous method developed by Cisternas-Novoa et al. in 2014 was followed for the CSP. For TEP determination, filters were stained with an Alcian Blue (8GX) solution (500 µL, 0.02%, pH 2.5) for 5s. CSP filters were stained with 1 mL of Coomassie Brilliant Blue (CBB-G 250) solution (0.04%) for 30 s, prepared daily with filtered (0.2 µm) seawater. Immediately after staining, all filters were rinsed with mili-Q water and stored in 2mL micro-vials at -20°C. Triplicate blanks (empty filters) were stained daily for TEP and for CSP with the corresponding staining method used for regular samples. Sample dye extraction and measurements of absorbance were performed in the ICM-CSIC using a Varian Cary 100 Bio spectrophotometer. Both staining solutions were calibrated following their respective methods. TEP staining solution was calibrated before and after the PI-ICE cruise using xanthan gum (XG) as a standard. CSP staining solution was calibrated using bovine serum albumin (BSA) after the cruise to consider salinity. Accordingly, TEP concentrations are expressed as xanthan gum equivalents (µg XG equiv. L-1) and CSP concentrations as BSA equivalents (µg BSA equiv. L-1).
2.4 Particulate and Dissolved Carbohydrates in Seawater
Particulate combined carbohydrates (PCCHO, >0.2µm), dissolved combined carbohydrates (DCCHO, <0.2µm) and dissolved free carbohydrates (DFCHO) were determined as described by (Zeppenfeld et al., 2020; Zeppenfeld et al., 2021) using a high-performance anion-exchange chromatography with pulsed amperometric detection (HPAEC-PAD). DFCHO, DCCHO and PCCHO were calculated as the sums of following monosaccharides, either occurring as free molecules (DFCHO) or being released after an acid hydrolysis (DCCHO & PCCHO): glucose, fucose, arabinose, rhamnose, galactose, xylose, mannose, fructose, glucosamine, galactosamine, muramic acid, glucuronic acid, galacturonic acid. All seawater samples were measured in duplicate.
2.5 Ice Nucleating Particles
Number concentrations of INP were determined using two well established freezing assays, described in detail in Gong et al. (2020) and Hartmann et al. (2021). Either 90 or 96 droplets with volumes of either 1 or 50 µL were pipetted onto hydrophobic glass slides or into PCR-trays for these two methods, namely LINA (Leipzig Ice Nucleation Array) or INDA (Ice Nucleation Droplet Array), respectively. The hydrophobic glass plates were then cooled down on the Peltier element of a cold stage in LINA, and the PCR-trays used in INDA were cooled down in a thermostat operated with ethanol. The number of frozen droplets was determined automatically from pictures taken during the cooling process, on which the change from a liquid to a frozen droplet can clearly be seen in a change of the reflectivity, and hence of the grey value, of the droplets. From the obtained cumulative count then INP concentrations per volume of sample were determined in a way usually used for this kind of measurements, using Poisson statistics as suggested by Vali (1971).
2.6 1H-NMR Spectroscopy Analysis
All the Quartz-fiber filters collecting Particulate organic carbon (POC) from the sea-ice (SI) Bubble Bursting experiments were extracted with deionized ultra-pure water (Milli-Q) in a mechanical shaker for 1 h and the water extract was filtered on PTFE membranes (pore size: 0.45 μm) in order to remove coarse suspended particles. The extracts were dried under vacuum and re-dissolved in deuterium oxide (D2O) for organic functional group characterization by 1H-NMR spectroscopy, as described in Decesari et al. (2000). The 1H-NMR spectra were acquired at 600 MHz in a 5 mm tube using a Varian Unity INOVA spectrometer, at the NMR facility of the Department of Industrial Chemistry (University of Bologna). Sodium 3-trimethylsilyl-(2,2,3,3-d4) propionate (TSP-d4) was used as an internal standard by adding 50 μL of a 0.05% TSP-d4 (by weight) in D2O to the standard in the probe. To avoid the shifting of pH-sensitive signals, the extracts were buffered to pH about 3 using a deuterated formate/formic-acid (DCOO-/HCOOH) buffer prior to the analysis. The speciation of hydrogen atoms bound to carbon atoms can be provided by 1H-NMR spectroscopy in protic solvents. On the basis of the range of frequency shifts (expressed as ppm), the signals can be attributed to H-C containing specific functionalities (Decesari et al., 2020): Ar-H (6.5 – 8.5 ppm), aromatic protons; O-CH-O (5 – 6 ppm), anomeric and/or vinyl protons; H-C-O (3.2 – 4.5 ppm), protons bound to oxygenated aliphatic carbon atoms (hydroxyl and alkoxy groups): aliphatic alcohols, ethers, and esters; H-C-C= (1.8 – 3.2 ppm), protons bound to aliphatic carbon atoms adjacent to unsaturated groups like alkenes (allylic protons), carbonyl or imino groups (heteroallylic protons) or aromatic rings (benzylic protons); H-C (0.9 – 1.8 ppm), unfunctionalized alkylic protons.
3 Results
In the following sections we investigate the differences found in the water aerosol chamber before (t=0) and after (t=24h) aerosol bubbling (SI1-3, three experiments); we briefly discuss a “control” case study for the SI2 experiment; and we compare SSA produced and sea waters among the four different experiments (SI 1-4) in order to shed some light on the link between SSA production and biological and ecological melted sea ice properties.
3.1 Marine Sea Ice Microbiota
Average Chl a concentration in the sea ice reached 9.0 ± 2.3 µg L-1 (Figure 1A) and was significantly higher than in seawater samples collected nearby (same PI-ICE field study, data collected within 100 km from the sea ice sampling point, Chl-a of about 0.03-2.2 µg L-1, Zeppenfeld et al., 2020). These high values of Chl a concentration in the melted sea ice samples corresponded to the high microphytoplankton biomass living inside the sea ice - measured during previous studies (Arrigo et al., 2009; Arrigo, 2014).
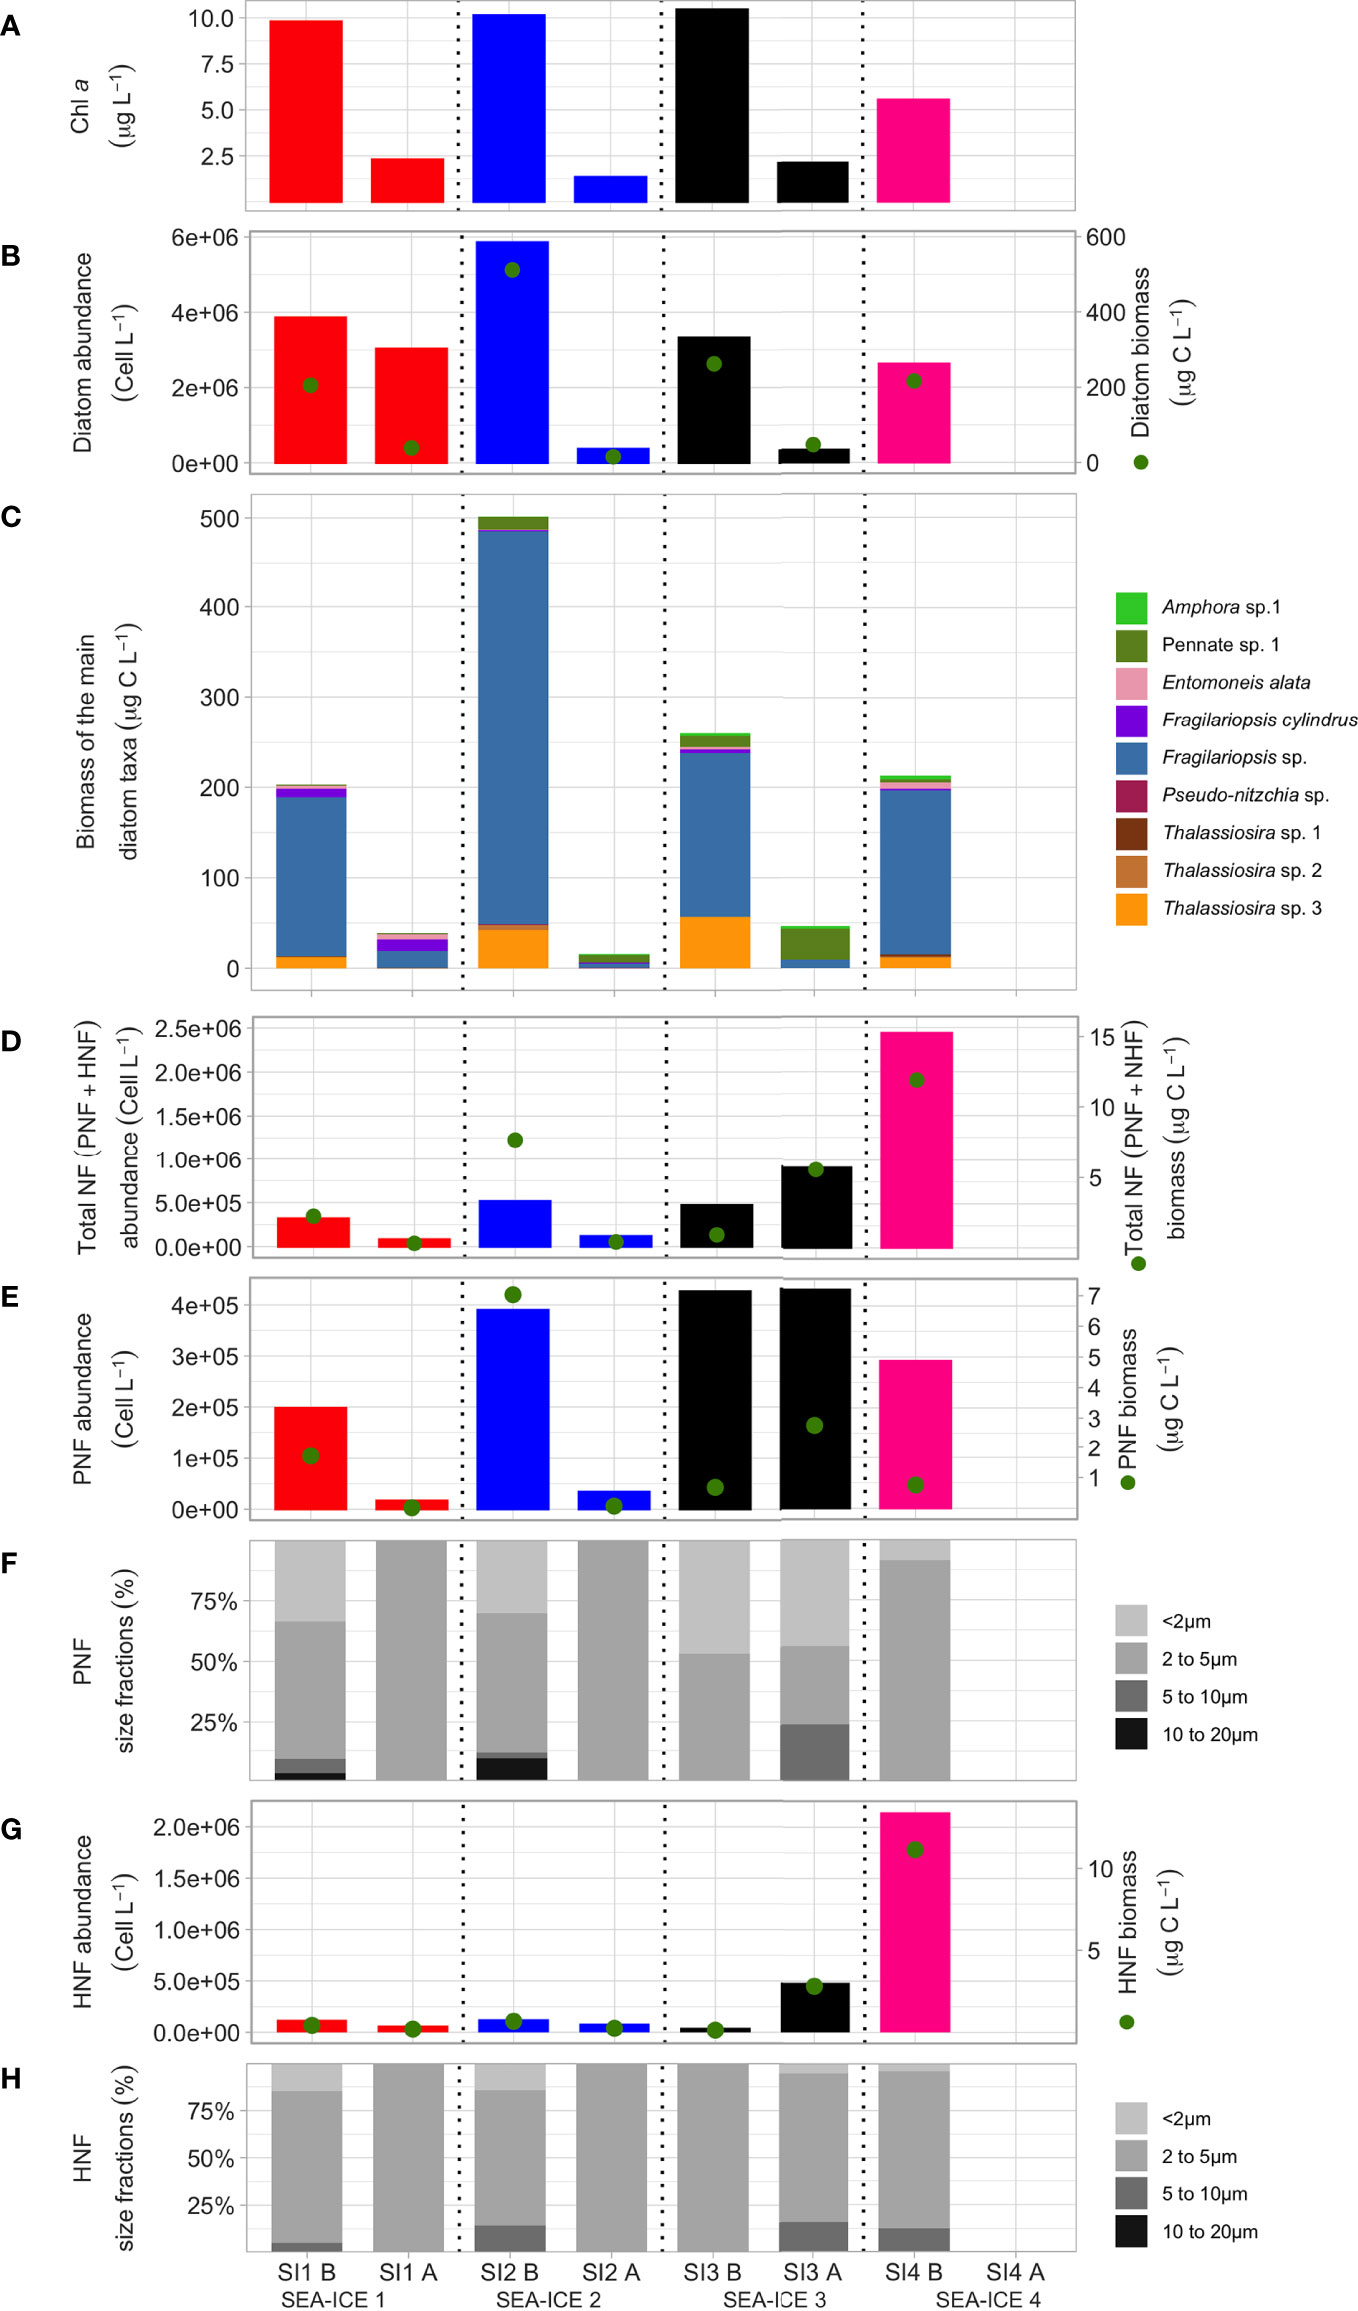
Figure 1 Changes in micro- and nanoplankton related variables measured in the four sea ice experiments before and after the aerosol generation period. For each experiment the first bar corresponds to the values estimated before (“B”) bubbling; the second bar shows the values after (“A”) bubbling. From top to bottom, the graphs show (A) Chl a concentration; (B) diatom cell abundance (bars) and the corresponding carbon contribution (biomass, green dots); (C) biomass of the main diatom taxa; (D) abundances (bars) and biomass (green dots) of nanoflagellates (NF) including the sum of PNF and HNF; (E) PNF abundance and biomass, as in (d); (F) size class distributions of PNF; (G) HNF abundance and biomass as in (d); (H) size class distributions of HNF. Please note that diatom (B) depositing are large (very often > 20µm) relative to nano-flagellates (PNF, HNF very often < 20µm).
Overall, regarding biomass, diatoms were the most abundant group in terms of Carbon mass (C) at the beginning of the experiments (Figure 1B), with contributions between 82% and 97% (Table S1). The most abundant taxon (Figure S2) was Thalassiosira spp., Fragilariopsis cylindrus and in particular non-identified species of the genus Fragilariopsis (Figure 1C). Dinoflagellates were almost absent in all samples. The rest of photosynthetic organisms were nanoflagellates (PNF), smaller than 5 µm in size (Figure 1F) and contributing less than 10% to the total diatom´s carbon mass (Figures 1D, E; Table S1). Concerning heterotrophic organisms, heterotrophic nanoflagellates (HNF) were in the same order of magnitude in terms of both abundance and carbon than PNF in SI1, SI2, and SI3, but exhibited 10 times higher values in SI4 (Table S1). Finally, prokaryotes accounted for less than 5% of C in SI1 and SI2 but ca. 16.7% in SI3 and 10% in SI4 (Figures 2A, B and Table S1). The bacterial contribution to C was markedly high in SI3 and SI4. Virus-C contributed to no more than 0.58% of the carbon (Table S1 and Figures 2C, D).
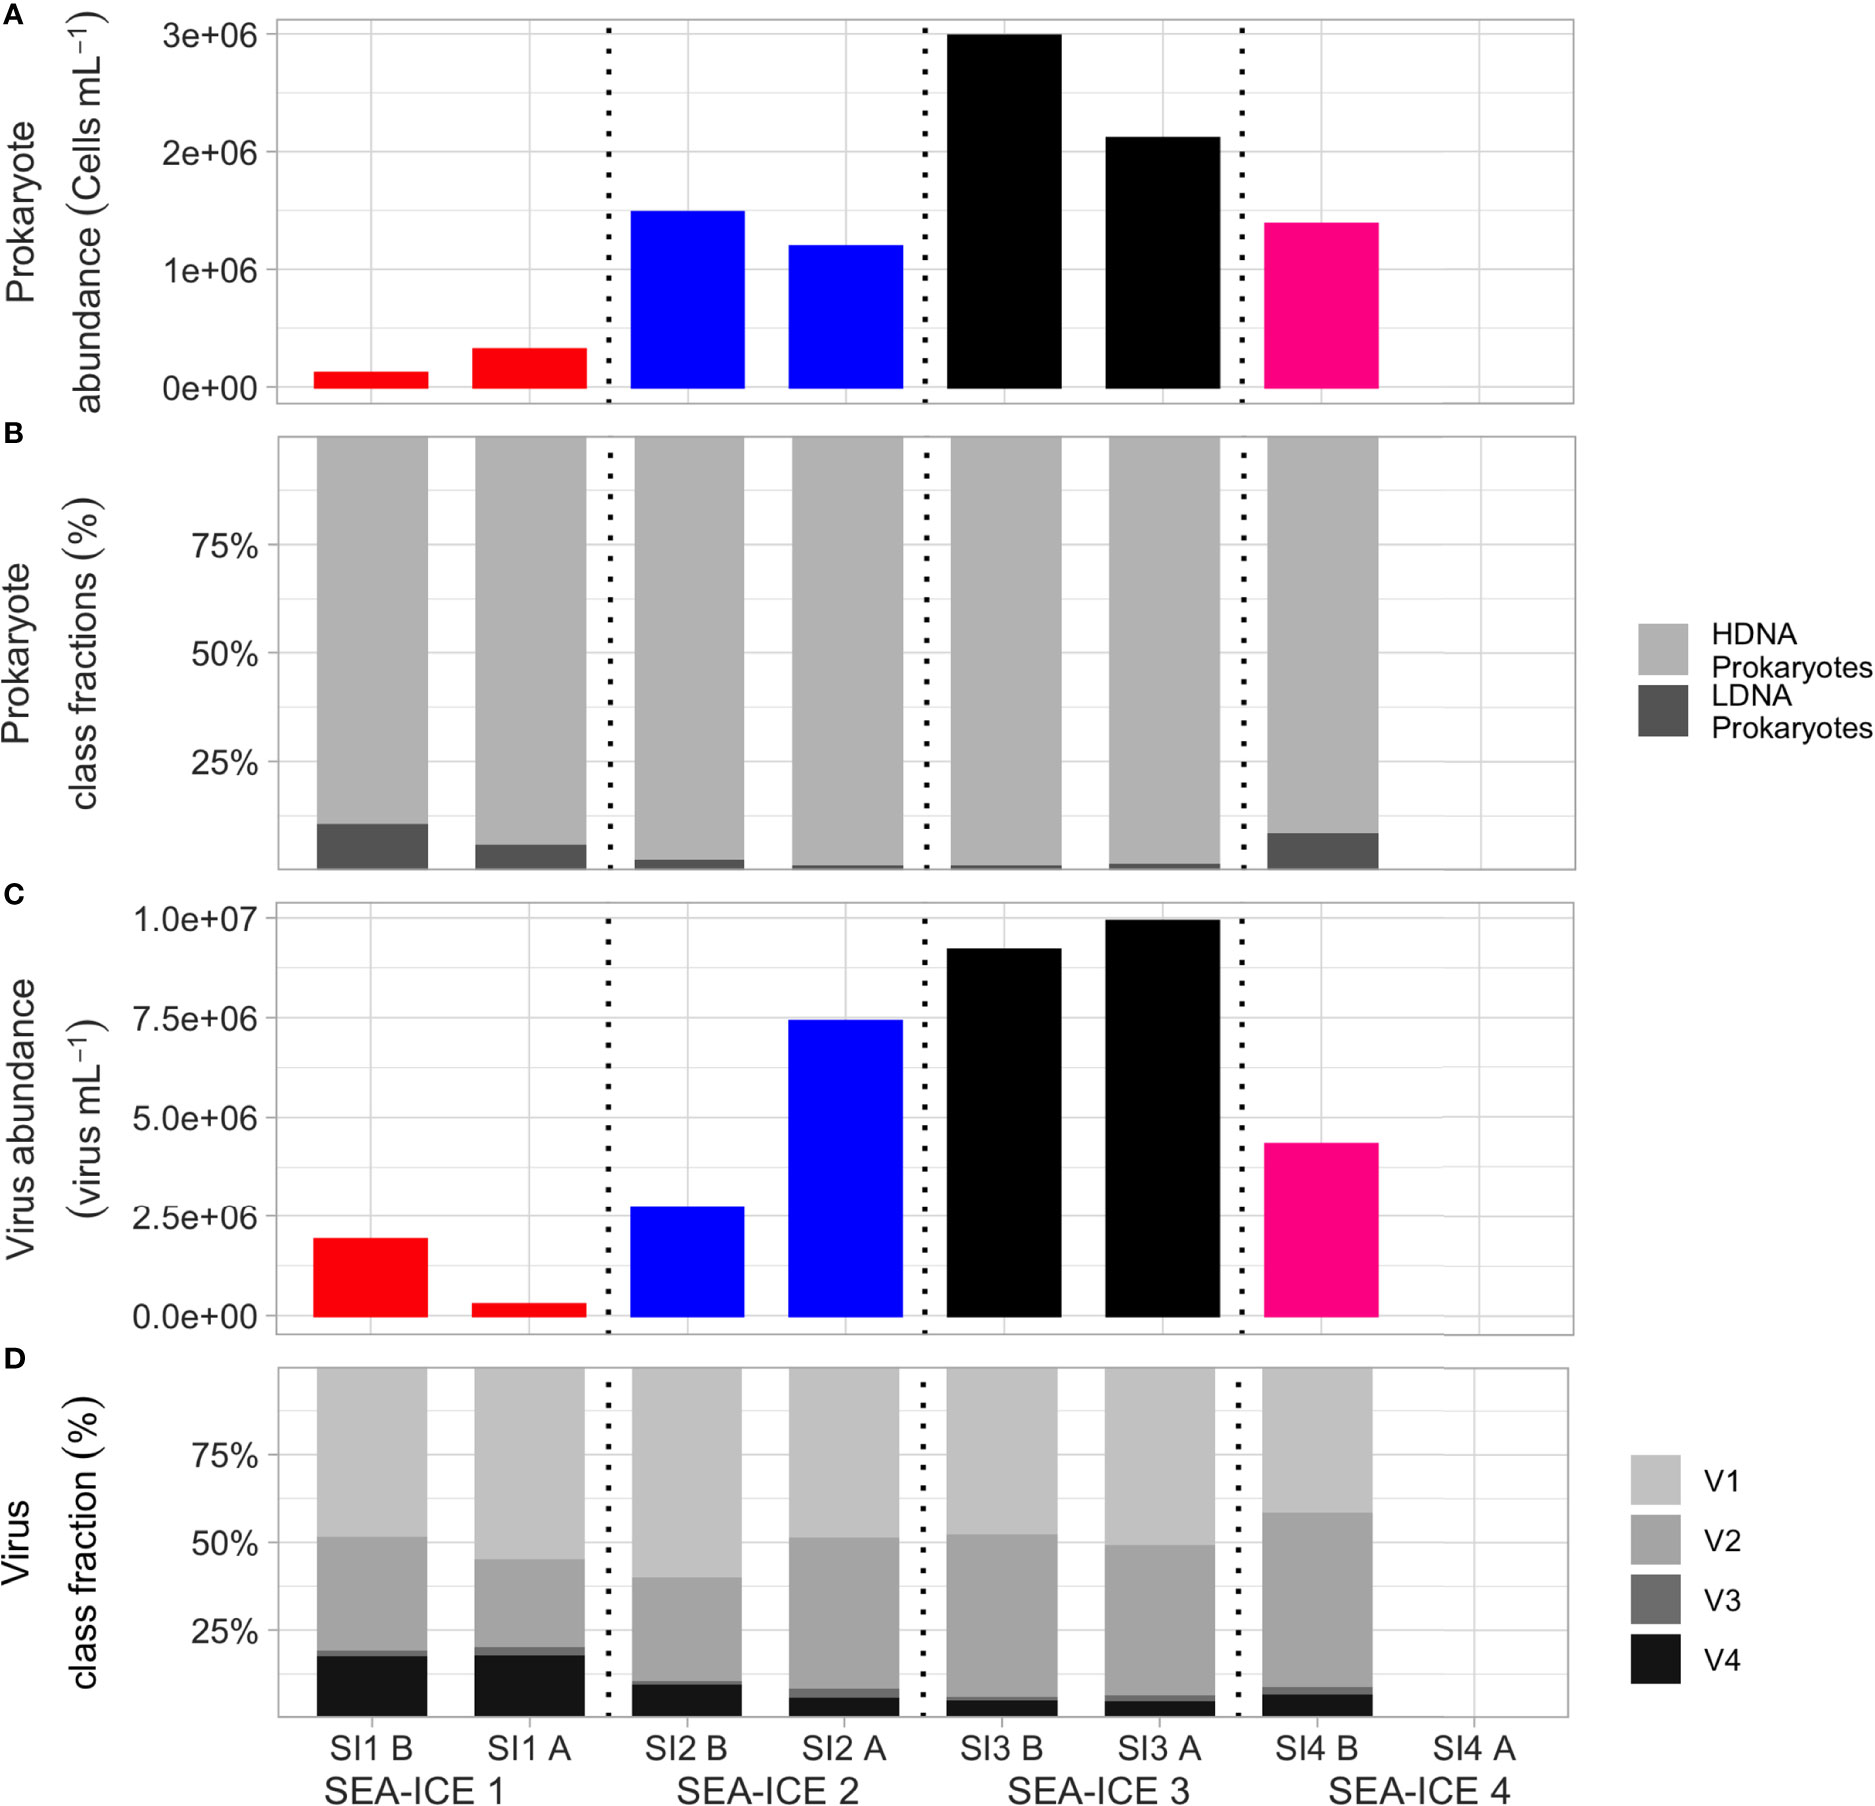
Figure 2 Changes of prokaryote- and virus-related parameters measured in the four sea ice experiments before and after the aerosol generation period. For each experiment the first bar corresponds to the values estimated before (“B”) bubbling; the second bar shows the values after (“A”) bubbling. From top to bottom, the graphs show (A) prokaryote concentrations; (B) proportion of HDNA and LDNA bacteria; (C) concentrations of viral particles; (D) distribution (as %) of the different types of virus particles.
In all the four sea ice experiments, there is a general trend of the chlorophyll a concentration to decrease sharply after the 24h bubbling, from 10-11 µg L-1 to 2-3 µg L-1 (Figure 1A). Sedimentation of large diatoms (Figure 1B) at the bottom of the aerosol chamber is a likely explanation for this sharp decrease, the majority of these attributed to large Fragilariopsis spp. (Figure 1C). Before bubbling, the community structure is mainly based on various unidentified species of Fragilariopsis spp., Fragilariopsis cylindrus (>20 µm), and differently-sized Thalassiosira spp. (Figure 1C). After bubbling, in SI1, Entomoneis alata and Fragilariopsis cylindrus have substantially grown (from 1.8x10³ to 3.1x10³ cell L-1 and from 1.9x10⁶ to 2.7x10⁶ respectively). In SI2 and SI3, the dominant taxon representing more than half of the observed biomass is an unidentified pennate diatom (Diatom sp.1, Figure 1C) (2.8x10⁴ and 1.2x10⁵ cell L-1, respectively). Nevertheless, an unidentified species of Amphora (Amphora sp.1, µm), which has grown during the bubbling (from 1.1x10⁴ to 1.5x10⁴ cell L-1 in SI2 and from 4.9x10⁴ to 1.0x10⁵ cell L-1 in SI3), also contributes to the total biomass (Figure 1C). Nutrients concentrations are reported in Figure S1. Silicate concentrations were more than twice the inorganic nitrogen concentrations, indicating that diatoms were not limited on silica for their frustule. N/P ratios were around Redfield ratios, suggesting that neither N nor P were limiting for photosynthetic microorganisms (Figure S1).
A different scenario is observed for the nanoflagellates (Figure 1F), both for heterotrophic pico/nanoflagellates (HNF) and phototrophic pico/nanoflagellates (PNF) (note that many of these are mixotrophic). Briefly, HNF use their flagella to swim and to help capturing their preys (bacteria, archaea and other picoeucaryotes). As a result, they release colloidal organic matter through “picopellets” (Nagata, 2000). By contrast, PNF are photosynthetic microorganisms and part of the phytoplankton. Particularly interested is the fact that SI1 and SI2 have similar pattern among them, and remarkably different from SI3 and SI4. As shown in Figure 1F, Total nanoflagellate (Total NF) concentrations (sum of PNF and HNF) diminishes after bubbling in SI1 and SI2, from 3.1x10⁵ to 8.3x10⁴ cell L-1 and from 5.2x10⁵ to 1.2x10⁵ cell L-1 respectively. By contrast, in SI3, PNF remained constant at very high concentrations (around 4.3x10⁵ cell L-1), and heterotrophic nanoflagellates (HNF, Figure 1G) even increased their concentration from 4.5x10⁴ cell L-1 to 4.8x10⁵ cell L-1. The reason for these differences may again be the larger average PNF and HNF sizes that were present in the first two samples (Figures 1F, G), supporting the idea that larger phytoplankton sedimented on the bottom of the aerosol chamber.
Some hints can be derived from the HPLC analysis. The contribution of the < 5 µ nanophytoplankton to the total photosynthetic community was estimated considering the sum of all detected pigments (Table S3). At the beginning of the experiments, nanophytoplankton accounted for 4.1 to 13.1% of the total community. After the aerosol generation experiments, this small size fraction increased up to 32.2%, in agreement with the decrease in cell numbers of the larger size fractions determined by epifluorescence (Figure 1). This finding indicates that the conditions in the tank favoured their growth or that there was a low grazing pressure by phagotrophic predators (HNF). Furthermore, the degradation pigments (phaeophytins and phaeophorbides) were very low at the beginning of the incubations, both in the total community and in the <5μm size fraction (less than 8,5% and 5,3%, respectively, of the total pigments; Table S3). After the 24h aerosol generation experiments, no increase in the degradation pigments was observed, as expected due to the short duration of the incubation (Louda et al., 2002), and confirming that there was no damage of the photosynthetic organisms in the tank. The HPLC results give further support to the fact that the decrease in Chl a in the tank is likely due to the sedimentation of the large phytoplankton cells. Figure 2 shows the prokaryote abundances and the viral abundances for the four aerosol chamber experiments. Prokaryote abundances varied from 1.1 x 10⁵ to 29.0 x 10⁵ cells mL-1, with an average of 14.8 ± 6.7 x 10⁵ cells mL-1. Most prokaryotes had a high nucleic acid content (HDNA), indicating that they were active. Broadly, HDNA prokaryotes with a high content of DNA are an indication for active cells (high growth rates and larger sized cells than LDNA prokaryotes, Vaqué et al., 2001); HDNA prokaryotes are susceptible to be eaten by protits (HNF) for their size and activity. By contrast, LDNA prokaryotes are smaller and with lower content of DNA than HDNA. They are “dormant”, but can also be infected by viruses or eaten by HNF. Viral particle abundances ranged between 1.9 x 10⁶ viruses mL-1 (SI1) and 9.2 x 10⁶ viruses mL-1 (SI3). The viral fractions with highest abundances were V1 and V2, corresponding to bacteriophages. These two fractions jointly accounted for 81%, 90%, 94% and 91% of the total viral abundance in the four sea ice samples, respectively (Table S1). On average, total viral abundance was higher in sea ice (4.5 ± 1.8 x 10⁶ viruses mL-1) than in the seawater collected during the same PI-ICE field study around the study area (1.6 x 10⁶ viruses mL-1. The virus-to-prokaryote ratio (VPR, VA/PA) varied between 1.84 and 16.69 with an average of 6.2 ± 4.1 in the sea ice samples. When comparing the VA and PA concentrations before and after bubbling, a clear conclusion on the effect of the aerosol chamber experiments on the overall VA and PA concentrations cannot be drawn, cause virus and bacteria presented different (before and after) trends for all four experiments.
3.1.1 Control Case Study
For a better insight of the variation of the biological variables during the experiments, we set up a parallel control during the second experiment (SI2), which we sampled intensively during 24h (Figure 3). Figure 3 shows that both Chl a (from 5.2 to 8.2 µg L-1), and diatom abundance and biomass (from 3.2x10⁶ to 4.9x10⁶ cell L-1 and from 170 to 402 µg C L-1 respectively) in the control increasingly exceeded the concentrations in the OLLA tank during SI2. During the experiments the species that dominated the diatom community after 24h were mainly Fragilariopsis spp., Diatom sp. 1 and Amphora sp 1. By contrast, when preventing the sedimentation of the bigger cells in the control setting, the species that dominated the diatom community were those that settled in the experiments, Thalasiossira spp. (>50µm) and Fragilariopsis spp. (Figure 3). In the control SI2, nanoflagellates, prokaryotes (bacteria and archaea), viruses and DOC remained fairly constant over time (Figure 3). This control SI2 case study strongly supports the conclusion that large diatoms sedimented over 24h time at the bottom of the aerosol chamber, explaining the decrease in chlorophyll and diatom abundances observed in Figures 1A, B.
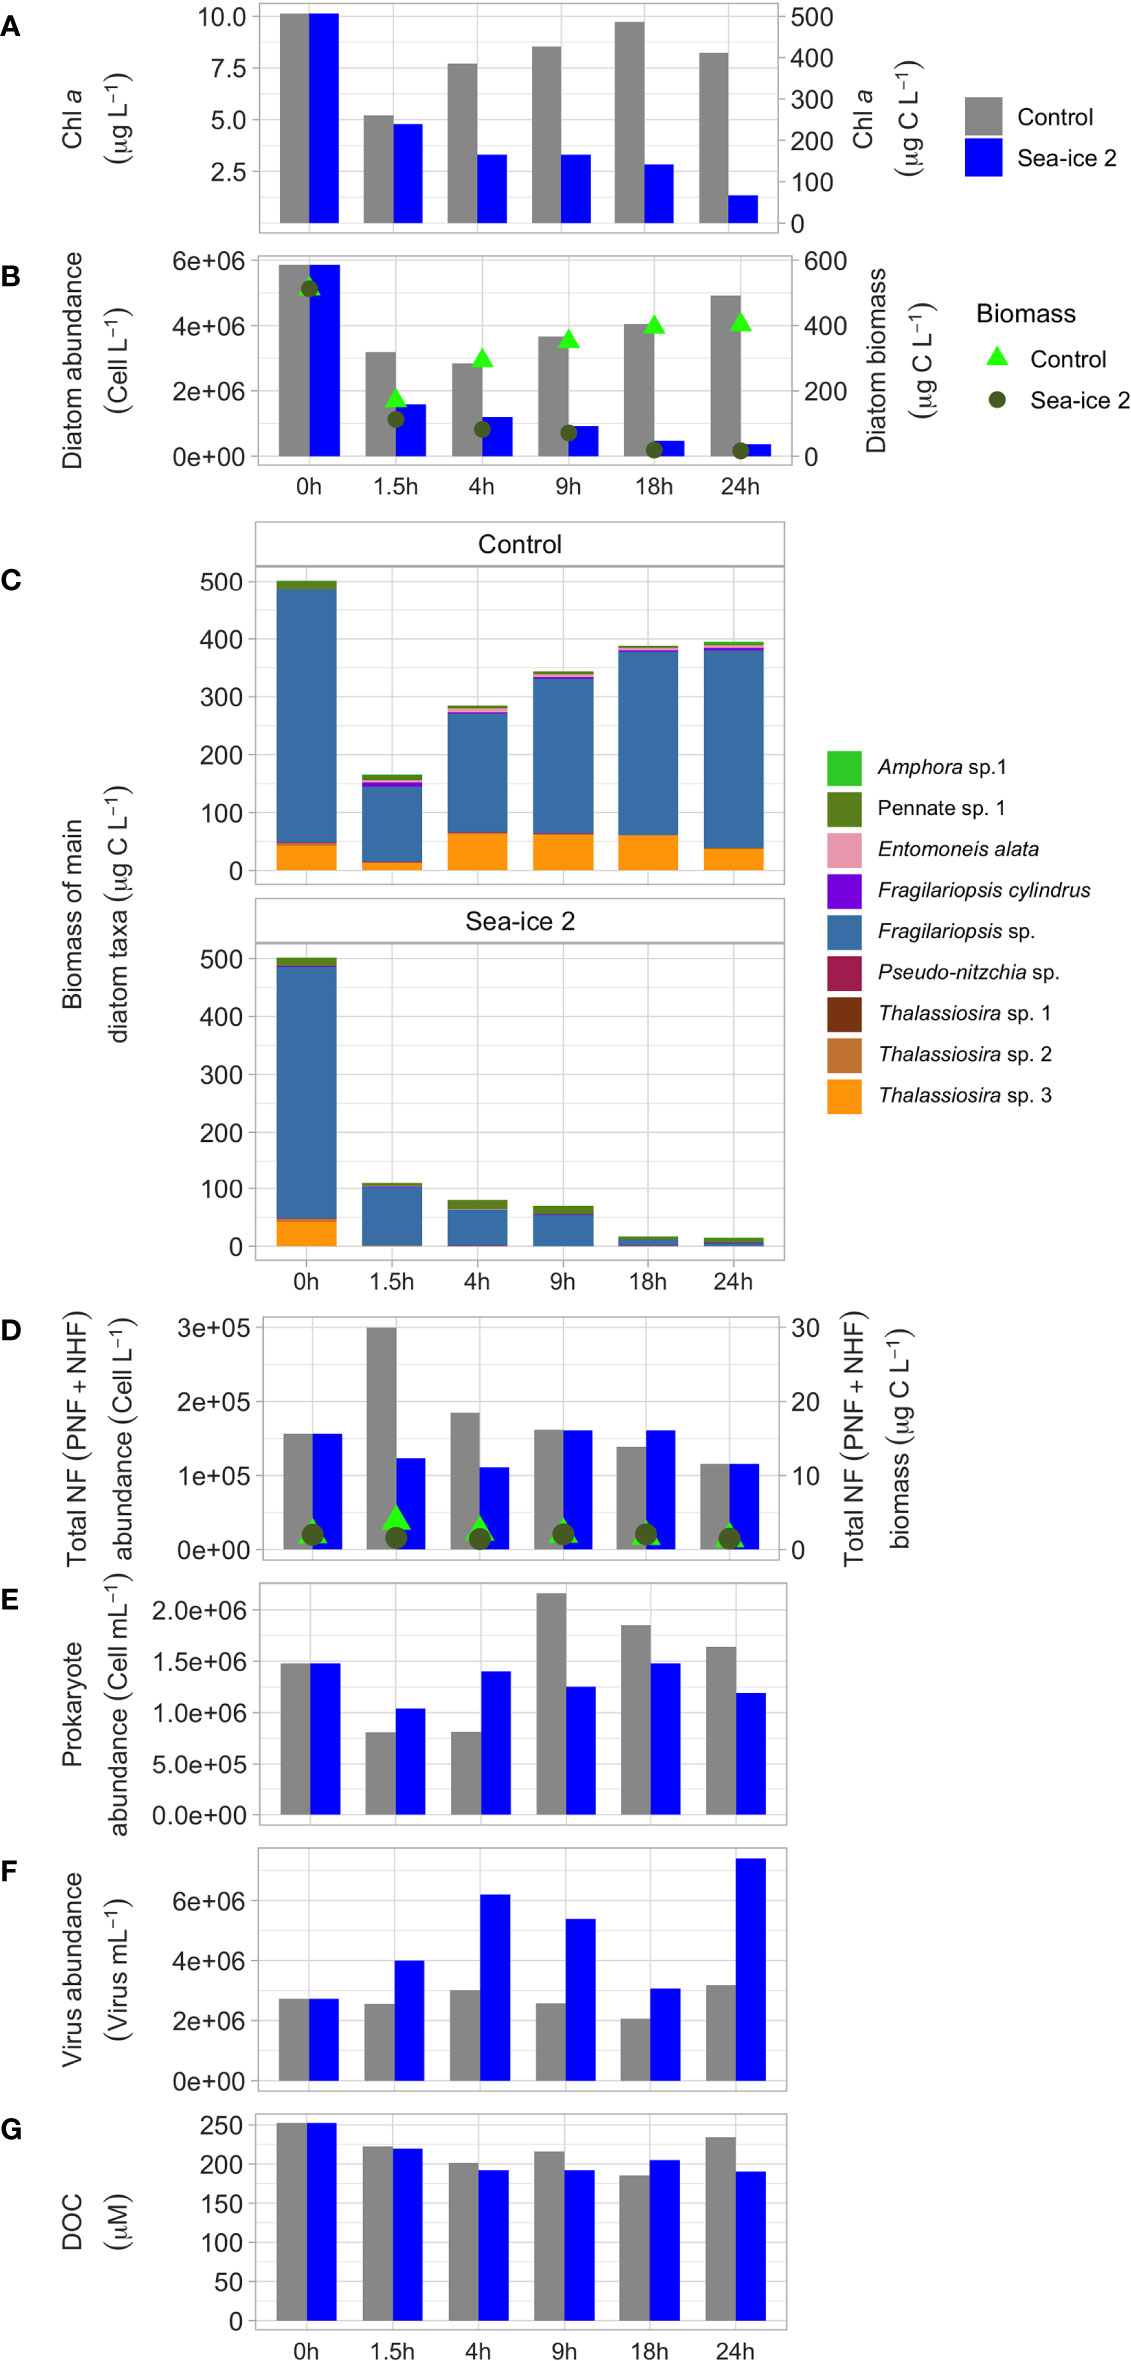
Figure 3 Changes in micro- and nanoplankton and DOC related variables measured in the control SI2 and SI2 samples. From top to bottom, the graphs show (A) Chl a concentration; (B) diatom cell abundance (bars) and the corresponding carbon contribution (biomass, green dots); (C) biomass of the main diatom taxa; (D) abundances (bars) and biomass (green dots) of nanoflagellates (NF) including the sum of PNF and HNF; (E) prokaryote abundance; (F) viruses abundances; (G) DOC concentrations.
3.2 Marine Biogeochemical Properties
Marine organic constituents occur in the ocean in dissolved and particulate form. Particulate organic carbon (POC) is defined operationally by a filtration cut-off at 0.2 to 1.0 μm (Nunes et al., 2019). Dissolved organic carbon (DOC) is contributed by the excreta and metabolites of the marine biota but it also accounts for a pool of refractory compounds, resistant to microbial degradation, and well mixed in the water column.
3.2.1 Particulate Organic Carbon
When comparing the four different SI samples, SI3 shows the highest concentrations (about 80 µM) of POC, whilst the remaining three SI samples did not show large differences. However, when comparing the before (B) and after (A) bubbling, Figure 4A clearly shows that POC decreased in all SI1-3 experiments, supporting data from Figure 1 showing deposition of particulate debris. Natural organic gels - a fraction of exopolymeric substances (EPS) representing dissolved or particulate polymeric organic substances outside the cell (Engel et al., 2020) - were also measured in two major classes: polysaccharidic transparent exopolymer particles (TEP) and proteinaceous Coomassie stainable particles (CSP). TEP and CSP - like POC - showed a decline in concentration after the bubbling (Figures 4B, C). When looking at ratios, it is interesting that the POC/Chl-a ratio was higher in SI3 and SI4, with lower values in SI2 and SI1 (Table S1). These numbers suggest a higher contribution of heterotrophic microorganisms, extracellular organic carbon and detritus to the total carbon in the sea ice blocks for the SI3 and SI4 samples.
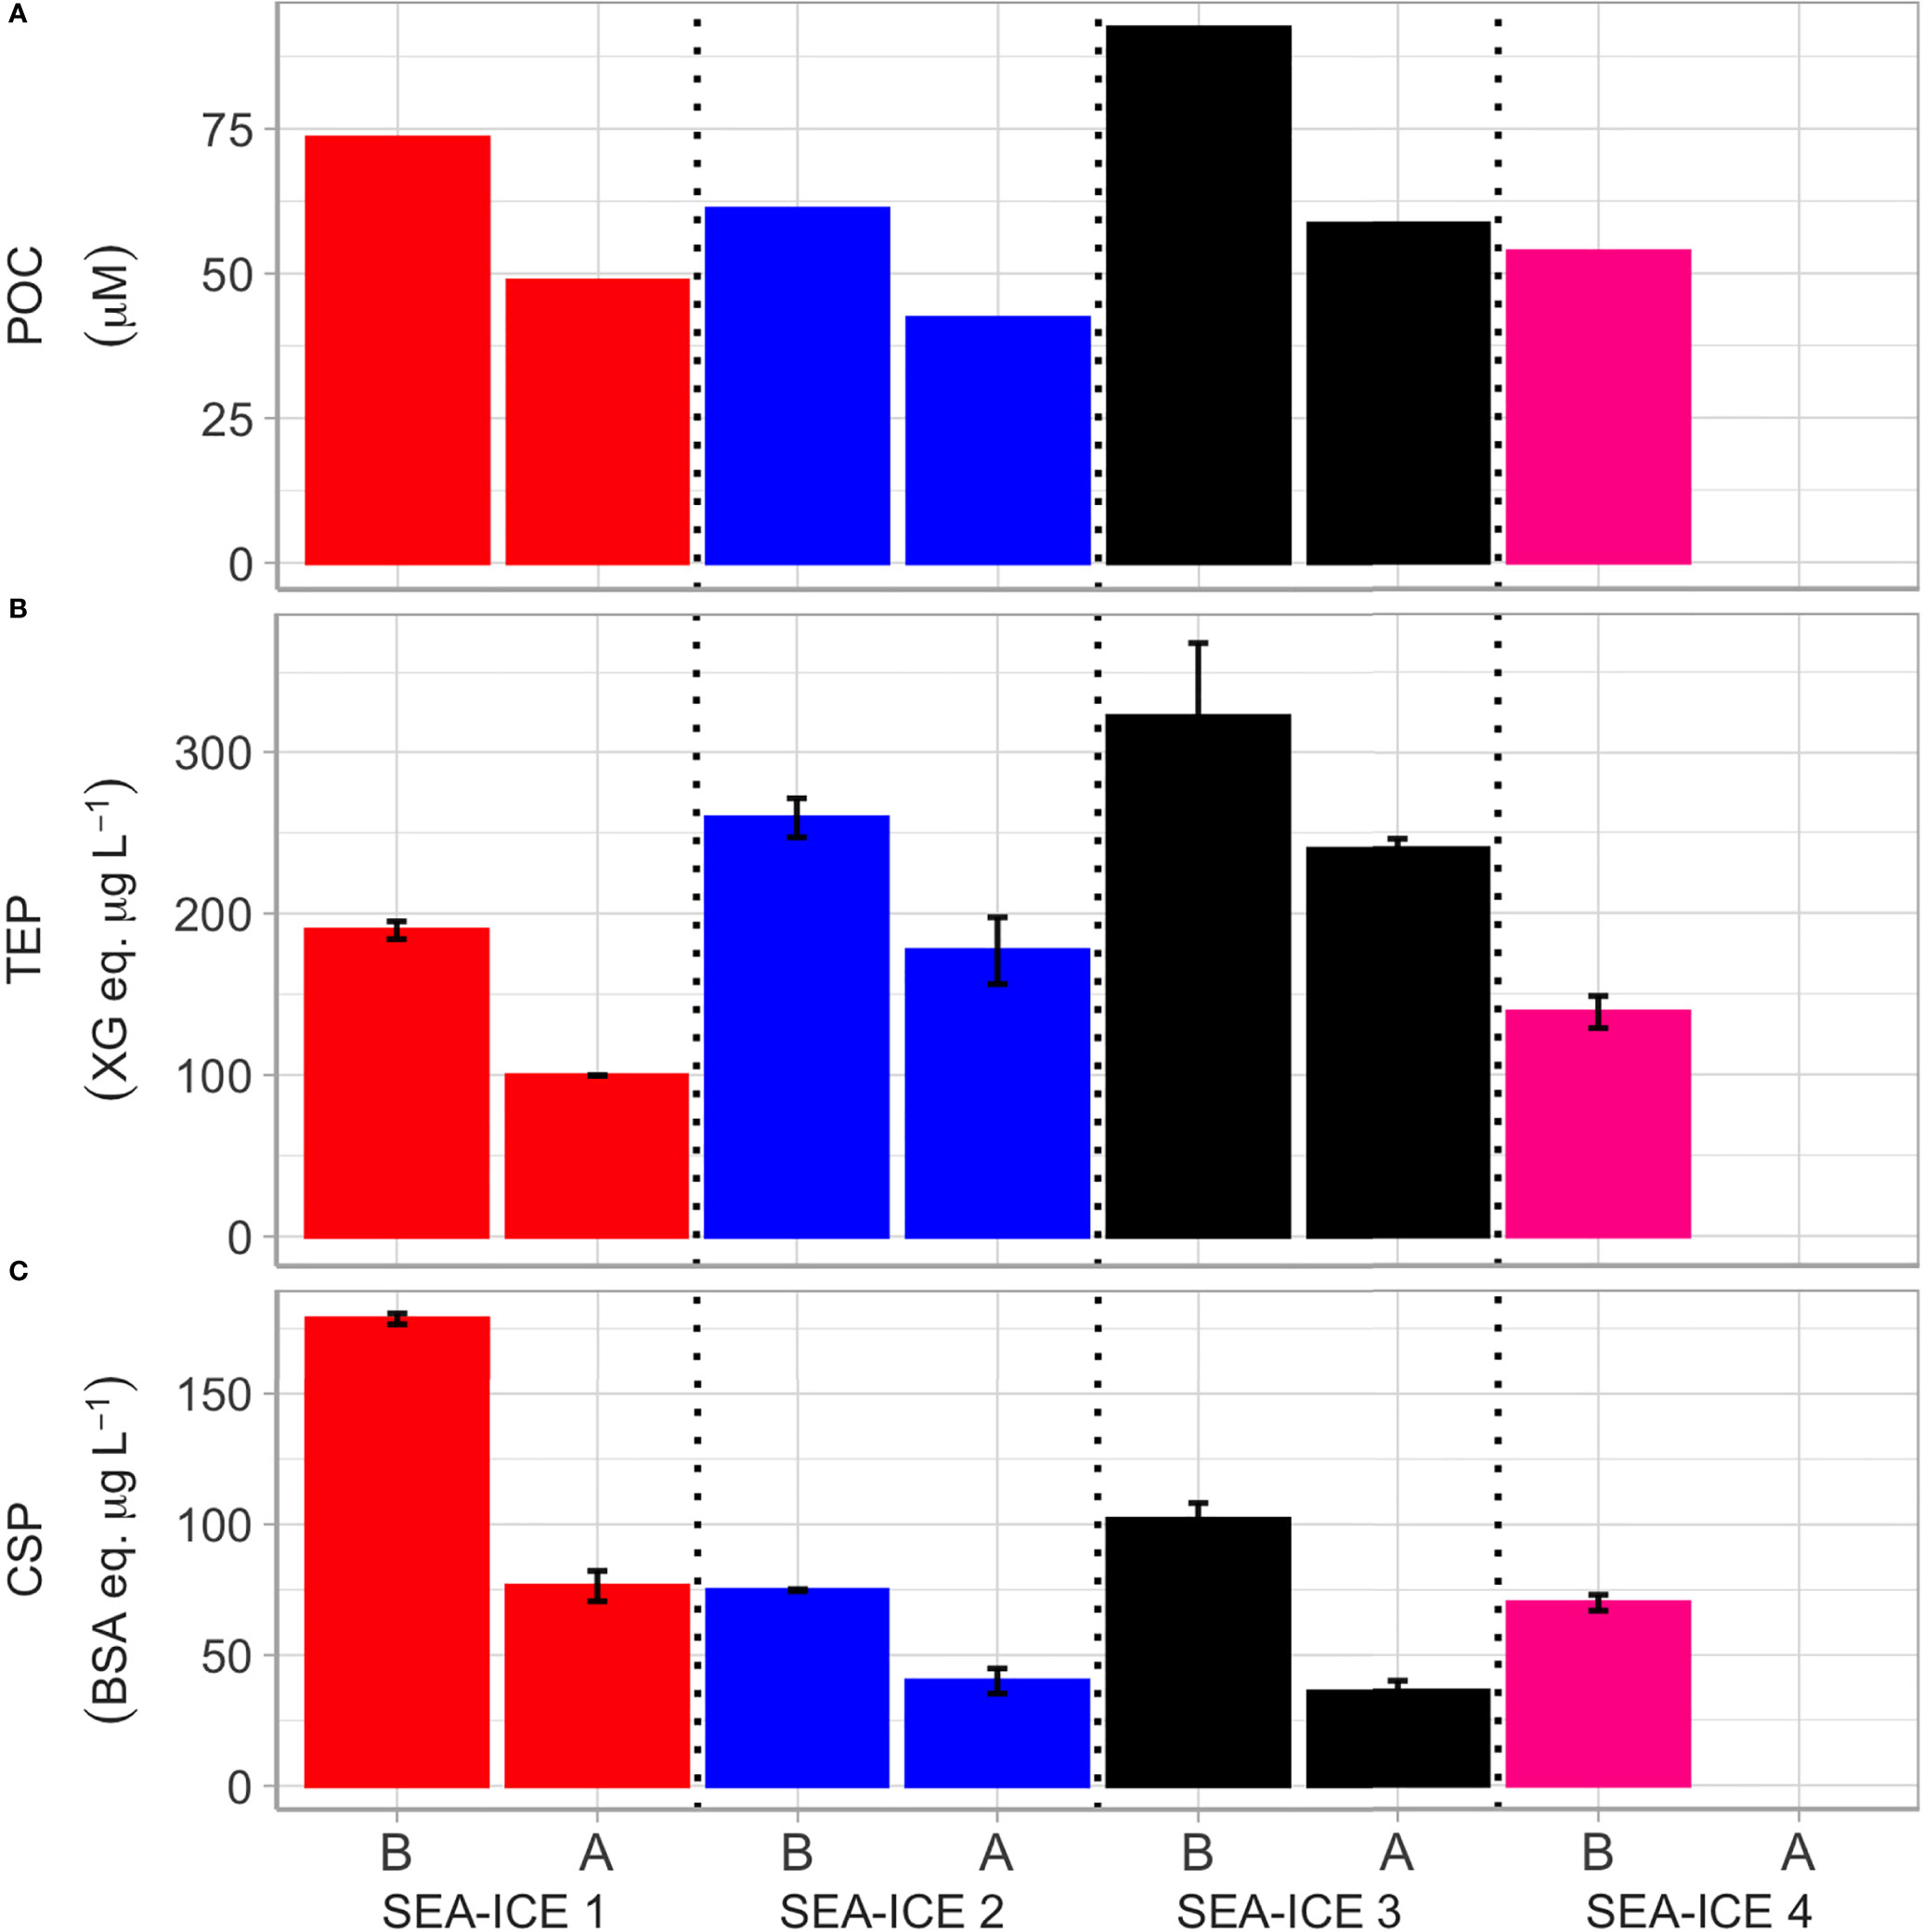
Figure 4 Changes of biochemical parameters measured in the four sea ice experiments before and after the aerosol generation period. For each experiment the first bar corresponds to the values estimated before (“B”) bubbling; the second bar shows the values after (“A”) bubbling. From top to bottom, the graphs show (A) POC concentrations; (B) TEP concentrations; (C) CSP concentrations.
3.2.2 Dissolved Organic Carbon
Dissolved Organic Carbon (DOC) concentrations for the four experiments are seen in Figure 5. Similarly to the POC concentrations, SI3 shows the highest values among the four samples. Likewise, a general decrease in DOC was found when analyzing the Before (B) and After (A) experiments. The fluorescent dissolved organic matter (FDOM) composition was analysed using a PARAFAC model. Five components (three protein-like components - P1, P2, P3 - and two humic-like components - H1, H2) were identified (Figures S2, S3) and their main spectral features can be found in Table S4. Briefly, P1 is consistent broadly with FDOM peak T, P2 broadly to FDOM peak B (Coble, 2007), and P3 is broadly consistent with protein components previously identified in sea ice samples (Retelletti Brogi et al., 2018). The two humic-like components identified are a combination of the fluorescent region A and each of them feature a secondary excitation maximum: H1 (Ex/Em: 325/410 nm) is broadly consistent with the marine humic peak M while the second excitation maximum of H2 (Ex/Em: 370/490 nm) is similar to the classic humic peak C (Coble, 2007).
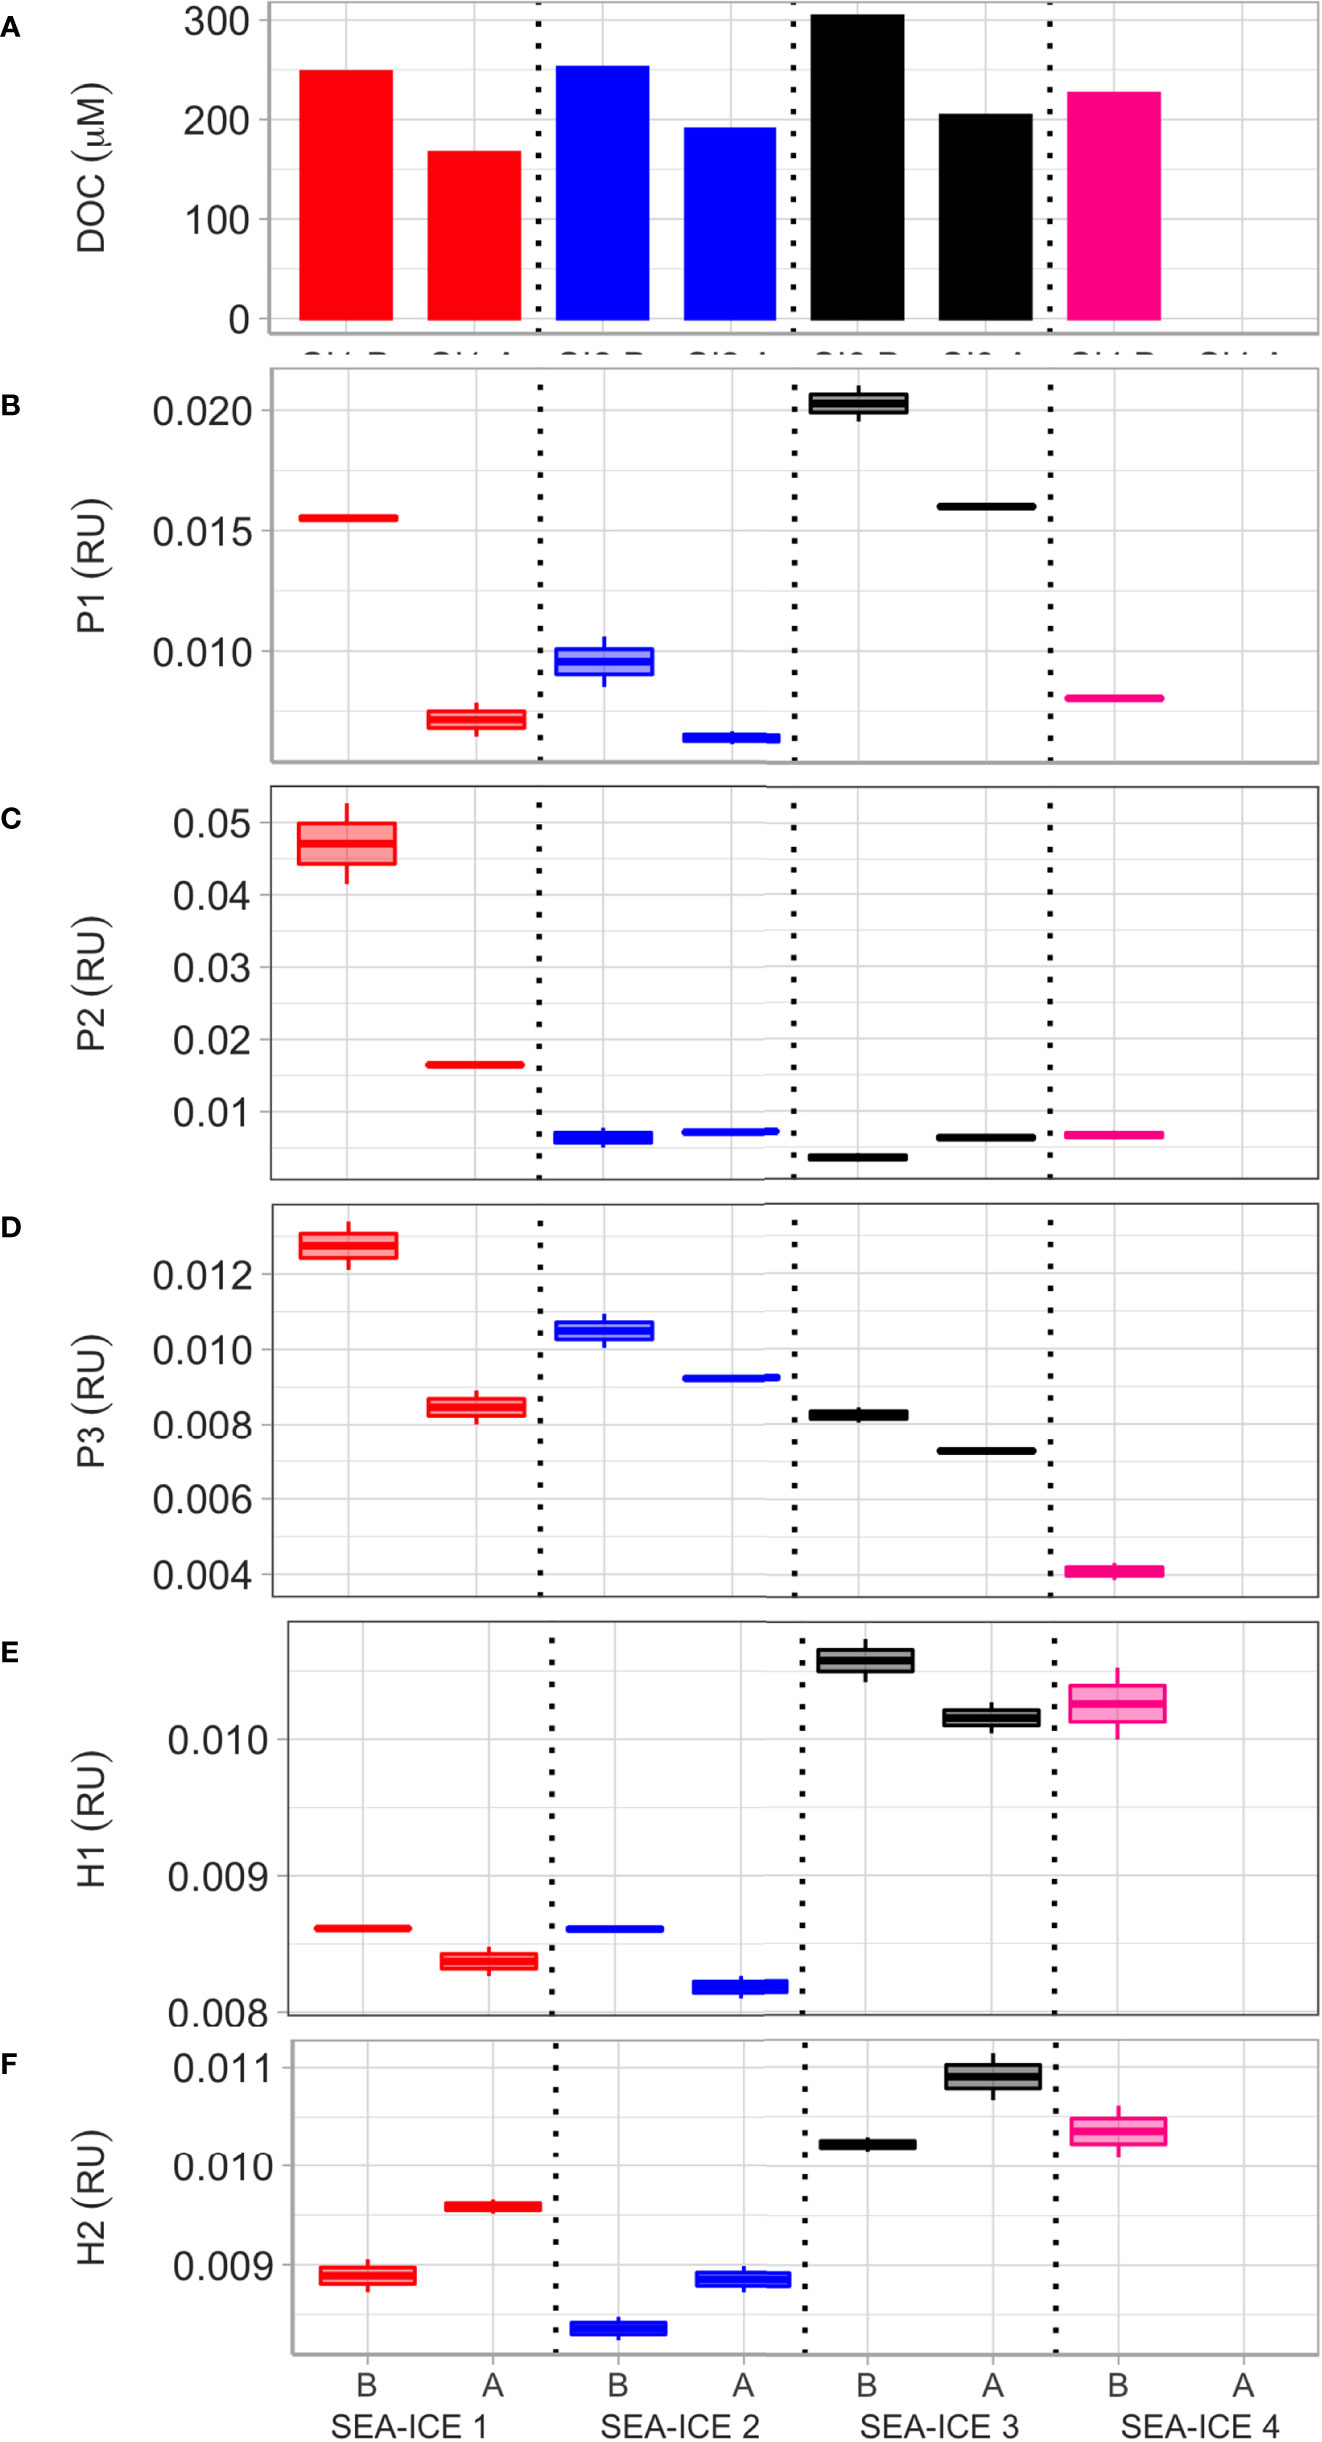
Figure 5 Dissolved organic matter properties in the four experiments before (“B”) and after (“A”) bubbling. From top to bottom, panels show dissolved organic carbon (DOC) concentration (A); fluorescence of PARAFAC protein-like components P1 (B), P2 (C), P3 (D), and of humic-like components H1 (E) and H2 (F).
When comparing the initial DOM fluorescent characteristics, Figure 5 clearly shows two main groups. Figures 5E, F shows that the highest humic fluorescence values of all experiments for both H1 and H2 are seen for SI3 and SI4. By striking contrast, SI1 and SI2 show the highest protein fluorescence for components P2 and P3 (Figures 5C, D). No clear pattern can be derived from the P1 intensities (Figure 5B) with the four experiments showing different trends.
Further important results can be obtained when comparing the FDOM composition of samples before (B) and after (A) bubbling. In all the three complete experiments, protein-like and marine humic components (P1-3, H1), usually associated with phytoplankton DOM exudates and considered to be labile to microbial degradation, decrease during the aerosol production period in parallel to bulk DOC concentrations (Figures 5A–E; DOM panels DOC, P1, P2, P3, H1). By contrast, H2 fluorescence, associated to by-products of prokaryotic activities, show a marked increase (Figure 5F, DOM panel H2). These changes in fluorescence are consistent with the expected degradation of labile, phytoplankton-derived, DOM and the concurrent accumulation of by-products originated through microbial processing of DOM (Yamashita and Tanoue, 2004; Nieto-Cid et al., 2006; Yamashita and Tanoue, 2008; Romera-Castillo et al., 2011).
3.2.3 Particulate and Dissolved Sugars
During the comprehensive air−sea transfer study of marine carbohydrates in the Western Antarctic Peninsula conducted during the PI-ICE field study, Zeppenfeld et al. (2021) could show strong indications for the transport of carbohydrates from the ocean to the atmosphere by wind-driven processes. Figure 6 shows results from concentrations of combined carbohydrates (CCHO) in both the particulate (PCCHO) and dissolved (DCCHO) phases as well as dissolved free carbohydrates (DFCHO) for the four SSA melted sea ice experiments.
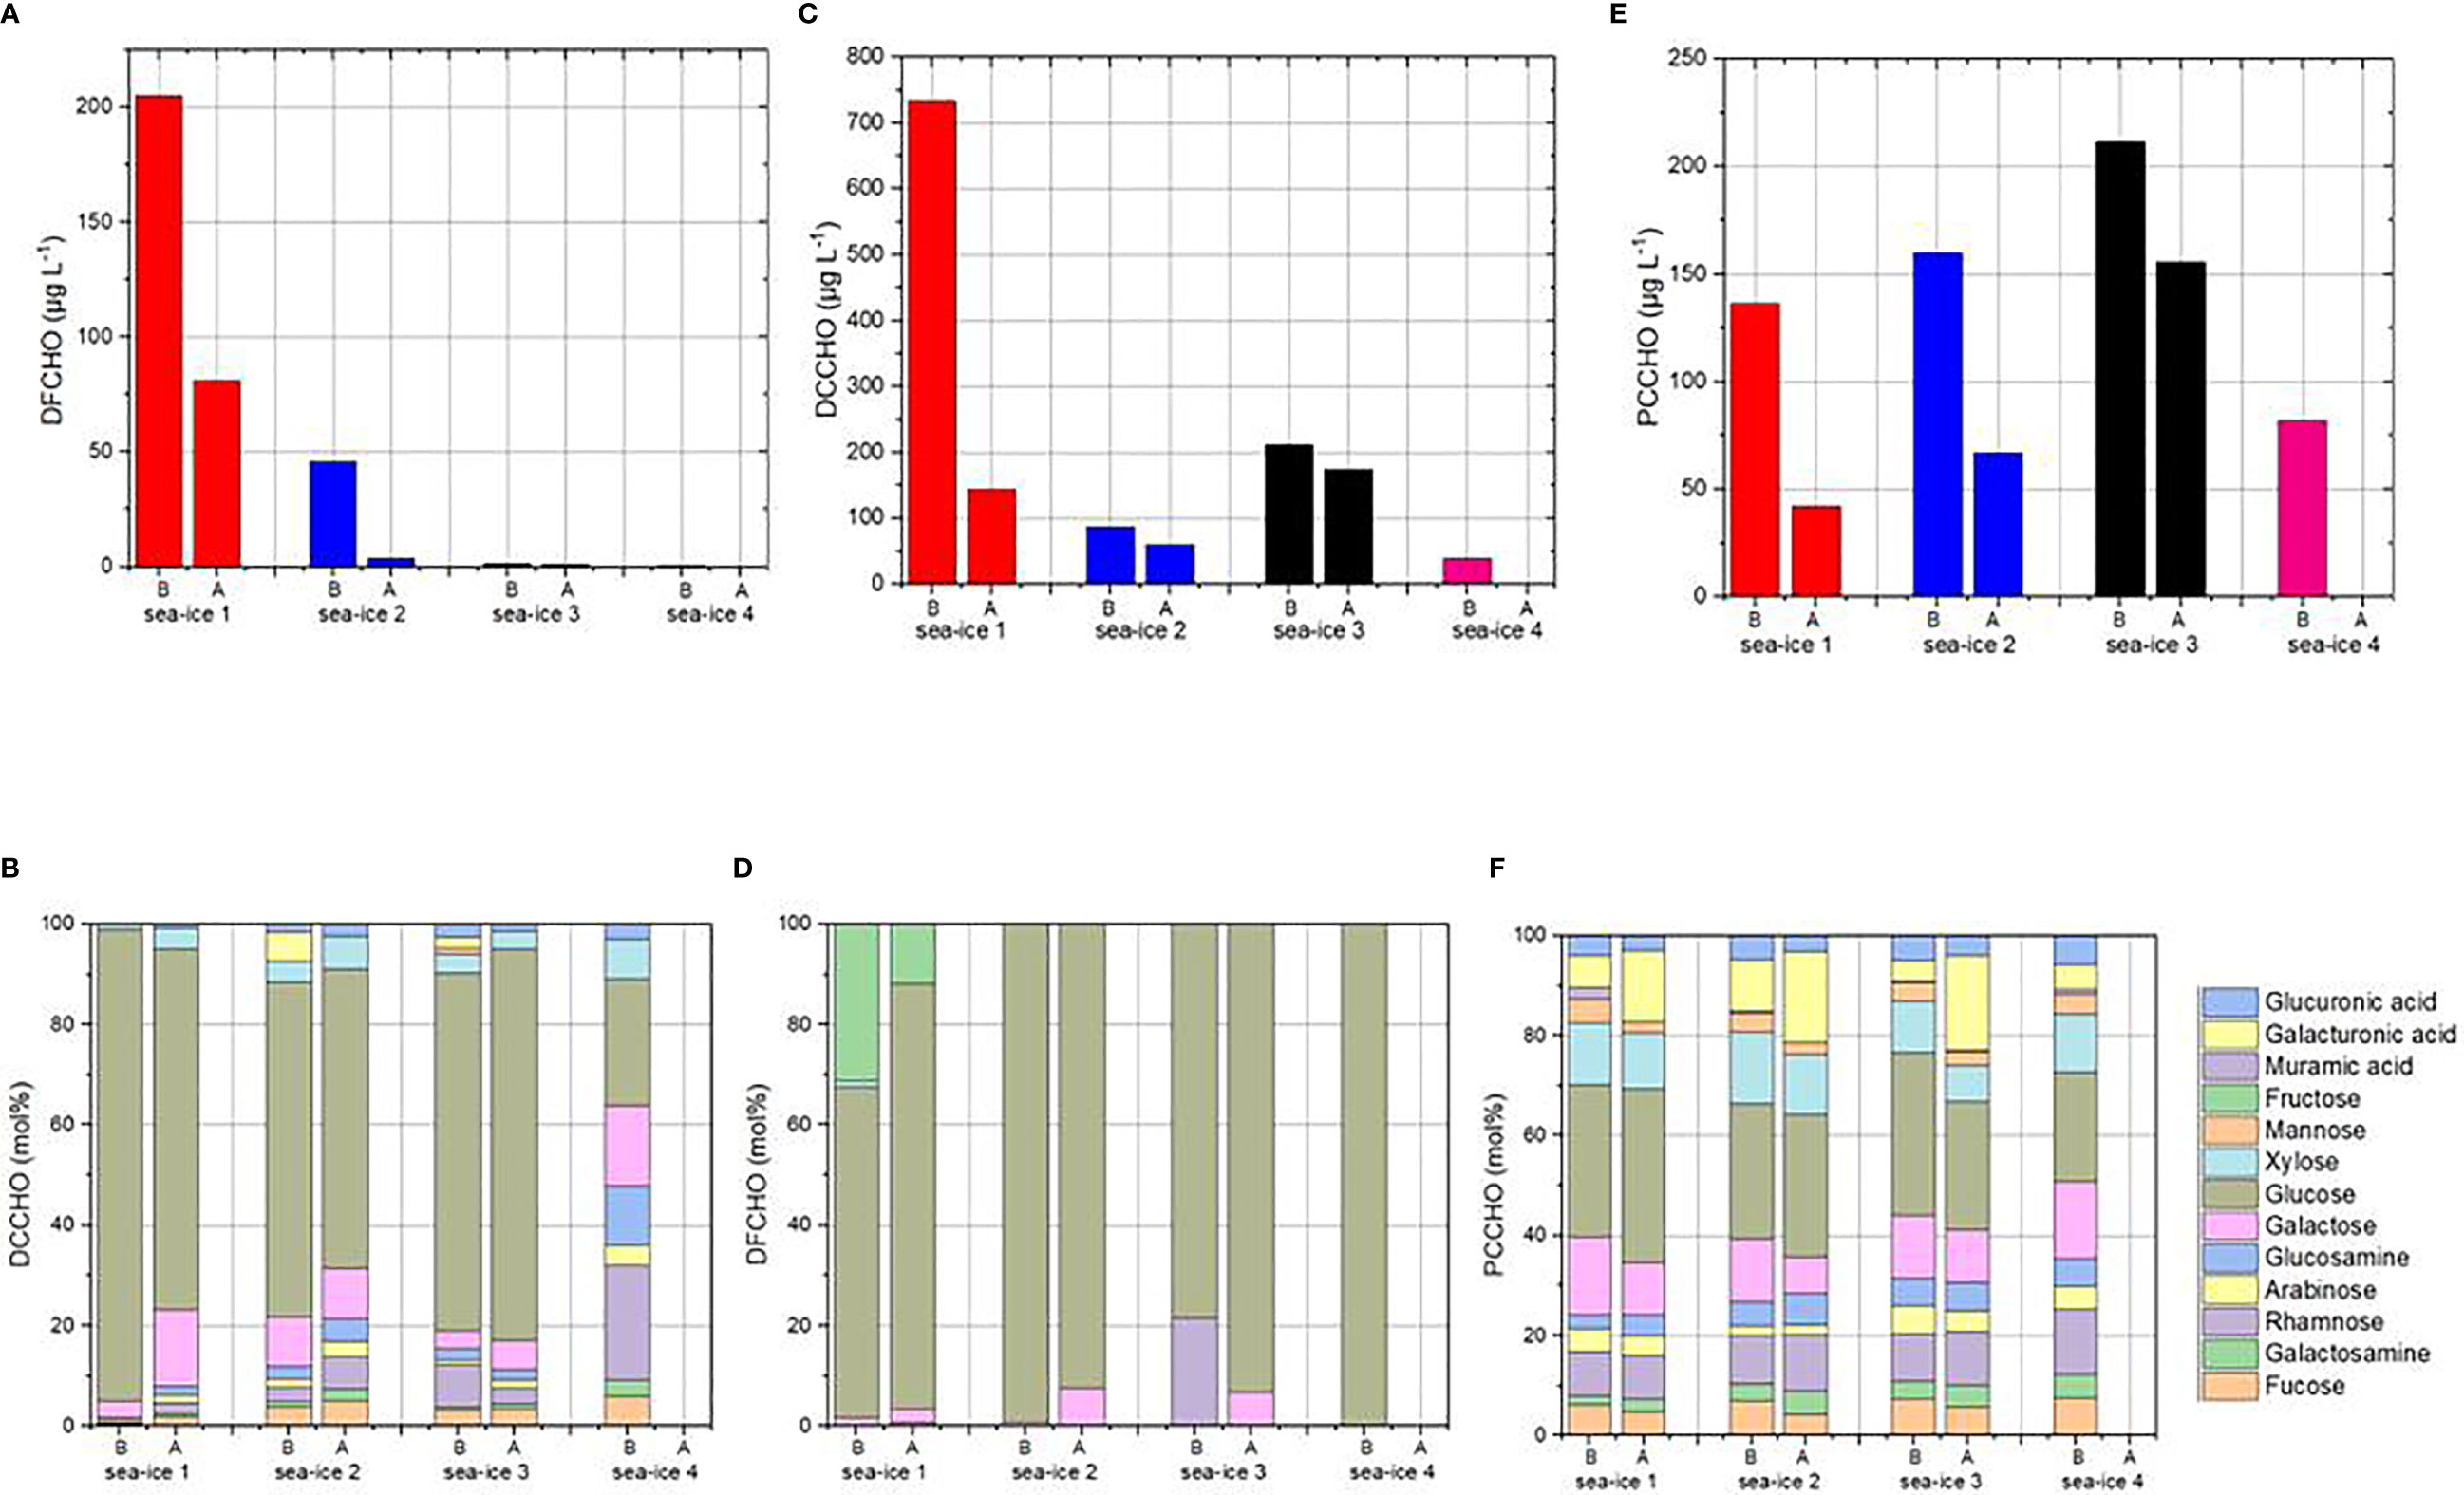
Figure 6 DFCHO (6 A, B), DCCHO (6 C, D) and PCCHO (6 E, F) for the four aerosol chamber experiments before and after bubbling.
The initial conditions of the four sea-ice setups varied strongly before bubbling (B). While sea-ice 1 and 2 contained high amounts of free available monosaccharides (DFCHO = 205 and 46 µg L-1) dominated by free glucose, sea-ice 3 and 4 showed very low DFCHO with 1.6 and 0.8 µg L-1, respectively. DFCHO are either considered products of the exoenzymatic degradation of combined carbohydrates or released directly after the disruption of phytoplankton cells (Pakulski and Benner, 1994; Skoog et al., 1999), however they are usually consumed quickly by heterotrophic bacteria (Mopper et al., 1980; Kirchman et al., 2001; Kawasaki and Benner, 2006). Furthermore, high concentrations of dissolved carbohydrates with low molecular weight, which also includes short oligo-and polysaccharides, have been found to indicate algal assemblages with a high photosynthetic activity in Arctic and Antarctic sea ice (Underwood et al., 2010; Aslam et al., 2016; Kennedy et al., 2021) and might assume, together with high-molecular exopolymeric substances, cryoprotective functions. Sea ice experiments 1 and 2 were characterized by the highest number of diatoms (Figure 1), but very few bacterial cells (Figure 2), in comparison to sea ice 3 and 4, which might explain these large differences in DFCHO.
Very high DCCHO concentrations were found for the initial conditions of SI1 (730 µg L-1), while SI2-4 showed much lower concentrations. All SI experiments, but especially SI1-3 (60-94 mol%), were strongly dominated by glucose contained within dissolved polysaccharides. This strong prevalence of glucose within the DCCHO in sea ice indicates the high availability of algal energy storage molecules. Chrysolaminarin, a polysaccharide based on glucose units, is known as the major storage carbohydrate of many sea-ice diatoms (Aslam et al., 2012).
At initial conditions, PCCHO (82-212 µg L-1) did not vary as strongly among the four sea ice samples as it occurred with DFCHO and DCCHO. Furthermore, the relative monosaccharide composition was quite similar among the four samples with glucose being the most abundant monosaccharide, followed by galactose, xylose and rhamnose. PCCHO strongly correlated with TEP (R2 = 0.9) over the seven data points. Furthermore, TEP correlated well with individual monosaccharides within PCCHO, such as fucose (R2 = 0.84), rhamnose (R2 = 0.87), glucosamine (R2 = 0.90), glucose (R2 = 0.87) and glucuronic acid (R2 = 0.85), which are known to be important constituents of exopolysaccharides and TEP (Passow, 2002; Casillo et al., 2018; Mühlenbruch et al., 2018). This indicates that the particulate fraction of carbohydrates was dominated by microbial exudates over structural polysaccharides such as cell walls. Exopolymers from acid mucopolysaccharides are known to be released by sea-ice algae to protect the cells from freezing damage and extreme gradients in salinity within the brine channels of sea ice (Krembs et al., 2002; Krembs and Deming, 2008).
All ‘before’ and ‘after’ sea ice experiments (SI1, SI2, SI3) have in common that bubbling led to a significant reduction of DFCHO, DCCHO and PCCHO at the surface water of the tank, where sampling occurred. This can have several possible reasons. First, a certain amount of carbohydrates was aerosolized and entered the head space of the tank. However, since the loss of carbohydrates did not necessarily correspond with the amount of emitted aerosol particles, there might have happened other biogeochemical processes within the tank as well. This includes agglomeration and sedimentation processes as well as algal and bacterial metabolism. Most likely the high reduction of DCCHO and DFCHO, which were both dominated by free and combined glucose, was due to a microbial consumption during the bubbling experiment. Small changes of the relative monosaccharide compositions could be observed, such as the relative increase of galacturonic acid within PCCHO, in SI1-3. This might be due to the release of stress-induced mucopolysaccharides. However, overall the changes were rather small and due to the low number of experiments not very significant.
3.2.4 1H-NMR Characterization of POC
Further chemical characterization of POC components is provided by 1H-NMR analysis for only two (SI1, SI2) of the four experiments, aiming to provide information about the composition of the buoyant particles. H-NMR spectra comparison between the POC samples obtained from the melted sea ice analyzed before and after the bubbling is shown in Figure S6. The POC composition is dominated in all the samples by peptides (traced by amino acids such as alanine, threonine, valine, aspartate, glutamate, isoleucine, and leucine) and to sugars or polyols (with signals in the H-C-O region between 3.3 and 4.2 ppm of chemical shift) including glycerol. This composition is in overall agreement with previous POC from surface ocean water and from melted sea-ice samples investigated in studies carried out in the North Atlantic and in the Weddell Sea (Decesari et al., 2020). In contrast with the previous studies, we could not detect specific signals of anomeric hydrogen atoms characteristics of most common monosaccharides (in the range 5.2 to 5.5 ppm of chemical shift). This can be due to the occurrence of sugars as large polymers (polysaccharides) and to significant contributions from polyols as well as from alpha-hydrogen atoms of aminoacids to the H-C-O spectral region. Other resonances of organic markers common to POC samples are acetic acid, and N-osmolytes (betaine and choline).
Dimethylamine (DMA) is the only low-molecular-weight alkyl amines signal detectable (at 2.72 ppm) in the sea-ice samples before-bubbling only in very small concentrations. The low-molecular-weight alkyl amines is a category of biogenic compounds commonly found in POC samples from previous studies. Interestingly DMA increases and also the Tri-MethylAmine (TMA) appears in the SI POC samples analyzed after the bubbling procedure (SI 1AB and 2AB, reported in Figure S6). The after-bubbling samples show also other small differences, such as the disappearance of Choline (in SI1AB), the reduction of glycerol, and changes in prevalent amino acids composition (especially the signals tentatively attributed to alpha-aminoacids within the H-C-O spectral region). These slight but possibly important changes in composition are confirmed by the Pearson correlation coefficients (R) of the spectra before- vs after-bubbling (Table S5): in fact, if the POC spectra of SI samples before the bubbling correlate each other with R=0.77, their correlation with corresponding spectra after-bubbling deteriorates for both of them (R=0.58). The compositional changes of POC before and after the bubbling are further highlighted by the H-NMR functional groups distribution, showed in Figure S7: the most clear change occurring after the bubbling is the increasing relative contribution of H-C-O functional group, common to both SI1 and SI2 experiments. But it is important to note that this relative increase results to be attributable to -NCHRCO- groups of alpha-amino acids rather than H-C-O groups of sugars and polyols: looking at singular detectable polyols like glycerol in fact, they result to be reduced after bubbling, in general agreement with carbohydrates measurements, both of particulate (PCCHO) and/or dissolved (DCCHO) phases.
3.3 Primary Aerosol Chamber and Atmospheric Aerosol Measurements
3.3.1 Aerosol Size Distributions
The size resolved aerosol concentrations of the generated aerosols in the four experiments conducted with the four different melted sea ice waters (SI1-4) were measured at 15 ± 10% relative humidity and are reported in Figure 7 (dN/dlogdp, where dp is particle mobility diameter). The average mode of a probability density function fitted to the particle number distribution for SI3, SI4 and sea water is seen at about 160nm for SSA generated in this study, consistent with previous studies (Prather et al., 2013; Sellegri et al., 2021;), with the former of those applying breaking waves.
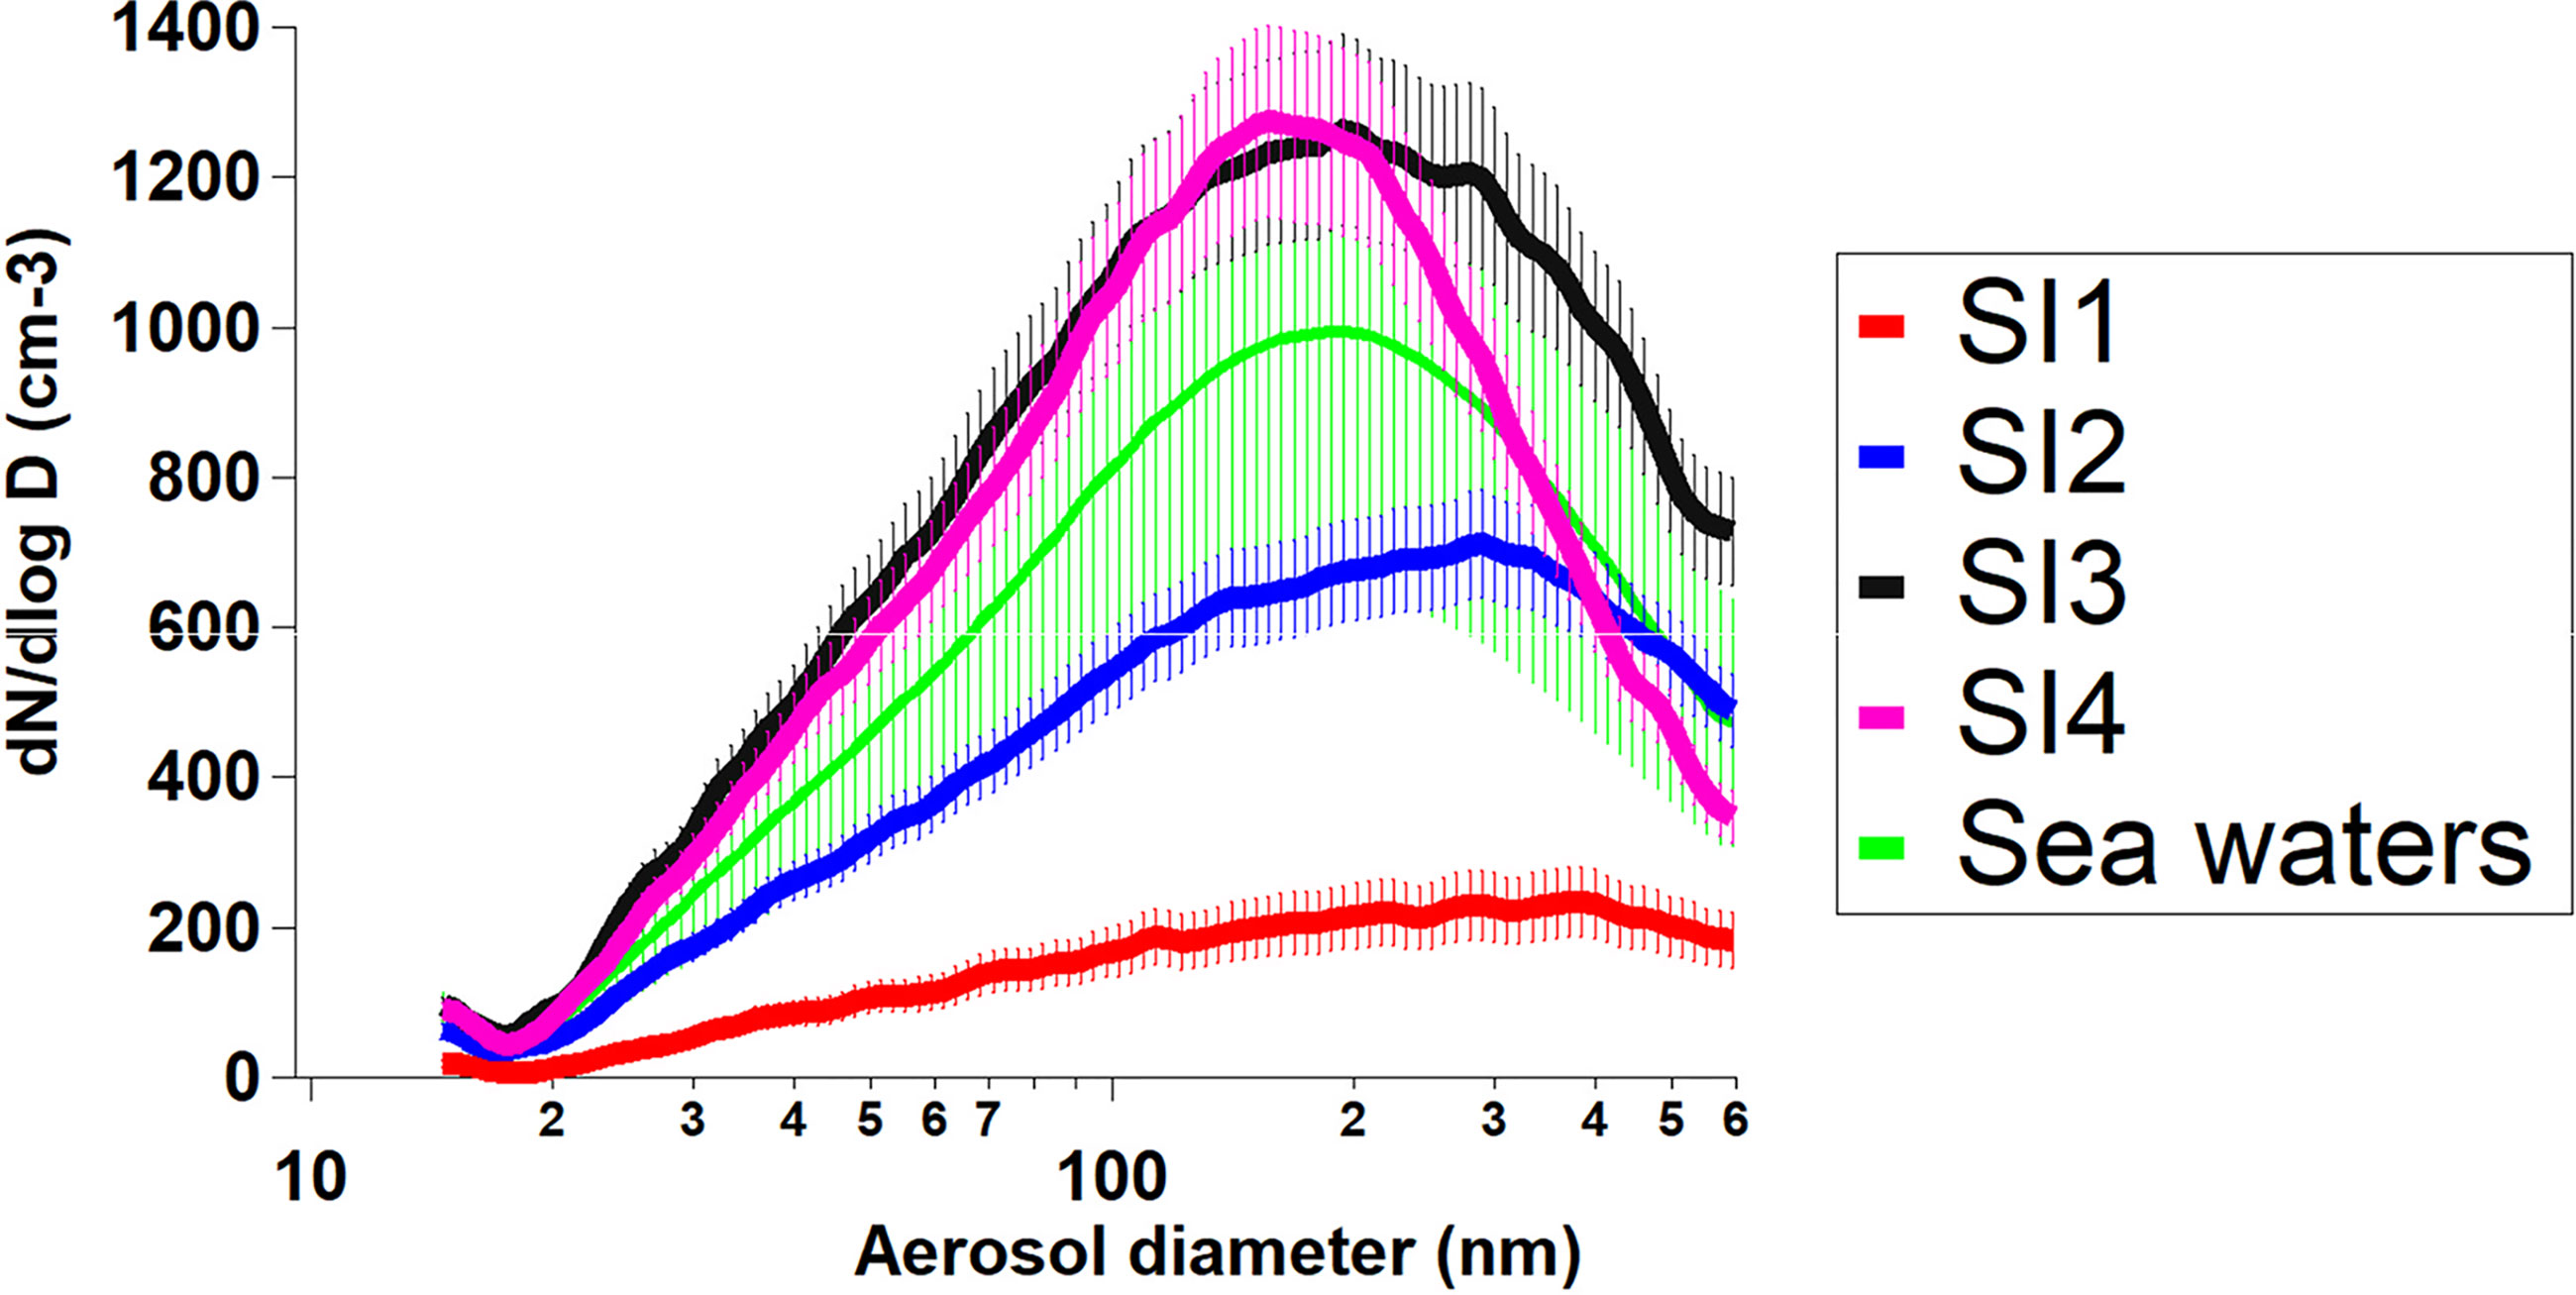
Figure 7 Aerosol size-resolved concentrations (cm-3) of the four sea ice melted samples during the aerosol generation chamber experiments. Differences between beginning and end were small and included in the uncertainties. Aerosol size distributions in green “sea waters” are aerosol primary chamber experiments from experiments used in the PI-ICE cruise and obtained from open ocean waters and coastal regions (these campaign data still need to be analyzed and results will be published elsewhere).
All distributions show only a small contribution from particles in the smaller Aitken mode, i.e., in the sub–100-nm size range. When compared among each other, the four SI experiments show large variations in SSA production. SI1 and SI2 show a broad low size distribution with a broad peak centred at about 470 and 320 nm, respectively. By contrast, SI3 and SI4 show much higher SSA number concentrations and, as mentioned above, a different maximum peak diameter of about 160 nm. SI3 shows the highest particle number concentrations, whereas SI1, SI2 and SI4 generate only 17%, 55% and 87% (respectively) of the total particles produced by SI3 in the examined size range.
The particle size distribution has a major impact on the activation of the aerosol into cloud droplets, i.e., on how may CCN are provided (Li et al., 2011). At 0.1% supersaturation (S), only the largest particles with sizes of 300–500 nm are most likely to activate to cloud droplets. Particles of 100–300 nm are likely to be additionally activated only at 0.2% (S), while particles of 60–80 nm likely need even higher supersaturations for activation (≥0.4%). Comparison between the obtained size-resolved particles number concentrations and ocean-atmosphere variables are reported later in section 3.4.
3.3.2 INP CONCENTRATIONS
For the determination of INP (ice nucleating particle) number concentrations (NINP), results are shown in Figure S5. Shown are data from both - LINA (Leipzig Ice Nucleation Array) and INDA (Ice Nucleation Droplet Array), both described well in Gong et al. (2020) and Hartmann et al. (2021). Due to smaller droplet sizes LINA yielded data for the lower temperature range below ~ -20°C, while INDA contributed data mainly above that temperature. For samples SI1, SI2 and SI3 shown in panels A, B and C, respectively, data exist for both samples before and after bubbling. It can be seen that bubbling diminished the INP concentrations in the samples slightly, however, often within measurement uncertainty. It is unlikely that ice active sites on INP are destroyed during bubbling. Atmospheric INP are mostly either mineral dust particles which possess crystallographic favourable sites for ice formation, or they originate from microbiota and are made up of macromolecules (often proteins or polysaccharides), which is all summarized for example in Kanji et al. (2017). As a destruction of INP due to bubbling very likely can be excluded, the slight decrease due to bubbling may indicate that INP are more efficiently aerosolized and hence are decreasing in concentration due to the bubbling. This, however, cannot be further corroborated with the samples collected during PI-ICE, but may be the focus of future studies. Panel D shows data from all four samples for the condition before bubbling, and it can be seen that the INP concentrations in the different samples are similar. Therefore, differences between samples in concentrations of different marine microbiota examined in this study did not influence the INP concentrations. It should also be mentioned that INP collected in ocean water may, to a large extent, be below 200 nm in diameter (Wilson et al., 2015). Also, derived concentrations here are related to the total sample volume of sea water and melted sea ice together. However, if different sea ice samples would have had different INP concentrations, that still would have shown up clearly. Also, it should be mentioned that overall INP concentrations determined during PI-ICE for both ocean and atmospheric samples were low (Zeppenfeld et al., 2021). The low atmospheric INP concentrations are furthermore in agreement with data from the Southern Ocean (McCluskey et al., 2018). Also both, atmospheric INP concentrations and INP concentrations in the ocean are lower than values typically observed in the Artic (Zeppenfeld et al., 2021, Figure SI5 therein).
4 Discussion: Linking Ocean-Atmosphere Variables
After looking at the results of the presented experiments (Figures 1–7), we merged the four chamber experiments in two groups: SI1-SI2 and SI3-SI4 according, respectively, to the two lowest and the two highest SSA production samples (as shown in the aerosol size distributions presented in Figure 7). Variables for the two groups before and after bubbling are presented in Table S6. In particular, we find that SI3-SI4 exhibited the highest viral abundances. The high viral abundance may determine more bacterial and/or eukaryote cell mortality and thus cause the presence of more organic material available for aerosol formation. In other words, the interaction of sea ice viruses with prokaryote and protists could liberate organic material to the water column, promoting the growth of other prokaryotes (viral loop) and stimulating their grazing by higher trophic levels (microbial loop and microbial food webs) (Boras et al., 2010; Maranger et al., 2015). Our results are in line with the ones of Wang et al. (2015) suggesting that SSA organic production is set by a delicate balance between phytoplankton primary production and microbial degradation processes.
Further support comes also from the FDOM results presented. They strongly suggest that humic-like materials associated to microbial degradation processes are more important than protein-like materials when considering the relationship between water biogeochemical properties and associated SSA production. This is in line with the selective transfer of humic components from sea water to sea spray aerosols. For example, Miyazaki et al. (2018) showed a consistent enrichment in humic fluorescence with respect to protein fluorescence when comparing SSAs to their respective source water (123- 410%). Santander et al. (2021) also observed that during the degradation of a simulated phytoplankton bloom, increases in protein fluorescence of bulk seawater were not reflected in an increment of protein-like fluorescence in SSA aerosols, whereas humic fluorescence presented coupled increases in both bulk seawater and SSAs. The changes in dissolved organic matter fluorescence observed during our experiments suggest that not only phytoplankton production but also microbial processing of freshly released DOM may affect aerosol production.
Although we are conscious that we only have four melted sea ice experiments, our results seem consistent. To our knowledge, the first SSA chamber experiments carried out with Antarctic melted sea ice were presented by Dall´Osto et al. (2017b). Our study continues in the same direction, demonstrating that the microbiota was influenced by the bubble bursting induced in the OLLA tank which in turn may influence the sea ice region by influencing, in turn, the production of sea spray aerosols.
5 Conclusion
The role of primary biogenic aerosols, the chemical composition and the biogenic origin of organic matter (OM) emitted from the ocean are areas of increasing atmospheric research because they influence marine atmospheric chemistry and cloud-relevant aerosols. The advantage of producing and measuring a stable nascent SSA size distribution in a controlled laboratory setting allowed us to compare them with a range of biological conditions considering the microorganisms existing inside the sea ice, such as viruses, prokaryotes -bacteria and archaea-, protists -i.e., nanoflagellates- and phytoplankton - also referred to as microalgae in a broader sense (Arrigo et al., 2009; Arrigo, 2014; Arrigo et al., 2015).
The SSA generation tank OLLA efficiently worked in different aspects. The pumping system used here to create plunging jets (peristaltic pump), permitted us to gently deal with the phytoplankton community without damaging cells. Figure 8 shows a schematic for the pathways of SSA and their possible relationships with biological processes in seawater. Large diatoms tend to sediment and get attached to the walls and the bottom of the aerosol chamber. By contrast, nano-flagellates, bacteria and viruses are not affected by deposition and may contribute more to the SSA production. Further studies are needed in order to fully eludicate the role of different sea ice ecosystems. Contrary to other aerosol chambers (O’Dowd et al., 2015; Stokes et al., 2016; Sellegri et al., 2021), our unique OLLA chamber was kept cooled down at a constant temperature of about 2°C, an important aspect that may have favoured microbial communities to adapt and accommodate. To our knowledge, this is the first ever study carried out testing the microbial communities before and after bubbling during a primary SSA aerosol chamber experiment. However, it is imperative to stress the limitation of our study. Laboratory experiments cannot mimic the real conditions of the ocean, nevertheless they can help to unveil underlying mechanisms involved in ocean-atmosphere process.
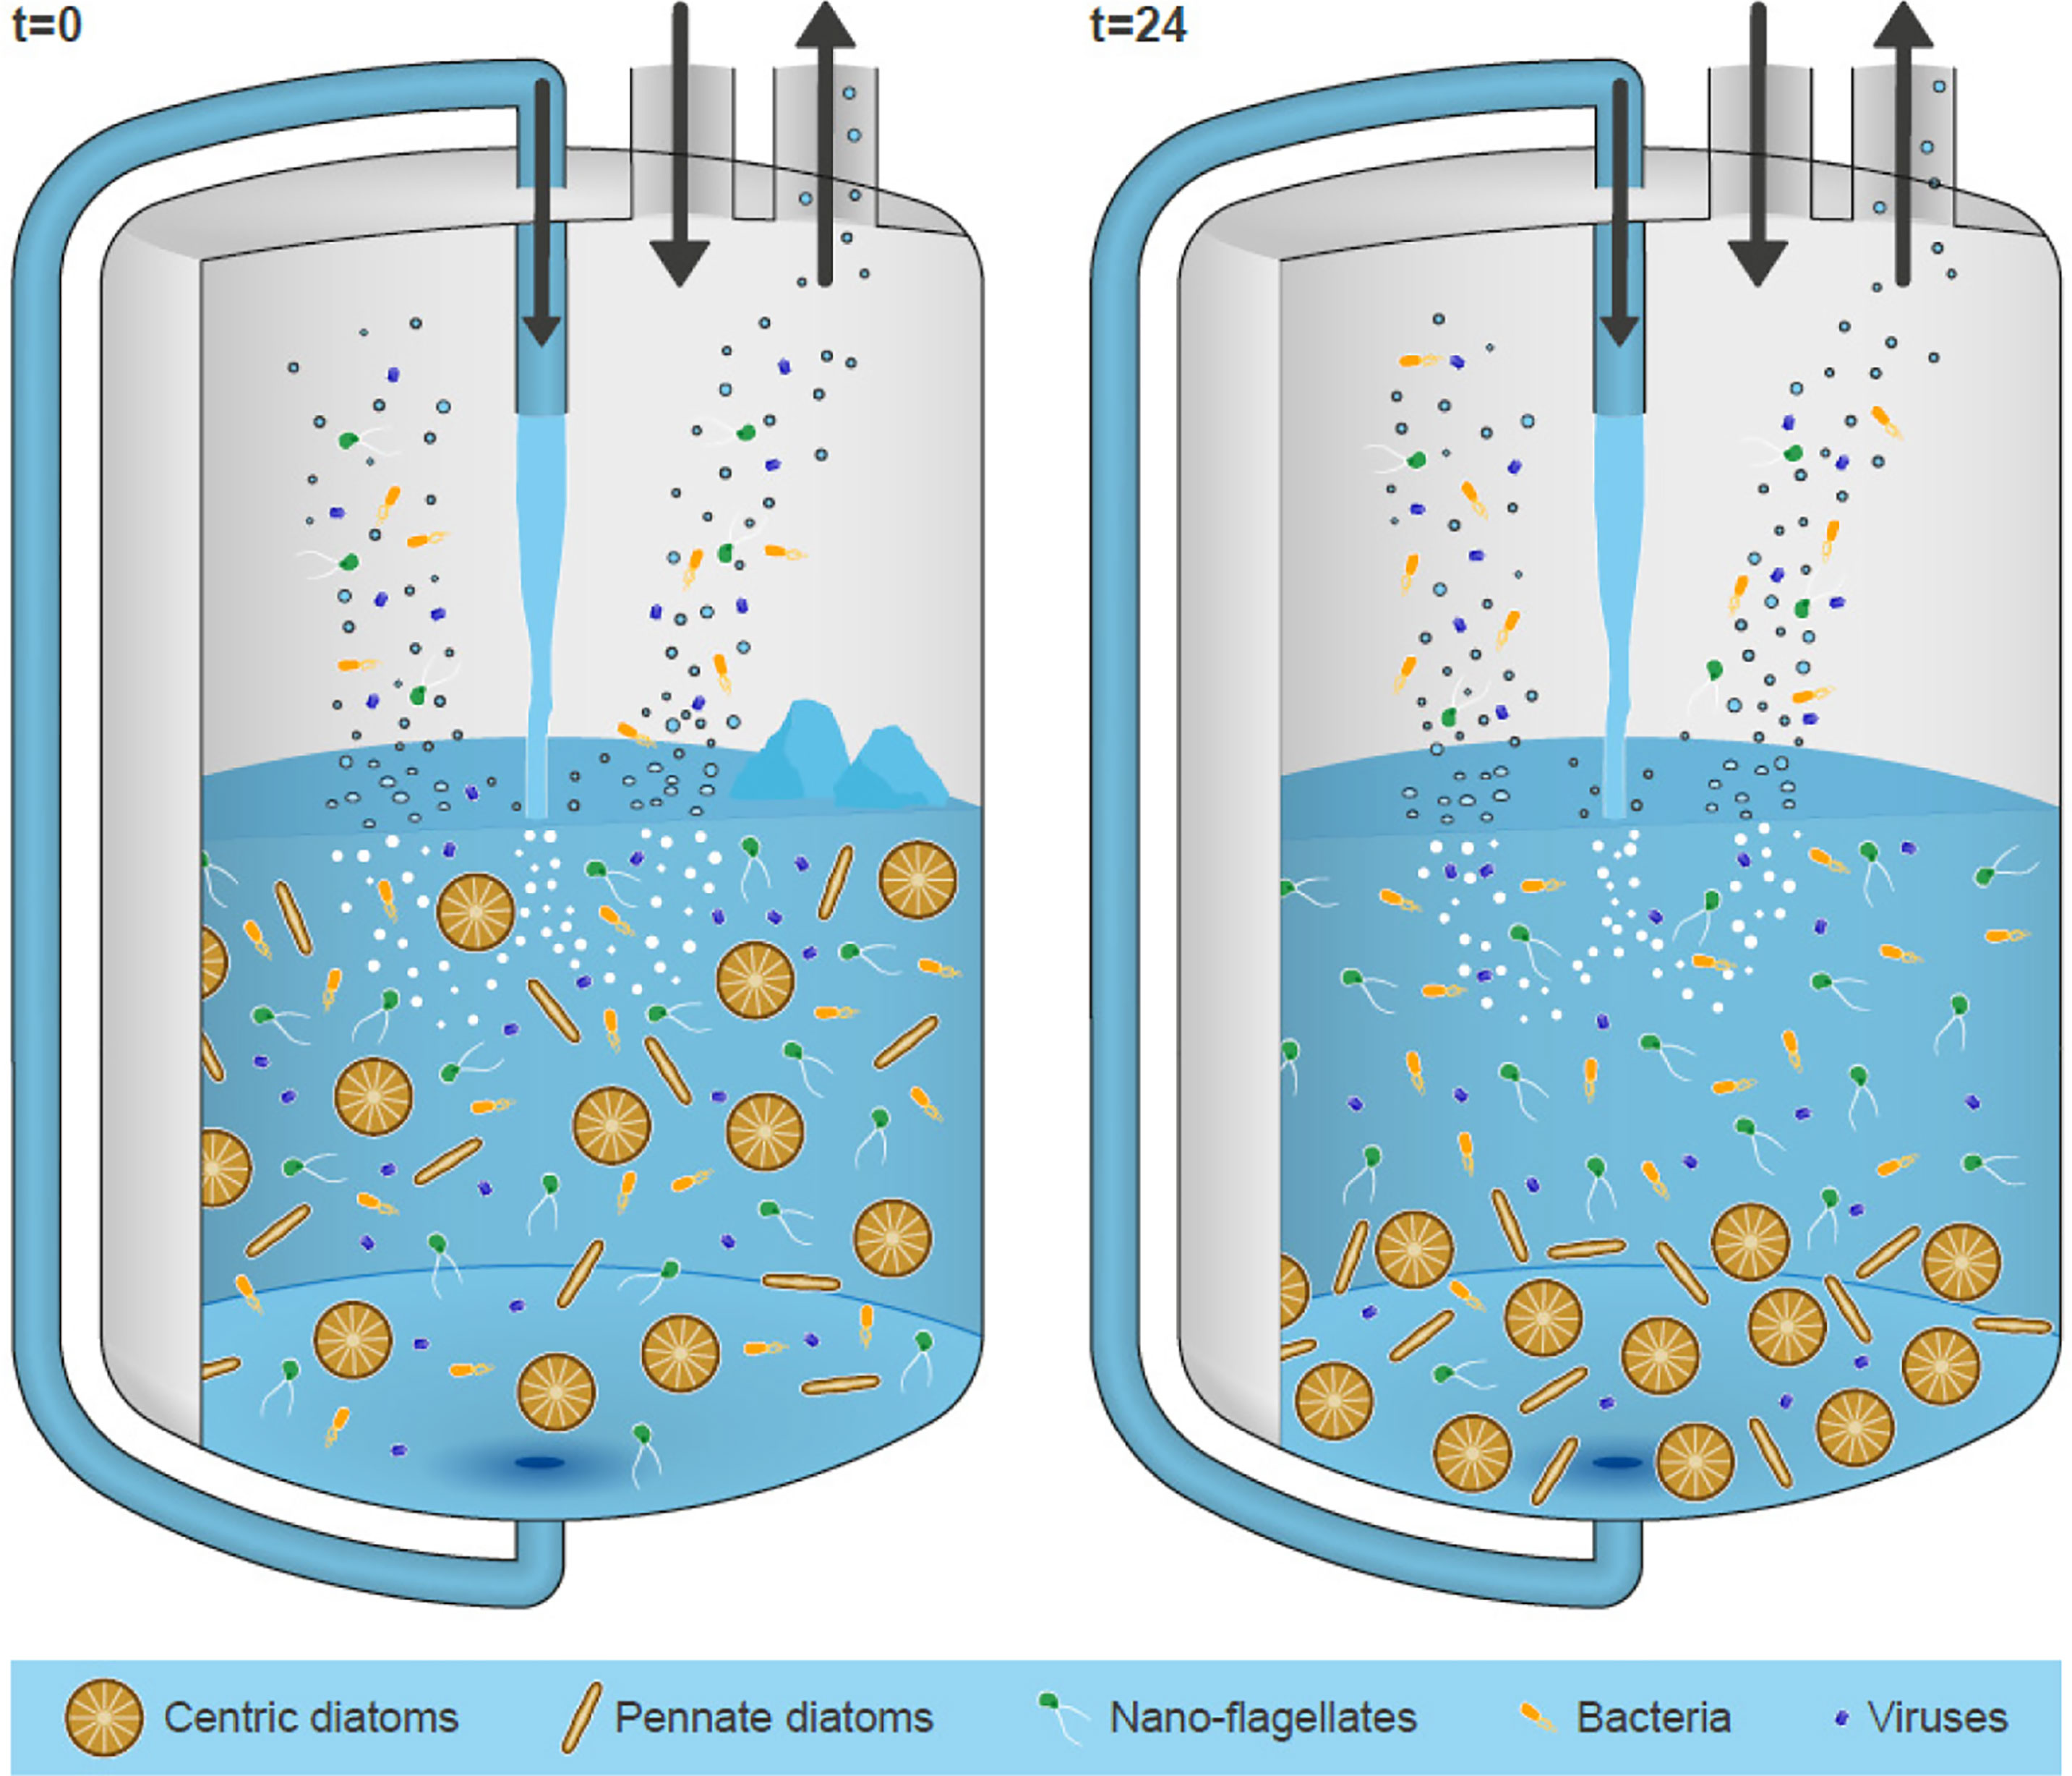
Figure 8 Schematic for the pathways of SSA and their possible relationships with biological processes in seawater. Please note schematic is illustrative, centric diatoms and pennate diatoms are larger (>20 µm, average 80-120 µm) than nano-flagellates (<20 µm) and bacteria (prokaryotes) (<1 µm) and virus (<0.5 µm).
Our results point to a higher microbial activity in SI3-4 relative to SI1-2, possibly consuming labile sugars and proteins and producing more re-worked humic-like materials. Our multidisciplinary approach for producing different marine polar biogeochemical signatures provide the foundation for further investigations. Future studies will aim at developing dual-chambers marine aerosols in order to run controlled experiments.
The Southern ocean has complex interconnected environmental systems – such as ocean circulation, sea ice, and land and snow cover – which are very sensitive to climate change. Despite its importance, the contribution of sympagic communities to polar marine biogeochemical cycles is still poorly understood, mainly because production and composition of microalgae range widely. Autotrophic flagellates characterize surface communities, interior communities consist of mixed microalgal populations and pennate diatoms dominate bottom communities. How polar marine ecosystems respond to rapid climate change in the AP (Arctic Peninsula) was reviewed by Schofield et al. (2010). Briefly, the AP hosts an extremely productive marine ecosystem supported by large phytoplankton blooms; over the past 30 years the magnitude of these blooms has decreased by 12%. There is evidence that the phytoplankton community composition has shifted from large to small cells and such changes are not geographically uniform. Changes in sea-ice conditions, as established and predicted for specific regions of the Antarctic sea-ice zone, may alter the vertical distribution of ice-algal communities in pack ice floes (Meiners et al., 2012; Ferreira et al., 2020), additional melting ice may modify the sea ice-ocean-atmosphere interactions. More interdisciplinary investigations studying the interaction of the ocean with the cryosphere and its atmosphere and their influencing polar marine ecosystems are needed.
Data Availability Statement
The raw data supporting the conclusions of this article will be made available by the authors, without undue reservation.
Author Contributions
MD’O conceived the study. MD’O, EB and DV obtained founding. MC-B provided biogeochemical measurements, MP and SZ provided sugars data. RH and DB provided the SMPS instrument. MR and MP provided H-NMR analysis. ME, TB, MS, and SN provided HPLC measurements. MP and SZ provided sugar data and provided samples for INP analysis to HW, who oversaw INP measurements and provided data. MD’O, DV, AS-G, MC-B, EB, and DB took the measurements and participated to the PI-ICE field study. All authors: experiment execution, and revision, correction, and approval of final manuscript.
Funding
The study was further supported by the Spanish Ministry of Economy through project PI-ICE (no. CTM 2017–89117-R) and the Ramon y Cajal fellowship (no. RYC-2012-11922). This work acknowledges the ‘Severo Ochoa Centre of Excellence’ accreditation (CEX2019-000928-S). The National Centre for Atmospheric Science (NCAS) Birmingham group is funded by the UK Natural Environment Research Council. DOC was analyzed by Mara Abad (ICM-CSIC) and the POC was analyzed at the IIM-CSIC (Vigo).
Conflict of Interest
The authors declare that the research was conducted in the absence of any commercial or financial relationships that could be construed as a potential conflict of interest.
Publisher’s Note
All claims expressed in this article are solely those of the authors and do not necessarily represent those of their affiliated organizations, or those of the publisher, the editors and the reviewers. Any product that may be evaluated in this article, or claim that may be made by its manufacturer, is not guaranteed or endorsed by the publisher.
Acknowledgments
We thank the Spanish Armada, and particularly the captains and crew of the BIO A-33 Hesperides, for their invaluable collaboration. We are also indebted to the UTM, and especially M. Ojeda, for logistic and technical support on the Antarctic Spanish BAE JC1. Dominik Jammal executed the INP measurements at the TROPOS cloud group ice-lab. We thank the two reviewers and the editor for improving the current manuscript.
Supplementary Material
The Supplementary Material for this article can be found online at: https://www.frontiersin.org/articles/10.3389/fmars.2022.827061/full#supplementary-material
References
Álvarez-Salgado X. A., Miller A. E. J. (1998). Simultaneous Determination of Dissolved Organic Carbon and Total Dissolved Nitrogen in Seawater by High Temperature Catalytic Oxidation: Conditions for Accurate Shipboard Measurements. Mar. Chem. 62, 325–333. doi: 10.1016/S0304-4203(98)00037-1
Arrigo K. R. (2014). Sea Ice Ecosystems. Ann. Rev. Mar. Sci. 6, 439–467. doi: 10.1146/annurev-marine-010213-135103
Arrigo K. R., Lizotte M. P., Mock T. (1997). Primary Producers and Sea Ice. Science 276 (5311), 394–397. doi: 10.1126/science.276.5311.394
Arrigo K. R., van Dijken G. L., Strong A. L. (2015). Environmental Controls of Marine Productivity Hot Spots Around Antarctica. J. Geophys. Res. Oceans. 120, 5545–5565. doi: 10.1002/2015JC010888
Aslam S. N., Cresswell-Maynard T., Thomas D. N., Underwood G. J. C. (2012). Production and Characterization of the Intra- and Extracellular Carbohydrates and Polymeric Substances (EPS) of Three Sea-Ice Diatom Species, and Evidence for a Cryoprotective Role for EPS J. Phycol. 48, 1494–1509. doi: 10.1111/jpy.12004.
Aslam S. N., Michel C., Niemi A., Underwood G. J. C. (2016). Patterns and Drivers of Carbohydrate Budgets in Ice Algal Assemblages From First Year Arctic Sea Ice. Limnol. Oceanogr. 61, 919–937. doi: 10.1002/lno.10260
Bates T. S., Quinn P. K., Coffman D. J., Johnson J. E., Upchurch L., Saliba G., et al. (2020). Variability in Marine Plankton Ecosystems Are Not Observed in Freshly Emitted Sea Spray Aerosol Over the North Atlantic Ocean. Geophy Res. Lett. 47, e2019GL085938. doi: 10.1029/2019GL085938
Boras J. A., Sala M. M., Arrieta J. M., Sa E. L., Felipe J., Agustí S., et al. (2010). Effect of Ice Melting on Bacterial Carbon Fluxes Channelled by Viruses and Protists in the Arctic Ocean. Pol. Biol. 33, 1695–1707. doi: 10.1007/s00300-010-0798-8
Boutin G., Lique C., Ardhuin F., Rousset C., Talandier C., Accensi M., et al. (2020). Towards a Coupled Model to Investigate Wave–Sea Ice Interactions in the Arctic Marginal Ice Zone. Cryosphere. 14, 709–735. doi: 10.5194/tc-14-709-2020
Brean J., Dall’Osto M., Simó R., Shi Z., Beddows D. C. S., Harrison R. M. (2021). Open Ocean and Coastal New Particle Formation From Sulfuric Acid and Amines Around the Antarctic Peninsula. Nat. Geosci. 14, 383–388. doi: 10.1038/s41561-021-00751-y
Brierley A. S., Thomas D. N. (2002). Ecology of Southern Ocean Pack Ice. Adv. Mar. Biol. 43, 171–276. doi: 10.1016/S0065-2881(02)43005-2
Brussaard C. P. (2004). Optimization of Procedures for Counting Viruses by Flow Cytometry. Appl. Environ. Microbiol. 70, 1506–1513. doi: 10.1128/AEM.70.3.1506-1513.2004
Buchaca T., Catalan J. (2007). Factors Influencing the Variability of Pigments in the Surface Sediments of Mountain Lakes. Freshw. Biol. 52 (7), 1365–1379. doi: 10.1111/j.1365-2427.2007.01774.x
Casillo A., Lanzetta R., Parrilli M., Corsaro M. M. (2018). Exopolysaccharides From Marine and Marine Extremophilic Bacteria: Structures, Properties, Ecological Roles and Applications Mar. Drugs 16, 69. doi: 10.3390/md16020069
Christiansen S., Salter M. E., Gorokhova E., Nguyen Q. T., Bilde M. (2019). Sea Spray Aerosol Formation: Laboratory Results on the Role of Air Entrainment, Water Temperature, and Phytoplankton Biomass. Environ. Sci. Technol. 53, 13107–13116. doi: 10.1021/acs.est.9b04078
Chubb T., Huang Y., Jensen J., Campos T., Siems S., Manton M.. (2016). Observations of High Droplet Number Concentrations in Southern Ocean Boundary Layer Clouds. Atmos. Chem. Phys. 16, 971–987. doi: 10.5194/acp-16-971-2016
Cisternas-Novoa C., Lee C., Engel A. (2014). A Semi-Quantitative Spectrophotometric, Dye-Binding Assay for Determination of Coomassie Blue Stainable Particles. Limnol. Oceanogr. Methods 12, 604–616. doi: 10.4319/lom.2014.12.604
Coble P. G. (2007). Marine Optical Biogeochemistry: The Chemistry of Ocean Color. Chem. Rev. 107 (2), 402–418. doi: 10.1021/cr050350
Cochran R. E., Ryder O. S., Grassian V. H., Prather K. A. (2017). Sea Spray Aerosol: The Chemical Link Between the Oceans, Atmosphere, and Climate. Acc. Chem. Res. 50 (3), 599–604. doi: 10.1021/acs.accounts.6b00603
Dall’Osto M., Beddows D. C. S., Tunved P., Krejci R., Ström J., Hansson H.-C., et al. (2017a). Arctic Sea Ice Melt Leads to Atmospheric New Particle Formation. Sci. Rep. 7, 3318. doi: 10.1038/s41598-017-03328-1
Dall'Osto M., Airs R. L., Beale R., Cree C., Fitzsimons M. F., Beddows D., et al. (2019). Simultaneous Detection of Alkylamines in the Surface Ocean and Atmosphere of the Antarctic Sympagic Environment. ACS Earth Space Chem. 3 (5), 854–862. doi: 10.1021/acsearthspacechem.9b00028
Dall’Osto M., Ovadnevaite J., Paglione M., Beddows D. C. S., Ceburnis D., Cree C., et al. (2017b). Antarctic Sea Ice Region as a Source of Biogenic Organic Nitrogen in Aerosols. Sci. Rep. 7, 6047. doi: 10.1038/s41598-017-06188-x
Decesari S., Facchini M. C., Fuzzi S., Tagliavini E. (2020). Characterizationof water-soluble organic compounds in atmosphericaerosol: a new approach. J. Geophys. Res. 105, 1481–1489.
Decesari S., Facchini M. C., Fuzzi S., Tagliavini E. (2000). Characterization of water-soluble organic compounds in atmospheric aerosol: a new approach. J. Geophys. Res. 105, 1481–1489.
Edler L., Elbrächter M. (2005). “The Utermöhl Method for Quantitative Phytoplankton Analysis,” in Intergovernmental Oceanographic Commission of ©UNESCO. 2010. Eds. Karlson B., Cusack C., Bresnan E. (Paris: UNESCO), 110. (IOC Manuals and Guides, no. 55.) (IOC/2010/MG/55).
Engel A., Endres S., Galgani L., Schartau M. (2020). Marvelous Marine Microgels: On the Distribution and Impact of Gel-Like Particles in the Oceanic Water-Column. Front. Mar. Sci. 7, 405. doi: 10.3389/fmars.2020.00405
Estrada M., Peters F. (2002). Microcosms: Applications in Marine Phytoplankton Studies. In:JPelagic Ecology Methodology. 33, Ed. D. V. Subba Rao (Tokyo: A. A. Balkema Publishers, Lisse, Abingdon, Exton (PA) 359–370.
Evans C., Pearce I., Brussaard C. P. D. (2009). Viral-Mediated Lysis of Microbes and Carbon Release in the Sub-Antarctic and Polar Frontal Zones of the Australian Southern Ocean. Environ. Microbiol. 11, 2924–2934. doi: 10.1111/j.1462-2920.2009.02050.x
Ferreira A., Costa R. R., Dotto T. S., Kerr R., Tavano V. M., Brito A. C., et al. (2020). Changes in Phytoplankton Communities Along the Northern Antarctic Peninsula: Causes, Impacts and Research Priorities. Front. Mar. Sci. 7. doi: 10.3389/fmars.2020.576254
Fossum K. N., Ovadnevaite J., Ceburnis D., Dall’Osto M., Marullo S., Bellacicco M., et al. (2018). Summertime Primary and Secondary Contributions to Southern Ocean Cloud Condensation Nuclei. Sci. Rep. 8 (11), 13844. doi: 10.1038/s41598-018-32047-4
Fuentes E., Coe H., Green D., de Leeuw G., McFiggans G. (2010). On the Impacts of Phytoplankton-Derived Organic Matter on the Properties of the Primary Marine Aerosol – Part 1: Source Fluxes. Atmos. Chem. Phys. 10, 9295–9317. doi: 10.5194/acp-10-9295-2010
Gantt B., Meskhidze N. (2013). The Physical and Chemical Characteristics of Marine Primary Organic Aerosol: A Review. Atmos. Chem. Phys. 13, 3979–3996. doi: 10.5194/acp-13-3979-2013
Gasol J. M., Del Giorgio P. A. (2000). Using Flow Cytometry for Counting Natural Planktonic Bacteria and Understanding the Structure of Planktonic Bacterial Communities. Sci. Mar. 64 (2), 197–224. doi: 10.3989/scimar.2000.64n2197
Gong X., Wex H., van Pinxteren M., Triesch N., Fomba K. W., Lubitz J., et al. (2020). Characterization of Aerosol Particles at Cape Verde Close to Sea and Cloud Level Heights - Part 2: Ice Nucleating Particles in Air, Cloud and Seawater. Atmos. Chem. Phys. 20, 1451–1468. doi: 10.5194/acp-20-1451-2020
Hartmann M., Gong X., Kecorius S., van Pinxteren M., Vogl T., Welti A., et al. (2021). Terrestrial or Marine? – Indications Towards the Origin of Ice Nucleating Particles During Melt Season in the European Arctic Up to 83.7°N. Atmos. Chem. Phys. 21, 11613–11636. doi: 10.5194/acp-21-11613-2021
Held A., Brooks I. M., Leck C., Tjernström M. (2011). On the Potential Contribution of Open Lead Particle Emissions to the Central Arctic Aerosol Concentration. Atmos. Chem. Phys. 11, 3093–3105. doi: 10.5194/acp-11-3093-2011
Holland M. M., Bitz C. M. (2003). Polar Amplification of Climate Change in Coupled Models. Clim. Dyn. 21, 221–232. doi: 10.1007/s00382-003-0332-6
Holm-Hansen O., Lorenzen C. J., Holmes R. W., Strickland J. D. H. (1965). Fluorometric Determination of Chlorophyll. ICES. J. Marine. Sci. 30 (1). doi: 10.1093/icesjms/30.1.3
Kanji Z. A., Ladino L. A., Wex H., Boose Y., Kohn M., Cziczo D., et al. (2017). Chapter 1: Overview of Ice Nucleating Particles, in Ice Formation and Evolution in Clouds and Precipitation: Measurement and Modeling Challenges. Meteor. Monogr. 8.1–8.13 doi: 10.1175/AMSMONOGRAPHS-D-16-0008.1
Kawasaki N., Benner R. (2006). Bacterial Release of Dissolved Organic Matter During Cell Growth and Decline: Molecular Origin and Composition Limnol. Oceanogr. 51, 2170–2180. doi: 10.4319/lo.2006.51.5.2170
Keene W.C., Maring H., Maben J.R., Kieber D.J., Pszenny A.A.P., Dahl E.E., et al. (2007). Chemical and Physical Characteristics of Nascent Aerosols Produced by Bursting Bubbles at a Model Air-Sea Interface. J. Geophys. Res. 112 (D21). doi: 10.1029/2007JD008464
Kennedy F., McMinn A., Martin A. (2021). Short Note: Extracellular Export and Consumption of Glucose in Antarctic Sea Ice. doi: 10.21203/rs.3.rs-654891/v1
Kieber D. J., Keene W. C., Frossard A. A., Long M. S., Maben J. R., Russell L. M., et al. (2022). Coupled Ocean-Atmosphere Loss of Marine Refractory Dissolved Organic Carbon. Polar Biol. 45 (6), 763–768. doi: 10.1002/2016GL068273
Kirchman D. L., Meon B., Ducklow H. W., Carlson C. A., Hansell D. A., Steward G. F. (2001). Glucose Fluxes and Concentrations of Dissolved Combined Neutral Sugars (Polysaccharides) in the Ross Sea and Polar Front Zone, Antarctica. Deep-Sea Res. Part II: Topical Studies Oceanogr. 48, 4179–4197. doi: 10.1016/S0967-0645(01)00085-6
Kothawala D. N., Murphy K. R., Stedmon C. A., Weyhenmeyer G. A., Tranvik L. J. (2013). Inner Filter Correction of Dissolved Organic Matter Fluorescence. Limnol. Oceanogr. Methods 11, 616–630. doi: 10.4319/lom.2013.11.616
Krembs C., Deming J. W. (2008). “The Role of Exopolymers in Microbial Adaptation to Sea Ice, 247–264. Margesin R, Schinner F, Marx J-C, Gerday C (eds)” in Psychrophiles: From Biodiversity to Biotechnology (Springer), pp. 247–264.
Krembs C., Eicken H., Junge K., Deming J. W. (2002). High Concentrations of Exopolymeric Substances in Arctic Winter Sea Ice: Implications for the Polar Ocean Carbon Cycle and Cryoprotection of Diatoms 49, 2163–2181. doi: 10.1016/S0967-0637(02)00122-X
Lachlan-Cope T., Beddows D. C. S., Brough N., Jones A. E., Harrison R. M., Lupi A., et al. (2020). On the Annual Variability of Antarctic Aerosol Size Distributions at Halley Research Station. Atmos. Chem. Phys. 20, 4461–4476. doi: 10.5194/acp-20-4461-2020
Lawaetz A. J., Stedmon C. A. (2009). Fluorescence Intensity Calibration Using the Raman Scatter Peak of Water. Appl. Spectrosc. 63 (8), 936–940. doi: 10.1366/000370209788964548
Lee C., Sultana C. M., Collins D. B., Santander M. V., Axson J. L., Malfatti F., et al. (2015). Advancing Model Systems for Fundamental Laboratory Studies of Sea Spray Aerosol Using the Microbial Loop. J. Phys. Chem. A. 119, 8860. doi: 10.1021/acs.jpca.5b03488
Lewis S. L., Saliba G., Russell L. M., Quinn P. K., Bates T. S., Behrenfeld M. J. (2021). Seasonal Differences in Submicron Marine Aerosol Particle Organic Composition in the North Atlantic. Front. Mar. Sci. 8. doi: 10.3389/fmars.2021.720208
Li Z., Niu F., Fan J., Liu Y., Rosenfeld D., Ding Y. (2011). Long-Term Impacts of Aerosols on the Vertical Development of Clouds and Precipitation. Nat. Geosci. 4, 888–894. doi: 10.1038/ngeo1313
Louda J. W., Liu L., Fan J., Baker E. W. (2002). Senescence- and Dealth-RelatedAlteration of Chlorophylls and Carotenoids in Marine Phytoplankton. Org. Geochem. 33, 1635–1653. doi: 10.1016/S0146-6380(02)00106-7
Mansour K., Decesari S., Facchini M. C., Belosi F., Paglione M., Sandrini S., et al. (2020). Linking Marine Biological Activity to Aerosol Chemical Composition and Cloud-Relevant Properties Over the North Atlantic Ocean. J. Geophys. Res. Atm. 125, e2019JD032246. doi: 10.1029/2019JD032246
Maranger R., Vaqué D., Nguyen D., Hébert M. P., Lara E. (2015). Pan-Arctic Patterns of Planktonic Heterotrophic Microbial Abundance and Processes: Controlling Factors and Potential Impacts of Warming. Progr. Oceanogr. 139, 221–232. doi: 10.1016/j.pocean.2015.07.006
Martensson E. M., Nilsson E. D., Cohen L. H., de Leeuw G. (2003). Laboratory Simulations and Parameterization of the Primarymarine Aerosol Production. J. Geophys. Res. 108 (D9), 4297. doi: 10.1029/2002JD002263
Mayer K. J., Sauer J. S., Dinasquet J., Prather K. A. (2020). CAICE Studies: Insights From a Decade of Ocean-Atmosphere Experiments in the Laboratory. Acc. Chem. Res. 53 (11), 2510–2520. doi: 10.1021/acs.accounts.0c00504
McCluskey C. S., Hill T. C. J., Humphries R. S., Rauker A. M., Moreau S., Strutton P. G., et al. (2018). Observations of Ice Nucleating Particles Over Southern Ocean Waters, Geophys. Res. Lett. 45 (21), 11989–11997. doi: 10.1029/2018gl079981
McCoy D. T., Burrows S. M., Wood R., Grosvenor D. P., Elliott S. M., Ma P.-L., et al. (2015). Natural Aerosols Explain Seasonal and Spatial Patterns of Southern Ocean Cloud Albedo. Sci. Adv. 1, e1500157. doi: 10.1126/sciadv.1500157
Medina-Pérez N.-I., Dall’Osto M., Decesari S., Paglione M., Moyano E., Berdalet E. (2020). Aerosol Toxins Emitted by Harmful Algal Blooms Susceptible to Complex Air-Sea Interactions. Environ. Sci. Technol. 55 (1), 469–477. doi: 10.1021/acs.est.0c05795
Meiners K. M., Vancoppenolle M., Thanassekos S., Dieckmann G. S., Thomas D. N., et al. (2012). Chlorophyll a in Antarctic Sea Ice From Historical Ice Core Data. Geophys. Res. Lett. 39 (L2), 1602. doi: 10.1029/2012GL053478
Mender-Deuer S., Lessard E. J. (2000). Carbon to Volume Relationships for Dinoflagellates, Diatoms, and Other Protist Plankton. Limnol. Oceanogr. 45 (3), 569–579. doi: 10.4319/lo.2000.45.3.0569
Miyazaki Y., Suzuki K., Tachibana E., Yamashita Y., Müller A., Kawana K., et al. (2020). New Index of Organic Mass Enrichment in Sea Spray Aerosols Linked With Senescent Status in Marine Phytoplankton. Sci. Rep. 10 (1), 1–9. doi: 10.1038/s41598-020-73718-5
Miyazaki Y., Yamashita Y., Kawana K., Tachibana E., Kagami S., Mochida M., et al. (2018). Chemical Transfer of Dissolved Organic Matter From Surface Seawater to Sea Spray Water-Soluble Organic Aerosol in the Marine Atmosphere. Sci. Rep. 8 (1), 1–10. doi: 10.1038/s41598-018-32864-7
Modini R. L., Russell L. M., Deane G. B., Stokes M. D. (2013). Effect of Soluble Surfactant on Bubble Persistence and Bubble-Produced Aerosol Particles. J. Geophys. Res. 118, 1388–1400. doi: 10.1002/jgrd.50186
Mopper K., Dawson R., Liebezeit G., Ittekkot V. (1980). The Monosaccharide Spectra of Natural Waters Mar. Chem. 10, 55–66. doi: 10.1016/0304-4203(80)90058-4
Mühlenbruch M., Grossart H.-P., Eigemann F., Voss M. (2018). Mini-Review: Phytoplankton-Derived Polysaccharides in the Marine Environment and Their Interactions With Heterotrophic Bacteria. Environ. Microbiol. 20 (8), 2671–2685. doi: 10.1111/1462-2920.14302
Murphy K. R., Stedmon C. A., Graeber D., Bro R. (2013). Fluorescence Spectroscopy and Multi-Way Techniques. PARAFAC. Anal. Methods 5 (23), 6557–6566. doi: 10.1039/c3ay41160e
Murphy K. R., Stedmon C. A., Wenig P., Bro R. (2014). OpenFluor- An Online Spectral Library of Auto-Fluorescence by Organic Compounds in the Environment. Anal. Methods 6 (3), 658–661. doi: 10.1039/c3ay41935e
Nagata T. (2000). ““Picopellets” Produced by Phagotrophic Nanoflagellates: Role in the Material Cycling Within Marine Environments,” in Dynamics and Characterization of Marine Organic Matter. Ocean Sciences Research (OSR), vol. 2 . Eds. Handa N., Tanoue E., Hama T. (Dordrecht: Springer). doi: 10.1007/978-94-017-1319-1_12
Nieto-Cid M., Álvarez-Salgado X. A., Pérez F. F. (2006). Microbial and Photochemical Reactivity of Fluorescent Dissolved Organic Matter in a Coastal Upwelling System. Limnol. Oceanogr. 51 (3), 1391–1400. doi: 10.4319/lo.2006.51.3.1391
Nunes S., Latasa M., Delgado M., Emelianov M., Sim´o R., Estrada M., et al (2019). Phytoplankton Community Structure in Contrasting Ecosystems of the Southern Ocean: South Georgia, South Orkneys and Western Antarctic Peninsula Deep. Res. I 151, 103059. doi: 10.1016/j.dsr.2019.06.005
O’Dowd C. D., et al. (2015). Connecting Marine Productivity to Sea-Spray via Nanoscale Biological Processes: Phytoplankton Dance or Death Disco? Sci. Rep. 5 (1), 14883. doi: 10.1038/srep14883
Pakulski J. D., Benner R. (1994). Abundance and Distribution of Carbohydrates in the Ocean. Limnol. Oceanogr. 39 (4), 930–940. doi: 10.4319/lo.1994.39.4.0930
Park J., Dall’Osto M., Park K., Gim Y., Kang H. J., Jang E., et al. (2020). Shipborne Observations Reveal Contrasting Arctic Marine, Arctic Terrestrial and Pacific Marine Aerosol Properties. Atmos. Chem. Phys. Discuss. 20, 5573–5590. doi: 10.5194/acp-20-5573-2020
Park J., Dall’Osto M., Park K., Kim J.-H., Park J., Park K.-T., et al. (2019). Artic Primary Aerosol Production Strongly Influenced by Riverine Organic Matter. Environ. Sci. Technol. 53, 8621–8630. doi: 10.1021/acs.est.9b03399
Passow U. (2002). Transparent Exopolymer Particles (TEP) in Aquatic Environments. Prog. Oceanogr. 55, 287–333. doi: 10.1016/S0079-6611(02)00138-6
Passow U., Alldredge A. L. (1995). A Dye-Binding Assay for the Spectrophotometric Measurement of Transparent Exopolymer Particles (TEP). Limnol. Oceanogr. 40, 1326–1335. doi: 10.4319/lo.1995.40.7.1326
Prather K. A., Bertram T. H., Grassian V. H., Deane G. B., Stokes M. D., Demott P. J., et al. (2013). Bringing the Ocean Into the Laboratory to Probe the Chemical Complexity of Sea Spray Aerosol. Proc. Natl. Acad. Sci. U. S. A. 110 (19), 7550–7555. doi: 10.1073/pnas.1300262110
Pucher M., Wünsch U., Weigelhofer G., Murphy K., Hein T., Graeber D. (2019). Stardom: Versatile Software for Analyzing Spectroscopic Data of Dissolved Organic Matter in R. Water 11 (11), 2366. doi: 10.3390/w11112366
Quinn P. K., Bates T. S. (2011). The Case Against Climate Regulation via Oceanic Phytoplankton Sulphur Emissions. Nature 480 (7375), 51–56. doi: 10.1038/nature10580
Quinn P. K., Bates T. S., Schulz K. S., Coffman D. J., Frossard A. A., Russell L. M., et al. (2014). Contribution of Sea Surface Carbon Pool to Organic Matter Enrichment in Sea Spray Aerosol. Nat. Geosci. 7 (3), 228–232. doi: 10.1038/ngeo2092
Quinn P. K., Coffman D. J., Johnson J. E., Upchurch L. M., Bates T. S. (2017). Small Fraction of Marine Cloud Condensation Nuclei Made Up of Sea Spray Aerosol. Nat. Geosci. 10 (9), 674–679. doi: 10.1038/ngeo3003
Quinn P. K., Collins D. B., Grassian V. H., Prather K. A., Bates T. S. (2015). Chemistry and Related Properties of Freshly Emitted Sea Spray Aerosol. Chem. Rev. 115 (10), 4383–4399. doi: 10.1021/cr500713g
Retelletti Brogi S., Ha S.-Y., Kim K., Derrien M., Lee Y. K., Hur J. (2018). Optical and Molecular Characterization of Dissolved Organic Matter (DOM) in the Arctic Ice Core and the Underlying Seawater (Cambridge Bay, Canada): Implication for Increased Autochthonous DOM During Ice Melting. Sci. Total. Environ. 627, 802–811. doi: 10.1016/j.scitotenv.2018.01.251
Rinaldi M., Fuzzi S., Decesari S., Marullo S., Santoleri R., Provenzale A., et al. (2013). Is Chlorophyll-a the Best Surrogate for Organic Matter Enrichment in Submicron Primary Marine Aerosol? J. Geophys. Res. Atmos. 118, 4964–4973. doi: 10.1002/jgrd.50417
Rinaldi M., Paglione M., Decesari S., Harrison R. M., Beddows D. C. S., Ovadnevaite J., et al. (2020). Contribution of Water-Soluble Organic Matter From Multiple Marine Geographic Eco-Regions to Aerosols Around Antarctica. Environ. Sci. Technol. 54, 7807–7817. doi: 10.1021/acs.est.0c00695
Romera-Castillo C., Sarmento H., Alvarez-Salgado X. A. Á., Gasol J. M., Marrasé C. (2011). Net Production and Consumption of Fluorescent Colored Dissolved Organic Matter by Natural Bacterial Assemblages Growing on Marine Phytoplankton Exudates. Appl. Environ. Microbiol. 77 (21), 7490–7498. doi: 10.1128/AEM.00200-11
Russell L. M., Hawkins L. N., Frossard A. A., Quinn P. K., Bates T. S. (2010). Carbohydrate-Like Composition of Submicron Atmospheric Particles and Their Production From Ocean Bubble Bursting. Proc. Natl. Acad. Sci. U. S. A. 107 (15), 6652–6657. doi: 10.1073/pnas.0908905107
Santander M. V., Mitts B. A., Pendergraft M. A., Dinasquet J., Lee C., Moore A. N., et al. (2021). Tandem Fluorescence Measurements of Organic Matter and Bacteria Released in Sea Spray Aerosols. Environ. Sci. Technol. 55 (8), 5171–5179. doi: 10.1021/acs.est.0c05493
Schofield O., Ducklow H. W., Martinson D. G., Meredith M. P., Moline M. A., Fraser W. R. (2010). How Do Polar Marine Ecosystems Respond to Rapid Climate Change?. Sci. (New York N. Y.) 328(5985), 1520–1523. doi: 10.1126/science.1185779
Sellegri K., Nicosia A., Freney E., Uitz J., Thyssen M., Grégori G., et al (2021). Surface Ocean Microbiota Determine Cloud Precursors. Sci. Rep. 11, 281
Sellegri K., Odowd C. D., Yoon Y. J., Jennings S. G., Deleeuw G. (2006). Surfactants and Submicron Sea Spray Generation. J. Geophys. Res. 58. doi: 10.1029/2005JD0066
Sieracki M. E., Johnson P. W., Sieburth J. M. (1985). Detection, Enumeration, and Sizing of Planktonic Bacteria by Image-Analyzed Epifluorescence Microscopy. Appl. Environ. Microbiol. 49 (4), 799–810. doi: 10.1128/aem.49.4.799-810.1985
Skoog A., Biddanda B., Benner R. (1999). Bacterial Utilization of Dissolved Glucose in the Upper Water Column of the Gulf of Mexico. Limnol. Oceanogr. 44, 1625–1633. doi: 10.4319/lo.1999.44.7.1625
Stokes M. D., Deane G., Collins D. B., Cappa C., Bertram T., Dommer A., et al. (2016). A Miniature Marine Aerosol Reference Tank (miniMART) as a Compact Breaking Wave Analogue. Atmos. Meas. Tech. 9, 4257–4267. doi: 10.5194/amt-9-4257-2016
Svenningsson B., Rissler J., Swietlicki E., Mircea M., Bilde M., Facchini M. C., et al. (2006). Hygroscopic Growth and Critical Supersaturations for Mixed Aerosol Particles of Inorganic and Organic Compounds of Atmospheric Relevance. Atmos. Chem. Phys. 6, 1937–1952. doi: 10.5194/acp-6-1937-2006
Taketani F., Kanaya Y., Akimoto H. (2009). Heterogeneous Loss of HO2 by KCl, Synthetic Sea Salt, and Natural Seawater Aerosol Particles. Atmos. Environ. 43 (9), 1660–1665. doi: 10.1016/j.atmosenv.2008.12.010
Tyree C. A., Hellion V. M., Alexandrova O. A., Allen J. O. (2007). Foam Droplets Generated From Natural and Artificial Seawaters. J. Geophys. Res. 11229, D12204. doi: 10.1029/2006JD0077
Underwood G. J. C., Fietz S., Papadimitriou S., Thomas D. N., Dieckmann G. S. (2010). Distribution and Composition of Dissolved Extracellular Polymeric Substances (EPS) in Antarctic Sea Ice. Marine Ecology Progress Series, 404, 1–19. doi: 10.3354/meps08557
Vali G. (1971). Quantitative Evaluation of Experimental Results on Heterogeneous Freezing Nucleation of Supercooled Liquids. J. Atmos. Sci. 28 (3), 402–409. doi: 10.1175/1520-0469(1971)028<0402:qeoera>2.0.co;2
Vaqué D., Casamayor E. O., Gasol J. M. (2001). Dynamics of Whole Community Bacterial Production and Grazing Losses in Seawater Incubations as Related to the Changes in the Proportions of Bacteria With Different DNA-Content. Aquat. Microb. Ecol. 25, 163–177. doi: 10.3354/ame025163
Vignati E., Facchini M. C., Rinaldi M., Scannell C., Ceburnis D., Sciare J., et al. (2010). Global Scale Emission and Distribution of Sea-Spray Aerosol: Sea-Salt and Organic Enrichment. Atmospheric. Environ. 44 (5), 670–677. doi: 10.1016/j.atmosenv.2009.11.013
Wang X., Sultana C. M., Trueblood J., Hill T. C.J., Malfatti F., Lee C, et al. (2015). Microbial Control of Sea Spray Aerosol Composition: A Tale of Two Blooms. ACS Cent. Sci. 1, 124–131. doi: 10.1021/acscentsci.5b00148
Wilson T. W., Ladino L. A., Alpert P. A., Breckels M. N., Brooks I. M., Browse J., et al. (2015). A Marine Biogenic Source of Atmospheric Ice-Nucleating Particles. Nature 525 (7568), 234–238. doi: 10.1038/nature14986
Yamashita Y., Tanoue E. (2004). In Situ Production of Chromophoric Dissolved Organic Matter in Coastal Environments. Geophys. Res. Lett. 31 (14), 2–5. doi: 10.1029/2004GL019734
Yamashita Y., Tanoue E. (2008). Production of Bio-Refractory Fluorescent Dissolved Organic Matter in the Ocean Interior. Nat. Geosci. 1 (9), 579–582. doi: 10.1038/ngeo279
Zeppenfeld S., van Pinxteren M., Engel A., Herrmann H. (2020). A Protocol for Quantifying Mono- and Polysaccharides in Seawater and Related Saline Matrices by Electro-Dialysis (ED) – Combined With HPAEC-PAD. Ocean Sci 16, 817–830. doi: 10.5194/os-16-817-2020
Keywords: Antarctic, aerosols, ocean-atmosphere interaction, marine biogeochemistry, clouds, BEPSII, CATCH
Citation: Dall’Osto M, Vaqué D, Sotomayor-Garcia A, Cabrera-Brufau M, Estrada M, Buchaca T, Soler M, Nunes S, Zeppenfeld S, van Pinxteren M, Herrmann H, Wex H, Rinaldi M, Paglione M, Beddows DCS, Harrison RM and Berdalet E (2022) Sea Ice Microbiota in the Antarctic Peninsula Modulates Cloud-Relevant Sea Spray Aerosol Production. Front. Mar. Sci. 9:827061. doi: 10.3389/fmars.2022.827061
Received: 01 December 2021; Accepted: 28 March 2022;
Published: 16 June 2022.
Edited by:
Antonio Tovar-Sanchez, Editor, Spanish National Research Council (CSIC), SpainReviewed by:
Stephen D. Archer, Bigelow Laboratory for Ocean Sciences, United StatesJulie Dinasquet, University of California, San Diego, United States
Copyright © 2022 Dall’Osto, Vaqué, Sotomayor-Garcia, Cabrera-Brufau, Estrada, Buchaca, Soler, Nunes, Zeppenfeld, van Pinxteren, Herrmann, Wex, Rinaldi, Paglione, Beddows, Harrison and Berdalet. This is an open-access article distributed under the terms of the Creative Commons Attribution License (CC BY). The use, distribution or reproduction in other forums is permitted, provided the original author(s) and the copyright owner(s) are credited and that the original publication in this journal is cited, in accordance with accepted academic practice. No use, distribution or reproduction is permitted which does not comply with these terms.
*Correspondence: Manuel Dall´Osto, dallosto@icm.csic.es