Molecular Analysis of Predator Scats Reveals Role of Salps in Temperate Inshore Food Webs
 Catherine Cavallo1*
  André Chiaradia2
  Bruce E. Deagle3
  Julie C. McInnes3,4
  Sonia Sánchez1
  Graeme C. Hays5
  Richard D. Reina1
- 1Department of Biological Sciences, Monash University, Clayton, VIC, Australia
- 2Conservation Department, Phillip Island Nature Parks, Cowes, VIC, Australia
- 3Australian Antarctic Division, Kingston, TAS, Australia
- 4Institute for Marine and Antarctic Studies, University of Tasmania, Hobart, TAS, Australia
- 5Centre for Integrative Ecology, School of Life and Environmental Sciences, Deakin University, Geelong, VIC, Australia
High precision, high coverage DNA-based diet analysis tools allow great insight into the food web interactions of cryptic taxa. We used DNA fecal-metabarcoding to look for unrecorded taxa within the diet of a generalist central-placed predator, the little penguin Eudyptula minor. We examined 208 scats from 106 breeding pairs throughout August–February in a large colony at Phillip Island, Australia. While we confirmed a largely piscivorous diet, we also recovered DNA sequences from gelatinous and crustaceous plankton groups that have not previously been detected in the little penguin diet using other diet analysis methods. Gelatinous plankton, including salps, appendicularians, scyphozoans, and hydrozoans were present in 76% of samples and represented 25% of all sequences. DNA recovered from minute copepods and appendicularians may indicate links between trophic levels through secondary predation. Percentage frequency of occurrence (%FOO) demonstrated that little penguin diet composition changed over months and stages (incubation, guard, and post-guard) of the breeding season (month: χ2 = 201.91, df = NA, p < 0.01; stage: χ2 = 33.221, df = NA, p = 0.015). Relative read abundance (RRA) uncovered variations in the relative abundance of taxa in the diet over months and stages (month: F = 53.18, df = 59, p < 0.001; stage: F = 66.56, df = 29, p < 0.001). The diet became progressively fish-focused over months of the season and stages, while salps were only present in 4 out of 6 months, with a peak in September. Based on their prevalence in this dataset, in this year of very high breeding success (2.15 chicks per pair), salps may constitute a food source for this largely piscivorous generalist. Our work highlights how DNA metabarcoding can improve our understanding of the trophic role of gelatinous plankton and other cryptic taxa.
Introduction
Diet analyses form the foundation of many important community and species-specific time series used to inform models and plans for conservation and management. However, many diet analysis techniques are limited in their coverage and accuracy (Phillips et al., 2003; Braley et al., 2010), in some cases excluding whole taxonomic clades (Cardona et al., 2012). New techniques now enable us to fill in the gaps and update information being used to make important decisions about species and ecosystem management.
Gelatinous plankton form an abundant and vast group that has often evaded detection by past diet analysis methods. This polyphyletic group encompasses the cnidarian sea-jellies, the salps, appendicularians and other tunicates and the ctenophores, all of which we will hereafter refer to as “jellies.” Our understanding of the contribution of jellies to food webs has been obstructed by the difficulty in recovering and identifying gelatinous material from predator diet samples, because the soft tissue is digested rapidly into an amorphous gel (Mianzan et al., 1996; Arai et al., 2003). Stable isotope and fatty acid analysis have uncovered specialist and opportunistic jelly predators (Wanless et al., 2005), challenging assumptions based on observed feeding (Syvaranta et al., 2012; Couturier et al., 2013) and demonstrating that scyphozoans can make up as much as ∼90% of the diet of some fish species that use them as shelter (D’ambra et al., 2015). However, classification of gelatinous dietary items has been limited because fatty acid and isotopic signatures can vary within species, and may overlap among species in a region (Iverson et al., 2002).
Molecular technologies that identify prey DNA in the gut, feces and pellets of consumers are revolutionizing our understanding of organisms’ diets and food web interactions (Gerwing et al., 2016; Hardy et al., 2017; Komura et al., 2018), and providing new ways to capture biodiversity (Boyer et al., 2015). It is now possible to sample an animal’s entire diet using DNA metabarcoding, which targets regions of DNA that are highly conserved within a target group and that offer enough variability to allow distinction between taxonomic groups (Cristescu, 2014). Furthermore, technological advances in next-generation sequencing allow 100s of diet samples to be processed and analyzed rapidly (Metzker, 2010) maximizing capacity for high temporal resolution, particularly when compared to visual analysis of prey remains in stomach, gut or fecal contents (Taberlet et al., 2018). Metabarcoding is now being used across marine and terrestrial environments to investigate in fine detail a wide range of ecological, community, and conservation questions (Kartzinel et al., 2015; Thomsen and Willerslev, 2015; Thomas et al., 2016), and holds great promise for the description and understanding of predation on gelatinous taxa.
Despite their low energy density (Doyle et al., 2007; Cardona et al., 2012), true sea-jellies (Class: Scyphozoa), hydrozoans or salps are included in the diets of many marine and coastal birds and some mammals (Childerhouse et al., 2001; Arai, 2005; Cardona et al., 2012; Phillips et al., 2017). These endotherms generally show wide diet composition concordant with a generalist foraging strategy, including jellies in small amounts, seasonally, in accordance with local abundance (Harrison, 1984; Jarman et al., 2013). However, a recent DNA metabarcoding study demonstrated that the diets of two albatrosses, Thalassarche melanophris and Thalassarche impavida, included a considerable gelatinous component (McInnes et al., 2017b). Recent video footage shows penguins exploiting Scyphozoa as both a source of fish prey and an occasional prey item (Sutton et al., 2015; Thiebot et al., 2016) and metabarcoding of Adélie penguin Pygoscelis adeliae scats also reveals scyphozoan prey (McInnes et al., 2016). Whether or not they are important prey for these groups, jellies can constitute a large proportion of biomass in some areas (Lynam et al., 2006; Henschke et al., 2016) and many exhibit bloom and bust cycles that significantly affect trophic interactions (Pitt et al., 2014; Smith et al., 2016). Jellies are resilient across a range of physical conditions (Mills, 2001; Purcell, 2012), and some gelatinous groups readily invade ecosystems and favor environments characterized by anthropogenic disturbance (Richardson et al., 2009; Purcell, 2012). They are capable of displacing fish and other taxa in the water column through competition and predation (Purcell and Arai, 2001; Pakhomov et al., 2002; Henschke et al., 2016). Together, these observations indicate that gelatinous taxa warrant greater monitoring and further consideration in ecosystem management planning (Brodeur et al., 2016; Aubert et al., 2018).
Little penguins, Eudyptula minor, are generalist predators that prey mainly on small fish but also crustaceans and squid (Cullen et al., 1992; Chiaradia et al., 2010, 2014; Kowalczyk et al., 2015). Their generalist diet makes them useful for capturing information about the wider food web (Boyer et al., 2015). However, during the breeding season they are central place foragers whose foraging range is constrained to differing degrees by the specific demands of each breeding stage, potentially affecting the types of prey they are able to exploit (Preston et al., 2008; Chiaradia et al., 2016; Poupart et al., 2017). Breeding chronology is not synchronous across a colony, with some birds incubating eggs while others have chicks that are close to fledging. Depending on the availability and abundance of prey, pairs can raise one to three clutches in a single season (Chiaradia and Kerry, 1999).
Little penguin reproductive output is thought to be determined by the availability and abundance of fish prey of a certain size (Chiaradia et al., 2003; Kowalczyk et al., 2014), but almost all that is known about the diet of this species comes from analysis of stomach contents that overlooks soft prey, and stable isotope analysis that does not provide accurate species identification (Chiaradia et al., 2016). Hence important prey items may have been under-represented in previous studies. We use DNA metabarcoding of little penguin scats to refine the diet composition of little penguins so we can better understand their inshore food web.
Materials and Methods
Experimental Design
We combined metabarcoding scat diet analysis with field records of little penguin breeding stages. To determine diet composition, we collected scats from little penguin nests on Phillip Island, Victoria, Australia, over the 7-month breeding season in the Austral summer 2015/16. We used a universal primer (18S_SSU rDNA, McInnes et al., 2017a) capable of identifying multicellular animals to class and sometimes order or family level. We compared little penguin diet between months of the breeding season, and between breeding stages, to investigate extrinsic and intrinsic drivers of diet.
Study Sites, Species, and Collection of Breeding Stage Data
Little penguins were monitored at two sites located ∼2 km apart within the Phillip Island colony in south eastern Australia (38°31′ S, 145°07′ E). The two study sites were “Penguin Parade,” where monitored penguins breed in artificial wooden nest boxes, and “Radio-tracking Bay,” where penguins breed in natural burrows. There is a high degree of spatial foraging segregation between these sites (Sánchez et al., in press). Around 100 nests at each site were monitored to record the presence of adults, eggs or chicks; three times a week at Penguin Parade and once a week at Radio-tracking Bay due to the differing accessibility of the sites. Little penguins have three discrete breeding stages, which significantly influence their foraging range and effort. These include “incubation,” in which adults take turns incubating their eggs for 2–7 days while the partner forages at sea (Numata et al., 2000; Kato et al., 2008); “guard,” where small chicks are guarded by one parent while the other forages at sea, swapping roughly daily (Chiaradia and Kerry, 1999), and “post-guard,” where both adults forage to provision their large chicks, which are left unattended in the burrow (Saraux et al., 2011). Foraging trips during post-guard can range from between one to two days when food is abundant and 2–5 days when food is scarce (Chiaradia and Nisbet, 2006). Therefore foraging range is most limited during the guard stage.
Collection of Scat Samples
Each week, we aimed to sample scats from all nests with eggs or chicks at each site. Cardboard was placed on the floor of the entrance of nests, taking care not to block the exit, and pegged in place. The next morning, scats that had been deposited on cardboard were collected using a metal spatula or tweezers, placed in individual vials and mixed thoroughly with 75–80% ethanol for preservation. We did not collect scat from substrate (soil and vegetation, etc.) as humic substances in soil can inhibit DNA amplification (Schrader et al., 2012) and contaminant DNA from the environment can swamp dietary DNA in samples (McInnes et al., 2017a). Samples were stored in a freezer at -20°C within 3 h of collection. For full details of the scat collection protocol (see McInnes et al., 2017a).
Only around 100 nests were available at each site for monitoring, and of these fewer than fifty had eggs or chicks in any given week. This means that many nests were sampled more than once during the study. Samples collected each week ranged from less than 10 to 30, due to contamination by substrate, loss of sample freshness, and failure by penguins to defecate on the cardboard. A total of 579 samples were successfully collected from 106 nests across the two sites.
Molecular Methodology
DNA Extraction
DNA extraction and marker amplification were performed at the Australian Antarctic Division in Kingston, TAS, Australia. DNA was extracted from approximately 30 mg of each scat sample, using a Promega Maxwell® 16 instrument and Maxwell® 16 Tissue DNA Purification Kits. PCR inhibitor concentrations in DNA extracts were reduced by mixing samples with 250 μL Roche Stool Transport and Recovery (S.T.A.R.) Buffer (Roche Diagnostics, Basel, Switzerland) prior to extraction.
DNA Metabarcoding
Dietary DNA metabarcoding involves amplification and sequencing of large numbers of short, unique regions of DNA (barcodes) present in the scats of consumers (Pompanon et al., 2012). We used a two-step PCR amplification process enabling amplification of a DNA barcode region, and subsequent attachment of unique ‘index tag’ sequences to each sample, allowing samples to be pooled for sequencing (Binladen et al., 2007). In this study, DNA extracts were amplified using broad range primers (18S_SSU: McInnes et al., 2017a), that are conserved in metazoans, and amplify the V7 region of the nuclear small subunit ribosomal DNA gene (Hadziavdic et al., 2014). In choosing a barcode marker, there is a trade-off between coverage and resolution. Highly conserved regions provide information covering the breadth of a generalist diet, but are less variable, limiting taxonomic resolution to the class or family level (Pompanon et al., 2012). The reaction mixture for the first amplification was 2 μL fecal DNA, 5 μL Phusion HF (Taq polymerase), 1 μL bovine serum albumin, 0.5 μL Evagreen (Biotium, Inc., United States), 0.1 μL of each of the 5 μM 18S_SSU primers and 1.3 μL of water. We chose not to use a blocking primer to prevent amplification of penguin (host) DNA, because these can also mask DNA from some target species (Pinol et al., 2014). The amplification process was completed on a LightCycler 480 (Roche Diagnostics). Thermal cycling conditions were 98°C for 2 min; followed by 35 amplification cycles of 98°C for 5 s, 67°C for 20 s, 72°C for 20 s, with a final elongation of 72°C for 1 min. Samples with a Cycle Threshold (CT) score greater than 30, indicating low DNA or inhibited amplification, were excluded from further analysis (Murray et al., 2015). Second stage amplification and sequencing steps were carried out at the Ramaciotti Centre for Genomics (Sydney, NSW, Australia). After purification with AMPure XP magnetic beads amplicons were labeled with Nextera Index Primers in unique combinations. The reaction mix for this stage was 2.5 μL DNA, 2.5 μL of each of the Nextera Index primers, 12.5 μL of KAPA HiFi HotStart ReadyMix (Taq polymerase) and 5 μL water. Thermal cycling conditions were 95°C for 3 min; then eight amplification cycles of 95°C for 30 s, 55°C for 30 s, 72°C for 30 s and then a final elongation of 72°C for 5 min. Finally, the pooled, indexed samples were loaded into an Illumina Miseq sequencer, and underwent 150 bp paired-end sequencing (Illumina Miseq v2 reagent kit).
Bioinformatics
Following sequencing, the separate forward and reverse reads were merged using the fastq_mergepairs function in USEARCH v8.0.1623 (Edgar, 2010, 2013). Amplicons that did not exactly match one of the forward or reverse 18S_SSU primers and those shorter than 150 bp were excluded. The merged amplicons from all samples were clustered into molecular operational taxonomic units (mOTUs) using the UPARSE algorithm (Edgar, 2010, 2013) with a cut-off threshold of 97% similarity. These mOTU clusters were then compared to a reference library (SILVA: Quast et al., 2013) containing DNA sequences linked to taxonomically verified specimens. Those with >95% match to a reference sequence were assigned to that taxon at class level. Many but not all sequences could be assigned taxonomic information at the class level using the SILVA database. The 10 most common classes (each accounting for more than 0.5% of food reads in the dataset) were further resolved to the lowest possible level using the NCBI Basic Local Alignment Search Tool (BLAST: Johnson et al., 2008). This global mOTU library was then used to classify sequences in each of the samples. Following identification of sequences, data were filtered to retain only food sequences, defined as all metazoa that are neither obligate parasites nor known post-defecation contaminants. Then, samples with fewer than 100 food sequences were discarded (comparable to McInnes et al., 2016), since these either contained insufficient DNA to analyze or were dominated by non-target DNA such that inferences about diet would be unreliable. Table 1 gives the final number of samples analyzed per each breeding stage and month.
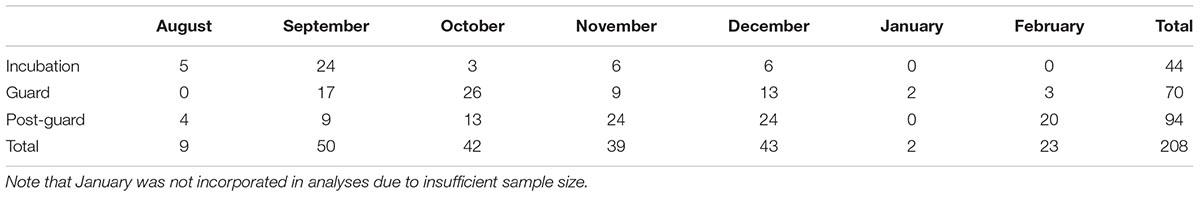
TABLE 1. Number of analyzed samples across months and breeding stages of the 2015/2016 breeding season at Phillip Island.
Diet composition was determined using two methods to account for biases in the diet summaries (Deagle et al., 2018). The two can give different results – although they are generated from the same dataset – because one functions as a record of presence or absence, and the other is used as a proxy for abundance. First, the number of reads of an individual taxon in a scat sample was divided by the total number of food reads in that sample and multiplied by 100, giving the percentage, or relative read abundance (RRA), of each taxon in each sample. These read abundances were then scored as present (>1% of food reads in a sample) or absent (<1% of food reads in a sample) to measure the percentage frequency of occurrence (%FOO) of each taxon across the dataset. RRA describes the relative percentage of prey sequences deriving from a prey group across the dataset and although it does not represent exact proportions of prey items in the diet, this metric can provide a more accurate summary of overall diet than frequency of occurrence in many situations (Deagle et al., 2018). The percentage frequency of occurrence describes the percentage of samples in the dataset in which a given taxon is present, but, like all presence–absence records, can overestimate the importance of common prey items that are ingested in very small amounts, including in the digestive tract of targeted prey (secondary predation). Samples were also categorized according to dominant prey group (i.e., the group comprising > 70% of the sequences in the sample) to further enable distinction between primary and secondary predation (McInnes et al., 2017b).
Statistical Analysis
To accommodate differing structure and assumptions between FOO (presence/absence) and RRA (percentages), we chose to analyze the data via separate methods that were better suited to each data type. A Chi-squared analysis was applied to the percentage frequency of occurrence data, and a mixed modeling approach with multiple comparisons employed for the RRA data. Statistical analyses were executed in R statistical software (R 3.1.2, R Development Core Team, 2013).
We employed contingency tables with Chi-squared tests to detect associations between taxa detected in fecal samples and either breeding stages or months of the breeding season within the frequency of occurrence (%FOO) data. Chi-squared tests were applied to the raw frequencies of occurrence, rather than percentages, as applying chi-squared tests to percentages is not valid. However, results are reported as percentages, as this is in line with conventions around this data type. Two contingency tables were built with counts of samples for each combination of taxon and either month or stage (xtabs function, vcd package; Meyer et al., 2008). To control for some of the possible pseudoreplication attributable to repeated sampling of burrows, we merged the data wherever there were multiple records for any combination of burrow, breeding stage and month. That is, if a taxon was recorded as present within any of the records for a single combination, it was retained as present in the merged record and if a taxon was absent from all records, it was retained as absent in the merged record. However, we were unable to fully account for repeated measures of burrows over multiple breeding stages and months and it is possible that this may inflate Type 1 error. Therefore, we have chosen to accept only chi-squared results with residuals > + 4 or < -4 (equivalent to a p-value of 0.01 or less). We have not interpreted residuals between + 2 and + 4 (equivalent to significance at the 0.05 level). Each Chi-squared test was visualized as an association plot (assoc function, vcd).
To test for effects of breeding stage or month on the RRA of individual taxa, we constructed two linear mixed effects models with burrow nested within site as a random intercept to account for repeated measures (lme function, nlme package; Pinheiro et al., 2014). We applied a rank normal transformation to improve normality in the RRA response. Each model contained only the interaction of taxon and either stage or month. As we were interested only in the interaction, we ignored the main effects (taxa, month, and breeding stage), which represented only the proportion of the total sequences that were collected in each breeding stage or month, or for each taxon, overall. The variance attributable to each level of the random effect was calculated by hand after retrieving estimated variances using the VarrCorr function in lme4 (Bates et al., 2014).
Following the outcome of the above analysis, we then generated individual linear mixed effects models to test the effect of month and breeding stage (separate models) for each taxon, again with rank-normalized responses and burrow nested within site as a random effect. We applied multiple comparisons using Tukey’s post hoc comparisons with Bonferroni corrections to reduce the chance of Type I error (glht function, multcomp package; Hothorn et al., 2013). These were visualized in a compact letter display (cld function, multcomp).
Ethics Statement
This research was conducted under an Ethics Permit No. 2.2014 approved by Phillip Island Nature Parks Animal Ethics Committee number and Research Permit No. 10006148 from the Department of Environment, Land, Water and Planning of Victoria, Australia.
Results
Of 376 processed samples, 208 samples met the requisite 100 prey DNA sequences threshold for inclusion in subsequent analyses. Of these, 112 were from Penguin Parade birds, while 96 were collected from Radio-tracking Bay. A total of 465 mOTUs were recognized, of which 353 contained non-food DNA including 31 obligate parasite OTUs, one penguin OTU and the remainder a range of non-food eukaryotes including fungi, unicellular organisms and plant DNA, a further 26 were unable to be identified (Table 2). A total of 86 mOTUs were identified as possible prey items, and pooled into their 17 classes for downstream analyses. It is typical for scat samples to include a high proportion of DNA sequences from parasites and contaminants (McInnes et al., 2017a).
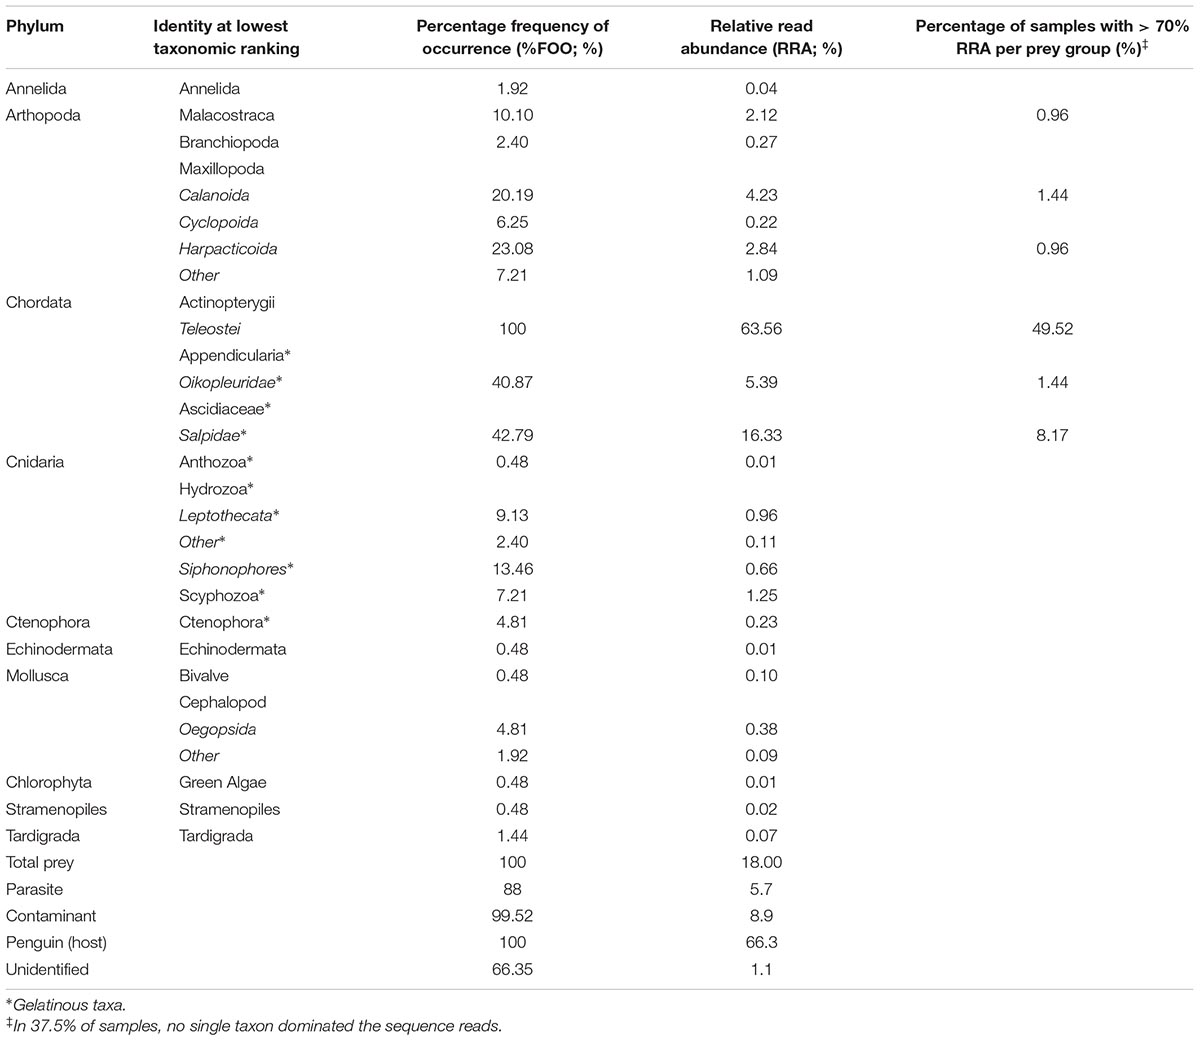
TABLE 2. Sequences uncovered in the feces of little penguins Eudyptula minor on Phillip Island during the 2015–2016 breeding season, using the universal eukaryote primer, 18S_SSU (18S rDNA, McInnes et al., 2017a).
Diet Composition
Fish (Actinopterygii) were present in all samples with prey DNA detected (frequency of occurrence; %FOO: Table 2) and accounted for 63.6% of prey sequences across all samples (RRA: Table 2). Of the 16 other taxa detected in the food dataset, only nine accounted for more than 0.5% of prey sequences each (Table 2). Gelatinous plankton accounted for 5 of the 10 most common taxa in the samples, were present in 76% of samples (%FOO) and represented almost 25% of all prey sequences (RRA). Of these, salps were present in 43% of samples, and comprised 16% of prey sequences, while oikopleurids (appendicularians) were present in 41% of samples but accounted for only 5% of prey sequences. Siphonophore and leptothecate hydrozoans were present in 13 and 9% of samples respectively, and accounted for less than 1% of prey sequences each. True jellies (Scyphozoa) were present in 7% of samples and accounted for 1.25% of prey sequences. Crustaceans and cephalopods accounted for four of the 10 most common taxa. Crustaceans were present in 48% of samples and accounted for 11% of prey sequences. Of these, free-living calanoid and harpacticoid copepods were present in 20 and 23% of samples, but accounted for only 4 and 3% of prey sequences respectively. Malacostraca occurred in 10% of samples but represented only 2% of prey sequences. Squid (Oegopsida) were present in 5% of samples and accounted for less than 1% of prey sequences. No differences were found between the Penguin Parade and Radio-tracking Bay in terms of broad diet composition (Supplementary Figure S1) and so site was not considered in further analyses, other than as a random effect.
Dominant Taxa in Individual Samples
Sixty two per cent of samples were dominated by sequences from a single prey group that accounted for 70% of the reads or more (Figure 1). Most of these samples were dominated by fish sequences. Almost 10% of samples were dominated by gelatinous salps, while only 1–1.5% of samples were dominated by copepods (calanoids and harpacticoids), oikopleurids, or malacostracan sequences.
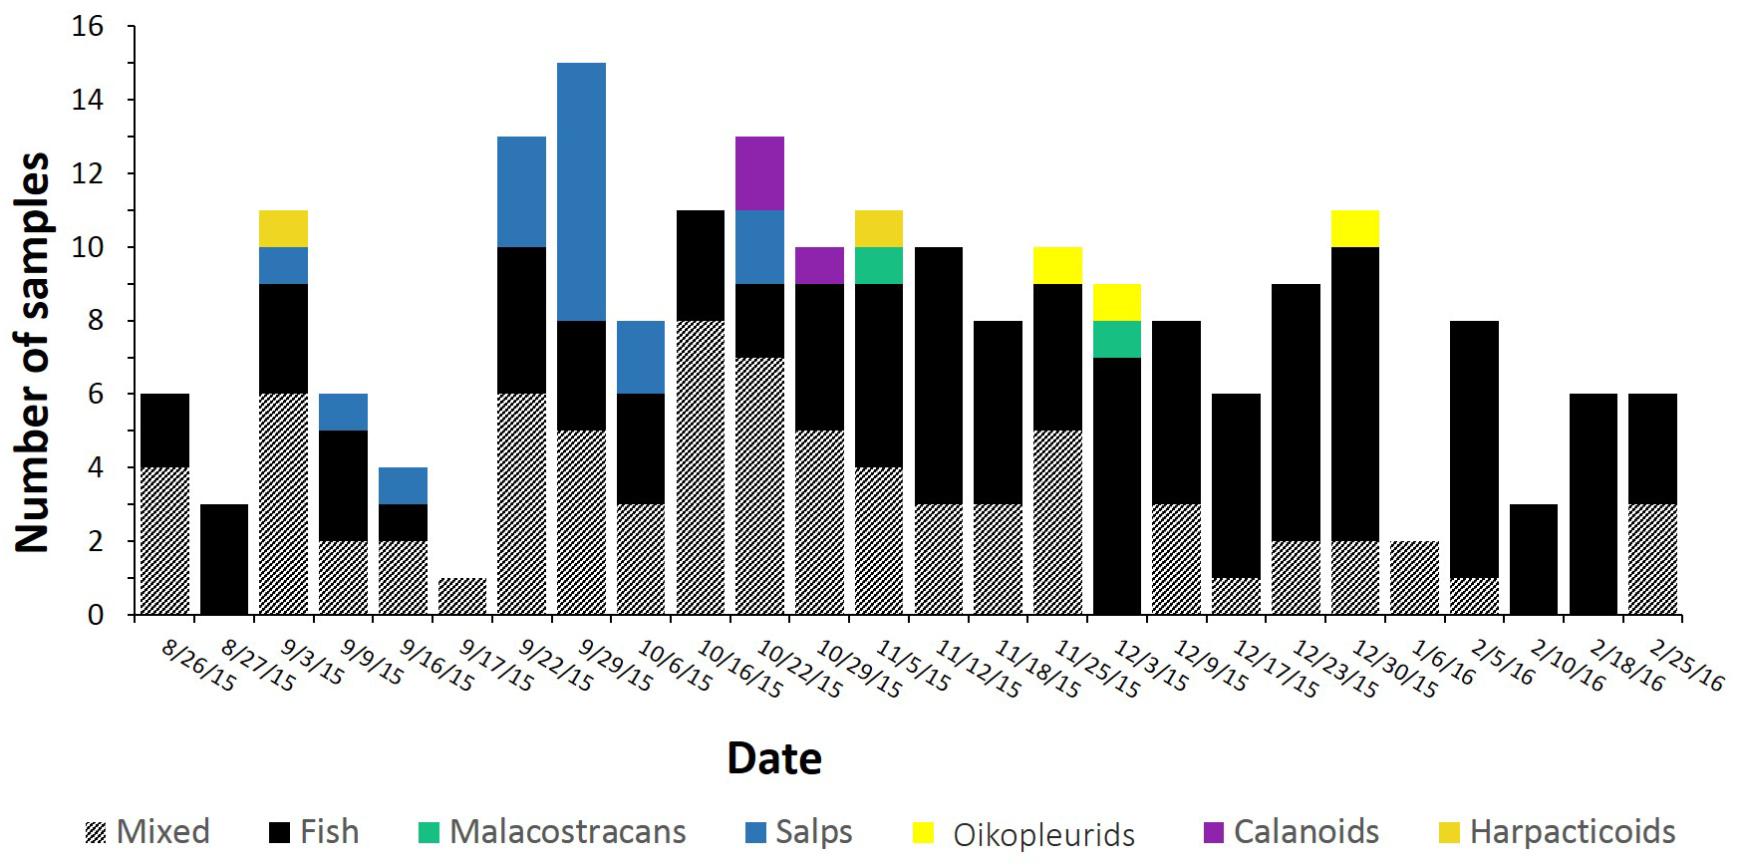
FIGURE 1. Sample numbers for each sampling date, colored according to dominant prey type. The dominant prey type was calculated as the taxon that constituted more than 70% of DNA sequences in that sample. Samples where no single prey type dominated were classed as “mixed.” On the y-axis, each tick mark represents one sample. Note that although samples from January are included here, these were not incorporated in further analyses due to insufficient sample size.
Diet in Relation to Month of the Year
Frequency of Occurrence (%)
The frequency of occurrence of different taxa varied over months of the breeding season (Figure 2A), however, based on an alpha level of 0.01, only 2 of the 10 most common prey items varied significantly and these were salps and squid (Figure 2B; χ2 = 201.91, df = NA, p < 0.01). Fish were the most common item present, occurring in all samples, and squid occurred the least often, appearing in only November and December. The free-living calanoid copepods and the oikopleurid tunicates were the only taxa other than fish to occur across all 5 months sampled. Salps were present during August to November only and were significantly more common than expected in September. Squid were only present in the diet in 2 months (November and December) and were significantly more common than expected in December.
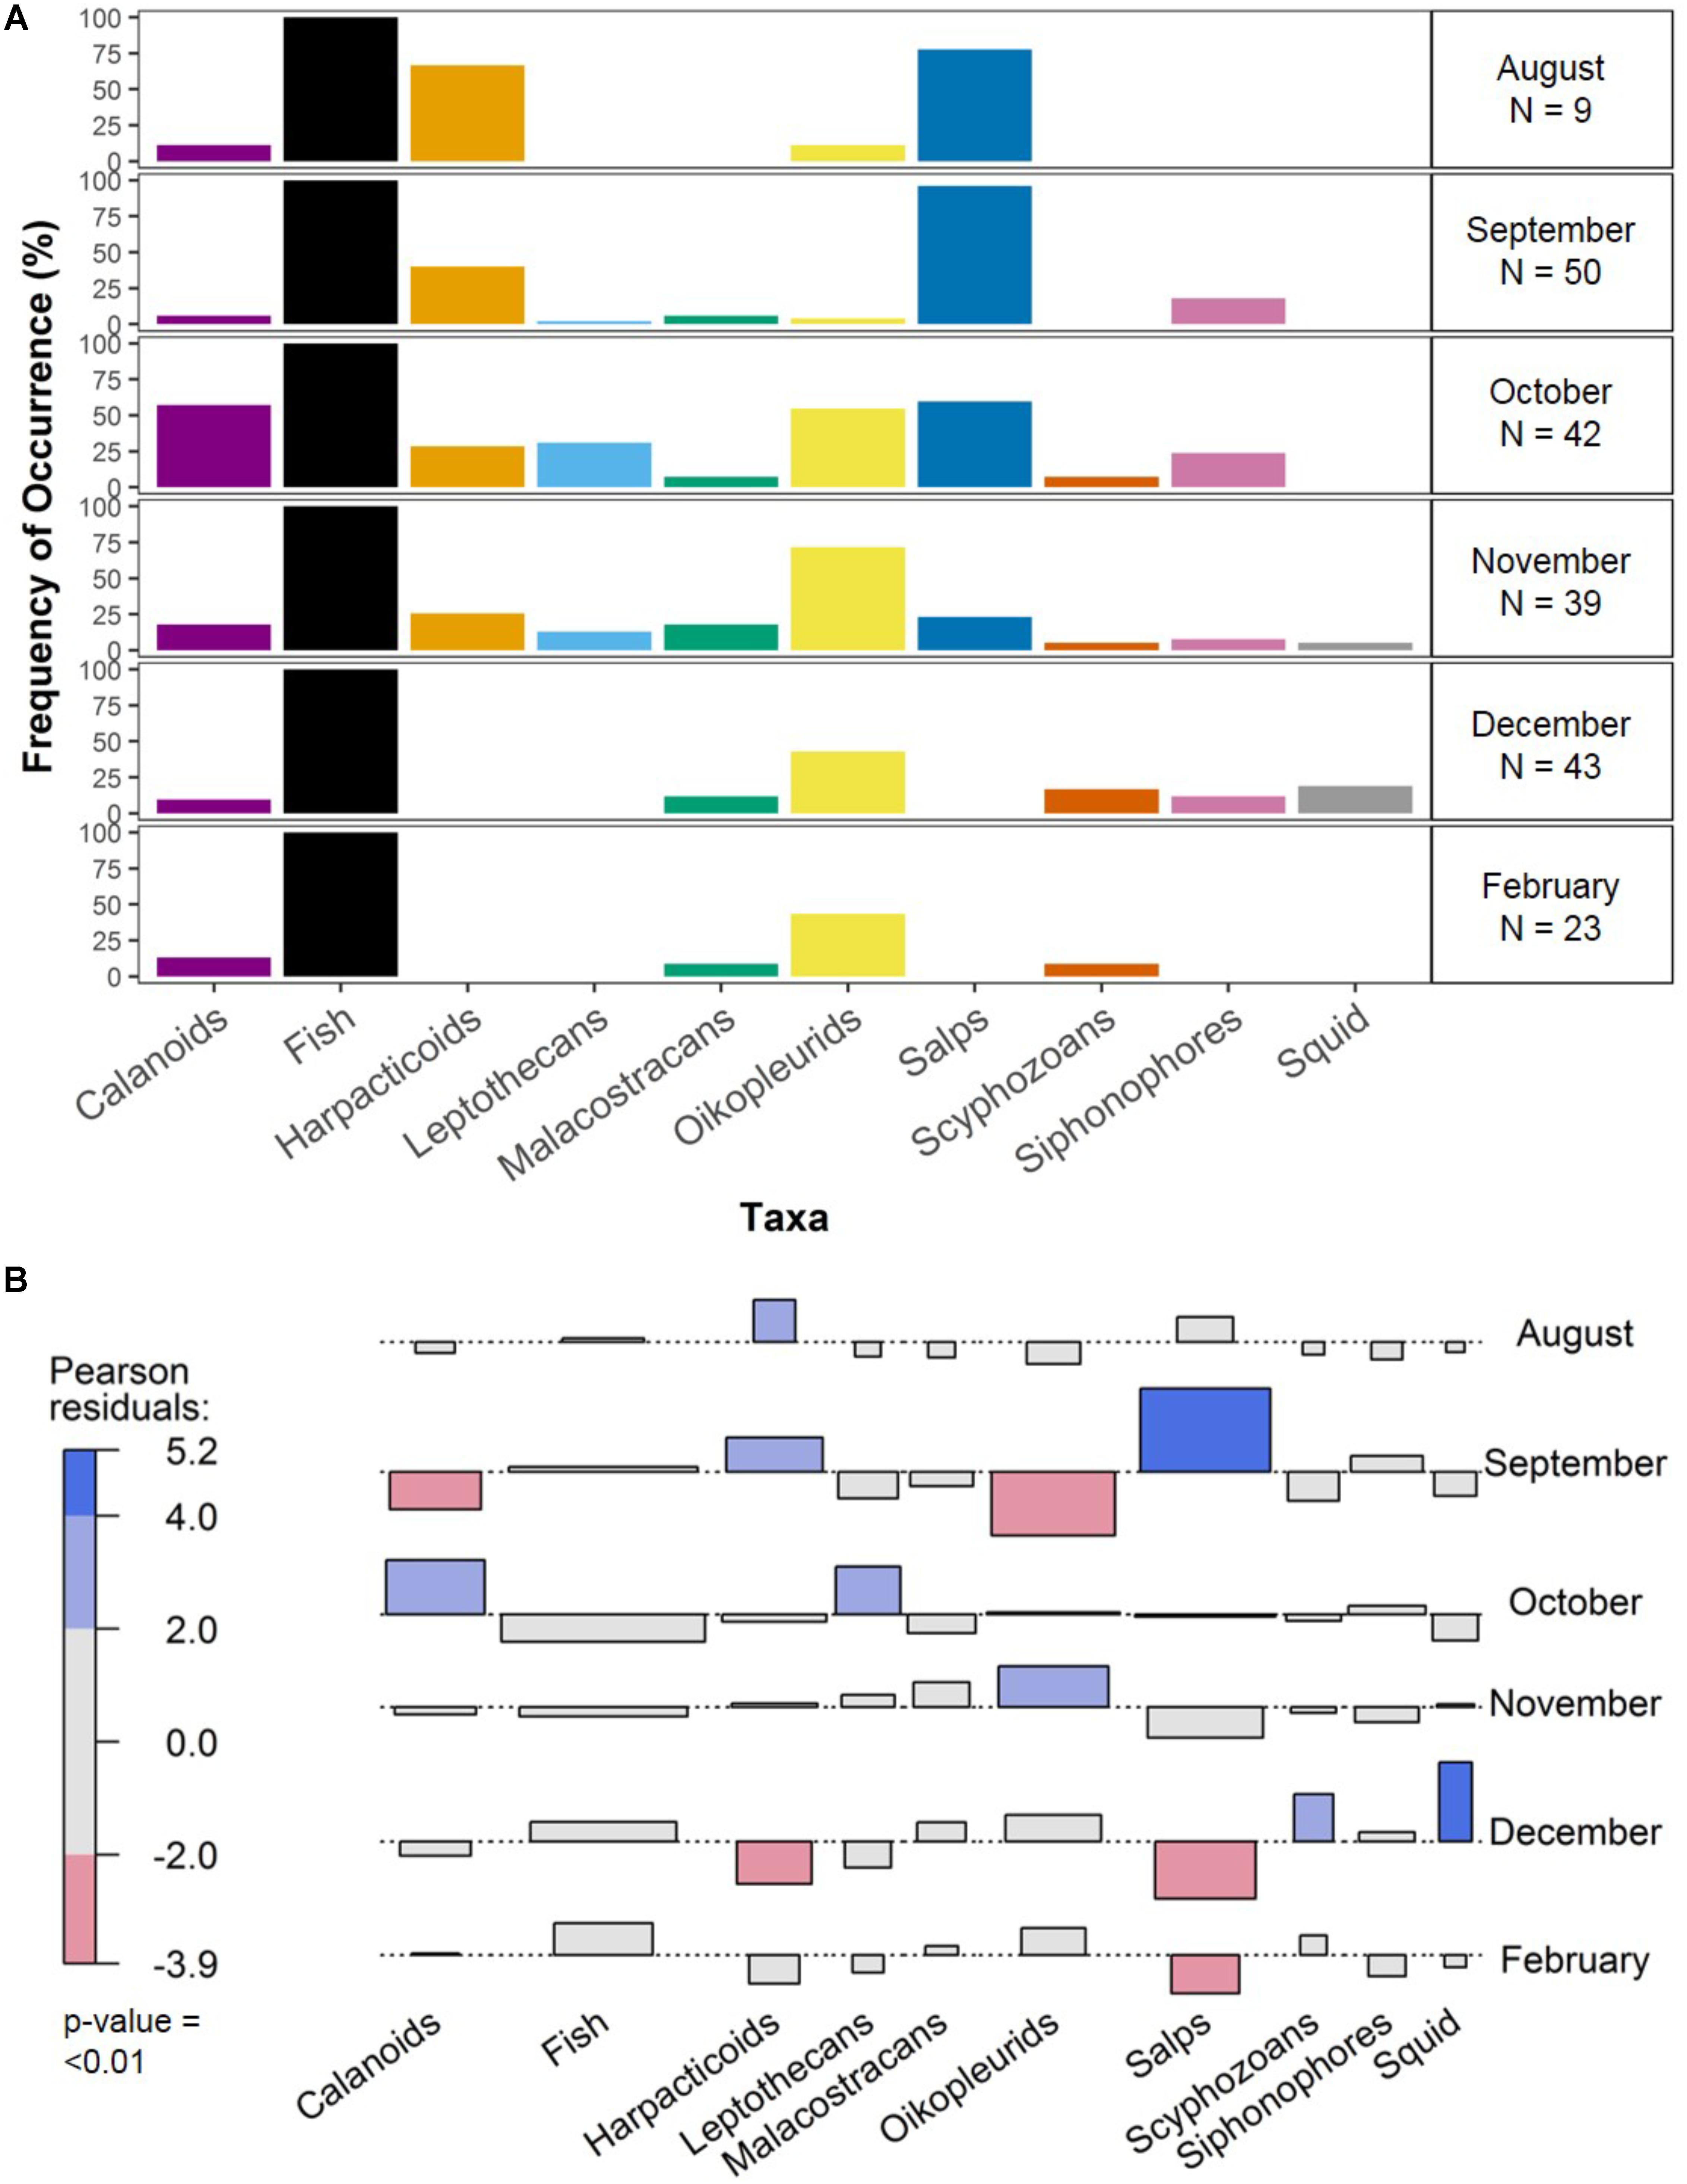
FIGURE 2. The frequency of occurrence (%) of the 10 most common taxa in fecal samples over surveyed months of the breeding season. The percentages for each taxon over months are shown along with number of samples per month (A) and the association plot (B) illustrates significant differences between observed and expected numbers of samples containing taxa in each month, based on Pearson residuals. Red or blue shading indicates significance level. Light shading indicates p-values between 0.05 and 0.01, while bold shading indicates p-values < 0.01. In our analysis, we have accepted only significant values less than 0.01. Note that January was not incorporated in analyses due to insufficient sample size.
Relative Read Abundance (%)
The relative abundance of individual taxa varied over months of the breeding season (Figure 3) with nine out of 10 of the most common taxa showing a significant difference in abundance in one or more months (F = 61.06, df = 59, p < 0.001). Fish sequences showed a highly significant trend over months, being least abundant in September and October, increasing in abundance from October to February and accounting for more than 90% of the reads in February. Salp sequences were significantly more abundant in September, with raised abundance in August and September compared to November and December, when the taxon was in very low abundance, and February, when no salps were recorded. Oikopleuran sequences were most abundant in November and December, and calanoid copepods and Leptothecan hydrozoan sequences were most abundant in October. The random effect of burrow nested in site accounted for 0.5% of the variation in this data, while the random effect of site accounted for less than 0.001%.
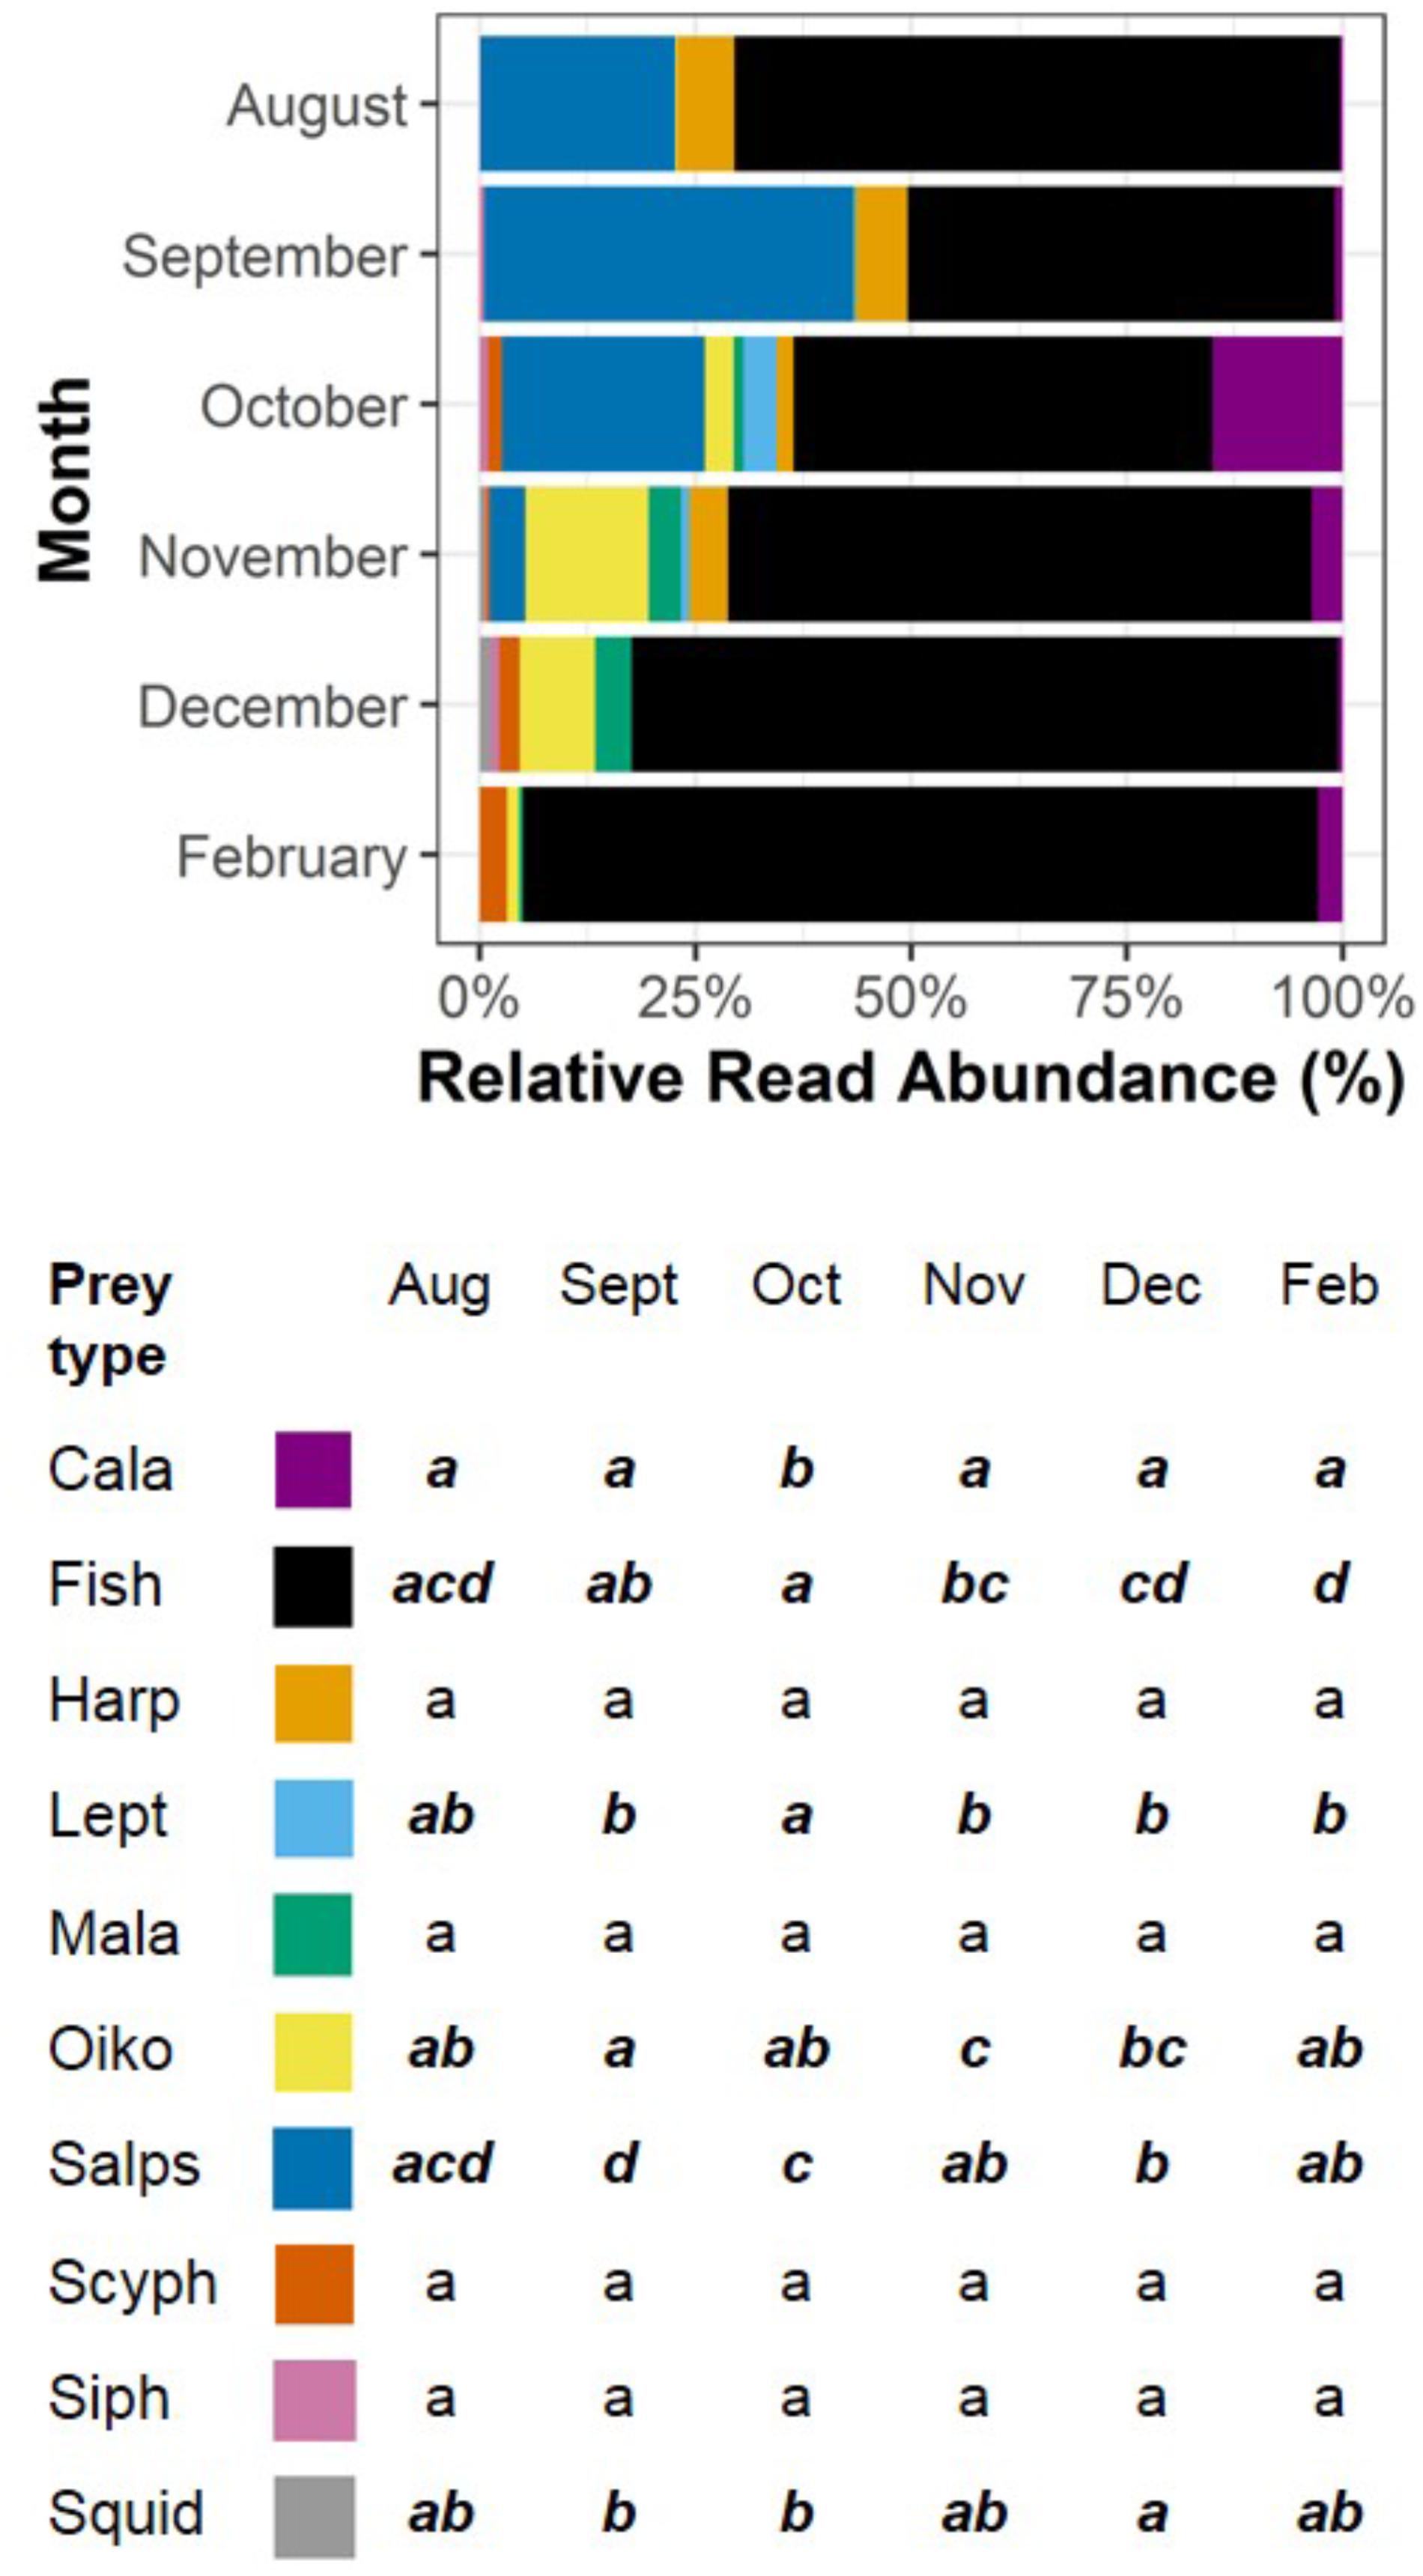
FIGURE 3. The RRA (%) of the 10 most common taxa in fecal samples over surveyed months of the breeding season. The percentages for each taxon over months are accompanied by a compact letter display indicating significant differences between months. Months with the same letter are considered similar to each other, and months with different letters are considered significantly different from one another. Significant differences are also denoted by bold, italic text. Note that January was not included in analyses due to insufficient sample size. Taxa are Cala = Calanoids, Fish, Harp = Harpacticoids, Lept = Leptothecans, Mala = Malacostracans, Oiko = Oikopleurids, Salps, Scyph = Scyphozoans, Siph = Siphonophores, and Squid.
Diet in Relation to Breeding Stage
Frequency of Occurrence (%)
We conservatively conclude that no group varied significantly over stages in terms of frequency of occurrence, based on an alpha level of 0.01 (Figure 4; χ2 = 33.221, df = NA, p = 0.015). Fish were recorded in all samples. Scyphozoa and squid occurred only during guard and post-guard in a low number of samples, such that these were not significantly different to the zero counts in incubation.
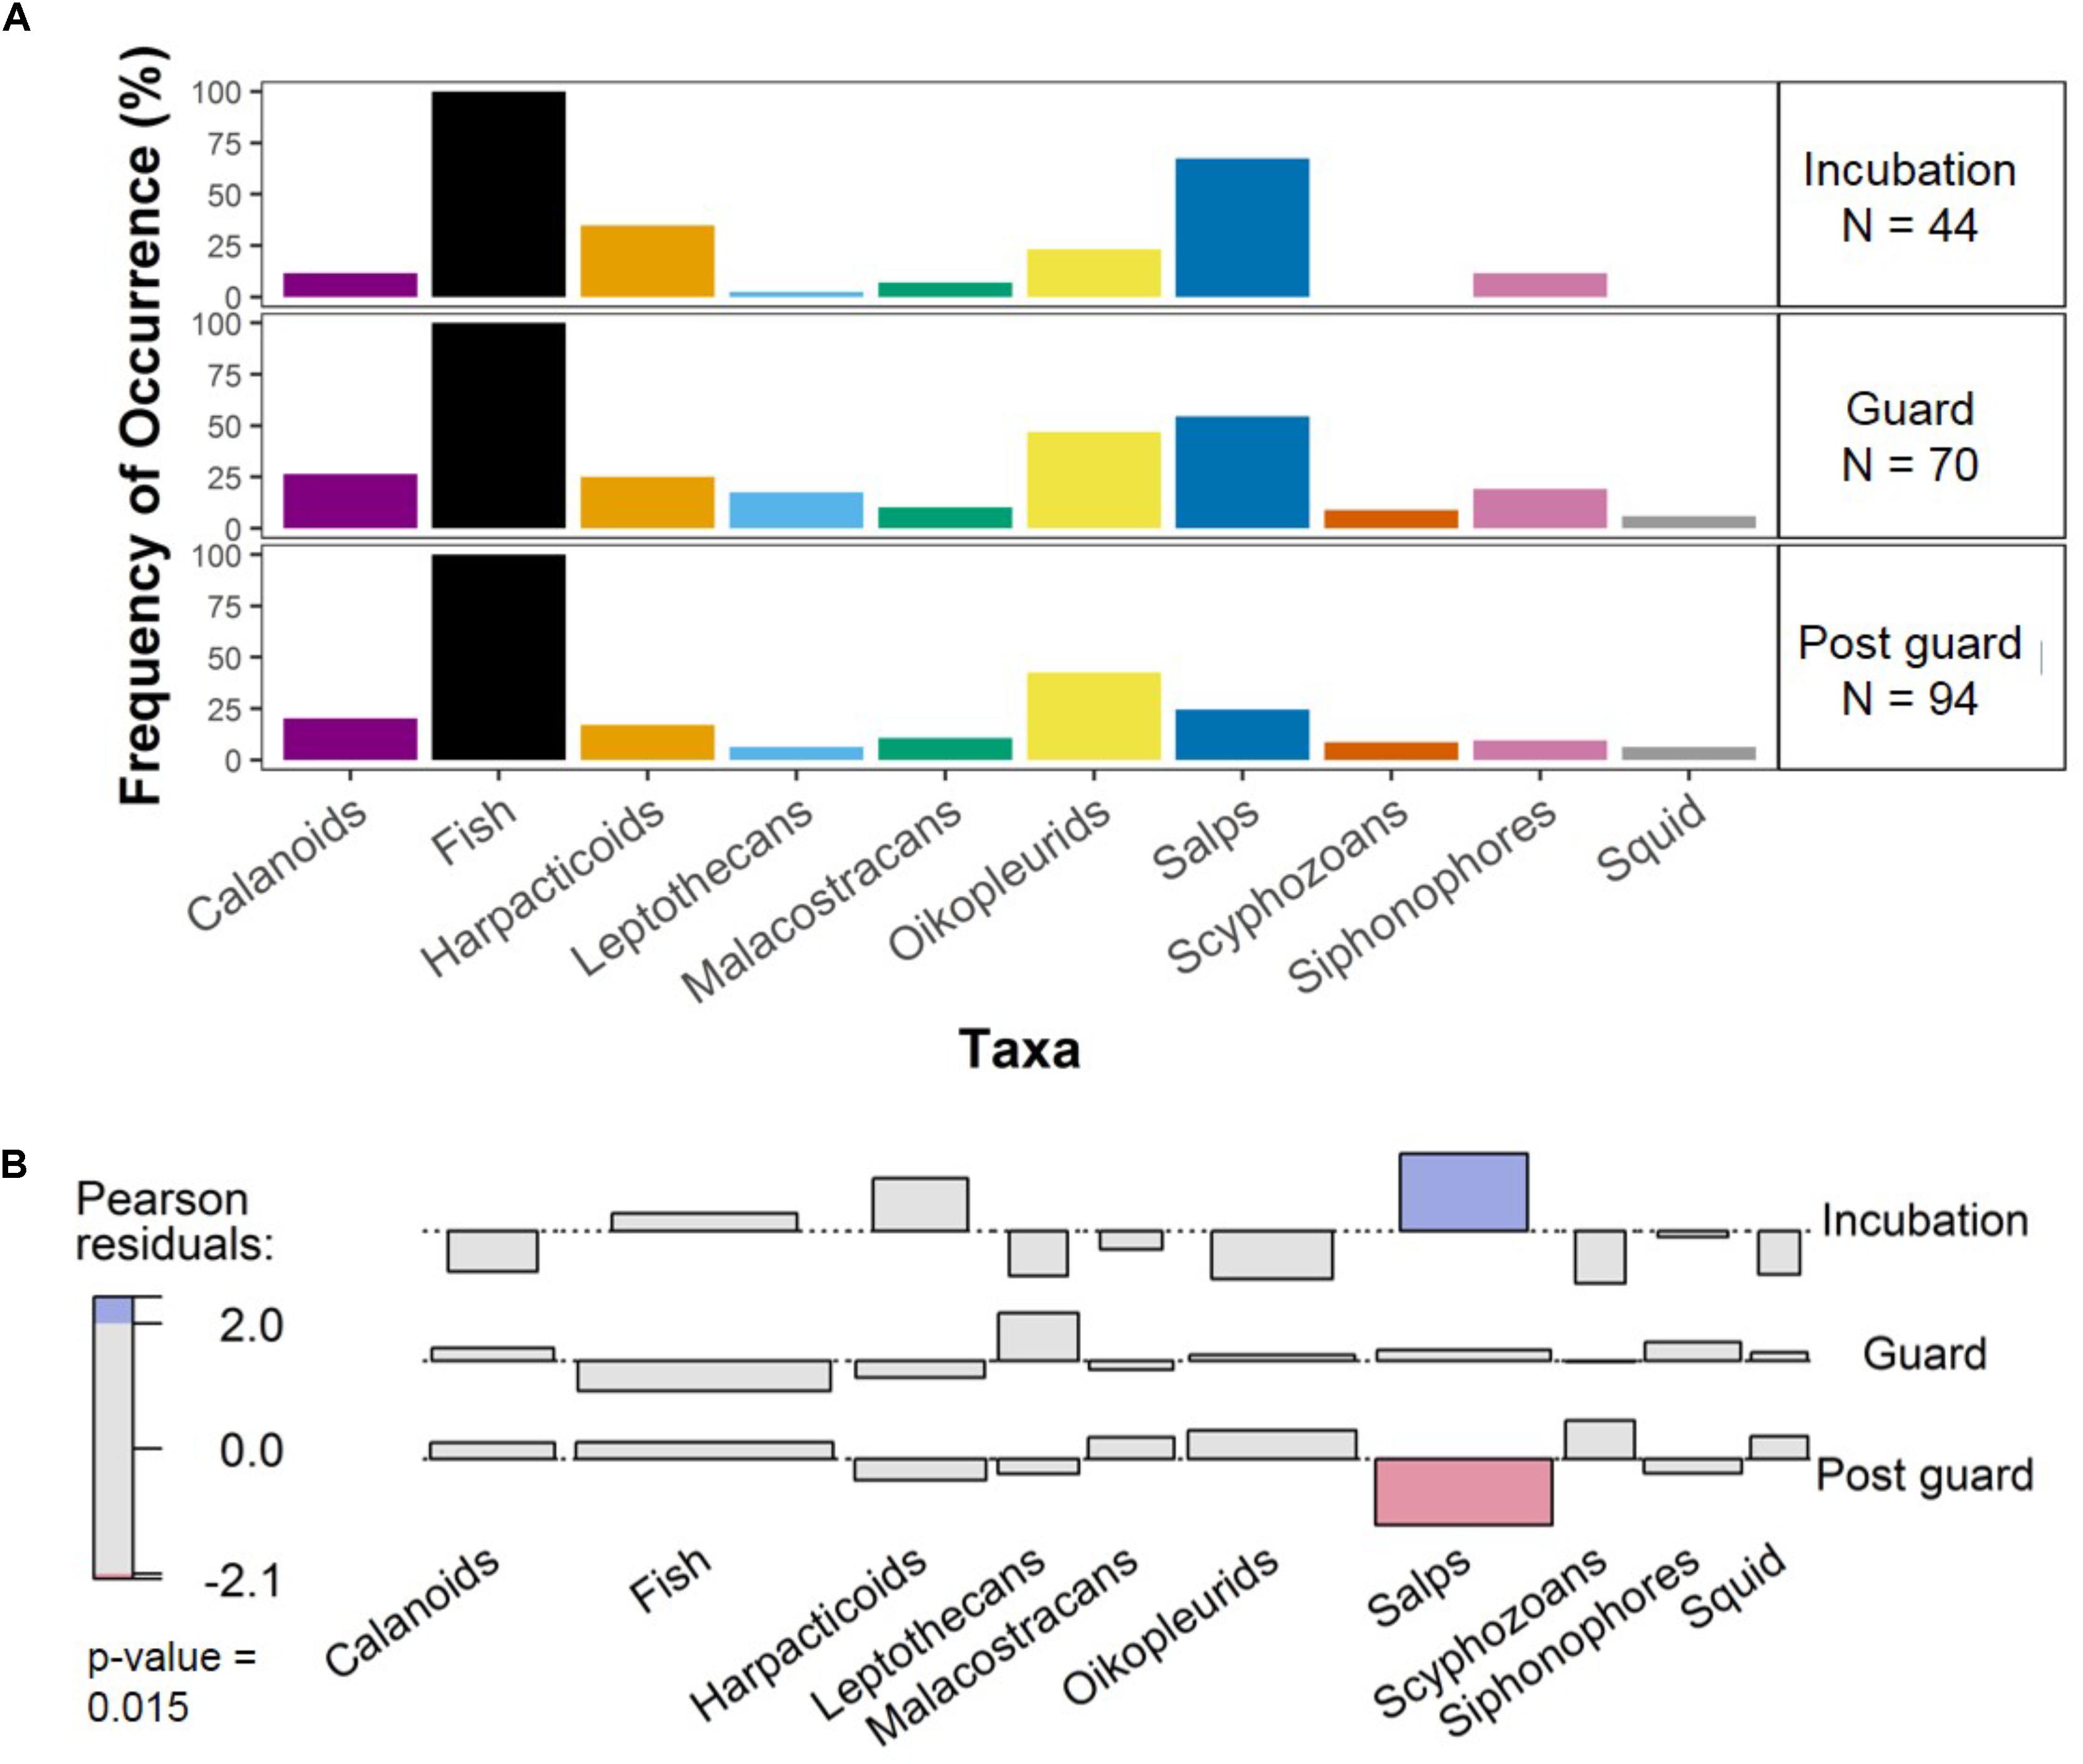
FIGURE 4. The frequency of occurrence (%) of the 10 most common taxa in fecal samples over breeding stages. The percentages for each taxon over breeding stages are shown along with number of samples per stage (A) and the association plot (B) illustrates significant differences between observed and expected numbers of samples containing taxa at each breeding stage, based on Pearson residuals. Red or blue shading indicates significance level. Light shading indicates p-values between 0.05 and 0.01, while bold shading indicates p-values < 0.01. In our analysis, we have accepted only significant values less than 0.01. Note that January was not incorporated in analyses due to insufficient sample size.
Relative Read Abundance (%)
The RRA of taxa varied significantly over breeding stages (Figure 5), with 6 out of the 10 most common taxa showing a significant difference in abundance between two or more stages (F = 66.56, df = 29, p < 0.001). Most pronounced were the trends in fish and salps. Salp sequences were most abundant during incubation, and decreased to less than 20% of the reads in post-guard. Fish sequences were most abundant during post-guard. Oikopleurids, harpacticoid copepods, leptothecans, and scyphozoans also varied significantly over breeding stages, but there were no differences in calanoid copepods, malacostracans, siphonophores, or squid. As random effects, both burrow nested in site and site accounted for less than 0.001% of the variation in this data.
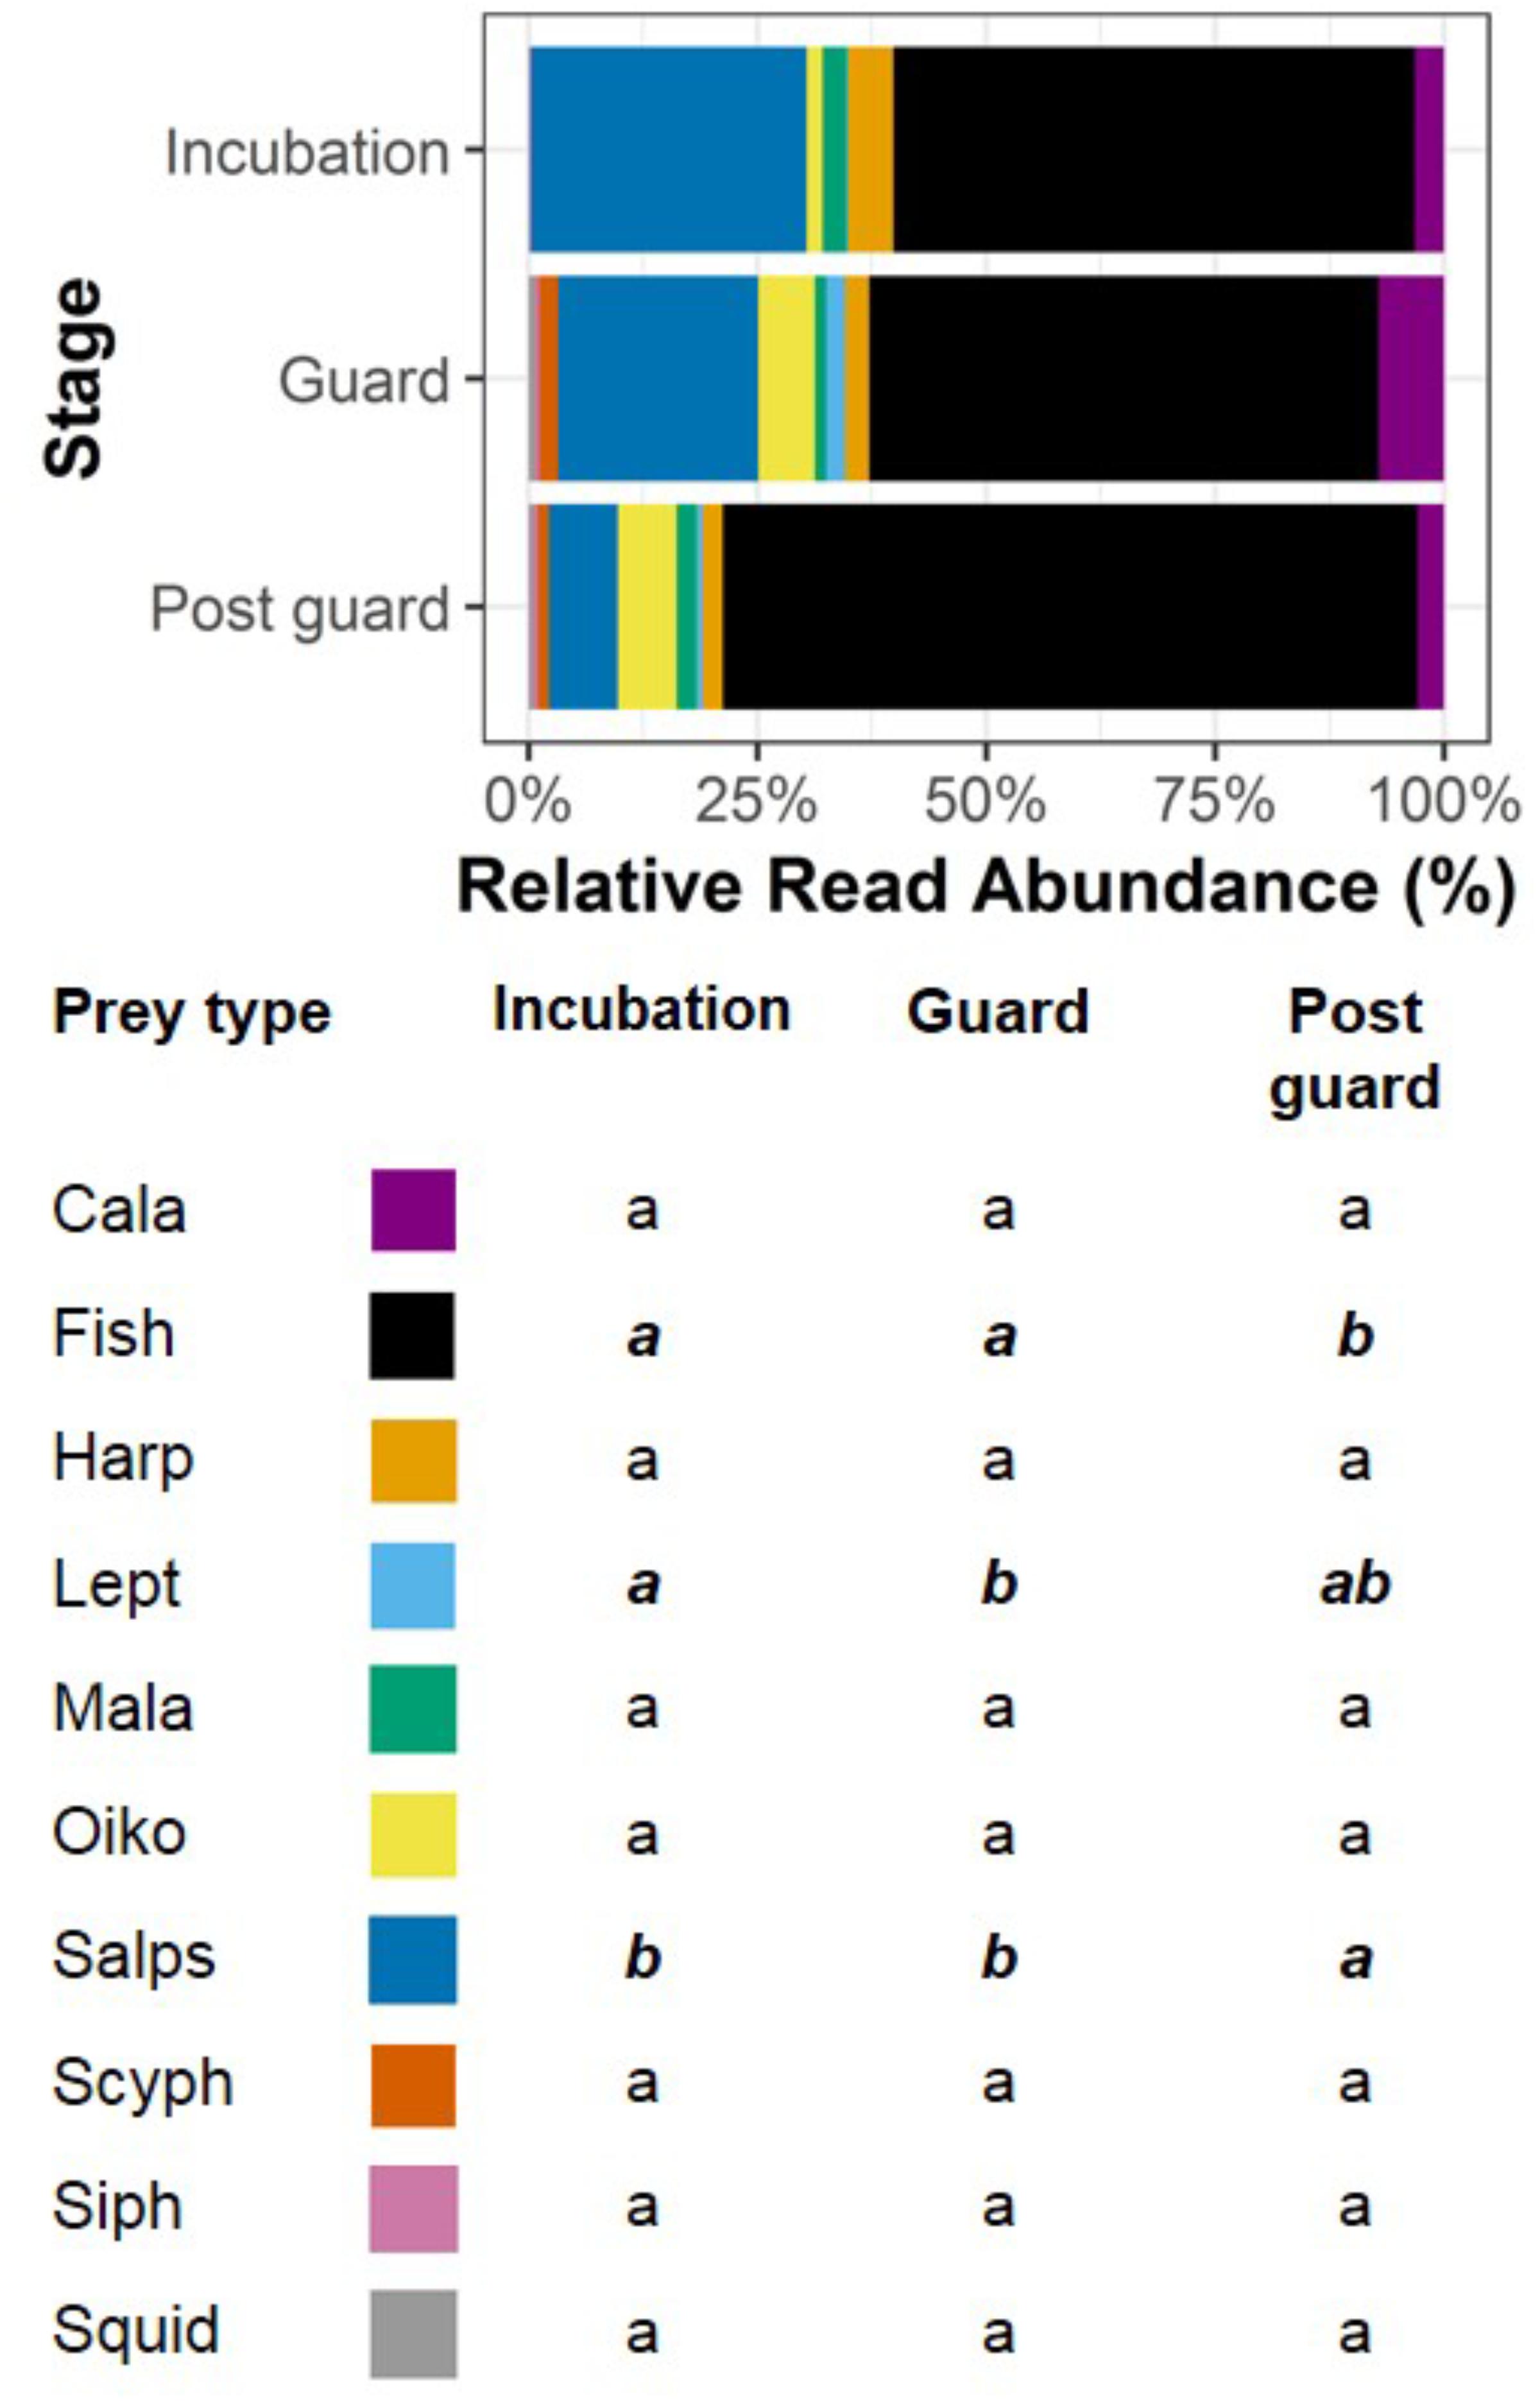
FIGURE 5. The relative read abundance (RRA) (%) of the 10 most common taxa in fecal samples over breeding stages. The percentages for each taxon over stages are accompanied by a compact letter display indicating significant differences between breeding stages. Breeding stages with the same letter are considered similar to each other, and months with different letters are considered significantly different from one another. Significant differences are also denoted by bold, italic text. Note that January was not incorporated in analyses due to insufficient sample size. Taxa are Cala = Calanoids, Fish, Harp = Harpacticoids, Lept = Leptothecans, Mala = Malacostracans, Oiko = Oikopleurids, Salps, Scyph = Scyphozoans, Siph = Siphonophores, and Squid.
Discussion
We confirm a fish-dominated diet in little penguins that includes a wide variety of other items. We revealed the presence of gelatinous and crustaceous plankton taxa not recorded by previous little penguin studies (e.g., Klomp and Wooller, 1988; Cullen et al., 1992; Flemming et al., 2013; Kowalczyk et al., 2015; Chiaradia et al., 2016). Though DNA metabarcoding made it possible to detect these cryptic taxa, it cannot describe whether items were ingested intentionally or incidentally (Sheppard et al., 2005). Consequently, some taxa recorded in our study may represent secondary predation by penguins (Sheppard et al., 2005), but their presence indicates a trophic role for newly recorded taxa and how they may contribute to energy flow through food webs. Further, getting an accurate measure of a predator’s diet is always challenging, and in the case of DNA-based results, some biases could occur due to variation in trip duration, time since consumption and differential digestion rates among prey taxa (Thomas et al., 2014; Deagle et al., 2018). However, dietary DNA persists in the gut and feces of predators for four days (Deagle et al., 2010), and should reflect full diet.
We recorded a surprisingly high frequency and abundance of salp sequences in the diet of this predominately piscivorous predator. Not only did salps appear in >40% of fecal samples and constitute >16% of reads in the dataset, they were the dominant taxon in 8% of samples, suggesting they were likely to have been targeted prey in many cases. Salps, and other gelatinous plankton, have traditionally been thought to be of minor importance as prey items to higher trophic levels owing to their poor nutritional content (e.g., Doyle et al., 2007). Due to this low nutritional content, animals known to routinely feed on gelatinous plankton, such as the leatherback turtle (Dermochelys coriacea) and the ocean sunfish (Mola mola), have a low metabolic rate (Davenport, 1998; Houghton et al., 2006). In contrast, gelatinous plankton alone may not sustain endotherms such as marine mammals and birds that have high metabolic rates. However, despite being an order of magnitude lower in energy density than fish, cephalopods or crustaceans, salps can be equally or even more energy rich than scyphozoans (salps 0.43, scyphozoans 0.41, fish 8.4, squid 5.46 kJ g-1 wet mass: Cardona et al., 2012); krill 3.03 kJ g-1 wet mass: Gales and Green, 1990), which many seabirds are known to eat (Thiebot et al., 2016, 2017; McInnes et al., 2017b) and on which predation by little penguins was recorded in the wider region (Thiebot et al., 2017). The aforementioned study did not record predation on salps by little penguins, however the authors note that they “seldom, if ever” observed salps in videos, suggesting that there were few recorded opportunities for predation.
Salps are commonly targeted by larval and small pelagic fish (Young et al., 1997; Mianzan et al., 2001), and these are important prey items for many seabirds and marine mammals, including little penguins (Chiaradia et al., 2003). Given that fish occurred in all samples, salp presence could result from penguins eating fish that have recently fed on salps. However, we would expect the RRA to be much lower if their occurrence in the diet was due to secondary predation alone. Around half of the salp-dominated samples contained less than 10% fish sequences, and many of these contained less than 5% fish sequences. Further, there is no information to suggest that the DNA of salps or other ascidians are preferentially recovered by the DNA barcode marker we used. Indeed, the other ascidian in the dataset (Oikopleuridae) is recorded only in low abundance and salps are rare in other seabird diet datasets generated with this DNA marker (McInnes et al., 2017b). Finally, because gelatinous tissue degrades so rapidly in comparison to other tissues, it is unlikely that enough salp DNA would persist through two rounds of digestion to create the signal seen in our dataset. Thus, little penguins do appear to directly feed on salps, which are known in the diet of other endotherms (Childerhouse et al., 2001; Cruz et al., 2001; Hedd and Gales, 2001), and even fed to offspring (Cruz et al., 2001).
Small crustaceous copepods and gelatinous oikopleurids, as well as gelatinous Scyphozoa and Hydrozoa, were occasionally found but with very low abundance, each accounting for <2–8% of the reads in the dataset. Our results are in contrast to those by Sutton et al. (2015) who observed with video loggers that 28% of little penguin predation events included scyphozoans from one family. These contrasting results (extended in Thiebot et al., 2017) could be due to temporal and spatial variation in jelly abundance in Bass Strait between the studies, or variation in detection between methods. Given the boom-bust dynamics of scyphozoan populations (Pitt et al., 2014), it is most likely that the disparity indicates differences in local abundance between years and locations. Further, the 16S SSU primer used in this study has previously detected very high predation on Scyphozoa and other jellies by albatross species (McInnes et al., 2017b). The use of cameras and DNA barcoding simultaneously may provide more understanding on predation events and prey occurrence in dietary samples. The presence of very small copepods and oikopleurids (<5 mm) may represent secondary predation events and so patterns observed in these tiny taxa may reflect their changing availability to fish, or predation by penguins on different fish species. Detection of these tiny and cryptic taxa can help us improve the trophic links within the broader little penguin food web.
We detected low presence of cephalopods and malacostraca in the diet of little penguins, although both have been detected previously (Klomp and Wooller, 1988; Flemming et al., 2013; Kowalczyk et al., 2015; Sutton et al., 2015; Chiaradia et al., 2016). While the presence of malacostraca has never been high in little penguin diet analyses, cephalopods can be quite common in their diet (30–60%: Chiaradia et al., 2016). High presence of cephalopods in penguins’ diet has been associated with years of low food availability (Cullen et al., 1992; Chiaradia et al., 2003). Given our study season was one of very high breeding success (2.15 chicks per pair), which suggests high food availability (Chiaradia and Nisbet, 2006), this may explain the low presence of cephalopods. Another possibility is that predation on this group has been overestimated in the past, given the tendency for hard parts such as squid beaks to be retained in the stomachs and thereby overrepresented in stomach content analysis (van Heezik and Seddon, 1989). Indeed, no little penguins were observed to prey upon cephalopods during Sutton and colleague’s video-logging and only three predation events included krill (Sutton et al., 2015) although we do not know how often opportunities to prey on these sources presented themselves. Finally, it is unlikely but possible that low cephalopod records were the result of technical bias in the metabarcoding (see McInnes et al., 2017b). Further analysis across years should be undertaken to resolve this uncertainty, ideally alongside DNA markers designed for squid and concurrent stable isotope and stomach contents sampling to clarify method-specific biases.
The Role of Salps in a Piscivorous Diet
The high presence and relative abundance of salps shows they may have a role in the diet of this largely piscivorous species for while relative abundance does not necessarily reflect true mass proportions, it is a useful proxy (Deagle et al., 2018). Salp-dominated samples occurred in all three breeding stages but were restricted to September and October, which coincide with a peak in the incubation. In contrast, fish increased over stages and were in highest proportion in the post-guard stage; a period when a nutrient-rich diet is important for the body condition of chicks (Chiaradia et al., 2003). Avoidance of lower nutrition prey during chick-raising stages by penguins would explain the negative trend we found between salps and breeding stage, but the fact that salp sequences constituted more than a third of the diet sequences during September, with raised sequence proportions in August and October, may signpost an extrinsic influence. Raised salp occurrence and proportions may indicate the presence of a salp bloom during this time within the foraging range of penguins at our study sites. Salp blooms are notorious for blanketing large areas and excluding other planktonic species (Siegel and Harm, 1996; Verity and Smetacek, 1996; Lee et al., 2010) and other consumers have been shown to feed on salps as stomach fillers when other prey is scarce (Mianzan et al., 2001). Furthermore, it is well-known that in SE Australia salp blooms are most prevalent in August, September, and October (Henschke et al., 2015), exactly the time of year when they appeared maximally abundant in the diet of little penguins (Supplementary Figure S2). For example, Thalia democratica is the most abundant salp in the Tasman Sea with individual zooids, around 1 cm in size, and has been reported to reach densities of up to 1312 individuals/m3 (Henschke et al., 2014). In such dense blooms the low energy density of salps is presumably offset by the ease with which large numbers can be consumed. So the most parsimonious explanation of our findings is that penguins opportunistically feed on salps when they happen to encounter blooms.
Based on studies of the biochemical and nutritional composition of salps, we do not believe that they contain any limiting resource that penguins would be targeting, but it remains a possibility. The organic content of salps is high in protein and crude fiber (Madin et al., 1981; Amorocho and Reina, 2007), though they are predominantly composed of water (Dubischar et al., 2012), and it has also been suggested that predators may target their visible stomachs, which contain densely packed diatoms and other phytoplankton (Gili et al., 2006), linking primary productivity to higher trophic levels through these direct grazers. Although salps could act as a source of calcium (Caron et al., 1989), by making concentrated diatomaceous calcium available to larger consumers, little penguins are easily able to obtain this resource by swallowing shell grit on the shoreline (Wasiak, 2008).
Shedding Light on Temperate Inshore Food Webs
Regardless of whether taxa uncovered by metabarcoding were obtained through primary or secondary ingestion, this method provides an avenue for capturing food web and population dynamics in gelatinous and otherwise cryptic taxa. Given the method is not taxon-specific, and is non-invasive, a wide variety of range-restricted, central-placed foragers could be used to capture inshore gelatinous patterns of abundance, and resolve trophic links. By pairing a short-range forager with sympatric long-range foragers, such as seals or shearwaters, it would be possible to capture whole-of-ecosystem patterns. Since jellies are expected to flourish under increasingly disturbed conditions while most other taxa are expected to suffer (Richardson et al., 2009; Purcell, 2012) tracking their changing abundance and distribution is of utmost importance if we are to mitigate flow on effects to other taxa (Purcell and Arai, 2001; Pakhomov et al., 2002; Henschke et al., 2016). This method also offers an efficient approach to track cycles of ecologically important taxa, such as small pelagic fish, in locations that are not subject to regular commercial fishing-based surveys, providing important data for ecosystem managers and those managing populations of threatened predators.
Data Accessibility
The datasets generated and analyzed for this study can be found in the FigShare repository:
molecular Operational Taxonomic Units (mOTUs)
https://doi.org/10.26180/5b9614c84773f
SILVA library w FOO and RRA calculation
https://doi.org/10.26180/5b9614661e54e
Frequency of occurrence used in analyses
https://doi.org/10.26180/5b96151bc3f3a
Relative Read Abundance used in analyses
https://doi.org/10.26180/5b961569647e1.
Author Contributions
CC, RR, AC, BD and GH, conceived the project. CC and SS performed the fieldwork. CC lead the laboratory analysis. BD and JM assisted with bioinformatics. CC conducted the statistical analysis and led the writing with contributions from all authors.
Funding
This work was supported by ARC Linkage Project grant LP140100404 awarded to RR, AC, GH, and BD.
Conflict of Interest Statement
The authors declare that the research was conducted in the absence of any commercial or financial relationships that could be construed as a potential conflict of interest.
Acknowledgments
We thank Andrea Polanowski and Cassy Faux from the Australian Antarctic Division Ecological Genetics group for their training and assistance in the DNA metabarcoding. We also thank C. Johnstone at Monash University for his assistance with the statistical analysis. We also thank the staff at Phillip Island Nature Parks and appreciate their continued support.
Supplementary Material
The Supplementary Material for this article can be found online at: https://www.frontiersin.org/articles/10.3389/fmars.2018.00381/full#supplementary-material
References
Amorocho, D. F., and Reina, R. D. (2007). Feeding ecology of the East Pacific green sea turtle Chelonia mydas agassizii at Gorgona National Park, Colombia. Endanger. Species Res. 3, 43–51. doi: 10.3354/esr003043
Arai, M. (2005). Predation on pelagic coelenterates: a review. J. Mar. Biol. Assoc. U.K. 85, 523–536. doi: 10.1017/S0025315405011458
Arai, M. N., Welch, D. W., Dunsmuir, A. L., Jacobs, M. C., and Ladouceur, A. R. (2003). Digestion of pelagic ctenophora and cnidaria by fish. Can. J. Fish. Aquat. Sci. 60, 825–829. doi: 10.1139/f03-071
Aubert, A., Antajan, E., Lynam, C., Pitois, S., Pliru, A., Vaz, S., et al. (2018). No more reason for ignoring gelatinous zooplankton in ecosystem assessment and marine management: concrete cost-effective methodology during routine fishery trawl surveys. Mar. Policy 89, 100–108. doi: 10.1016/j.marpol.2017.12.010
Bates, D., Maechler, M., Bolker, B., and Walker, S. (2014). lme4: linear mixed-effects models using Eigen and S4. J. Stat. softw. 1, 1–23.
Binladen, J., Gilbert, M. T., Bollback, J. P., Panitz, F., Bendixen, C., Nielsen, R., et al. (2007). The use of coded PCR primers enables high-throughput sequencing of multiple homolog amplification products by 454 parallel sequencing. PLoS One 2:e197. doi: 10.1371/journal.pone.0000197
Boyer, S., Cruickshank, R. H., and Wratten, S. D. (2015). Faeces of generalist predators as ‘biodiversity capsules’: a new tool for biodiversity assessment in remote and inaccessible habitats. Food Webs 3, 1–6. doi: 10.1016/j.fooweb.2015.02.001
Braley, M., Goldsworthy, S. D., Page, B., Steer, M., and Austin, J. J. (2010). Assessing morphological and DNA-based diet analysis techniques in a generalist predator, the arrow squid Nototodarus gouldi. Mol. Ecol. Resour. 10, 466–474. doi: 10.1111/j.1755-0998.2009.02767.x
Brodeur, R. D., Link, J. S., Smith, B. E., Ford, M. D., Kobayashi, D. R., and Jones, T. T. (2016). Ecological and economic consequences of ignoring jellyfish: a plea for increased monitoring of ecosystems. Fisheries 41, 630–637. doi: 10.1080/03632415.2016.1232964
Cardona, L., Álvarez De Quevedo, I., Borrell, A., and Aguilar, A. (2012). Massive consumption of gelatinous plankton by Mediterranean apex predators. PLoS One 7:e31329. doi: 10.1371/journal.pone.0031329
Caron, D. A., Madin, L. P., and Cole, J. J. (1989). Composition and degradation of salp fecal pellets: implications for vertical flux in oceanic environments. J. Mar. Res. 47, 829–850. doi: 10.1357/002224089785076118
Chiaradia, A., Costalunga, A., and Knowles, K. (2003). The diet of little penguins (Eudyptula minor) at Phillip Island, Victoria, in the absence of a major prey - pilchard (Sardinops sagax). Emu 103, 43–48. doi: 10.1071/MU02020
Chiaradia, A., Forero, M. G., Hobson, K. A., and Cullen, J. M. (2010). Changes in diet and trophic position of a top predator 10 years after a mass mortality of a key prey. ICES 67, 1710–1720.
Chiaradia, A., Forero, M. G., McInnes, J. C., and Ramirez, F. (2014). Searching for the true diet of marine predators: incorporating Bayesian priors into stable isotope mixing models. PLoS One 9:e92665. doi: 10.1371/journal.pone.0092665
Chiaradia, A., and Kerry, K. R. (1999). Daily nest attendance and breeding performance in the Little Penguin Eudyptula minor at Phillip Island, Australia. Mar. Ornithol. 27, 13–20.
Chiaradia, A., and Nisbet, I. C. T. (2006). Plasticity in parental provisioning and chick growth in Little Penguins Eudyptula minor in years of high and low breeding success. Ardea 94, 257–270.
Chiaradia, A., Ramírez, F., Forero, M. G., and Hobson, K. A. (2016). Stable Isotopes (δ13C, δ15N) combined with conventional dietary approaches reveal plasticity in central-place foraging behavior of little penguins Eudyptula minor. Front. Ecol. Evol. 3:154. doi: 10.3389/fevo.2015.00154
Childerhouse, S., Dix, B., and Gales, N. J. (2001). Diet of New Zealand sea lions (Phocarctos hookeri) at the Auckland Islands. Wildl. Res. 28, 291–298. doi: 10.1071/WR00063
Couturier, L. I., Rohner, C. A., Richardson, A. J., Marshall, A. D., Jaine, F. R., Bennett, M. B., et al. (2013). Stable isotope and signature fatty acid analyses suggest reef manta rays feed on demersal zooplankton. PLoS One 8:e77152. doi: 10.1371/journal.pone.0077152
Cristescu, M. E. (2014). From barcoding single individuals to metabarcoding biological communities: towards an integrative approach to the study of global biodiversity. Trends. Ecol. Evol. 29, 566–571. doi: 10.1016/j.tree.2014.08.001
Cruz, J. B., Lalas, C., Jillett, J. B., Kitson, J. C., Lyver, P. O. B., Imber, M., et al. (2001). Prey spectrum of breeding sooty shearwaters (Puffinus griseus) in New Zealand. N. Z. J. Mar. Fresh. 35, 817–829. doi: 10.1080/00288330.2001.9517044
Cullen, J. M., Montague, T. I., and Hull, C. (1992). Food of little penguins Eudyptula minor in Victoria: comparison of three localities between 1985 and 1988. Emu 91, 318–341. doi: 10.1071/MU9910318
D’ambra, I., Graham, W. M., Carmichael, R. H., and Herandezs, F. J. Jr. (2015). Fish rely on scyphozoan hosts as a primary food source: evidence from stable isotope analysis. Mar. Biol. 162, 247–252. doi: 10.1007/s00227-014-2569-5
Davenport, J. (1998). Sustaining endothermy on a diet of cold jelly: energetics of the leatherback turtle Dermochelys coriacea. Br. Herp. Soc. Bull. 62, 4–8.
Deagle, B., Thomas, A. C., Mcinnes, J. C., Clarke, L. J., Vesterinen, E. J., Clare, E. L., et al. (2018). Counting with DNA in metabarcoding studies: how should we convert sequence reads to dietary data? Mol. Ecol. doi: 10.1111/mec.14734
Deagle, B. E., Chiaradia, A., Mcinnes, J., and Jarman, S. N. (2010). Pyrosequencing faecal DNA to determine diet of little penguins: is what goes in what comes out? Conserv. Genet. 11, 2039–2048. doi: 10.1007/s10592-010-0096-6
Doyle, T. K., Houghton, J. D. R., McDevitt, R., Davenport, J., and Hays, G. C. (2007). The energy density of jellyfish: estimates from bomb-calorimetry and proximate-composition. J. Exp. Mar. Bio. Ecol. 343, 239–252. doi: 10.1016/j.jembe.2006.12.010
Dubischar, C. D., Pakhomov, E. A., von Harbou, L., Hunt, B. P. V., and Bathmann, U. V. (2012). Salps in the Lazarev Sea, Southern Ocean: II. Biochemical composition and potential prey value. Mar. Biol. 159, 15–24. doi: 10.1007/s00227-011-1785-5
Edgar, R. C. (2010). Search and clustering orders of magnitude faster than BLAST. Bioinformatics 26, 2460–2461. doi: 10.1093/bioinformatics/btq461
Edgar, R. C. (2013). UPARSE: highly accurate OTU sequences from microbial amplicon reads. Nat. Methods 10, 996–998. doi: 10.1038/nmeth.2604
Flemming, S. A., Lalas, C., and Van Heezik, Y. (2013). Little penguin (Eudyptula minor) diet at three breeding colonies in New Zealand. N. Z. J. Zool. 37, 199–205.
Gales, R., and Green, B. (1990). The annual energetics cycle of little penguins (Eudyptula minor). Ecology 71, 2297–2312. doi: 10.2307/1938641
Gerwing, T. G., Kim, J. H., Hamilton, D. J., Barbeau, M. A., and Addison, J. A. (2016). Diet reconstruction using next-generation sequencing increases the known ecosystem usage by a shorebird. Auk 133, 168–177. doi: 10.1642/AUK-15-176.1
Gili, J. M., Rossi, S., Pagès, F., Orejas, C., Teixidó, N., López-González, P. J., et al. (2006). A new trophic link between the pelagic and benthic systems on the Antarctic shelf. Mar. Eco. Prog. Ser. 322, 43–49. doi: 10.3354/meps322043
Hadziavdic, K., Lekang, K., Lanzen, A., Jonassen, I., Thompson, E. M., and Troedsson, C. (2014). Characterization of the 18S rRNA gene for designing universal eukaryote specific primers. PLoS One 9:e87624. doi: 10.1371/journal.pone.0087624
Hardy, N., Berry, T., Kelaher, B. P., Goldsworthy, S. D., Bunce, M., Coleman, M. A., et al. (2017). Assessing the trophic ecology of top predators across a recolonisation frontier using DNA metabarcoding of diets. Mar. Ecol. Prog. Ser. 573, 237–254. doi: 10.3354/meps12165
Harrison, N. (1984). Predation on jellyfish and their associates by seabirds. Limnol. Oceanogr. 29, 1335–1337. doi: 10.4319/lo.1984.29.6.1335
Hedd, A., and Gales, R. (2001). The diet of shy albatrosses (Thalassarche cauta) at Albatross Island, Tasmania. J. Zool. 253, 69–90. doi: 10.1017/S0952836901000073
Henschke, N., Everett, J. D., Doblin, M. A., Pitt, K. A., Richardson, A. J., and Suthers, I. M. (2014). Demography and interannual variability of salp swarms (Thalia democratica). Mar. Biol. 161, 149–163. doi: 10.1007/s00227-013-2325-2
Henschke, N., Everett, J. D., Richardson, A. J., and Suthers, I. M. (2016). Rethinking the Role of Salps in the Ocean. Trends Ecol. Evol. 31, 720–733. doi: 10.1016/j.tree.2016.06.007
Henschke, N., Smith, J. A., Everett, J. D., and Suthers, I. M. (2015). Population drivers of a Thalia democratica swarm: insights from population modelling. J. Plankton Res. 37, 1074–1087. doi: 10.1093/plankt/fbv024
Hothorn, T., Bretz, F., Westfall, P., Heiberger, R. M., Schuetzenmeister, A., and Scheibe, S. (2013). multcomp: Simultaneous Inference In General Parametric Models. R package version 1.2-18. Vienna: R Foundation for Statistical Computing.
Houghton, J. D., Doyle, T. K., Davenport, J., and Hays, G. C. (2006). The ocean sunfish Mola mola: insights into distribution, abundance and behaviour in the Irish and Celtic Seas. J. Mar. Biol. Assoc. U.K. 86, 1237–1243. doi: 10.1017/S002531540601424X
Iverson, S. J., Frost, K. J., and Lang, S. L. C. (2002). Fat content and fatty acid composition of forage fish and invertebrates in Prince William Sound, Alaska: factors contributing to among and within species variability. Mar. Ecol. Prog. Ser. 241, 161–181. doi: 10.3354/meps241161
Jarman, S. N., Mcinnes, J. C., Faux, C., Polanowski, A. M., Marthick, J., Deagle, B. E., et al. (2013). Adelie penguin population diet monitoring by analysis of food DNA in scats. PLoS One 8:e82227. doi: 10.1371/journal.pone.0082227
Johnson, M., Zaretskaya, I., Raytselis, Y., Merezhuk, Y., Mcginnis, S., and Madden, T. L. (2008). NCBI BLAST: a better web interface. Nucleic Acids Res. 36, W5–W9. doi: 10.1093/nar/gkn201
Kartzinel, T. R., Chen, P. A., Coverdale, T. C., Erickson, D. L., Kress, W. J., Kuzmina, M. L., et al. (2015). DNA metabarcoding illuminates dietary niche partitioning by African large herbivores. Proc. Natl. Acad. Sci. U.S.A. 112, 8019–8024. doi: 10.1073/pnas.1503283112
Kato, A., Ropert-Coudert, Y., and Chiaradia, A. (2008). Regulation of trip duration by an inshore forager, the little penguin (Eudyptula Minor), during Incubation. Auk 125, 588–593. doi: 10.1525/auk.2008.06273
Klomp, N. I., and Wooller, R. D. (1988). Diet of little penguins, Eudyptula minor, from Penguin Island, Western Australia. Mar. Fresh. Res. 39, 633–639. doi: 10.1071/MF9880633
Komura, T., Ando, H., Horikoshi, K., Suzuki, H., and Isagi, Y. (2018). DNA barcoding reveals seasonal shifts in diet and consumption of deep-sea fishes in wedge-tailed shearwaters. PLoS One 13:e0195385. doi: 10.1371/journal.pone.0195385
Kowalczyk, N. D., Chiaradia, A., Preston, T. J., and Reina, R. D. (2014). Linking dietary shifts and reproductive failure in seabirds: a stable isotope approach. Funct. Ecol. 28, 755–765. doi: 10.1111/1365-2435.12216
Kowalczyk, N. D., Chiaradia, A., Preston, T. J., and Reina, R. D. (2015). Fine-scale dietary changes between the breeding and non-breeding diet of a resident seabird. R. Soc. Open Sci. 2:140291. doi: 10.1098/rsos.140291
Lee, C. I., Pakhomov, E., Atkinson, A., and Siegel, V. (2010). Long-term relationships between the marine environment, krill and salps in the southern ocean. J. Mar. Biol. 2010, 1–18. doi: 10.1155/2010/410129
Lynam, C. P., Gibbons, M. J., Axelsen, B. E., Sparks, C. A., Coetzee, J., Heywood, B. G., et al. (2006). Jellyfish overtake fish in a heavily fished ecosystem. Curr. Biol. 16, R492–R493. doi: 10.1016/j.cub.2006.09.012
Madin, L. P., Cetta, C. M., and McAlister, V. L. (1981). Elemental and biochemical composition of salps (Tunicata: Thaliacea). Mar. Biol. 63, 217–226. doi: 10.1007/BF00395990
McInnes, J. C., Alderman, R., Deagle, B. E., Lea, M.-A., Raymond, B., Jarman, S. N., et al. (2017a). Optimised scat collection protocols for dietary DNA metabarcoding in vertebrates. Methods Ecol. Evol. 8, 192–202. doi: 10.1111/2041-210X.12677
McInnes, J. C., Alderman, R., Lea, M. A., Raymond, B., Deagle, B. E., Phillips, R. A., et al. (2017b). High occurrence of jellyfish predation by black-browed and Campbell albatross identified by DNA metabarcoding. Mol. Ecol. 26, 4831–4845. doi: 10.1111/mec.14245
McInnes, J. C., Emmerson, L., Southwell, C., Faux, C., and Jarman, S. N. (2016). Simultaneous DNA-based diet analysis of breeding, non-breeding and chick Adélie penguins. R. Soc. Open Sci. 3:150443. doi: 10.1098/rsos.150443
Metzker, M. L. (2010). Sequencing technologies - the next generation. Nat. Rev. 11, 31–45. doi: 10.1038/nrg2626
Meyer, D., Zeileis, A., and Hornik, K. (2008). “vcd: Visualizing Categorical Data”. R package version.
Mianzan, H., Pájaro, M., Colombo, G. A., and Madirolas, A. (2001). Feeding on survival-food: gelatinous plankton as a source of food for anchovies. Hydrobiologia 451, 45–53. doi: 10.1023/A:1011836022232
Mianzan, H. W., Mari, N., Prenski, B., and Sanchez, F. (1996). Fish predation on neritic ctenophores from the Argentine continental shelf: a neglected food source? Fish. Res. 27, 69–79. doi: 10.1016/0165-7836(95)00459-9
Mills, C. E. (2001). Jellyfish blooms: are populations increasing globally in response to changing ocean conditions? Hydrobiologia 451, 55–68. doi: 10.1023/A:1011888006302
Murray, D. C., Coghlan, M. L., and Bunce, M. (2015). From benchtop to desktop: important considerations when designing amplicon sequencing workflows. PLoS One 10:e0124671. doi: 10.1371/journal.pone.0124671
Numata, M., Davis, L. S., and Renner, M. (2000). Prolonged foraging trips and egg desertion in little penguins (Eudyptula minor). N. Z. J. Zool. 27, 277–289. doi: 10.1080/03014223.2000.9518236
Pakhomov, E. A., Froneman, P. W., and Perissinotto, R. (2002). Salp/krill interactions in the Southern Ocean: spatial segregation and implications for the carbon flux. Deep Sea Res. Part 2 Top. Stud. Oceanogr. 49, 1881–1907. doi: 10.1016/S0967-0645(02)00017-6
Phillips, K. L., Nichols, P. D., and Jackson, G. D. (2003). Lipid and fatty acid composition of the mantle and digestive gland of four Southern Ocean squid species: implications for food-web studies. Antarct. Sci. 14, 212–220.
Phillips, N., Eagling, L., Harrod, C., Reid, N., Cappanera, V., and Houghton, J. D. (2017). Quacks snack on smacks: mallard ducks (Anas platyrhynchos) observed feeding on hydrozoans (Velella velella). Plankton Benthos Res. 12, 143–144. doi: 10.3800/pbr.12.143
Pinheiro, J., Bates, D., Debroy, S., and Sarkar, D. (2014). nlme: Linear and Nonlinear Mixed Effects Models. R package version 3.1-117. Available at http://CRAN.R-project.org/package=nlme
Pinol, J., San Andres, V., Clare, E. L., Mir, G., and Symondson, W. O. (2014). A pragmatic approach to the analysis of diets of generalist predators: the use of next-generation sequencing with no blocking probes. Mol. Ecol. Resour. 14, 18–26. doi: 10.1111/1755-0998.12156
Pitt, K. A., Budarf, A. C., Browne, J. G., and Condon, R. H. (2014). “Bloom and bust: why do blooms of jellyfish collapse?,” in Jellyfish Blooms, eds K. Pitt and C. Lucas (Dordrecht: Springer), 79–103.
Pompanon, F., Deagle, B. E., Symondson, W. O., Brown, D. S., Jarman, S. N., and Taberlet, P. (2012). Who is eating what: diet assessment using next generation sequencing. Mol. Ecol. 21, 1931–1950. doi: 10.1111/j.1365-294X.2011.05403.x
Poupart, T. A., Waugh, S. M., Bost, C., Bost, C.-A., Dennis, T., Lane, R., et al. (2017). Variability in the foraging range of Eudyptula minor across breeding sites in central New Zealand. N. Z. J. Zool. 44, 225–244. doi: 10.1080/03014223.2017.1302970
Preston, T. J., Ropert-Coudert, Y., Kato, A., Chiaradia, A., Kirkwood, R., Dann, P., et al. (2008). Foraging behaviour of little penguins Eudyptula minor in an artificially modified environment. Endanger. Species Res. 4, 95–103. doi: 10.3354/esr00069
Purcell, J. E. (2012). Jellyfish and ctenophore blooms coincide with human proliferations and environmental perturbations. Ann. Rev. Mar. Sci. 4, 209–235. doi: 10.1146/annurev-marine-120709-142751
Purcell, J. E., and Arai, M. N. (2001). Interactions of pelagic cnidarians and ctenophores with fish: a review. Hydrobiologia 451, 27–44. doi: 10.1023/A:1011883905394
Quast, C., Pruesse, E., Yilmaz, P., Gerken, J., Schweer, T., Yarza, P., et al. (2013). The SILVA ribosomal RNA gene database project: improved data processing and web-based tools. Nucleic Acids Res. 41, D590–D596. doi: 10.1093/nar/gks1219
R Development Core Team (2013). R: A Language and Environment for Statistical Computing. Vienna: R Foundation for Statistical Computing.
Richardson, A. J., Bakun, A., Hays, G. C., and Gibbons, M. J. (2009). The jellyfish joyride: causes, consequences and management responses to a more gelatinous future. Trends Ecol. Evol. 24, 312–322. doi: 10.1016/j.tree.2009.01.010
Saraux, C., Robinson-Laverick, S. M., Le Maho, Y., Ropert-Coudert, Y., and Chiaradia, A. (2011). Plasticity in foraging strategies of inshore birds: how Little Penguins maintain body reserves while feeding offspring. Ecology 92, 1909–1916. doi: 10.1890/11-0407.1
Sánchez, S., Reina, R. D., Kato, A., Ropert-Coudert, Y., Cavallo, C. R., Hays, G. C., et al. (in press). Within-colony spatial segregation leads to foraging behaviour variation in a seabird. Mar. Ecol. Prog. Ser. doi: 10.3354/meps12764
Schrader, C., Schielke, A., Ellerbroek, L., and Johne, R. (2012). PCR inhibitors - occurrence, properties and removal. J. Appl. Microbiol. 113, 1014–1026. doi: 10.1111/j.1365-2672.2012.05384.x
Sheppard, S. K., Bell, J., Sunderland, K. D., Fenlon, J., Skervin, D., and Symondson, W. O. (2005). Detection of secondary predation by PCR analyses of the gut contents of invertebrate generalist predators. Mol. Ecol. 14, 4461–4468. doi: 10.1111/j.1365-294X.2005.02742.x
Siegel, V., and Harm, U. (1996). The composition, abundance, biomass and diversity of the epipelagic zooplankton communities of the southern Bellingshausen Sea (Antarctica) with special reference to krill and salps. Arch. Fish. Mar. Res. 44, 115–139.
Smith, B. E., Ford, M. D., and Link, J. S. (2016). Bloom or bust: synchrony in jellyfish abundance, fish consumption, benthic scavenger abundance, and environmental drivers across a continental shelf. Fish. Oceanog. 25, 500–514. doi: 10.1111/fog.12168
Sutton, G. J., Hoskins, A. J., and Arnould, J. P. (2015). Benefits of group foraging depend on prey type in a small marine predator, the little penguin. PLoS One 10:e0144297. doi: 10.1371/journal.pone.0144297
Syvaranta, J., Harrod, C., Kubicek, L., Cappanera, V., and Houghton, J. D. (2012). Stable isotopes challenge the perception of ocean sunfish Mola mola as obligate jellyfish predators. J. Fish. Biol. 80, 225–231. doi: 10.1111/j.1095-8649.2011.03163.x
Taberlet, P., Bonin, A., Zinger, L., and Coissac, E. (2018). Environmental DNA: For Biodiversity Research and Monitoring. Oxford: Oxford University Press. doi: 10.1093/oso/9780198767220.001.0001
Thiebot, J.-B., Arnould, J. P., Gomez-Laich, A., Ito, K., Kato, A., Mattern, T., et al. (2017). Jellyfish and other gelata as food for four penguin species – insights from predator- borne videos. Front. Ecol. Evol. 15, 437–441. doi: 10.1002/fee.1529
Thiebot, J.-B., Ito, K., Raclot, T., Poupart, T., Kato, A., Ropert-Coudert, Y., et al. (2016). On the significance of Antarctic jellyfish as food for Adélie penguins, as revealed by video loggers. Mar. Biol. 163:108. doi: 10.1007/s00227-016-2890-2
Thomas, A. C., Jarman, S. N., Haman, K. H., Trites, A. W., and Deagle, B. E. (2014). Improving accuracy of DNA diet estimates using food tissue control materials and an evaluation of proxies for digestion bias. Mol. Ecol. 23, 3706–3718. doi: 10.1111/mec.12523
Thomas, A. C., Nelson, B. W., Lance, M. M., Deagle, B. E., and Trites, A. W. (2016). Harbour seals target juvenile salmon of conservation concern. Can. J. Fish. Aquat. Sci. 74, 907–921. doi: 10.1139/cjfas-2015-0558
Thomsen, P. F., and Willerslev, E. (2015). Environmental DNA – An emerging tool in conservation for monitoring past and present biodiversity. Biol. Conserv. 183, 4–18. doi: 10.1016/j.biocon.2014.11.019
van Heezik, Y., and Seddon, P. J. (1989). Stomach sampling in the yellow-eyed penguin: erosion of otoliths and squid beaks. J. Field Ornithol. 60, 451–458.
Verity, P. G., and Smetacek, V. (1996). Organism life cycles, predation, and the structure of marine pelagic ecosystems. Mar. Ecol. Prog. Ser. 130, 277–293. doi: 10.3354/meps130277
Wanless, S., Harris, M. P., Redman, P., and Speakman, J. R. (2005). Low energy values of fish as a probable cause of a major seabird breeding failure in the North Sea. Mar. Ecol. Prog. Ser. 294, 1–8. doi: 10.3354/meps294001
Wasiak, P. (2008). The Role of Shell Grit Ingestion in the Reproductive Biology of Little Penguins (Eudyptula minor). Honours thesis, Monash University, Melbourne.
Young, J. W., Lamb, T. D., Le, D., Bradford, R. W., and Whitelaw, A. W. (1997). Feeding ecology and interannual variations in diet of southern bluefin tuna, Thunnus maccoyii, in relation to coastal and oceanic waters off eastern Tasmania, Australia. Environ. Biol. Fish. 50, 275–296. doi: 10.1023/A:1007326120380
Keywords: next-generation sequencing, foraging ecology, DNA barcoding, eDNA, jellyfish
Citation: Cavallo C, Chiaradia A, Deagle BE, McInnes JC, Sánchez S, Hays GC and Reina RD (2018) Molecular Analysis of Predator Scats Reveals Role of Salps in Temperate Inshore Food Webs. Front. Mar. Sci. 5:381. doi: 10.3389/fmars.2018.00381
Received: 12 June 2018; Accepted: 28 September 2018;
Published: 26 October 2018.
Edited by:
Lyne Morissette, M – Expertise Marine, CanadaReviewed by:
Kylie Anne Pitt, Griffith University, AustraliaElizabeth McHuron, University of California, Santa Cruz, United States
Copyright © 2018 Cavallo, Chiaradia, Deagle, McInnes, Sánchez, Hays and Reina. This is an open-access article distributed under the terms of the Creative Commons Attribution License (CC BY). The use, distribution or reproduction in other forums is permitted, provided the original author(s) and the copyright owner(s) are credited and that the original publication in this journal is cited, in accordance with accepted academic practice. No use, distribution or reproduction is permitted which does not comply with these terms.
*Correspondence: Catherine Cavallo, ccavallo.ecology@gmail.com