Estimation of kinetic parameters related to biochemical interactions between hydrogen peroxide and signal transduction proteins
 Paula M. Brito1,2,3
  Fernando Antunes4*
- 1URIA-Centro de Patogénese Molecular, Faculdade de Farmácia, Universidade de Lisboa, Lisboa, Portugal
- 2Instituto de Medicina Molecular, Faculdade de Medicina da Universidade de Lisboa, Lisboa, Portugal
- 3Faculdade de Ciências da Saúde, Universidade da Beira Interior, Covilhã, Portugal
- 4Departamento de Química e Bioquímica and Centro de Química e Bioquímica, Faculdade de Ciências, Universidade de Lisboa, Lisboa, Portugal
The lack of kinetic data concerning the biological effects of reactive oxygen species is slowing down the development of the field of redox signaling. Herein, we deduced and applied equations to estimate kinetic parameters from typical redox signaling experiments. H2O2-sensing mediated by the oxidation of a protein target and the switch-off of this sensor, by being converted back to its reduced form, are the two processes for which kinetic parameters are determined. The experimental data required to apply the equations deduced is the fraction of the H2O2 sensor protein in the reduced or in the oxidized state measured in intact cells or living tissues after exposure to either endogenous or added H2O2. Either non-linear fittings that do not need transformation of the experimental data or linearized plots in which deviations from the equations are easily observed can be used. The equations were shown to be valid by fitting to them virtual time courses simulated with a kinetic model. The good agreement between the kinetic parameters estimated in these fittings and those used to simulate the virtual time courses supported the accuracy of the kinetic equations deduced. Finally, equations were successfully tested with real data taken from published experiments that describe redox signaling mediated by the oxidation of two protein tyrosine phosphatases, PTP1B and SHP-2, which are two of the few H2O2-sensing proteins with known kinetic parameters. Whereas for PTP1B estimated kinetic parameters fitted in general the present knowledge, for SHP-2 results obtained suggest that reactivity toward H2O2 as well as the rate of SHP-2 regeneration back to its reduced form are higher than previously thought. In conclusion, valuable quantitative kinetic data can be estimated from typical redox signaling experiments, thus improving our understanding about the complex processes that underlie the interplay between oxidative stress and redox signaling responses.
Introduction
Being higher reductions states of molecular dioxygen, reactive oxygen species are present in all aerobic organisms. Initially, these species were seen as harmful species that caused or participated in the etiology of many diseases through oxidative damage, but more recently physiological roles mediated by the modulation of the redox state of biomolecules were attributed to reactive oxygen species (Sies, 2014). Today redox biology is an established field. As Berzelius put it the venom is in the dose, and reactive oxygen species have different roles depending on their concentration. This work is centered on hydrogen peroxide (H2O2), a reactive oxygen species that has the properties of a second messenger (Forman et al., 2010) and participates in many pathways, including insulin (Mahadev et al., 2001; Haque et al., 2011), mitogenic (Irani et al., 1997), inflammatory, and apoptotic signaling (Oakley et al., 2009; Tschopp and Schroder, 2010). Having a relative low chemical reactivity, H2O2 reacts mainly with metal centers and with thiol compounds, such as cysteine residues in proteins (Marinho et al., 2014). Examples of H2O2 targets are PerR, a metal-dependent transcription factor that is inhibited by H2O2 in a Fenton-like reaction, and protein tyrosine phosphatases (PTPs), which are inhibited upon oxidation of cysteine residues in their active center (Tanner et al., 2011; Marinho et al., 2014; Sies, 2014). The list of proteins containing cysteine residues that were observed to be oxidized by H2O2 is vast, near 200 (Le Moan et al., 2006; Martínez-Acedo et al., 2012), and continues to increase as investigators find new targets for H2O2. In contrast, kinetic parameters concerning oxidation by H2O2 have been measured only for a few of these proteins (Ferrer-Sueta et al., 2011; Tanner et al., 2011), leading several researchers to point out the lack of proper quantitative data as a barrier to the development of the field (Brigelius-Flohé and Flohé, 2011; Buettner et al., 2013). Importantly, the triggering of biphasic responses by H2O2 in a narrow concentration range has important biological implications. For example, in H4IIEC hepatocytes H2O2 can either enhance or impair insulin signaling depending on its concentration (Iwakami et al., 2011). This dual role was attributed to the different sensitivity of PTP1B inhibition and JNK activation, two kinases that stimulate and inhibit insulin signaling, respectively. Thus, while H2O2 is an essential component of the insulin signaling pathway, it may also mediate the etiology of insulin resistance (Fisher-Wellman and Neufer, 2012). Although the underlying data is known for some time, such picture only emerged recently, probably because in absence of a quantitative framework, these biphasic responses were often interpreted as contradictory findings that were dependent of the biological model used or simply reflected non-reproducible experimental results. To study such complex responses it is advantageous to apply a quantitative and integrative approach typical of systems biology (Buettner et al., 2013), where the reactivity of targets toward H2O2 is determined to undercover which pathways operate in vivo under different conditions. In this work, we address how kinetic parameters can be determined from typical experiments performed in redox signaling.
Based on a simple reaction scheme representing H2O2 signaling, we started by deducing kinetic equations that are tailored to estimate kinetic parameters from experimental data. Next, to test the validity of the deduced equations, virtual experiments carried out under different conditions of H2O2 exposure were simulated with a kinetic model, and the results were fitted to the equations deduced. The agreement between the kinetic parameters obtained in these fittings and those used to obtain the virtual time courses was used as a criterion to decide on the accuracy of the kinetic equations deduced. Finally, to evaluate the applicability of kinetic equations to real data, experimental results described in the literature focusing on PTP-dependent signaling were fitted to the equations deduced. Two PTPs, PTP1B, and SHP-2, for which kinetic rate constants are known, were chosen as test cases. Our study demonstrates that insightful kinetic parameters related to biochemical interactions between H2O2 and signal transduction proteins can be estimated from typical H2O2-signaling experiments by applying the equations deduced here.
Theory and Methods
Master Equation
A minimal mathematical analytical model was set up to describe a signaling event triggered by H2O2, according to the following two reactions:
In the first reaction, the reduced form of a sensor protein target (Targetrd) is oxidized by H2O2, modifying its activity, which results in the modulation of a signaling pathway. In the second reaction, the oxidized target (Targetox) is switched-off by being regenerated back to the reduced form. A specific example of these two reactions is the inhibition of PTPs by oxidation of cysteine residues in their active center, which are reactivated upon reduction of this site; the temporary inhibition of these phosphatases increases the level of phosphorylation of their targets, thus promoting the signaling process. For these two reactions rate laws were defined as follows:
• For the H2O2-dependent oxidation step (1) v1 = kactivation × [Targetrd], where kactivation = ktarget + H2O2 × [H2O2]. ktarget + H2O2 is the rate constant for the direct oxidation of the target protein by H2O2.
• For the switch-off step (2), v2 = kswitchoff × [Targetox]. The total concentration of the target protein is assumed to be constant within the duration of the experiment ([Target]total = [Targetox] + [Targetrd]), and so v2 = kswitchoff × ([Target]total − [Targetrd]).
Based on these two chemical reactions, the following differential equation was set up, where Targetrd is the fraction of the target protein in the reduced state, t is time, and d/dt stands for the differential operator:
The master equation describing the time course of Targetrd is given by the analytical solution of Equation (3):
With
Targetrd |t and Targetox |t are the fractions of the target protein in the reduced and oxidized state at time t, respectively. Once the experimental variation of these fractions with time is known and the fraction of reduced target at time 0 (Targetox |0) is measured, a non-linear fit to Equation (4) can be applied to estimate the kinetic parameters kactivation and kswitchoff. One possibility is to estimate these two unknown parameters from a two-parameter non-linear fitting. Alternatively, if one of these parameters is already known, only the remaining unknown parameter is estimated from a one-parameter non-linear fitting.
Next, we linearized Equation (4) so that kinetic parameters can be determined from linear plots, in which deviations from the master Equation (4) are easier to observe. To linearize Equation (4), the steady-state (ss) fraction of protein present in the reduced form, Targetox |ss, was obtained by letting t to tend to infinite, resulting in Equation (6):
Equation (6) was used to rewrite and linearize Equation (4) as Equations (7) and (8). If in the experimental time course this steady-state is not observed, Equation (4) cannot be linearized according to this procedure.
A plot of vs. time gives a linear relationship with slope = −(kswitchoff + kactivation).
Finally, combining this slope with Equation (6), kinetic parameters are estimated as:
Simplification of the Master Equation
Simplified forms of Equation (4) that apply to specific experimental conditions may constitute a useful alternative to estimate kinetic parameters.
Absence of H2O2
On the assumption that kactivation = 0, i.e., H2O2 is absent in the system, Equation (4) was simplified as Equation (10).
Or
This equation is applied to determine kswitchoff from time courses that follow the return of the sensor protein to its reduced form. Taking the logarithmic of both sides of Equation (10b):
A plot of ln (Targetox|t) vs. time produces a straight line with kswitchoff = −slope.
No target reduction
Equation (12), another simplified form of Equation (4), was obtained by ignoring target reduction, i.e., kswitchoff = 0.
This equation is used to estimate kactivation from short time courses when target reduction is still negligible. Taking the logarithmic of both sides of Equation (12):
A plot of ln (Targetrd|t) vs. time produces a straight line with kactivation = −slope.
Concentration Studies
In all previous equations, H2O2 is a hidden variable that influences kactivation and kinetic parameters are estimated from experiments in which the time course of the oxidation state of the target protein is followed. If cells are exposed to various concentrations of H2O2, kinetic parameters may also be estimated by following the variation of the oxidation state of the target protein as a function of the H2O2 concentration at a given time point. To this end, kactivation was replaced by ktarget + H2O2 × [H2O2] in Equation (4), forming Equation (14):
For a known fixed t, a non-linear two-parameter fitting of Targetrd |t vs. [H2O2] allows to estimate kswitchoff and ktarget + H2O2. As before, if one of the two parameters is already known a one-parameter non-linear fitting may be used to determine the other parameter.
Concerning Equation (8), after specifying the H2O2 concentration explicitly this equation became:
A plot of vs. [H2O2] gives a linear relationship with slope = −ktarget + H2O2× t and intercept = −kswitchoff × t. In order to use this equation, the fraction of reduced target reached at steady-state (Targetrd |ss) must be known previously. Therefore, time courses are needed for each H2O2 concentration in order to obtain this value, which lessens the applicability of this equation.
In absence of target reduction, the equivalent of Equation (13) was deduced as:
A plot of ln (Targetrd|t) vs. [H2O2] produces a straight line with slope = −ktarget + H2 O2 × t.
Importantly, the [H2O2] in these equations refers to the intracellular [H2O2] that reacts with the target. Therefore, in order to estimate ktarget + H2O2, this concentration must be known. Intracellular [H2O2] attained when cells are exposed to extracellular H2O2 can be estimated from the gradient between extracellular and intracellular H2O2. If this gradient is unknown, then these equations may be applied with the extracellular H2O2 concentrations, but the value of ktarget + H2O2 obtained is referred to extracellular H2O2 concentrations, with the true value being higher. If instead ktarget + H2O2 is known a priori, equations may be used to estimate the gradient between extracellular and intracellular H2O2.
Validation of Equations
To test the validity of the equations, the following mathematical kinetic model was set up. This model simulates ideal experiments in which cells are exposed to extracellular H2O2 or are stimulated to produce endogenous H2O2 in a receptor-mediated process. A key characteristic of these virtual experiments is that the kinetic parameters concerning H2O2 signaling are known a priori, corresponding to the kinetic parameters introduced in the model. Thus, by fitting the virtual time courses to the equations deduced previously, the validity of the equations can be tested objectively. If the equations are valid, kinetic parameters obtained in these fittings should be similar to those used in the kinetic model. In addition, by varying several parameters of the model, namely those concerning the experimental set up describing H2O2 exposure, experimental conditions in which the equations are valid may be defined.
The model is described by the following differential equations, which take into account two compartments, one referring to the extracellular space (Vout) and the other to the cell volume (Vin). Multicompartmentation was implemented as described previously (Alves et al., 2006).
Reactions considered in the model (Table 1) were: extracellular production of H2O2 (H2O2_production_out), which simulates, for example, production of H2O2 by glucose oxidase added to the incubation medium; intracellular production of H2O2 (H2O2_production_in), which simulates the endogenous production triggered by a receptor-mediated process; permeation of H2O2 across the plasma membrane into (H2O2_import) and out of the cell (H2O2_export); consumption of H2O2 by an antioxidant enzyme (v_Gpx) and by a sensor protein target (v_Target); and finally, the switch-off mechanism of the target protein (v_switch_off). Table 2 shows the parameters used. Although kinetics and respective rate constants are based on published values, this model does not intend to model a particular cell or a specific signaling pathway. Reactivities of the target and the antioxidant enzyme toward H2O2 were based on that of PTP1B (Barrett et al., 1999) and glutathione peroxidase (GPx) (Flohe, 1979; Forstrom and Tappel, 1979), respectively. Levels of GPx, permeability constant for H2O2 across the plasma membrane, Vout and Vin were taken from Antunes and Cadenas (2000). kswitchoff was obtained from the lower range of values estimated in this work, based on previously published experiments. The resulting differential equations were solved numerically with PLAS (Voit, 1991). In the kinetic model, concentrations of Targetrd and Targetox were used. The respective fractions were calculated subsequently so that simulation data could be analyzed with the equations deduced here. The parameter kactivation is not a rate constant in the numerical model, but it was calculated as ktarget + H2O2 × [H2O2in]; when [H2O2in] was not constant, for example when a bolus addition of H2O2 or the endogenous non-constant production of H2O2 was simulated, an average [H2O2in] was used.
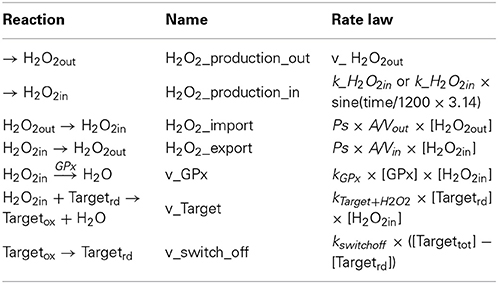
Table 1. Reactions and respective rate laws included in the kinetic model.
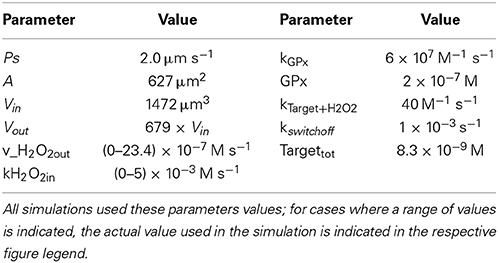
Table 2. Parameter values used in the kinetic model.
Results
As a first step to test the equations derived here, redox signaling experiments were simulated to generate data that was introduced into the equations in order to determine kinetic parameters. The validity of the equations was checked by comparing the kinetic parameters obtained with those used in the simulations.
Validation of Equations with Simulated Experiments
The exposure of cell cultures to extracellular H2O2 initiates cellular responses that differ from those caused by the intracellular release of H2O2 triggered by receptor-mediated mechanisms (Forman, 2007), being the main difference the additional signal transduction pathways initiated in the first case. Nevertheless, the control of H2O2 delivery achieved by the extracellular exposure makes this approach more suitable for the purpose of estimating kinetic parameters. We simulated both approaches with the kinetic model described in Theory and Methods, starting with the extracellular exposure to H2O2.
Extracellular addition of H2O2
Cells may be exposed to extracellular H2O2 either by bolus additions or by incubation with steady-state concentrations of H2O2. In the bolus addition, a single dose of H2O2 is added to cells, constituting the most common method of exposing cell cultures to extracellular H2O2. It has the advantage of simplicity, but the results obtained are strongly dependent on the specific assay conditions (Marinho et al., 2013a). Among other factors, cell density and, for adherent-growing cells, the volume of incubation media dramatically affect the results.
In the steady-state methodology, exposure to H2O2 is calibrated so that cells are exposed for a known concentration of H2O2 that remains constant during the assay. Although more complex, this approach has much better experimental reproducibility with the actual H2O2 concentration in the assay being independent of experimental conditions. The implementation of this methodology is described in detailed in (Covas et al., 2013; Cyrne et al., 2013; Marinho et al., 2013a).
Steady-state. In the deduction of the kinetic equations, kactivation (ktarget + H2O2 × [H2O2]) was considered to be a constant parameter, i.e., H2O2 was assumed to be constant with time. So, as a positive control we started by analyzing the results simulated with a steady-state incubation, a case in which the equations tested should be valid.
In the first condition analyzed, cellular exposure to H2O2 (Figure 1A, curve 2) was long enough so that a balance between oxidation of the target that senses H2O2 and its regeneration was achieved. As observed in Figure 1A, curve 1, initially the target was oxidized until its oxidation state reached a near steady-state value as given by Equation (6). Simulated results were transformed according to Equation (8) (Figure 1B, blue line), with kactivation and kswitchoff being estimated from Equations (9A) and (9B). The estimations obtained, kactivation = 8.1 × 10⁻⁴ s−1 and kswitchoff = 1.0 × 10⁻³ s−1, matched closely the respective expected values of 7.9 × 10⁻⁴ s−1 and 1.0 × 10⁻³ s−1, which were used in the simulations to draw curve 1 in Figure 1A. Note that the fitting to Equation (8) departed from linearity for longer time points (Figure 1B), when Targetrd approached its steady-state value (Figure 1B). This behavior was caused by small uncertainties in this value, which must be known in order to plot data according to Equation (8). As an alternative, the two parameters were also obtained from a non-linear fitting to Equation (4) (Figure 1A, red dashed line), which neither requires data transformation nor knowing the value of the fraction of reduced target at steady-state. In this case, the estimated parameters, kactivation = 7.9 × 10⁻⁴ s−1 and kswitchoff = 1.0 × 10⁻³ s−1, matched exactly the expected values.
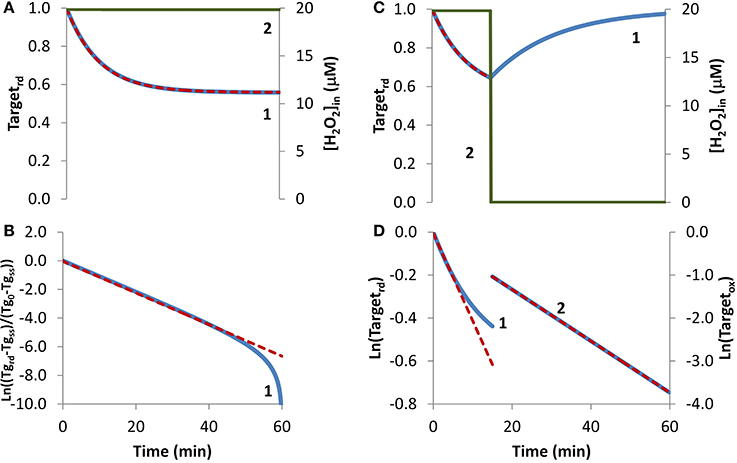
Figure 1. Determination of kinetic parameters from simulated experiments when extracellular H2O2 was delivered as a steady-state. H2O2 concentration (curve 2, green line) was maintained during the duration of the experiment (A) or was stopped at 15 min (C). (A) The profile of the fraction of the H2O2 target in the reduced form (Targetrd, blue line) was obtained by simulation of the kinetic model described in the Theory and Methods Section with v_H2O2out = 3.51 × 10⁻⁷ M s−1 and [H2O2out] = 3 × 10⁻⁴ M at time = 0, (intracellular H2O2 production was absent, k_ H2O2in = 0); red dashed line is the two-parameter non-linear fitting to Equation (4) used to estimate the kinetic parameters kactivation and kswitchoff. (B) Fitting of the profile of Targetrd obtained in (A) to Equation (8) (curve 1, blue line) using Targetrd_0 = 1 and Targetrd_ss = 0.56, (Tg in y-axis title means Target). kactivation and kswitchoff were estimated from the slope of the straight line by applying Equations (9A) and (9B). (C) The profile of the fraction of Targetrd (curve 1, blue line) was obtained as in (A) but v_H2O2out and [H2O2]out were set to zero at 15 min; red dashed line is the one-parameter non-linear fitting to Equation (4) in which kswitchoff obtained in (D) curve 2 was used as an input to estimate kactivation. (D) Targetrd was fitted to Equation (13) (curve 1, left y-axis) while H2O2 was present, afterwards Targetox was fitted to Equation (11) (curve 2, right y-axis); kactivation was estimated from the linear part of the fitting to Equation (13), kswitchoff from the fitting to Equation (11).
If the fraction of the reduced target does not reach a steady-state because, for example, a balance between its oxidation and regeneration is not attained before the exposure to H2O2 is terminated, Equation (8) cannot be applied. To illustrate this situation, a simulation was done under the exact same conditions as before with the exception that H2O2 exposure lasted only for 15 min (Figure 1C). Experimentally, this is equivalent to either replacing the external media to remove the H2O2 generating system, such as glucose oxidase, or by adding external catalase to the incubation media. This simulation was analyzed with Equation (13), an equation deduced ignoring the regeneration of the reduced form of the target. Good enough estimations were obtained by using only the first stage of the time course, when the degree of target oxidation was still low, and therefore the contribution of its regeneration to the time course of Targetrd, could be ignored. From the slope of the initial linear part of the curve (Figure 1D, curve 1), a kactivation = 6.8 × 10⁻⁴ s−1 was obtained, which was close to the expected value of 7.9 × 10⁻⁴ s−1. Concerning kswitchoff, this kinetic parameter was estimated by fitting to Equation (11) the part of the curve starting after removal of external H2O2. Note that Equation (11) was deduced assuming reduction of the oxidized target when H2O2 was absent. An excellent linear plot was observed (Figure 1D, curve 2) with the estimated kswitchoff of 1.0 × 10⁻³ s−1 matching the expected value. Kinetic parameters were also obtained by non-linear fittings of Equation (4) to the first part of the curve when H2O2 was still present, either as a two-parameter non-linear fitting in which the two parameters – kactivation and kswitchoff – were determined, or as a one-parameter non-linear fitting, in which only one of the parameters was estimated, with the other being obtained from the linear plots of Figure 1B. If the conditions of the experimental assay fulfill all the assumptions applied to deduce Equation (4), a two-parameter non-linear fitting is the best choice, since both parameters are obtained without transformation of the experimental data. However, if the assumptions are not all fulfilled, which is the most common situation, we advise to apply a one-parameter non-linear fitting to Equation (4), inputting as a known parameter kswitchoff estimated from Equation (11), being kactivation the unknown parameter. As always whatever the option taken, the goodness of the fitting should be inspected. The dashed line in Figure 1C was obtained as a one-parameter non-linear fitting using kswitchoff = 1.0 × 10⁻³ s−1 with the estimated kactivation value of 7.9 × 10⁻⁴ s−1 matching the expected value.
Overall, kinetic parameters estimated from simulated experiments in which H2O2 was delivered as a steady-state matched the expected values, validating the equations applied. This could be anticipated because Equation (4) relies on the key assumption that H2O2 concentration is constant during the experiment.
Bolus addition. The bolus addition set up, the most common experimental approach to expose cells to H2O2, was simulated in Figure 2. Upon incubation with a 1 mM bolus addition, the H2O2 sensor was oxidized, the Targetrd fraction reached a minimum at approximately 12 min, then regeneration became more important than oxidation, and Targetrd increased (Figure 2A, curve 1). Kinetics of H2O2 consumption depends on the experimental set up, and under the conditions of this simulation, H2O2 was fully consumed after 60 min (Figure 2A, curve 2). Nevertheless, the general pattern observed in this simulation served as a test case to check how the non-constant H2O2 concentration impacts the estimation of kinetic parameters.
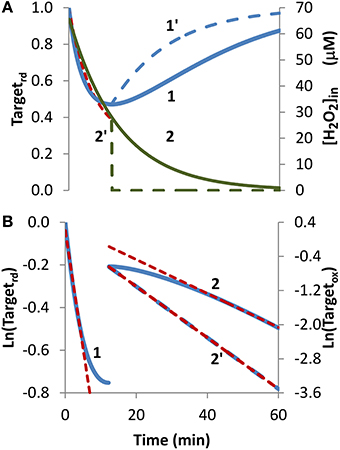
Figure 2. Determination of kinetic parameters from simulated experiments when H2O2 was delivered as an extracellular bolus addition. (A) Curve 1 is the profile of Targetrd fraction (blue line) obtained by simulation with v_H2O2out = 0 M s−1 and [H2O2out] = 1 × 10⁻³ M at time = 0, (intracellular H2O2 production was absent, k_ H2O2in = 0). Curve 1′ is the profile of Targetrd (blue line) obtained as in curve 1 but [H2O2out] was set to zero at 12 min; red dashed line is the one-parameter non-linear fitting to Equation (4) in which kswitchoff obtained in (B) was used as an input to estimate kactivation. (B) Until 12 min results were fitted to Equation (13) (curve 1, left y-axis), afterwards were fitted to Equation (11) (curve 2, right y-axis); kactivation and kswitchoff were estimated from the linear part of the fittings to Equations (13) and (11), respectively.
Because the fraction of reduced target never reached a constant value, Equation (8) was not applied, and instead Equation (13) was used to estimate kactivation. Only the first part of the curve was considered (Figure 2B, curve 1), because shorter time courses minimize target regeneration, a process ignored by Equation (13). The kactivation estimation of 1.8 × 10⁻³ s−1 was close to the expected value of 1.7 × 10⁻³ s−1. Concerning kswitchoff, this parameter was estimated by fitting to Equation (11) the part of the curve after Targetrd reached its minimum (Figure 2B, curve 2). The presence of H2O2 in this part of the experiment promoted target oxidation, violating a key assumption behind Equation (11), and consequently deviations from linearity were observed. Even by using only the linear part of the curve, the kswitchoff estimation of 6.7 × 10⁻⁴ s−1 underestimated the expected value of 1.0 × 10⁻³ s−1. Removal of external H2O2 at 12 min, when Targetrd reached its minimum (Figure 2A, curve 2′), changed the regeneration profile of the H2O2 target (Figure 2A, curve 1′) and vastly improved the fitting to Equation (11) (Figure 2B, curve 2′) with the estimated kswitchoff of 1.0 × 10⁻³ s−1 matching exactly the expected value.
Concerning the non-linear fitting to Equation (4), a kactivation = 1.8 × 10⁻³ s−1 was obtained when kswitchoff = 6.7 × 10⁻⁴ s−1 was used as an input. Alternatively, by inputting a kswitchoff = 1.0 × 10⁻³ s−1 a kactivation = 2.0 × 10⁻³ s−1 was obtained.
Overall, these results indicate that the proposed equations can be applied to experiments in which H2O2 is delivered as a bolus addition. The accuracy of parameter estimation improves if H2O2 is removed at the time when the reduced form of the target reaches its minimum.
Concentration studies. Besides time courses, studies often evaluate how the concentration of H2O2 affects the oxidation state of the sensor target. We started by simulating the dependency of Targetrd on external H2O2 concentration, delivered as a steady-state during 10 min (Figure 3A, curve 1). From the non-linear fitting to Equation (14), kinetic parameters that matched exactly the expected values were obtained (ktarget + H2O2 = 2.6 M−1 s−1 and kswitchoff = 1.0 × 10⁻³ s−1). Note that ktarget + H2O2 estimated from the fitting was based on external H2O2 concentrations. By considering the gradient between these and the intracellular H2O2 concentrations—15 in the present simulation—the estimated value of the rate constant of 40 M−1 s−1 for the reaction between the target and H2O2 matched the value used in the simulation. Results were also linearized and fitted to Equation (16) (curve 2 in Figure 3A), which was deduced assuming absence of target reduction, i.e., kswitchoff = 0 s−1. In this case, the estimated value of 1.7 M−1 s−1 for ktarget + H2O2, which was converted to 26 M−1 s−1 when intracellular H2O2 concentrations were considered, underestimated the expected value.
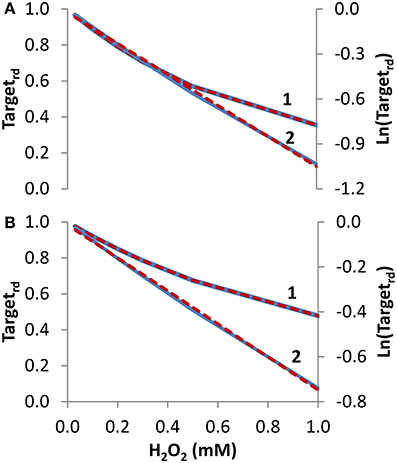
Figure 3. Determination of kinetic parameters from simulated experiments when the concentration of extracellular H2O2 was changed. The reduced form of the target fraction (Targetrd) obtained at 10 min is plotted as a function of either H2O2 steady-state concentrations in (A) or initial bolus additions in (B) (curves 1, blue linen). Simulations were run with v_H2O2out varying in the range (0.35–23.4) × 10−7 M s−1 and [H2O2out] in the range (0.03–1) × 10−3 M at time = 0 in A, while in B v_H2O2out was set to zero and [H2O2out] was changed in the range (0.03–1) × 10−3 M at time = 0; intracellular H2O2 production was absent (k_ H2O2in = 0) in both cases. In (A,B), results were analyzed with non-linear fits of Targetrd to Equation (14) (curve 1, red dashed line) in order to estimate ktarget + H2O2 and kswitchoff, or they were linearized according to Equation (16) (curve 2, blue line) with ktarget + H2O2 being estimated from the slopes of the red dashed lines.
To test how Equations (14) and (16) behave with data generated with bolus additions, the study of Figure 3A was repeated but now the H2O2 concentrations introduced in the equations were the initial bolus additions (Figure 3B, curve 1). Kinetic parameters obtained with the non-linear fitting to Equation (14) were ktarget + H2O2 = 2.0 M−1 s−1 (or 30 M−1 s−1 if referred to intracellular H2O2), and kswitchoff = 1.3 × 10⁻³ s−1. Linearization according to Equation (16) (curve 2 in Figure 3B) gave a ktarget + H2O2 of 1.2 M−1 s−1, (or 18 M−1 s−1 if referred to intracellular H2O2). As expected, these estimations were less accurate than those obtained when H2O2 was delivered as a steady-state, but nevertheless they constitute satisfactory semi-quantitative estimations.
Receptor-mediated endogenous H2O2 production
The endogenous production of H2O2 upon cell stimulation by a ligand will give the best picture of the influence of H2O2 in a particular cell signaling pathway, as H2O2 production is both spatial and time restricted (Forman, 2007). Nevertheless, since the profile of H2O2 concentration generated is unknown this imposes potential problems to the determination of kinetic parameters. To test how the kinetic equations behave under such circumstances, we started by simulating a case where H2O2 intracellular production was rapidly triggered and then set at a near constant value. This scenario worked as positive control and was analyzed as described previously for the extracellular addition of steady-state H2O2. The kinetic parameters obtained matched exactly the expected values or were very close to these values depending on the fittings applied (not shown). Nevertheless, this scenario is seldom achieved when H2O2 is produced endogenously, and next we tested the kinetic equations under non-constant H2O2 intracellular production.
H2O2 endogenous production was simulated with a sine-like function: there was an initial increase in the H2O2 concentration, reaching its maximum at 10 min, and then a decrease until H2O2 production stopped at 20 min (Figures 4A,C, curve 2). In this context, two scenarios were simulated. In the first, H2O2 production was high enough so that a near constant level of reduced target was observed (Figure 4A, curve 1), and accordingly results were fitted to Equation (8). The presence of a non-constant H2O2 production caused deviations from linearity (Figure 4B, curve 1). Nevertheless results obtained from the near-linear intermediate portion of the curve gave estimations, kswitchoff = 7.8 × 10⁻⁴ s−1 and kactivation = 1.2 × 10⁻² s−1, that compared well with the expected parameters, kswitchoff = 1.0 × 10⁻³ s−1 and kactivation = 1.0 × 10⁻² s−1. As before, kswitchoff was also obtained from the second part of the curve by fitting data to Equation (11) (Figure 4B, curve 2), giving a kswitchoff = 7.6 × 10⁻⁴ s−1, an underestimation of the expected value. As described for the bolus addition, removal of H2O2 from the system after Targetrd reached its minimum improved the estimations (not shown). In real experiments, the effect of this addition will be dependent on whether removal of extracellular H2O2 decreases the localized intracellular levels of H2O2. If this occurs, a change in the reduction profile of the oxidized target should be observed. In this simulation, the application of non-linear fittings did not improve the estimations of kinetic parameters: from a non-linear fitting where kswitchoff = 7.6 × 10⁻⁴ s−1 was used as input (dashed line in Figure 4A) a kactivation of 0.51 × 10⁻² s−1 was obtained (Figure 4A, dashed line) and a two-parameter non-linear fitting did not improve these estimations.
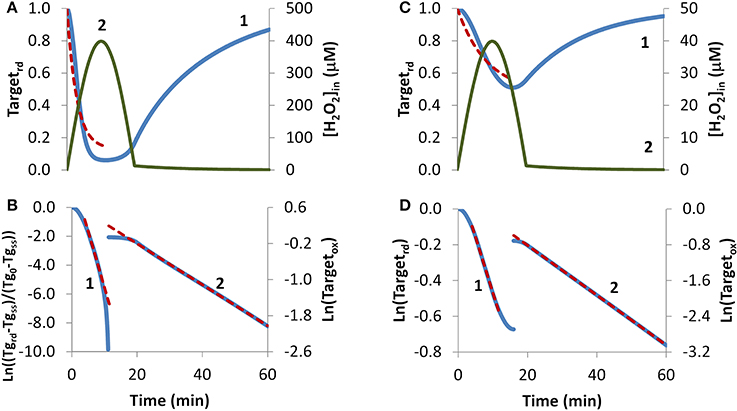
Figure 4. Determination of kinetic parameters from simulated experiments when H2O2 was produced endogenously. A non-constant sine-like H2O2 intracellular exposure (green lines) was simulated as kH2O2in × sine(time/1200 × 3.14), (extracellular production was absent, v_H2O2out = 0). (A) Profile of Targetrd fraction (blue line) was simulated with kH2O2in = 5 × 10⁻³ M s−1; red dashed line is the one-parameter non-linear fitting to Equation (4) in which kswitchoff obtained in (B) curve 2 was used as an input to estimate kactivation. (B) The first part of the profile (until 11.3 min) of Targetrd was fitted to Equation (8) (curve 1, blue line) using Targetrd_0 = 1 and Targetrd_ss = 0.06; the kinetic parameters kactivation and kswitchoff were obtained from the slope of near-linear intermediate portion of the curve by applying Equations (9A) and (9B). After 11.3 min, the profile of Targetox was fitted to Equation 13, from which kswitchoff was estimated. (C) The profile of Targetrd fraction (blue line) was obtained as in (A), but with kH2O2in = 0.5 × 10⁻³ M s−1; red dashed line is the one-parameter non-linear fitting to Equation (4) in which kswitchoff obtained in (D) curve 2 was used as an input to estimate kactivation. (D) Targetrd was fitted to Equation (13) (curve 1, left y-axis) until 16.0 min, afterwards, Targetox was fitted to Equation (11) (curve 2, right y-axis); kactivation and kswitchoff were estimated from the linear part of the fittings to Equations (13) and (11), respectively.
In the second simulation in which endogenous production of H2O2 followed a sine-like function, a constant level of reduced target was not observed (Figure 4C, curve 1). The kactivation estimation of 1.0 × 10⁻³ s−1, obtained from the linear portion of the plot according to Equation (13) (Figure 4D, curve 1), matched the expected value. The kswitchoff estimation of 9.3 × 10⁻⁴ s−1, obtained from the second part of the curve after fitting data to Equation (11) (Figure 4D, curve 2), was close to the expected value of 1.0 × 10⁻³ s−1. A one-parameter non-linear fitting (Figure 4C, dashed line) gave a kactivation of 1.0 × 10⁻³ s−1, i.e., the expected value, when a kswitchoff of 9.3 × 10⁻⁴ was used as input.
Overall, when H2O2 production is not constant deviations from the equations derived here are expected. Nevertheless, estimated kinetic parameters are still satisfactory at a semi-quantitative level, and the deviations from linearity in the plots proposed here may be used as a useful tool to diagnose a non-constant H2O2 production.
Fits to Experimental Data
The use of simulation data was useful to test the validity of the equations deduced and to figure out how deviations from the assumptions behind their deduction affected the estimation of kinetic parameters. Nevertheless, simulation data points are virtually infinite and devoid of experimental error; in contrast real experiments contain a finite number of measurements with associated experimental error. To test how equations cope with these issues, they were applied to data obtained from the literature for two PTPs, PTP1B and SHP-2.
H2o2-external delivery
Two experiments in which H2O2 was added externally as a bolus addition (Figure 5) were analyzed. In the first experiment (Rinna et al., 2006), the time course of PTP1B oxidation was followed in a rat alveolar macrophage cell line after addition of a 100 μM H2O2 bolus dose for 15 min (Figure 5A, curve 1). By fitting data to Equation (4) with a two parameter non-linear fitting, a kactivation of 1.1 × 10⁻³ s−1 and a kswitchoff of 2.6 × 10⁻³ s−1 were estimated. Alternatively, when results were linearized according to Equation (13) (Figure 5A, curve 2) a kactivation of 0.59 × 10⁻³ s−1 was obtained, after discarding the 15 min point. Note that also with simulation data a similar deviation from linearity at late time points was observed (Figure 2B, curve 1). By considering an external H2O2 concentration of 100 μM, the apparent first-order rate constant kactivation in the range (0.59–1.1) × 10−3 s−1 was converted to a rate constant between the target and H2O2 (ktarget + H2O2) of 5.9–11 M−1 s−1. This value refers to extracellular H2O2, and so if the gradient between extracellular and intracellular H2O2 was considered the value of ktarget + H2O2 for PTP1B would be higher.
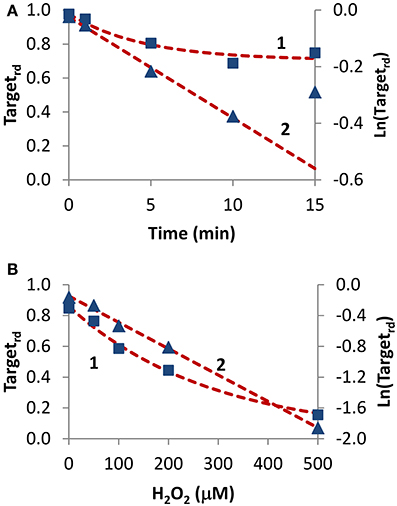
Figure 5. Determination of kinetic parameters from experiments when H2O2 was delivered as an extracellular bolus addition. (A) Data (■) was taken from Figure 1 in Rinna et al. (2006). Gel was digitalized and analyzed with ImageJ (Rasband, 1997); fraction of oxidized target was calculated assuming a maximum level of oxidation of 31% (Rinna et al., 2006). Time course was fitted to Equation (4), with kactivation and kswitchoff as variables (curve 1, left y-axis), or was linearized (▲) and fitted to Equation (13) (curve 2, right y-axis). (B) Data (■) was taken from Figure 2A in Meng et al. (2002). Gel was digitalized and analyzed with ImageJ (Rasband, 1997); fraction of oxidized protein tyrosine phosphatase corresponding to 70 kDa (SHP-2) was calculated assuming that complete oxidation was achieved by 1 mM H2O2. Time course was fitted to Equation (14), with ktarget + H2O2 and kswitchoff as variables (curve 1, left y-axis), or was linearized (▲) and fitted to Equation (16) (curve 2, right y-axis).
In the second experiment, rat-1 fibroblasts were subjected to H2O2 bolus additions in the range 0–500 μM for 1 min, followed by the measurement of the oxidation level of SHP-2 (Meng et al., 2002) (Figure 5B, curve 1). After fitting data to Equation (14) (Figure 5B, curve 1) with a two parameter non-linear fitting, a ktarget + H2O2 of 60 M−1 s−1 and a kswitchoff of 1.3 × 10⁻³ s−1 were estimated. Linearization according to Equation (16) gave a ktarget + H2O2 of 57 M−1 s−1 (Figure 5B, curve 2). Again, ktarget + H2O2 values refer to extracellular H2O2 concentrations. Even if a bolus addition was used, because short-term incubations of 1 min were done, the assumption of constant H2O2 behind the deduction of Equations (14) and (16) was verified.
Receptor-mediated signaling
To test how equations behave when analyzing receptor-mediated signaling, the following two experiments were considered. In the first, A431 human epidermoid carcinoma cells were stimulated by EGF, triggering H2O2 intracellular production that lead to PTP1B oxidation and inhibition (Figures 6A,B), while in the second experiment, rat-1 cells were stimulated with PDGF inducing SHP-2 oxidation (Figures 6C,D). In both cases, the profile of PTP oxidation did not reach a near steady-state, precluding the application of Equation (8). Concerning kswitchoff, estimations of 1.9 × 10⁻³ s−1 and 8.7 × 10⁻³ s−1 were obtained, respectively for PTP1B and SHP-2 reactivation, after fitting to Equation (11) the second part of the PTP oxidation curves (curves 2 in Figures 6B,D). For kactivation, estimations of 1.0 × 10⁻³ s−1 and 9.3 × 10⁻³ s−1 were obtained, respectively for PTP1B and SHP-2, after applying Equation (13) to linearize the first part of the PTP oxidation profile (curve 1 in Figures 6B,D). These kactivation values were close to those obtained from non-linear fittings, 2.0 × 10⁻³ s−1 and 9.7 × 10⁻³ s−1 for PTP1B and SHP-2, respectively (dashed lines in Figures 6A,C).
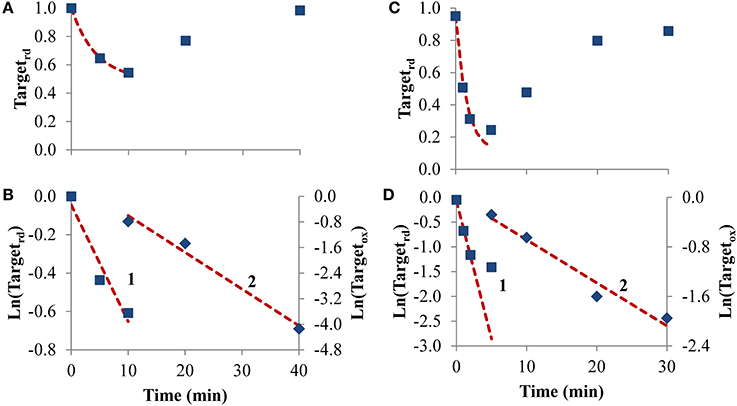
Figure 6. Determination of kinetic parameters from experiments where intracellular H2O2 production was triggered by cell stimulation. (A) Data concerning PTP1B oxidation following stimulation of A431 cells with EGF (■) was taken from Figure 2 in Lee et al. (1998). (C) Data concerning SHP-2 oxidation following stimulation of rat-1 cells by PDGF (■) was taken from gel in Figure 4 in Meng et al. (2002) after digitalization and analysis with ImageJ (Rasband, 1997), and assuming that 100% of oxidation of SHP-2 was achieved in absence of iodoacetic acid as described in Meng et al. (2002). The red dashed lines in (A,C) are one-parameter non-linear fittings to Equation (4) in which kswitchoff values obtained from curves 2 in (B,D), respectively, were used as input to estimate kactivation. (B,D) Linearization of data shown in (A,C), respectively; results in the first part of the experiment were fitted to Equation (13) (curves 1, left y-axis), afterwards were fitted to Equation (11) (curves 2, right y-axis); kactivation was estimated from the fitting to Equation (13), kswitchoff from the fitting to Equation (11).
Overall, data taken from literature fitted well to the equations deduced here, even if experiments analyzed were carried out without any special concern considering their application to estimate kinetic parameters.
Discussion
Herein, we deduced equations to determine kinetic parameters from typical redox signaling experiments in which H2O2 is either added externally to cells or is endogenously produced following receptor activation by diverse cellular stimuli. The equations were shown to be accurate after fitting them to data generated by simulations. We also performed simulations in which the assumption that H2O2 is constant during the experiment was not fulfilled, that is, H2O2 was delivered as a bolus addition, or the endogenous production of H2O2 was not constant. Under these conditions, deviations from linearity were observed when simulation results were plotted according to the linear equations we deduced. Nevertheless, the estimated kinetic parameters were close to the parameters introduced in the simulations. Finally, we tested the application of the equations to real experiments with published experimental data concerning the H2O2 signaling mediated by inhibition of PTPs, namely PTP1B and SHP-2. While in general excellent fittings were obtained, in some cases deviations as those observed when H2O2 was added as a bolus addition were observed. In general, the estimated kinetic parameters (Table 3) are consistent with the published rate constants.
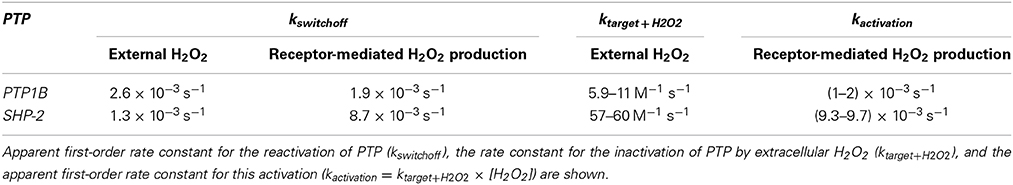
Table 3. Kinetic parameters estimated in this work based on the analysis of published data.
Concerning the parameters describing redox signal switching-off (kswitchoff), which in the case of the PTPs analyzed here corresponds to their reactivation, the results summarized in Table 3 constitute, as far as we know, the first cell-based kinetic estimates for this process. This characterization is relevant because modulation of PTP reactivation regulates cell signaling (Dagnell et al., 2013). For PTP1B, kswitchoff values in the range (1.9–2.6) × 10−3 s−1 were estimated, which are plausible taking into account the known data for PTP1B reactivation. In vitro, reduced thioredoxin (2 μM) reactivates oxidized PTP1B with an apparent rate constant of 1.4 × 10⁻³ s−1 (Parsons and Gates, 2013), which corresponds to a rate constant of 700 M−1 s−1 for this reaction. Thus, considering this rate constant and the kswitchoff values determined here, we estimate the cellular concentration of reduced thioredoxin to be 2–3 μM. This range is close to the value observed experimentally in Jurkat T-cells, 0.43 μM (Adimora et al., 2010), with the difference observed being easily account for different cell lines used or by the participation of alternative thioredoxin-related proteins, like the redoxin TRP14, in the reactivation of PTP1B (Dagnell et al., 2013). This agreement further strengths the validity of the approach we purpose here to reveal kinetic information hidden in typical redox signaling experiments.
For SHP-2, kswitchoff was estimated in the range (1.3–8.7) × 10−3 s−1 (Table 3), which is similar or higher than the range estimated for PTP1B. This is unexpected because the reactivity of SHP-2 toward thioredoxin is about 20 times lower than PTP1B (Parsons and Gates, 2013). Either the cell line rat-1, where SHP-2 reactivation data was obtained (Meng et al., 2002), contains much higher levels of thioredoxin or an alternative system other than thioredoxin is reactivating SHP-2. The second alternative is supported by the observation that in cells lacking thioredoxin reductase TrxR1, a key partner of thioredoxin that keeps it in the reduced state, SHP-2 oxidation remains unchanged (Dagnell et al., 2013).
Concerning the oxidation of PTPs by H2O2, rate constants estimated from experiments in which extracellular H2O2 was added were 5.9–11 M−1 s−1 for PTP1B and 57–60 M−1 s−1 for SHP-2 (Table 3). These values were calculated based on the external H2O2 concentrations added to cells. The actual H2O2 concentration that oxidizes these targets is lower as H2O2 gradients across the plasma membrane are established when cells are incubated with extracellular H2O2 (Antunes and Cadenas, 2000; Marinho et al., 2013b). Thus, the value of these rate constants will be higher if they are based on the actual intracellular H2O2 concentrations that oxidize PTPs. For PTP1B, rate constants obtained in kinetic studies with purified PTP1B are in the range 9–43 M−1 s−1 (Denu and Tanner, 1998; Barrett et al., 1999; Zhou et al., 2011; Marinho et al., 2014), and so a gradient between the extracellular and the intracellular concentration of H2O2 at the site of PTP1B oxidation is estimated to be in the range 2–7 for the experiments analyzed in this work, which matches the lower range of known gradients for human cell lines (Antunes and Cadenas, 2000; Makino et al., 2004; De Oliveira-Marques et al., 2007; Oliveira-Marques et al., 2013). However, gradients as high as 650 have been recently estimated taking into account the participation of peroxiredoxin (Huang and Sikes, 2014), whose role in the degradation of H2O2 is still an open issue (Benfeitas et al., 2014). Thus, the rate constants obtained for PTP1B fit the known quantitative data for the reactivity of this PTP with H2O2.
For SHP-2, the estimated rate constants of 57–60 M−1 s−1 (Table 3) for its oxidation by H2O2 were higher than those determined in vitro with purified SHP-2, which are in the range 9–15 M−1 s−1 (Chen et al., 2009; Zhou et al., 2011). Moreover, if the gradient of H2O2 across the plasma membrane is taken into account this difference will be even higher. Several possible explanations may account for this discrepancy. First, kinetic rate constants obtained in vitro with purified proteins may not reflect rate constants under in vivo conditions (Van Eunen et al., 2010, 2012). Second, peroxy-derivatives such as peroxymonocarbonate (Trindade et al., 2006; Zhou et al., 2011) and peroxymonophosphate (LaButti et al., 2007), which have higher reactivity with PTPs than H2O2, could be the actual species that oxidize SHP-2. Third, the primary sensor of H2O2 may not be SHP-2 but a high-reactive target that slowly relays the oxidation to SHP-2 (Winterbourn and Hampton, 2008; Forman et al., 2010; Brigelius-Flohé and Flohé, 2011; Ferrer-Sueta et al., 2011). Note that the models described here do not distinguish between a mechanism in which a low-reactive sensor is slowly oxidized by H2O2, from a mechanism in which a high-reactive sensor is rapidly oxidized by H2O2 and then, through a thiol-disulfide reshuffling transfer reaction, slowly oxidizes a low reactive sensor such as SHP-2. In general, known data about redox signaling pathways is consistent with either of these two scenarios (Marinho et al., 2014). Distinguishing between these possible alternative mechanisms will be possible after collecting rate constants in several cell lines upon the generalized application of the equations deduced here to redox signaling experiments.
The kinetic parameters estimated from experiments in which cells are activated by receptor-mediated pathways indicated that the apparent first-order rate constant for the oxidation of SHP-2 is about 5 times higher than that for PTP1B (Table 3). Because kactivation = ktarget + H2O2 × [H2O2], either the localized H2O2 intracellular concentration is higher in the experiment in which SHP-2 oxidation was observed, or ktarget + H2O2 is higher for SHP-2 than for PTP1B, or both. In this regard, the EGF receptor, the H2O2 producing enzyme NOX2, and SHP-2 immunoprecipitated all together (Paulsen et al., 2012), supporting the possibility of a highly localized H2O2 signaling pool. For PTP1B, from the kactivation estimation of (1.0–2.0) × 10−3 s−1 the local intracellular H2O2 concentration reached locally in A431 cells, when stimulated by EGF under the experimental conditions described in Lee et al. (1998), is estimated to be in the range 23–220 μM, assuming a ktarget + H2O2 value in the range 9–43 M−1 s−1. Such local concentrations, particularly those in the low range of these values, can potentially be reached upon the concerted action of local production of H2O2 by NADPH oxidases (Chen et al., 2008; Mishina et al., 2011; Paulsen et al., 2012) and localized inhibition of H2O2 removing enzymes (Woo et al., 2010; Rawat et al., 2013). In addition, it can also be suggested that H2O2 diffusion out of membrane-entrapped signaling microcompartments may be constrained, because biomembranes constitute a regulable barrier for H2O2 diffusion (Antunes and Cadenas, 2000; Branco et al., 2004; Bienert et al., 2007; Miller et al., 2010).
While the equations deduced here were applied successfully to typical signaling experiments, a few alterations in the way experiments are carried out will improve the accuracy of parameter estimation. When cells are exposed to extracellular H2O2, we suggest a steady-state delivery so that H2O2 is constant during the experiment (Marinho et al., 2013a), a key assumption considered in the deduction of the equations. If the use of a bolus addition is absolutely needed, we suggest short-term experiments so that the H2O2 decay caused by its cellular consumption is less significant. Finally, removal of H2O2 by adding catalase or replacing extracellular incubation media without H2O2, during the second part of the experiment when target reduction starts to predominate, improves the estimation of kswitchoff values. This last suggestion may also be applied when H2O2 production is triggered by a receptor-mediated mechanism following cell stimulation.
In conclusion, the application of the equations deduced here to typical redox-signaling experiments reveals valuable quantitate kinetic information. Of note, the equations described require only measuring the relative levels of oxidation of a H2O2 sensor target and not absolute concentrations, thus facilitating their application to most experiments. While equations were tested with PTP signaling, they can be applied to other proteins that react with H2O2, such has thiol-proteins and those containing metal-centers. Being characterized by the presence of both multiple parallel pathways and biphasic effects, redox regulation is a field that will benefit from the widespread determination of kinetic parameters. Such knowledge is important to distinguish apparent contradictory biological effects of reactive oxygen species that are involved in pathological damaging pathways and, at the same time, are part of normal functional signaling pathways. In this way, the present knowledge on redox signaling and oxidative stress would be more efficiently translated into therapeutic applications.
Conflict of Interest Statement
The authors declare that the research was conducted in the absence of any commercial or financial relationships that could be construed as a potential conflict of interest.
Acknowledgments
Supported by Fundação para a Ciência e a Tecnologia (FCT), Portugal (PEst-OE/QUI/UI0612/2013 and VIH/SAU/0020/2011).
Abbreviations
PTP1B, Protein tyrosine phosphatase 1; PTPs, protein tryrosine phosphatases; the Src homology 2 (SH2) domain containing phosphotyrosine phosphatase 2 (Shp-2).
References
Adimora, N. J., Jones, D. P., and Kemp, M. L. (2010). A model of redox kinetics implicates the thiol proteome in cellular hydrogen peroxide responses. Antioxid. Redox Signal. 13, 731–743. doi: 10.1089/ars.2009.2968
Pubmed Abstract | Pubmed Full Text | CrossRef Full Text | Google Scholar
Alves, R., Antunes, F., and Salvador, A. (2006). Tools for kinetic modeling of biochemical networks. Nat. Biotechnol. 24, 667–672. doi: 10.1038/nbt0606-667
Pubmed Abstract | Pubmed Full Text | CrossRef Full Text | Google Scholar
Antunes, F., and Cadenas, E. (2000). Estimation of H2O2 gradients across biomembranes. FEBS Lett. 475, 121–126. doi: 10.1016/S0014-5793(00)01638-0
Barrett, W. C., DeGnore, J. P., Konig, S., Fales, H. M., Keng, Y. F., Zhang, Z. Y., et al. (1999). Regulation of PTP1B via glutathionylation of the active site cysteine 215. Biochemistry (Mosc.) 38, 6699–6705. doi: 10.1021/bi990240v
Pubmed Abstract | Pubmed Full Text | CrossRef Full Text | Google Scholar
Benfeitas, R., Selvaggio, G., Antunes, F., Coelho, P. M. B. M., and Salvador, A. (2014). Hydrogen peroxide metabolism and sensing in human erythrocytes: a validated kinetic model and reappraisal of the role of peroxiredoxin II. Free Radic. Biol. Med. 74, 35–49. doi: 10.1016/j.freeradbiomed.2014.06.007
Pubmed Abstract | Pubmed Full Text | CrossRef Full Text | Google Scholar
Bienert, G. P., Møller, A. L. B., Kristiansen, K. A., Schulz, A., Møller, I. M., Schjoerring, J. K., et al. (2007). Specific aquaporins facilitate the diffusion of hydrogen peroxide across membranes. J. Biol. Chem. 282, 1183–1192. doi: 10.1074/jbc.M603761200
Pubmed Abstract | Pubmed Full Text | CrossRef Full Text | Google Scholar
Branco, M. R., Marinho, H. S., Cyrne, L., and Antunes, F. (2004). Decrease of H2O2 plasma membrane permeability during adaptation to H2O2 in Saccharomyces cerevisiae. J. Biol. Chem. 279, 6501–6506. doi: 10.1074/jbc.M311818200
Pubmed Abstract | Pubmed Full Text | CrossRef Full Text | Google Scholar
Brigelius-Flohé, R., and Flohé, L. (2011). Basic principles and emerging concepts in the redox control of transcription factors. Antioxid. Redox Signal. 15, 2335–2381. doi: 10.1089/ars.2010.3534
Pubmed Abstract | Pubmed Full Text | CrossRef Full Text | Google Scholar
Buettner, G. R., Wagner, B. A., and Rodgers, V. G. J. (2013). Quantitative redox biology: an approach to understanding the role of reactive species in defining the cellular redox environment. Cell Biochem. Biophys. 67, 477–483. doi: 10.1007/s12013-011-9320-3
Pubmed Abstract | Pubmed Full Text | CrossRef Full Text | Google Scholar
Chen, C.-Y., Willard, D., and Rudolph, J. (2009). Redox regulation of SH2-domain-containing protein tyrosine phosphatases by two backdoor cysteines. Biochemistry (Mosc.) 48, 1399–1409. doi: 10.1021/bi801973z
Pubmed Abstract | Pubmed Full Text | CrossRef Full Text | Google Scholar
Chen, K., Kirber, M. T., Xiao, H., Yang, Y., and Keaney, J. F. (2008). Regulation of ROS signal transduction by NADPH oxidase 4 localization. J. Cell Biol. 181, 1129–1139. doi: 10.1083/jcb.200709049
Pubmed Abstract | Pubmed Full Text | CrossRef Full Text | Google Scholar
Covas, G., Marinho, H. S., Cyrne, L., and Antunes, F. (2013). Activation of Nrf2 by H2O2: de novo synthesis versus nuclear translocation. Methods Enzymol. 528, 157–171. doi: 10.1016/B978-0-12-405881-1.00009-4
Pubmed Abstract | Pubmed Full Text | CrossRef Full Text | Google Scholar
Cyrne, L., Oliveira-Marques, V., Marinho, H. S., and Antunes, F. (2013). H2O2 in the induction of NF-κ B-dependent selective gene expression. Methods Enzymol. 528, 173–188. doi: 10.1016/B978-0-12-405881-1.00010-0
Pubmed Abstract | Pubmed Full Text | CrossRef Full Text | Google Scholar
Dagnell, M., Frijhoff, J., Pader, I., Augsten, M., Boivin, B., Xu, J., et al. (2013). Selective activation of oxidized PTP1B by the thioredoxin system modulates PDGF-? receptor tyrosine kinase signaling. Proc. Natl. Acad. Sci. U.S.A. 110, 13398–13403. doi: 10.1073/pnas.1302891110
Pubmed Abstract | Pubmed Full Text | CrossRef Full Text | Google Scholar
Denu, J. M., and Tanner, K. G. (1998). Specific and reversible inactivation of protein tyrosine phosphatases by hydrogen peroxide: evidence for a sulfenic acid intermediate and implications for redox regulation. Biochemistry (Mosc.) 37, 5633–5642. doi: 10.1021/bi973035t
Pubmed Abstract | Pubmed Full Text | CrossRef Full Text | Google Scholar
De Oliveira-Marques, V., Cyrne, L., Marinho, H., and Antunes, F. (2007). A quantitative study of NF-kappa B activation byH2O2: relevance in inflammation and synergy with TNF-alpha. J. Immunol. 178, 3893–3902. doi: 10.4049/jimmunol.178.6.3893
Pubmed Abstract | Pubmed Full Text | CrossRef Full Text | Google Scholar
Ferrer-Sueta, G., Manta, B., Botti, H., Radi, R., Trujillo, M., and Denicola, A. (2011). Factors affecting protein thiol reactivity and specificity in peroxide reduction. Chem. Res. Toxicol. 24, 434–450. doi: 10.1021/tx100413v
Pubmed Abstract | Pubmed Full Text | CrossRef Full Text | Google Scholar
Fisher-Wellman, K. H., and Neufer, P. D. (2012). Linking mitochondrial bioenergetics to insulin resistance via redox biology. Trends Endocrinol. Metab. 23, 142–153. doi: 10.1016/j.tem.2011.12.008
Pubmed Abstract | Pubmed Full Text | CrossRef Full Text | Google Scholar
Forman, H. J. (2007). Use and abuse of exogenous H2O2 in studies of signal transduction. Free Radic. Biol. Med. 42, 926–932. doi: 10.1016/j.freeradbiomed.2007.01.011
Pubmed Abstract | Pubmed Full Text | CrossRef Full Text | Google Scholar
Forman, H. J., Maiorino, M., and Ursini, F. (2010). Signaling functions of reactive oxygen species. Biochemistry (Mosc.) 49, 835–842. doi: 10.1021/bi9020378
Pubmed Abstract | Pubmed Full Text | CrossRef Full Text | Google Scholar
Forstrom, J. W., and Tappel, A. L. (1979). Donor substrate specificity and thiol reduction of glutathione disulfide peroxidase. J. Biol. Chem. 254, 2888–2891.
Haque, A., Andersen, J. N., Salmeen, A., Barford, D., and Tonks, N. K. (2011). Conformation-sensing antibodies stabilize the oxidized form of PTP1B and inhibit its phosphatase activity. Cell 147, 185–198. doi: 10.1016/j.cell.2011.08.036
Pubmed Abstract | Pubmed Full Text | CrossRef Full Text | Google Scholar
Huang, B. K., and Sikes, H. D. (2014). Quantifying intracellular hydrogen peroxide perturbations in terms of concentration. Redox Biol. 2, 955–962. doi: 10.1016/j.redox.2014.08.001
Irani, K., Xia, Y., Zweier, J. L., Sollott, S. J., Der, C. J., Fearon, E. R., et al. (1997). Mitogenic signaling mediated by oxidatnts in ras-transformed fibroblasts. Science 275, 1649–1652. doi: 10.1126/science.275.5306.1649
Pubmed Abstract | Pubmed Full Text | CrossRef Full Text | Google Scholar
Iwakami, S., Misu, H., Takeda, T., Sugimori, M., Matsugo, S., Kaneko, S., et al. (2011). Concentration-dependent dual effects of hydrogen peroxide on insulin signal transduction in H4IIEC hepatocytes. PLoS ONE 6:e27401. doi: 10.1371/journal.pone.0027401
Pubmed Abstract | Pubmed Full Text | CrossRef Full Text | Google Scholar
LaButti, J., Chowdhury, G., Reilly, T. J., and Gates, K. S. (2007). Redox regulation of protein tyrosine phosphatase 1B (PTP1B) by peroxymonophosphate (= O3POOH). J. Am. Chem. Soc. 129:5320. doi: 10.1021/ja070194j
Pubmed Abstract | Pubmed Full Text | CrossRef Full Text | Google Scholar
Lee, S. R., Kwon, K. S., Kim, S. R., and Rhee, S. G. (1998). Reversible inactivation of protein-tyrosine phosphatase 1B in A431 cells stimulated with epidermal growth factor. J. Biol. Chem. 273, 15366–15372. doi: 10.1074/jbc.273.25.15366
Pubmed Abstract | Pubmed Full Text | CrossRef Full Text | Google Scholar
Le Moan, N., Clement, G., Le Maout, S., Tacnet, F., and Toledano, M. B. (2006). The Saccharomyces cerevisiae proteome of oxidized protein thiols: contrasted functions for the thioredoxin and glutathione pathways. J. Biol. Chem. 281, 10420–10430. doi: 10.1074/jbc.M513346200
Pubmed Abstract | Pubmed Full Text | CrossRef Full Text | Google Scholar
Mahadev, K., Zilbering, A., Zhu, L., and Goldstein, B. J. (2001). Insulin-stimulated hydrogen peroxide reversibly inhibits protein-tyrosine phosphatase 1b in vivo and enhances the early insulin action cascade. J. Biol. Chem. 276, 21938–21942. doi: 10.1074/jbc.C100109200
Pubmed Abstract | Pubmed Full Text | CrossRef Full Text | Google Scholar
Makino, N., Sasaki, K., Hashida, K., and Sakakura, Y. (2004). A metabolic model describing the H2O2 elimination by mammalian cells including H2O2 permeation through cytoplasmic and peroxisomal membranes: comparison with experimental data. Biochim. Biophys. Acta 1673, 149–159. doi: 10.1016/j.bbagen.2004.04.011
Pubmed Abstract | Pubmed Full Text | CrossRef Full Text | Google Scholar
Marinho, H. S., Cyrne, L., Cadenas, E., and Antunes, F. (2013a). H2O2 delivery to cells: steady-state versus bolus addition. Methods Enzymol. 526, 159–173. doi: 10.1016/B978-0-12-405883-5.00010-7
Pubmed Abstract | Pubmed Full Text | CrossRef Full Text | Google Scholar
Marinho, H. S., Cyrne, L., Cadenas, E., and Antunes, F. (2013b). The cellular steady-state of H2O2: latency concepts and gradients. Methods Enzymol. 527, 3–19. doi: 10.1016/B978-0-12-405882-8.00001-5
Pubmed Abstract | Pubmed Full Text | CrossRef Full Text | Google Scholar
Marinho, H. S., Real, C., Cyrne, L., Soares, H., and Antunes, F. (2014). Hydrogen peroxide sensing, signaling and regulation of transcription factors. Redox Biol. 2, 535–562. doi: 10.1016/j.redox.2014.02.006
Pubmed Abstract | Pubmed Full Text | CrossRef Full Text | Google Scholar
Martínez-Acedo, P., Núñez, E., Gómez, F. J. S., Moreno, M., Ramos, E., Izquierdo-Álvarez, A., et al. (2012). A novel strategy for global analysis of the dynamic thiol redox proteome. Mol. Cell. Proteomics 11, 800–813. doi: 10.1074/mcp.M111.016469
Pubmed Abstract | Pubmed Full Text | CrossRef Full Text | Google Scholar
Meng, T.-C., Fukada, T., and Tonks, N. K. (2002). Reversible oxidation and inactivation of protein tyrosine phosphatases in vivo. Mol. Cell 9, 387–399. doi: 10.1016/S1097-2765(02)00445-8
Pubmed Abstract | Pubmed Full Text | CrossRef Full Text | Google Scholar
Miller, E. W., Dickinson, B. C., and Chang, C. J. (2010). Aquaporin-3 mediates hydrogen peroxide uptake to regulate downstream intracellular signaling. Proc. Natl. Acad. Sci. U.S.A. 107, 15681–15686. doi: 10.1073/pnas.1005776107
Pubmed Abstract | Pubmed Full Text | CrossRef Full Text | Google Scholar
Mishina, N. M., Tyurin-Kuzmin, P. A., Markvicheva, K. N., Vorotnikov, A. V., Tkachuk, V. A., Laketa, V., et al. (2011). Does cellular hydrogen peroxide diffuse or act locally? Antioxid. Redox Signal. 14, 1–7. doi: 10.1089/ars.2010.3539
Pubmed Abstract | Pubmed Full Text | CrossRef Full Text | Google Scholar
Oakley, F. D., Abbott, D., Li, Q., and Engelhardt, J. F. (2009). Signaling components of redox active endosomes: the redoxosomes. Antioxid. Redox Signal. 11, 1313–1333. doi: 10.1089/ARS.2008.2363
Pubmed Abstract | Pubmed Full Text | CrossRef Full Text | Google Scholar
Oliveira-Marques, V., Silva, T., Cunha, F., Covas, G., Marinho, H. S., Antunes, F., et al. (2013). A quantitative study of the cell-type specific modulation of c-Rel by hydrogen peroxide and TNF-? Redox Biol. 1, 347–352. doi: 10.1016/j.redox.2013.05.004
Pubmed Abstract | Pubmed Full Text | CrossRef Full Text | Google Scholar
Parsons, Z. D., and Gates, K. S. (2013). Thiol-dependent recovery of catalytic activity from oxidized protein tyrosine phosphatases. Biochemistry (Mosc.) 52, 6412–6423. doi: 10.1021/bi400451m
Pubmed Abstract | Pubmed Full Text | CrossRef Full Text | Google Scholar
Paulsen, C. E., Truong, T. H., Garcia, F. J., Homann, A., Gupta, V., Leonard, S. E., et al. (2012). Peroxide-dependent sulfenylation of the EGFR catalytic site enhances kinase activity. Nat. Chem. Biol. 8, 57–64. doi: 10.1038/nchembio.736
Pubmed Abstract | Pubmed Full Text | CrossRef Full Text | Google Scholar
Rasband, W. (1997). ImageJ, U. S. National Institutes of Health. Bethesda, MD. Available online at: http://rsb.info.nih.gov/ij/, 1997–2006
Rawat, S. J., Creasy, C. L., Peterson, J. R., and Chernoff, J. (2013). The tumor suppressor Mst1 promotes changes in the cellular redox state by phosphorylation and inactivation of peroxiredoxin-1 protein. J. Biol. Chem. 288, 8762–8771. doi: 10.1074/jbc.M112.414524
Pubmed Abstract | Pubmed Full Text | CrossRef Full Text | Google Scholar
Rinna, A., Torres, M., and Forman, H. J. (2006). Stimulation of the alveolar macrophage respiratory burst by ADP causes selective glutathionylation of protein tyrosine phosphatase 1B. Free Radic. Biol. Med. 41, 86–91. doi: 10.1016/j.freeradbiomed.2006.03.010
Pubmed Abstract | Pubmed Full Text | CrossRef Full Text | Google Scholar
Sies, H. (2014). Role of metabolic H2O2 generation: redox signalling and oxidative stress. J. Biol. Chem. 289, 8735–8741. doi: 10.1074/jbc.R113.544635
Pubmed Abstract | Pubmed Full Text | CrossRef Full Text | Google Scholar
Tanner, J. J., Parsons, Z. D., Cummings, A. H., Zhou, H., and Gates, K. S. (2011). Redox regulation of protein tyrosine phosphatases: structural and chemical aspects. Antioxid. Redox Signal. 15, 77–97. doi: 10.1089/ars.2010.3611
Pubmed Abstract | Pubmed Full Text | CrossRef Full Text | Google Scholar
Trindade, D. F., Cerchiaro, G., and Augusto, O. (2006). A role for peroxymonocarbonate in the stimulation of biothiol peroxidation by the bicarbonate/carbon dioxide pair. Chem. Res. Toxicol. 19, 1475–1482. doi: 10.1021/tx060146x
Pubmed Abstract | Pubmed Full Text | CrossRef Full Text | Google Scholar
Tschopp, J., and Schroder, K. (2010). NLRP3 inflammasome activation: the convergence of multiple signalling pathways on ROS production? Nat. Rev. Immunol. 10, 210–215. doi: 10.1038/nri2725
Pubmed Abstract | Pubmed Full Text | CrossRef Full Text | Google Scholar
Van Eunen, K., Bouwman, J., Daran-Lapujade, P., Postmus, J., Canelas, A. B., Mensonides, F. I. C., et al. (2010). Measuring enzyme activities under standardized in vivo-like conditions for systems biology. FEBS J. 277, 749–760. doi: 10.1111/j.1742-4658.2009.07524.x
Pubmed Abstract | Pubmed Full Text | CrossRef Full Text | Google Scholar
Van Eunen, K., Kiewiet, J. A. L., Westerhoff, H. V., and Bakker, B. M. (2012). Testing biochemistry revisited: how in vivo metabolism can be understood from in vitro enzyme kinetics. PLoS Comput Biol 8:e1002483. doi: 10.1371/journal.pcbi.1002483
Pubmed Abstract | Pubmed Full Text | CrossRef Full Text | Google Scholar
Voit, E. (1991). Canonical Nonlinear Modeling: S-System Approach to Understanding Complexity. New York, NY: Van Nostrand Reinhold.
Winterbourn, C. C., and Hampton, M. B. (2008). Thiol chemistry and specificity in redox signaling. Free Radic. Biol. Med. 45, 549–561. doi: 10.1016/j.freeradbiomed.2008.05.004
Pubmed Abstract | Pubmed Full Text | CrossRef Full Text | Google Scholar
Woo, H. A., Yim, S. H., Shin, D. H., Kang, D., Yu, D.-Y., and Rhee, S. G. (2010). Inactivation of peroxiredoxin i by phosphorylation allows localized H2O2 accumulation for cell signaling. Cell 140, 517–528. doi: 10.1016/j.cell.2010.01.009
Pubmed Abstract | Pubmed Full Text | CrossRef Full Text | Google Scholar
Zhou, H., Singh, H., Parsons, Z. D., Lewis, S. M., Bhattacharya, S., Seiner, D. R., et al. (2011). The Biological Buffer Bicarbonate/CO 2 Potentiates H2O2 -Mediated Inactivation of Protein Tyrosine Phosphatases. J. Am. Chem. Soc. 133, 15803–15805. doi: 10.1021/ja2077137
Pubmed Abstract | Pubmed Full Text | CrossRef Full Text | Google Scholar
Keywords: redox regulation, redox signaling, kinetics, rate constant, PTP1B, SHP-2, protein tyrosine phosphatases
Citation: Brito PM and Antunes F (2014) Estimation of kinetic parameters related to biochemical interactions between hydrogen peroxide and signal transduction proteins. Front. Chem. 2:82. doi: 10.3389/fchem.2014.00082
Received: 18 July 2014; Accepted: 15 September 2014;
Published online: 02 October 2014.
Edited by:
Bulent Mutus, University of Windsor, CanadaReviewed by:
Peizhong Mao, Oregon Health and Science University, USASaptarshi Kar, The University of Western Australia, Australia
Copyright © 2014 Brito and Antunes. This is an open-access article distributed under the terms of the Creative Commons Attribution License (CC BY). The use, distribution or reproduction in other forums is permitted, provided the original author(s) or licensor are credited and that the original publication in this journal is cited, in accordance with accepted academic practice. No use, distribution or reproduction is permitted which does not comply with these terms.
*Correspondence: Fernando Antunes, Departamento de Química e Bioquímica and Centro de Química e Bioquímica, Faculdade de Ciências, Universidade de Lisboa, Campo Grande, P-1749-016 Lisboa, Portugal e-mail: fantunes@fc.ul.pt