Dr. Serge Corbel,
Telephone: +33 3 72 74 38 73; E-mail: serge.corbel@univ-lorraine.fr
© 2019 Sift Desk Journals. All Rights Reserved
VOLUME: 2 ISSUE: 1
Page No: 75-82
Dr. Serge Corbel,
Telephone: +33 3 72 74 38 73; E-mail: serge.corbel@univ-lorraine.fr
Dr. Serge Corbel, Dr. Florian Donat, Prof. Raphaël Schneider
Université de Lorraine, Laboratoire Réactions et Génie des Procédés (LRGP), UMR 7274, CNRS, 1 rue Grandville, BP 20451, 54001
Nancy Cedex, France
Marina Lazarevic(marina.lazarevic@dh.uns.ac.rs)
Anna Malankowska A(anna.malankowska@ug.edu.pl)
Xiuqiang Xie(yjxu@fzu.edu.cn)
Kosar Hikmat Hama Aziz(kosar.hamaaziz@univsul.edu.iq)
Serge Corbel , Kinetic study of photocatalytic degradation of Ifos famide in a microchannel and simulation(2019)SDRP Journal of Nanotechnology & Material Science 2(1)
Among the possible solutions for the intensification of photocatalytic reactions, the use of microreactors is emerging. Such an approach was applied to the photodegradation of Ifosfamide in a flow microreactor with an immobilized catalyst composed of ZnO sensitized with CuInZnxS2+x quantum dots. The conversion yield at a low flow rate was investigated. A computational flow simulation allows to determine an apparent constant rate and the diffusion coefficient towards the photocatalyst surface. Photocatalytic degradation of Ifosfamide can be fitted by the Langmuir-Hinshelwood model. The Sherwood number and the average value of Damköhler show that the photocatalytic reaction under our experimental conditions is limited by the mass transfer.
Keywords: Photocatalysis, Microreactor, Kinetics, Zinc Oxyde, Quantum Dots, Diffusion coefficient.
Advanced oxidation processes and especially photocatalysis are of high interest for the decontamination of water containing pollutants as hospital effluents [1,2]. Heterogeneous photocatalysts employed in a tubular reactor enable the control over reactivity and selectivity [3]. Traditionally, photochemical reactors are operated in batch mode. This configuration leads to a non-uniform distribution of UV light and a mass transfer limitation due to a slow diffusion.
Among the possible solutions for the intensification of photocatalytic reactions, the use of microreactors is emerging [4,5]. Microreactors with channel dimensions of a few hundred microns exhibit larger surface to volume ratio compared to classic reactors [6] and thus enable optimum utilization of incident radiation [7]. The observed reaction rate is at least one order of magnitude higher than that observed in conventional reactors [8].
Zinc oxide (ZnO) has been widely investigated over the last ten years as photocatalyst and has been demonstrated to be of high potential [9]. However, ZnO suffers from two main drawbacks. First, due to its wide bandgap energy (Eg = 3.3 eV) [10]. ZnO can only be activated by light with a wavelength lower than ca. 380 nm to trigger the electron-hole separation. Second, ZnO exhibits a low quantum efficiency due to the fast recombination of photo generated charge carriers (electrons and holes).
In recent reports, our group demonstrated the high photocatalytic activity either under simulated solar light or under visible light irradiation of doped- or QDs-sensitized metal oxides like ZnO or TiO2 [11-14]. The developed photocatalysts were demonstrated to have a high activity for the degradation of dyes like Orange II dye or drugs like salicylic acid. Another interesting application is in the field of health with Ifosfamide (IFOS) as an anti-tumor agent [15]. It is a persistent molecule that is difficult to degrade by traditional methods and whose degradation leads to the production of intermediate products.
Photocatalysis is an interesting alternative for the degradation of IFOS but has only scarcely be investigated. OH radicals are the dominant species for the oxidation of IFOS and de-chlorination is the first step in the degradation of the photocatalytic oxidation process [16].
In this paper, the photocatalytic degradation of IFOS using a CuInZnxS2+x QDs (ZCIS) sensitized ZnO photocatalyst immobilized in a microchannel was investigated under artificial solar irradiation. Our objective is to demonstrate the interest of microreactors for the kinetic study of photocatalytic reactions. The degradation of IFOS under solar irradiation (4 mW/cm2) was carried out using a thin layer of catalyst ZnO/ZCIS deposited in a microchannel. In these conditions, it was possible to initiate and follow the photocatalytic reaction. Degradation of IFOS can be fitted by the Langmuir-Hinshelwood model and external diffusion can be characterized by Sherwood (Sh) and Damköhler (Da) numbers.
Previously, several microchannel reactors have been tested [17-20] in order to determine the best design of microreactors. The one tested in this research is composed of a microchannel with a serpentine shape engraved in a stainless steel support. Figure 1 shows the shape of the microchannel covered by a rectangular glass.
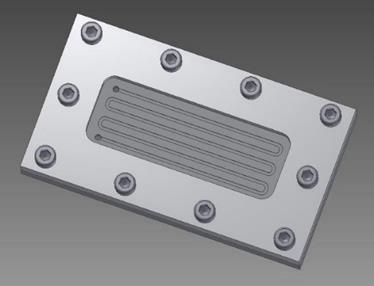
Figure 1. Design of the microreactor with a serpentine microchannel shape with a length of 516 mm.
The fluid flows into the rectangular section of the channel which is 1.5 mm wide, 0.7 mm deep and 516 mm long. The characteristics of the channel geometry and flow are shown in Table 1. At a flow rate of 5 mL/h, the space time is 390s experimentally measured by the crossing time of a bubble between the inlet and the outlet of the microreactor. We have also measured the residence time distribution (RTD) to characterize the reactor. Experiments were realized with the injection of Blue Methylene tracer and absorption of the solution at the outlet. A mean residence time equal to 393s was found which is very close to the observed experimental space time. There was no stagnating zone between catalyst and flow region. Since the Reynolds number is about 1, the flow condition inside the microeactor channel is a laminar flow.
2.1. Photocatalytic composite
Metal oxides such as ZnO have a wide band gap (3,24 eV) which limits its absorption to the UV region. In order to improve the photocatalytic activity, we combined the ZnO semiconductor with ZCIS to form the ZnO/ZCIS composite photocatalyst. Among the good properties of this composite, there is a separation of the charges (e, h+) in order to prevent their recombination [9]. ZnO/ZCIS is an ideal candidate because of its low band gap (2.1 eV) and its low toxicity.
The ZnO/ZCIS photocatalyst was deposited at the bottom of the micro-channel reactor. The amount of deposit was determined by weighing the dried reactor before and after the deposition. Several experiments were performed to determine the minimal mass without limitation of the production of reactive sites. An optimal mass of 40 mg was found. No differences of the conversion were observed with a variation of the concentration above this value.
2.2. Photocatalysis experiments
IFOS solution with an initial concentration varying from 2.5 to 10 mg/L was injected by means of a syringe pump through the microreactor with a constant inlet flow rate of 5 mL/h. Even without irradiation, IFOS is adsorbed on photocatalyst when the flow is crossing the channel, which may result in a decrease of the solution concentration. To take into account this effect, we carried out the photodegradation reaction after waiting for 2 h in the dark in order to reach the adsorption equilibrium.
An artificial solar irradiation with Neon, JBL Solar Color T8 15W, was used. The intensity light was measured with a radiometer below the glass cover and just above the photocatalyst. A value of 4.0 mW cm-² was found.
During the step of irradiation, a sample was withdrawn after regular time intervals at the outlet of the microreactor. The solution of the sample was centrifuged at 15, 000 rpm for 2 min and then injected into an HPLC in order to determine the output concentration of IFOS and then the conversion yield. The signal at 485 nm was used to evaluate the conversion of IFOS.
Table 1: Geometric and flow characteristics of the channel at 5 mL/h.
|
|
Width w (mm) |
depth h (mm) |
Length L (mm) |
Volume V (mm3) |
Space time tp (s) |
Average- Residenc e time u (mm/s) τ (s) |
Mean velocity |
Re |
|
|
1.5 |
0.7 |
516 |
542 |
390 |
393 |
1.32 |
1.26 |
3.1. Adsorption and degradation of Ifosfamide
Under dark conditions, the equilibrium of the adsorption of IFOS was achieved after 90 minutes. The concentration profile obtained from the kinetic experiments using the microreactor with ZnO/ZCIS and initial concentration of 10 mg/L is represented on Figure 2. After the beginning of irradiation (t = 90min), there is a fast degradation which occurs in less than 30 minutes. Nevertheless, there is a simultaneous degradation of secondary products for a longer time of 50 minutes.
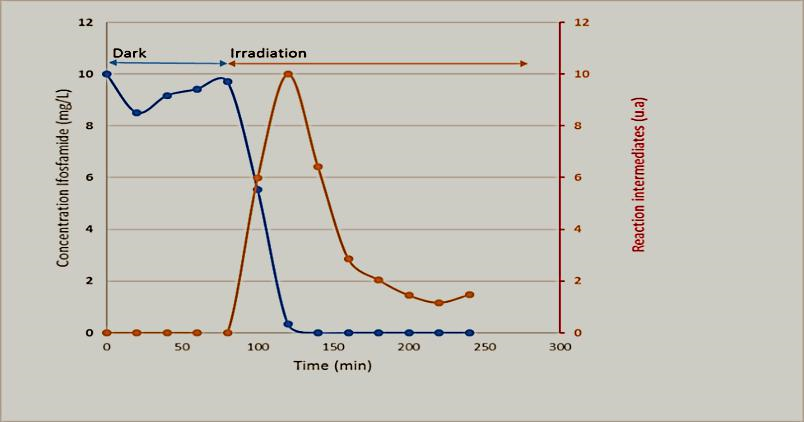
Figure 2. Degradation of Ifosfamide and the secondary products in microreactor under solar light ; Irradiation after 90 minutes in the dark (initial time in the dark).
3.2. Influence of the residence time on the conversion yield
In this case, the experiments were realized at the same flow rate of 5mL/h and C0=10mg/L; the residence time τ is adjusted by changing the reactive volume of the microchannel. This was achieved by connecting several microreactors in series. The final phase was a development of an integrated system with several microreactors. This makes it possible to determine the improvement due to a longer reaction time. The Figure 3 illustrates the variation of the conversion yield as a function of irradiation time in the case of two reactors in series. After reaching the adsorption–desorption equilibrium in the dark during 90 min (Figure 1), C/C0 equals 1 and the irradiation time is started (t=0). A gradual decrease of the concentration of Ifosfamide is observed as a function of the irradiation time (Figure 3). The efficiencies of Ifosfamide degradation by ZCis is determined quantitatively using the pseudo-first-order model C/C0 =exp(−kap t), where kap is the apparent rate constant (min−1) and C0 and C are the concentrations of Ifosfamide at time 0 and t, respectively. The rate constants kap determined for the degradation of the IFOS solution are found by R-squared values on the trend lines; the values are 0.045 (R2=0.9993) and 0.065 min−1 (R2=0.9743) for one reactor and two reactors in series, respectively.
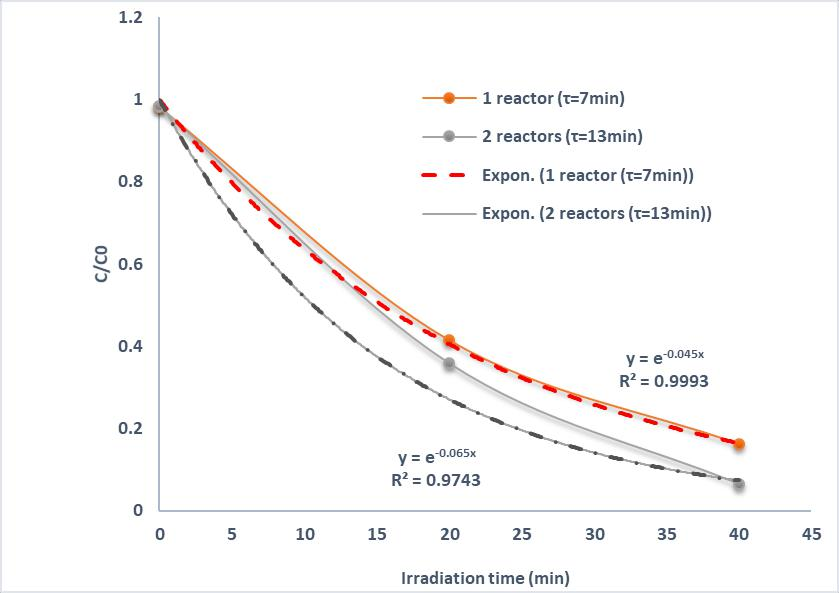
Figure 3. Photocatalytic degradation of Ifosfamide under solar irradiation (light intensity I=4 mW/cm2) ; flow rate Q=5mL/h ; C0=10mg/L; Influence of the space time when connecting several microreactors in series.
3.3. Influence of the initial concentration of Ifosfamide
On the other hand, the effect of the initial IFOS concentration C0 on the photocatalytic degradation by varying the concentration between 2.5 to 10 mg/L. The experiments have been performed with one reactor (516 mm). As can be seen in Figure 4, the initial slope of the curve is almost the same but a significant change occurs on the final conversion yield. It increases when the initial concentration of the pollutant decreases.
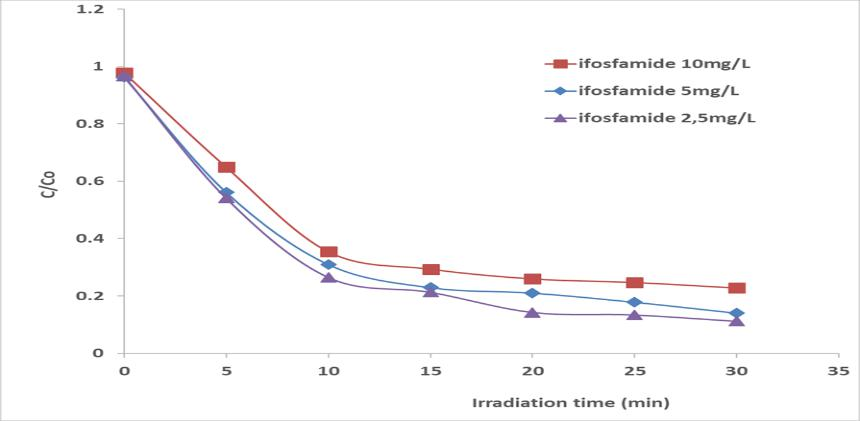
Figure 4. Influence of the initial concentration of Ifosfamide on the degradation; Flow rate = 5 mL/h ; I= 4 mW/cm2.
There is a decrease in the value of the rate constant until the equalization of the adsorption–desorption and kinetic rates. After 30 min of irradiation, the percentage of IFOS concentration levelled off due to the weak amount of concentration remaining in solution and equilibrium rates.
3.4. Modeling with COMSOL Multiphysics
In order to predict the time required for the degradation of IFOS and thus the reactor length needed, the IFOS concentration to the reactive surface Cs was calculated by the Computational fluid dynamics method. The schematic profile in the channel domain is shown in Figure 5.
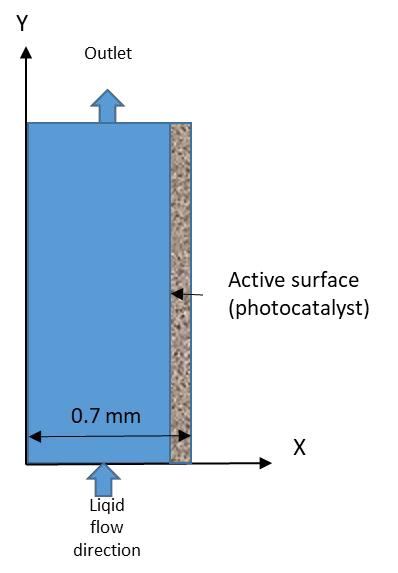
Figure 5. Schematic profile in the channel domain and liquid flow direction.
The model takes into account the convection-diffusion coupling occurring with the flow and the deposited photocatalyst. We introduced an equation reaction rate r at the photocatalytic surface and a mean value of the outlet concentration was used to estimate the fraction of IFOS remaining (C/C0).
Photocatalytic degradation rate of IFOS can be fitted by the Langmuir-Hinshelwood model with the assumption that the photocatalytic degradation occurs between the substrate and the adsorbed reactive species on the photocatalytic surface.
r = k K C/(1+K C). . . . . . . . . . . . . . . . . . . (1)
Where k the intrinsic reaction rate constant and K the adsorption constant. By adjustment of the model with experimental values, we determined these two parameters: k=2.98 10-4 mol m-3 s-1 and K=4000 m3 mol-1.
A Newtonian incompressible flow was adopted to simulate the aqueous solution with a laminar flow distribution in the microchannel. The surface concentration Cs is calculated by the material balance for the surface, including diffusion and a reaction rate.
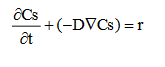 . . . . . . . . . . . . . . . . . . . (2)
where Cs is the surface concentration of IFOS in mol m-2 and r the surface reaction rate. In the model, the surface reaction rate r is considered as a negative boundary flux.
The transport in the bulk of the channel is described by a convection-diffusion equation:
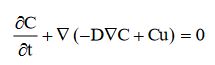 . . . . . . . . . . . . . . . . . . . (3)
In the above equation, D denotes the isotropic diffusion coefficient of IFOS in aqueous solution, and u the flow velocity. In this case, the velocity u(x) in the perpendicular direction (width of the microchannel) equals 0 while the velocity in the parallel direction u(y) of the active surface (length of the microchannel) has a Gaussian distribution due to laminar flow distribution. The value of Reynolds number Re equals 1.3 which corresponds to a laminar flow.
At time t =1 minute, Figure 6 illustrates the convective flow (component y) near the output of the microreactor, and Figure 7 shows the distribution of the diffusive flux inside the microchannel at the same time. There is clearly a concentration gradient between the reaction medium and the catalytic surface corresponding to a limiting thickness of the diffusion layer about 0.2 mm.
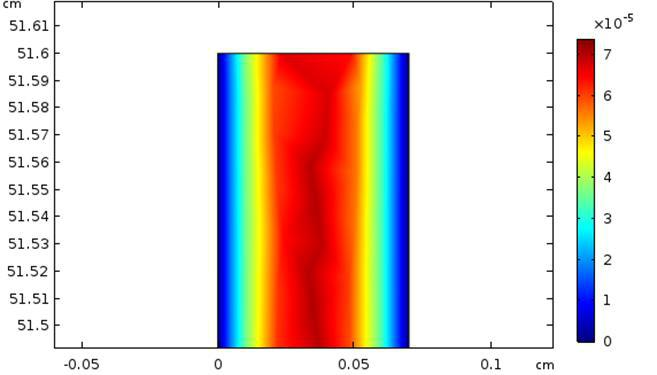
Figure 6. Convective flux inside the microchannel with laminar flow (Re=1.3); flow rate Q=5mL/h.
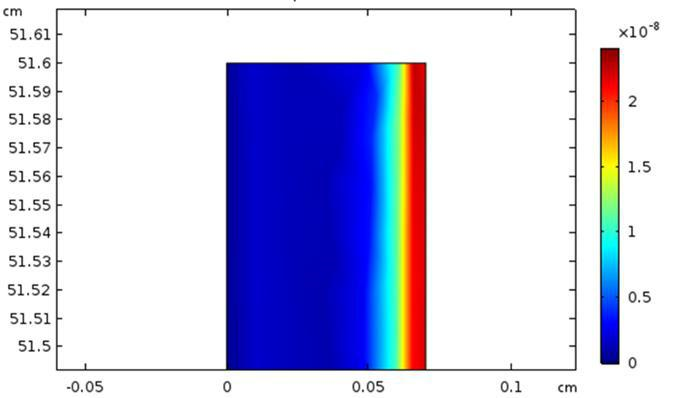
Figure 7. Diffusive flux inside the microchannel and concentration gradient on the right side; flow rate Q=5mL/h.
3.4.1 Kinetic modeling and comparison with experimental results
As can be seen on Figure 8, there is a good agreement between experience and model. In our conditions of 5 mL/h, 70 % of conversion was reached in 20 minutes (C/C0=0.3).
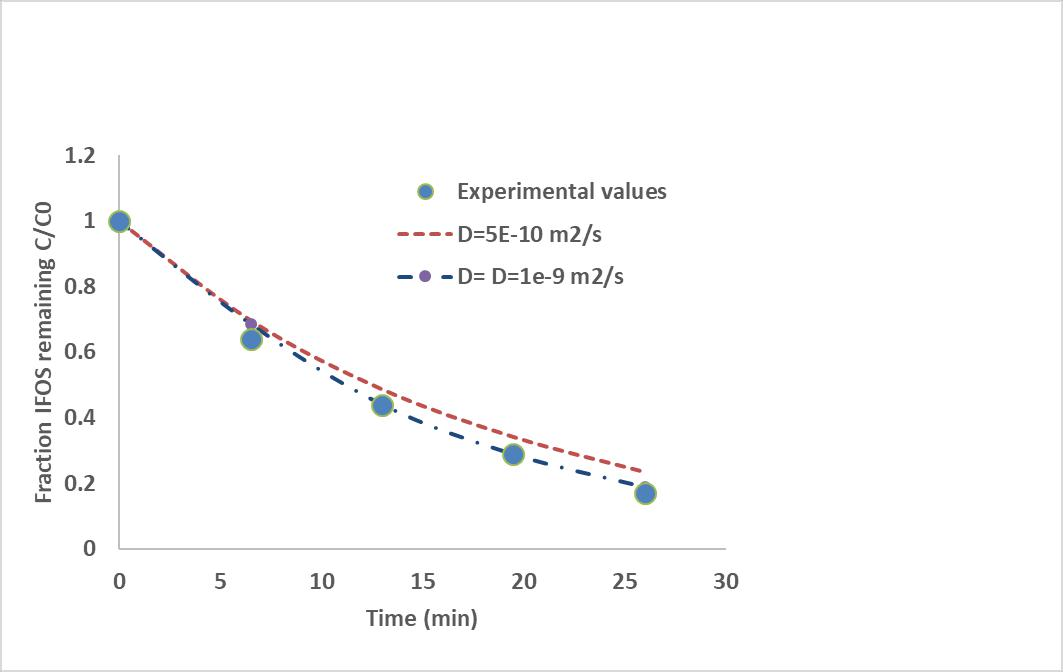
Figure 8. Comparison of experimental result and modeling based on Langmuir-Hinshelwood kinetic parameters Influence of the diffusion coefficient IFOS towards the photocatalyst; flow rate Q=5mL/h.
A small variation of the conversion rate was observed by varying the diffusion coefficient between 5. 10-10 and 10-9 m2 s-1. The adjustment of the model with the experimental results allows to evaluate the diffusion coefficient of IFOS towards the photocatalyst at about 1. 10-9 m2 s-1. This value corresponds to that found in the literature for persistent pollutants like Chlorophenols. For example, Martins et al. [21] find a value of 1. 10- 9 m2 s-1 for the self-diffusion coefficient of 2-chlorophenol in water at 298K in a bulk reactor. Figure 9 shows the diffusion flux which has decreased slightly with the reaction time and that corresponds to the change of concentration gradient over time. The diffusion flux to the catalytic wall compensates for the consumption of the reactants during the passage time in the reactor. In the case of total length of 2m and in our experimental conditions, a diffusion time is evaluated to about 250s.
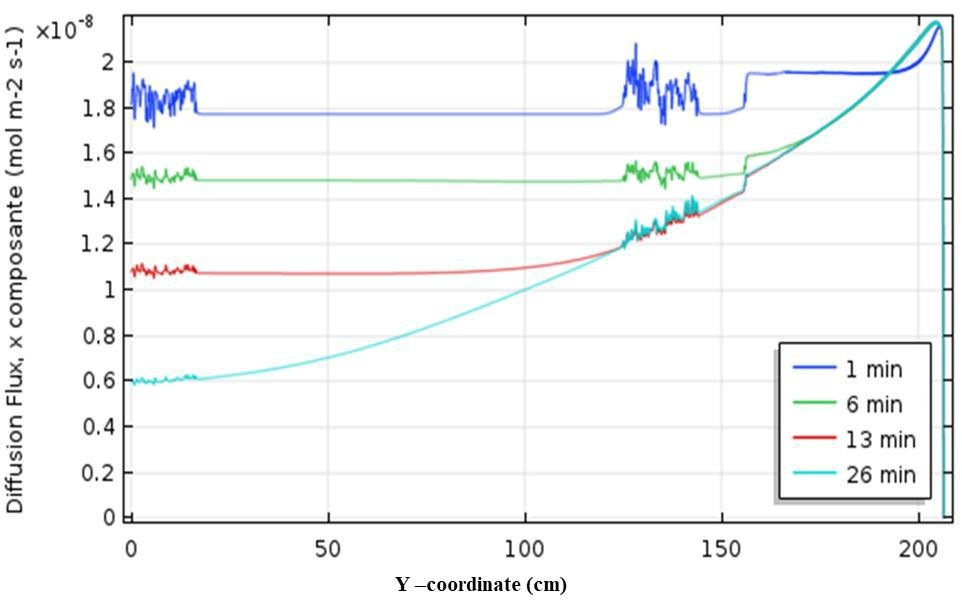
Figure 9. Diffusive flux along the photocatalytic surface and influence of the reaction time during the flow in the reactor.
3.4.2 Mass transport toward catalytic surface
The Sherwood number is a function of the hydraulic channel diameter dh, the diffusion coefficient D and the mass transfer coefficient kd. The hydraulic diameter and the diffusion coefficient are constant whereas the mass transfer coefficient is a function of the concentration of IFOS. As fluid flows along the channel in y-direction, the concentration gradient in x-direction due to the photocatalytic reactions leads to a mass transfer characterized by the mass transfer coefficient kd = Sh*dh/D.
In the Figure 10, Sherwood number is plotted versus coordinate y at a given time (t=20 min). Based on the results of Figure 10, one can estimate the value of Sh number around 1.45 which is in agreement with previous study [20] but slightly lower than the value of 6 found previously.
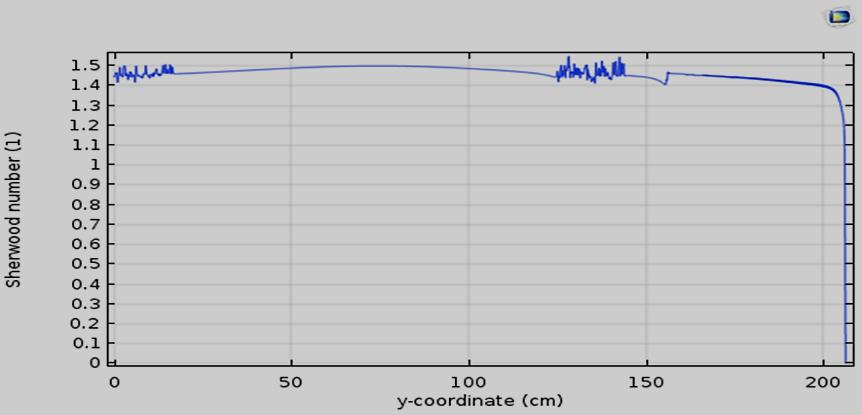
Figure 10. Sherwood number along the catalytic surface with a length of 200 cm.
From the value of Sherwood number, we deduce a mass transfer kd=7.6 10-6 m s-1.
To evaluate the limitation by mass transfer we used the number of Damköhler Da which represents the ratio between the rate of reaction and the rate of transfer [17].
Da=k/(kd*a/K). . . . . . . . . . . . . . . . . . (4)
In which a is the specific area = Catalytic surface / Volume of microchannel. The value of Da around 100 shows that the rate of reaction under our experimental conditions is greater than the transfer of matter and therefore the rate of transfer limits the photocatalytic reaction.
A complete degradation of Ifosfamide and the by-products have been achieved with the analysis of mass transfer and reaction in microchannel reactor. The adjustment of the model with the experimental results allows to evaluate the kinetics constants of the Langmuir-Hinshelwood model (k, K) and diffusion coefficient of Ifosfamide (D). The model makes it possible to predict a conversion percentage of 70% in 20 minutes in a microreactor with a total length of 1.6 m. The Sherwood number and the average value of Damköhler number show that the photocatalytic reaction under our experimental conditions is limited by the mass transfer. There is clearly a concentration gradient between the reaction medium and the catalytic surface corresponding to a limiting thickness of the diffusion layer. CFD modeling allows a perfect control of the process parameters and the use of microreactors is promising for the degradation of pharmaceuticals in water.
We would like to thank the National Agency for Research (ANR CD2I 2013, PRUMOS project).
The authors have declared no conflict of interest.
Symbols used
|
a |
[m-1] |
specific area |
|
C |
[mol L-1] |
IFOS concentration |
|
C0 |
[mol L-1] |
initial IFOS concentration |
|
Cs |
[mol m-2] |
IFOS surface concentration |
|
D |
[m2 s–1] |
diffusion coefficient |
|
Da |
[--] |
Damköhler number |
|
dh |
[m] |
channel hydraulic diameter |
|
h |
[m] |
channel depth |
|
K |
[m3 mol-1] |
adsorption constant |
|
k |
[mol m-3 s-1] |
intrinsic reaction rate constant |
|
k0 |
[min-1] |
initial pseudo first order reaction rate constant |
|
kap |
[min-1] |
pseudo first order reaction rate constant |
|
kd |
[m s-1] |
mass transfer coefficient |
|
L |
[m] |
channel length |
|
Q |
[m3 s-1] |
volumetric flow rate |
|
Re |
[–] |
Reynolds number |
|
t |
[s] |
time duration |
|
t0 |
[s] |
initial time: starting irradiation |
|
tp |
[s] |
space time V/Q |
|
u |
[m s–1] |
mean mass velocity |
|
V |
[m3] |
channel volume |
|
w |
[m] |
channel width |
|
Greek letters |
|
|
|
τ |
[s] |
average residence time |
|
Subscripts |
|
|
|
0 |
|
initial (starting irradiation) |
|
Abbreviations |
|
|
|
CFD |
|
computational fluid dynamics |
|
IFOS |
|
Ifosfamide |
|
OH |
|
radicals |
|
QDs |
|
quantum dots |
|
TiO2 |
|
Titanium dioxide |
|
ZCIS |
|
CuInZnxS2+x (quantum dots) |
|
ZnO |
|
Zinc Oxide |
|
ZnO/ZCIS |
|
composite |
|
ZnS |
|
Zinc sulfide |
Malato S., Fernández-Ibá-ez P., Maldonado M.I., Blanco J., Gernjak W., Catalysis Today 147 (2009) 1–59.
View ArticleHashimoto K., Irie H., Fujishima A., TiO2 Photocatalysis: A Historical Overview and Future Prospects. Jpn. J. Appl. Phys. 44 (2005) 8269-8285.
View ArticleGross B., Hung-Chang Liu J., Dean Toste F., Gabor A. Somajai. Control of selectivity in Heterogeneous catalysis by tuning nanoparticles properties and reactor residence time. Nature Chemistry, 4, (2012).
Teekateerawej S., Nishino J., Nosaka Y., Design and evaluation of photocatalytic micro-channel reactors using TiO2-coated porous ceramics. Journal of Photochemistry and Photobiology A: Chemistry 179, (2006) 263–268.
View ArticleVan Gerven, T., Mul G., Moulijn J., Stankiewicz A., A review of intensification of photocatalytic processes. Chem. Eng. Process, 46, (2007) 781-789.
View ArticleMills PL., Quiram D.J., Ryley J.F., Microreactor technology and process miniaturization for catalytic reactions—A perspective on recent developments and emerging technologies. Chemical Engineering Science 62 (2007) 6992-7010.
View ArticleGeorges R., Meyer S., Kreisel G., Photocatalysis in Microreactors. J. Photochem. Photobiol A: Chemistry, 167 (2004) 95-99.
View ArticlePadoin Natan, Luísa Andrade, Joana Ângelo, Adélio Mendes, Regina de Fátima Peralta Muniz Moreira, Cíntia Soares, Intensification of Photocatalytic Pollutant Abatement in Microchannel Reactor Using TiO2 and TiO2-Graphene, AIChE Journal, April 1, (2016).
Sun JH, Dong SY, Wang YK, Sun SP. Preparation and photocatalytic property of a novel dumbbell-shaped ZnO microcrystal photocatalyst, J. Hazard Mater. (2009) 172:1520-6. PMid:19735975
View Article PubMed/NCBIPawar RC, Shaikh JS, Shinde PS, Patil PS. Dye sensitized solar cells based on zinc oxide bottle brush, Mater Lett (2011) 65:2235-2237.
View ArticleDonat F., Corbel S., Alem H., Pontvianne S., Balan L., Medjahdi G., Schneider R. ZnO nanoparticles sensitized by CuInZnxS2+x quantum dots as highly efficient solar light driven photocatalysts. Beilstein J. Nanotechnol. 8, (2017) 1080-1093 PMid:28685109 PMCid:PMC5480363
View Article PubMed/NCBILabiadh H., Ben Chaabane T., Balan L., Becheik N., Corbel S., Medjahdi G., Schneider R. Preparation of Cu-doped ZnS QDs/TiO2 nanocomposites with high photocatalytic activity. Appl. Catal. B: Environ. 144 (2014) 29-35.
View ArticleMoussa H., Girot E., Mozet K., Alem H., Medjahdi G., Schneider R., ZnO rods/reduced graphene oxide composites prepared via a solvothermal reaction for efficient sunlight-driven photocatalysis, Appl. Catal. B (2016) 185, 11–21.
View ArticleAchouri F., Corbel S., Balan L., Mozet K., Girot E., Medjahdi G., Ben Said M., Ghrabi A., Schneider R. Porous Mn-doped ZnO nanoparticles for enhanced solar and visible light photocatalysis, Mater. Design 101 (2016) 309-316.
View ArticleLin AY. -C., Hsueh JH. -F., Hong P.K.A., Removal of antineoplastic drugs cyclophosphamide, ifosfamide, and 5-fluorouracil and a vasodilator drug pentoxifylline from wastewaters by ozonation, Environmental Science and Pollution Research 22 (2015) 508–515. PMid:25087496
View Article PubMed/NCBIWebber Wei-Po Lai, Hank Hui-Hsiang Lin, Angela Yu-Chen Lin. TiO2 Photocatalytic degradation and transformation of oxazaphosphorine drugs in an aqueous environment. Journal of Hazardous Materials 287 (2015) 133-141. PMid:25644030
View Article PubMed/NCBICharles G., Roques-Carmes T., Becheikh N., Falk L., Commenge J-M., Corbel S., Determination of kinetic constants of a photocatalytic reaction in micro-channel reactors in the presence of mass-transfer limitation and axial dispersion. J. Photochem. Photobiol A: Chemistry: Chem., 223, (2011) 202-211.
View ArticleCharles G., Roques-Carmes T., Becheikh N., Falk L., Corbel S., Impact of the design and the materials of rectangular micro-channel reactors on the photocatalytic decomposition of organic pollutant. Green Processing and Synthesis 1, (2012) 363–374.
View ArticleCorbel S., Charles G., Becheikh N., Roques-Carmes T., Zahraa O., Modelling and design of microchannel reactor for photocatalysis, Virtual and Physical Prototyping, i-First article (2012) 1-8.
Corbel S., Becheikh N., Roques-Carmes T., Zahraa O., Mass transfer measurements and modeling in a microchannel photocatalytic reactor. Chemical Engineering Research and Design, ECCE9 – 9th European Congress of Chemical Engineering 92, (2014) 657–662.
View ArticleMartins LFG., Parreira MCB., Ramalho JPP., Morgado P., Filipe EJM., Prediction of diffusion coefficients of chlorophenols in water by computer simulation. Fluid Phase Equilibria (2015) 396, 9–19.
View Article