Muhammad Musaa Khan
Email: mussakhan369@yahoo.com
© 2019 Sift Desk Journals. All Rights Reserved
VOLUME: 4 ISSUE: 3
Page No: 623-637
Muhammad Musaa Khan
Email: mussakhan369@yahoo.com
Muhammad Musaa Khana, YiYanga,b Islam-ud-Dinc
Anna Parus(anna.parus@put.poznan.pl)
Hassane Makhlouf(drhassanemakhlouf@yahoo.fr)
Marouane Ben Massoud(benmassoudmarouane@yahoo.fr)
Zexin Jin(jzx@tzc.edu.cn)
khan Muhammad Musaa, Impacts of Sugar mill's Effluent on soil and Plant's Seed Germination, Punjab, Pakistan(2019)SDRP Journal of Earth Sciences & Environmental Studies 4(3)
The present study was carried out to assess the physico-chemical analysis of sugar mill effluent and its impact on soil and seed germination of okra and tomato plants. Total 12 samples of sugar mill effluents were collected from different points. Similarly, 12 soil samples were collected from the fields irrigated with sugar mills effluents in radius of 500 meters and at a depth of 8 inches. All the analysis for both the effluents and soil were performed according to the Standard Methods. Mean values of the selected parameters in the effluents were of pH 6.67, total suspended solids (366 mg/L), total dissolved solids (5248 mg/L), biological oxygen demand (475 mg/L), chemical oxygen demand (2662 mg/L), electrical conductivity (3865 μS/m), temperature (55 °C), turbidity (118 NTU), dissolved oxygen (1.8 mg/L), sodium (163 mg/L), calcium (160 mg/L), magnesium (63 mg/L), chlorine (535 mg/L) and bicarbonates (332 mg/L). With respect to heavy metals the value differ iron (1.45 mg/L), zinc (1.51 mg/L), lead (0.18 mg/L), cadmium (0.21 mg/L), copper (0.52 mg/L) and chromium (0.17 mg/L). Most of the parameters mean values were greater than the WHO permissible limits. The results of soil samples analysis indicated that mean values of all the parameters were in permissible limits. Seeds of okra (Abelmoschus esculentus) and tomato (Solanum lycopersicum) showed maximum germination (95% and 90% respectively) at control condition. While at 10% concentration, seed germinated 95% and 90% respectively. At 25% concentration okra showed 90% seed germination concentration while 70% tomato seeds germinated. Okra plant is more vassal as compare to tomato with respect to effluent concentration. Sugar mill effluents are good for vegetation if diluted before irrigation. Crops and soil fertility could be increased by applying environment friendly techniques during effluent discharge.
Keyword: Heavy metals, sugar mill effluents, world health organization, permissible limits, physico-chemicals, germination
Water is the basic requirement of life on this earth. Only 3% of total water on earth makes fresh water, of which a small portion (0.01%) is available for human consumption. Nearly 1.5 billion people have no access to drinking water globally and every year minimum 5 million people die due to water related diseases [1-2]. Definitely, water is the most obligatory requirement not just for life provisions but for the economic and industrial development [3-4].
Sugarcane (Saccharum officinarum L.) is a vital profitable crop of the tropical and subtropical nations. It produces about 70% of the world’s sugar and 30% is from sugar beet and some other sources [5-6]. Sugar industry is periodic in nature and functions only for 4-6 months in the season [7]. The industrial development and change of manufacturing methods have given rise to an increase in the quantity of wastewater discharge into the environment which causes water pollution [8-9]. Brazil is at the top in the production of sugar cane. The following five major manufacturers are China, India, Thailand, Pakistan and Mexico. Pakistan, with respect to sugarcane production is at a 5th position worldwide [10-11]. In this industry sugar cane is used as their new material along with a number of chemicals added during the working process to increase the value of output produced as an end product. During the processing large quantity of water is used and as a result sugar mills discharge large amount of wastewater. The effluent from mill house is normally mixed with different chemicals used during processing [12-13]. Sugarcane itself contain about 70-80 % water, as an effect, large amount of wastewater is generated during its crushing and processing in the industry [14-15]. About 0.73 m3 (730L) of water is generated by every single ton of sugarcane processed. The related environmental issues are disposal of effluent, molasses and air pollution [16-17]. As it is a common practice to use sugar industry effluent for irrigation, therefore, with regards to public health and crop production, it is essential to identify how crops in the field respond when they are irrigated or exposed to industrial wastewater [18-20].
1.1 Sugar Industry in Pakistan
Pakistan is at 5th and 8th number in the world by cane cultivation and sugar production respectively. In Pakistan, in 2016-17, sugar cane was produced on 1.21 million hectares area, out of which Punjab province contributed 64 % by area, whereas Sindh and KP shared 26.3 % and 9.7 % area respectively. The total cane production was 75.4 million tones, of which Punjab, Sindh and KP shared 65 %, 26 % and 9 % respectively. Sugar industry of Pakistan considered well organized, playing vital role, contributing 16% in agricultural economy, giving livelihood to nearly 10 million people [21]. Sindh province maximum yield of cane was (60.9 t/ha) and almost equal production of Punjab (48.72 t/ha) and KP (45.72 t/ha) [22]. Sugarcane production in Baluchistan province is almost zero, only 41000 tons from 800 hectares area. The climatic condition of the Sindh is more suitable for sugar cane production as compared to other areas of the country. Production is low due to the irrelevant pressure of needs and supported methods of cane cultivation [23-24]. Typically sugar mills operate more than 150 days in the year. 30, 45 and 07 sugar mills are operating in Sindh, Punjab and Khyber Pakhtunkhwa respectively. In Pakistan sugar industry is the 2nd leading agro based industry after textile containing 82 sugar mills [25].
In Pakistan, sugarcane is grown on about 1.21 million hectares area and provides raw material for 86 sugar mills. Furthermore, sugar cane and sugar is used in the production of ethanol, fuel ethanol, paper bags, chipboard work, and pressed mud used as organic fertilizer. Since 2011, sugar production has increased due to more area. Sugar recovery data analysis showed that sucrose innards have enlarged by more than 15 % over the last 10 years [26-27].
1.2. Sources of Effluents
The following is the classification of the wastewater generated in different process in the sugar mill industry during its working period and during its crushing period from different section.
a. Mill House
The effluent consists of water used for cleaning the floor of mill house which is responsible to be changed by spills. This clearing up operation will prevent growth of bacteria on the juice-covered floor. Water used for cooling of mills also added to effluents from this source [28].
b. Boiling House Wastewater
The wastewater from boiling house comes through leakage of pumps, pipelines and the washing of various units such as evaporators, juice heaters, clarification, pans crystal and centrifugation etc. The cooling water from numerous pumps also added to water.
c. Wastewater from Boiler Blow-down
The water used in boiler contains soluble and insoluble solids like salts of calcium (Ca), magnesium (Mg) and sodium (Na), fatty salts etc. These salts get concentrated after generation stream from the original water. These solids have to be released time to time to save the boiler being covered up by scales.
d. Excess Condensate Water
The excess condensate does not normally contain any pollutant and is used as boiler feed water and the washing operations. Sometimes it gets contaminated with juice due to entrainment of carryover solids with the vapors being condensed, in that case if goes into the wastewater drain.
e. Condenser Cooling Water
Condenser cooling water is re-circulated again unless it gets contaminated with juice, which is possible due to defective entrainment separators, faulty operation beyond the design rate of evaporation etc. if gets contaminated the water should go into the drain invisibly. This volume of water is also increased by additional condensing of vapors from the boiling juice in the pan.
f. Soda and Acid Wastes
Caustic soda and hydrochloric acid are used for cleaning of the heat exchangers and evaporator in order to remove the formation of deposits or scales on the surface of the tubing. Most of the sugar industries let this valuable chemical go into drains. The soda and acid wash contribute huge amounts of organic and inorganic contaminations and may cause shock loads to wastewater treatment [29]
1.3. Effect of Effluent.
The effluent that is generated from the sugar industry, if used directly for irrigation then it will disturb the soil fertility as well as affect the growth of plant and seeds germination [28]. The sugar mill’s effluent (SME) reduce the rate of seed germination of paddy crops. These effluents also distress the soil. Bacteria and fungi which maintain the soil fertility will be in danger by the highly toxic chemicals releases from sugar industry [30]. The SME having highly toxic chemicals and heavy metals, affect aquatic flora and fauna [11, 31]. It hinders germination of seeds, growth, enzymatic activities, uptake and distribution of micro and macro-nutrients in plant tissues, transpiration rate and relationship of water and plants, and many other interior or exterior activities [32-33].
2. Problem Statement.
Sugar industry is one of the most significant industrial sectors of Pakistan. It is not only providing raw material to the agriculture as fertilizer and many other sectors, but as well offer the livelihood to the local citizens. It likewise, provides the electricity to the nearby villages. Major types of production in the sugar industry are sugar, alcohol, biogas, fertilizer, mud etc. Effluents of sugar industry are openly flowing into the field and soil may affect soil productivity. During all these processes, the industry uses large amount of water for cooling and mixing. Sugar cane also carries large quantity of water in it. These effluents are used for irrigation of crops and vegetables as water and fertilizer. The use of SME may cause many problems to the soil and plants as well. This study dealt with the effect of SME on the seed’s germination of two selected plants as well as impacts on soil.
3.1 Study Area
Sartaj sugar mill located in District Jhang, Punjab Pakistan was selected for samples collection. The study area was surveyed before samples collection to identify sampling points.
3.2 Sampling Strategy
The effluents (SME) were collected from outlet of the sugar mill. Pre-cleaned, acid washed, plastic bottles of 2 liters capacity were used to collect wastewater samples. Then these samples were stored below 4 ºC. Four effluent sample sites were selected to collect in triplicate. Every sample was analyzed for physico-chemical parameters and for the assessment of heavy metals. The samples were collected in January. In the heavy metal’s samples 50% HNO3 were used to bring the pH ˂ 2. All of the samples were transported to PCRWR lab for analysis and were analyzed according to the Standard Methods [34-35]. Moreover, for the seed germination (80L) liter composite effluents samples were collected in four containers having the capacity of 20 liters each [36].
3.3 Chemicals and Regents
Tape water and HNO3 was used to wash the bottles which will be used as a sample conservation followed by washing them with distilled water and lastly with double distilled water [34]. The reagents and chemicals used were of analytical grades with more than 99% purity. Carbon disulfide (99.5%) was supplied by Riedel-deHaen. Dibutylamine (99%), cyclohexyleamine, perchloric acid and sodiumhydroxide were obtained from Fluka. Standard solutions of all heavy metals were prepared by dilution of 1000 ml certified standard solution of corresponding metals ions. All the glassware used in the lab were washed with detergent, tape water, soaked in HNO3 (30%) and then rinsed with double distilled water as required [56].
3.4 Soil Sampling
Soil samples were collected from the fields where sugar mill effluent (SME) was used as irrigation water. Four different sites were selected of radius 500m for soil samples collection where effluent was used to irrigate vegetables. The complex soil surface samples (at 0-30 cm depth) were collected in clean polythene airtight bags. Each bag contained 2-3 kg of soil sample and transported to the soil laboratory of national agriculture research center (NARC), Pakistan for further analysis [27].
3.5 Soil Samples Digestions
Soil samples were first air dried for three days. Then the samples were dried in an oven at 107°C for 24 hrs. The dried samples were ground using a grinding disc mill and then sieved with 75-micron pore size. For sample preparation nitric acid-perchloric acid digestion method was used [37]. Soil sample (1 g) was placed in 250 ml digestion tube and 10 ml of concentrated HNO3 was added. The mixture was boiled for 30-45 minutes to oxidize all easily oxidizable matter. After cooling, 5 ml of 70% HClO4 was added and the mixture was gently boiled till the appearance of dense white fumes. The contents were cooled, and 20 ml of distilled water was added and boiled again till the complete absence of fumes. The solution was cooled again, filtered through Whatman No. 42 filter paper and transferred to 25 ml volumetric flask. The volume was made up to the mark with distilled water [34, 38, 52].
3.6 Physio Chemical Analysis of Effluent and Soil
Temperature, pH, EC, turbidity and dissolved oxygen (DO) of the samples were measured in situ immediately while other parameters i.e., TDS, TSS, BOD, COD, P, K, Ca, Mg, Cl1-, HCO3–, Fe, Zn, Cd, Cu, Cr and Pb contents were analyzed in the laboratory by following Standard Methods [34]. The pH, TDS and EC were measured by using YK 2005 WA HI meter [46, 54]. The turbidity was measured by HI 93703 turbidity meter. All lab instruments were calibrated with their standard before using and taking reading of the selected samples. Analysis of Cr, Cu, Zn, Fe, Cd, Pb, were carried out by using AAS-Analytic Janna atomic absorption spectrometer. All the standard solutions were prepared by using double ionized distilled water [39, 51].
3.7 Decolonization of Effluent
The samples were brought in the laboratory and then digested. The digestion was performed by taking 10 ml of sample, mixed with 5 ml of concentrated HNO3 and 5 ml of concentrated HCl. This mixture was stirred gently, covered with watch glass and left at room temperature for an hour. Samples were then heated on hot plate until yellow fumes were released and the solution became clear. After cooling the acid solution was filtered by Millipore filter (0.4µ) and volume was made up to 50 ml by adding deionized water [40-41, 44].
3.8 Seed Germination Experiment Design
Pots of 5 kg capacity were used for the study of seed germination. Each pot was filled with 2-3 Kg well composed soil, first air-dried and filtered to remove debris and mixed with equal quantity of farmyard manure. Each pot was irrigated daily with 250-500 ml of SME in six different concentrations of 5 %, 10 %, 25 %, 50 %, 75 % and 100 % along with bore well water used as control. The plants growth was investigated on weekly basis [42]. The morphological parameters like germination percentage, seedling length and fresh % dry weights of the plants were observed. Root and shoot length were also absorbed [43, 48-50].
3.9 Seed Germination Percentage
As per pot size and congestion of seeds growth, seven (07) seeds of the selected plants were sown in each pot at less than a half inch under soil cover and were placed under direct sun light for eight to ten hour a day. Seed germination percentage was determined within 1st week of the seedlings. The germination percentage was identified by using the following formula:
The concentration of SME varies and the number of pots were fix for every concentration. Five (5) pot in a row were fixed with respect to concentration doze of SME.
Germination Percentage=(Number of seeds germinated)/(Total number of seeds sown)×100
4.1 Physico Chemical Analysis of Effluent
Results of SME analyses for pH, EC, DO, Ca, Na, are summaries in Table 1.
Table 1 Physico-chemical parameters of the SME samples
|
Parameter |
S1 |
S2 |
S3 |
S4 |
Standards (UNO/WHO)* |
|
Temp oC |
57 |
70 |
42 |
50 |
40 |
|
Color |
Dark yellow |
Yellow |
Dark Brown |
Yellow |
|
|
EC (μS/m) |
3387 |
4760 |
4122 |
3190 |
1000 |
|
Turbidity (NTU) |
125 |
116 |
122 |
110 |
25 |
|
pH |
8.1 |
5.54 |
7.6 |
5.8 |
6-9 |
|
DO (mg/L) |
1.18 |
1.35 |
1.55 |
3.23 |
4.5-8 |
|
TSS (mg/L) |
410.66 |
373.33 |
413.33 |
268.33 |
150 |
|
TDS (mg/L) |
4846 |
5233.33 |
5570 |
5342 |
3500 |
|
BOD (mg/L) |
487 |
717 |
366 |
331 |
80/200 |
|
COD (mg/L) |
1491 |
1400 |
3712 |
4047 |
150 |
|
HCO3 (mg/L) |
302 |
417.7 |
310.7 |
297.33 |
440 |
|
Na (mg/L) |
167 |
165 |
160.33 |
161 |
200 |
|
Ca (mg/L) |
169 |
169 |
138.33 |
162 |
200 |
|
Mg (mg/L) |
57 |
52 |
74 |
70 |
100 |
|
K (mg/L) |
45.33 |
42.7 |
32.33 |
42.33 |
N/A |
|
Cl (mg/L) |
413 |
435 |
863 |
428 |
1000 |
|
P (mg/L) |
8.85 |
9.29 |
7.28 |
7.33 |
N/A |
* Source: [44-46]
Numerous physico-chemical parameters were examined to evaluate the quality and characteristics of the collected effluent as well as soil samples according to WHO guidelines and NEQS of wastewater.
4.1.1 Heavy Metals Analysis of Effluent and Soil Sample
Heavy metals were analyzed in SME samples and the values are given in Table 2.
Table 2 Concentration of heavy metals (mg/L) in SME
|
Parameters |
S1 |
S2 |
S3 |
S4 |
Standards for wastewater(WHO/UNO)* |
|
Fe |
1.99 |
2.03 |
0.82 |
0.98 |
2.0 |
|
Zn |
2.12 |
1.46 |
1.4 |
1.09 |
5.0 |
|
Cd |
0.16 |
0.05 |
0.42 |
0.19 |
0.10 |
|
Cu |
0.16 |
0.17 |
0.15 |
1.6 |
1.00 |
|
Cr |
0.19 |
0.12 |
0.21 |
0.15 |
1.0 |
|
Pb |
0.206 |
0.20 |
0.13 |
ND |
0.20-0.50 |
*Source: [44, 46]
As different literature studies showed that SME are used for irrigation. Different kind of crops and vegetables were watered by that effluent which affects soil characteristics. Soil was also analyzed for some metal contents and the results are shown in Table 3.
Table 3. Concentration (mg/kg) of metals in sugar effluent irrigated soil
|
Parameters |
S01 |
S02 |
S03 |
S04 |
Standards (WHO/NEQs)* |
|
Fe |
20.85 |
21.2 |
20.52 |
21.63 |
N/A |
|
Zn |
10.86 |
9.45 |
11.09 |
11.42 |
600-1100 |
|
Cd |
0.063 |
0.302 |
0.079 |
0.075 |
0.43 |
|
Cu |
2.34 |
1.72 |
2.11 |
2.16 |
200-270 |
|
Cr |
0.332 |
0.261 |
0.344 |
0.342 |
11 |
|
Pb |
1.42 |
1.62 |
1.64 |
1.51 |
200 |
|
K |
2858 |
1441 |
2558 |
2655 |
N/A |
|
P |
78.24 |
82.6 |
83.57 |
78.94 |
N/A |
Source*: [38, 47]
Basic tools of statistics such as mean value, standard deviation, minimum and maximum (range) of tested parameters in all soil samples and effluent samples collected from the selected sites of district Jhang are presented in Table 4 and 5 respectively.
Following Table shows analyzed parameters in soil samples collected from agricultural fields irrigated with sugar mill effluent (SME).
Table 4 Statistical analysis of soil irrigated by SME Table 5 Basic descriptive statistics of analyzed parameter of heavy metals
|
Parameters (ppm) |
N |
Minimum |
Maximum |
Std. Deviation |
Parameters (ppm) |
Number(N) |
Minimum |
Maximum |
Std. Deviation |
|
Iron |
4 |
20.52 |
21.63 |
.47603 |
Fe |
4 |
1.43 |
2.03 |
0.28937 |
|
Zinc |
4 |
9.45 |
11.42 |
.86766 |
Zn |
4 |
1.09 |
2.12 |
0.43308 |
|
Cd |
4 |
.06 |
.63 |
.28018 |
Cd |
4 |
0.05 |
0.20 |
0.06160 |
|
Cu |
4 |
1.72 |
2.34 |
.26107 |
Cu |
4 |
0.15 |
1.60 |
0.72072 |
|
Chromium |
4 |
.26 |
.34 |
.03944 |
Cr |
4 |
0.12 |
0.21 |
0.04031 |
|
Pb |
4 |
1.42 |
1.63 |
.09950 |
Pb |
4 |
0.00 |
0.20 |
0.09430 |
|
Potasium |
4 |
1441.00 |
2858.00 |
637.04997 |
Valid N |
4 |
|
|
|
|
Phosphorus |
4 |
78.00 |
83.56 |
2.89201 |
|
||||
|
Valid N |
4 |
|
|
|
|
||||
4.3 Result Discussion of Sugar Mill Effluents Physio Chemical Parameters
The results of examined parameter in the SME samples are described as follows.
4.3.1 pH values
Acidic or basic nature of the pH of a solution normally range from 6-9 gave protection for the aquatic life. Figure 1 shows the pH values of analyzed of SME samples. The pH values of some of the samples were lower than the minimum permissible level (6-9) and were acidic in nature. The lower pH value may cause of deterioration of water quality. Extreme changes in pH (acidity and alkalinity) can exert stress condition or put an end to aquatic life. The maximum mean pH value was 8.10 and the minimum pH was recorded as 5.53. It shows the acidic nature of effluent and may cause negative effects on nearby soil and water used for the crop’s irrigation.
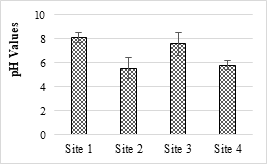
Figure 1. pH of the selected SME samples
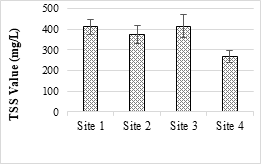
Figure 2. TSS value of the selected SME samples
4.3.2 Total Suspended Solids (TSS)
The highest value of TSS was recorded as (413.33 mg/L) while minimum value was recorded as (268 mg/L). All values were above the permissible limits of NEQS (150 mg/L). TSS may also cause depletion of oxygen supplies at the bottom and cause the production of fowl smelling and lethal gases such as methane, carbon monoxide, ammonia and hydrogen sulfide.
4.3.3 Electrical Conductivity (EC)
The EC of examined samples was ranged from 3190 µS/m to 4760 µS/m. All samples have EC above the safe limit set under NEQS (1000 µS/m) (Figure 4). EC increases as the total dissolved content of effluent increases. These effluents if used for irrigation purposes will affect soil fertility and plants growth.
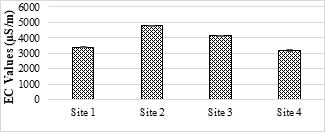
Figure 3. EC value of the selected SME samples
4.3.4 BOD and COD values
The BOD5 values of SME samples were ranged from 330.7 mg/L to 716.66 mg/L. It was found that all the samples had higher BOD values than the NEQS value (200 mg/L). The higher BOD values may be attributed to the leakage of molasses and sugar contents on the mill floor and are washed away with the effluents and thus increase the level of BOD [53]. The highest value of COD was 4046 mg/L while minimum value was 1400 mg/L. COD values of all the samples were above the permissible limit (150 mg/L) set under the NEQS as well as WHO. The SME is used for different purposes such as irrigation, fish farming ponds and animals drinking directly. High COD deteriorate water quality and may harm aquatic life and decrease soil fertility. Therefore, SME must not be discharged into environment without proper treatment.
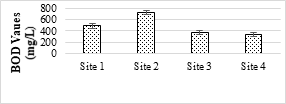
Figure 4. BOD value of the SME samples
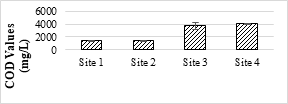
Figure 5. COD value of the SME samples
4.3.5 Concentration of Chloride (Cl-1) and Bicarbonates (HCO3)
Cl-1 values in all the samples were below the safe limit of NEQS (1000 mg/L). The minimum value was 413.33 while the maximum was 863.33 mg/L. Cl-1 ion should be at minimum level as it causes salinity and hardness. Cl-1 ion mostly exists in natural water and help in dissolving other deposits coming from industries, sewage etc. The analyzed samples show different concentrations of bicarbonates. The maximum value was 417.66 mg/L, while the minimum value was 297 mg/L. No limit has been set for HCO3 by Pak-EPA and WHO for industrial effluents.
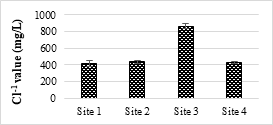
Figure 6a. Chloride value of effluents
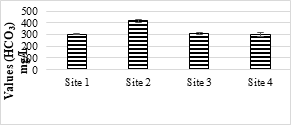
Figure 6b. Bicarbonate values of effluents
4.4. Heavy Metal Concentration in Effluent
4.4.1. Iron and Zinc Concentration Values
The maximum value of Fe found in the sample was 2.03 mg/L and the minimum was 1.43 mg/L. Fe values in some of the samples were higher than the permissible limit of NEQS (2 mg/L). This higher concentration of Fe may be cause pathogenic microbial growth in the SME and other water bodies as well as soil. In the analyzed samples of SME, the maximum and minimum values of Zn were 2.12 mg/L and 1.09 mg/L respectively. Zn values in all samples were within the NEQS permissible levels (5.0 mg/L). Absorption of higher amounts of Zn causes necrosis, chlorosis and also affects plants growth.
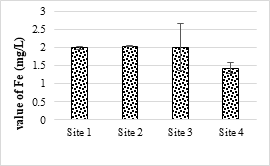
Figure 7. Iron metal concentration in effluents
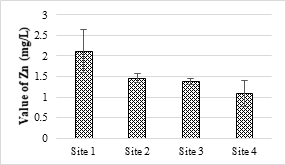
Figure 8. Zinc metal concentration in effluents
4.4.2 Concentration of Cadmium and Cupper
Cd was not detected in all the samples. The minimum detectable limit of Cd was 0.05 mg/L for the AAS. The US-EPA set a maximum contaminant level for Cd at 5 mg/L. The results showed that only site 4 samples contained Cu values higher than the permissible limits of NEQS (1.0 mg/L) for wastewater. Cu is a micronutrient and essential for all living organism but higher concentrations of Cu making water unpleasant to drink and may damage the liver. Even though the effect of low Cu toxicity in human is rear, aquatic life are possibly at risk from Cu exposures [55].
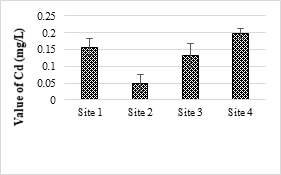
Figure 9. Cadmium metal concentration in effluents
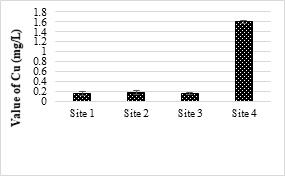
Figure 10. Copper metal concentration in effluents
Aquatic plants absorb three times more Cu than plants on dry lands. Extreme Cu levels can cause damage to roots, by attacking the cell membrane and destroying the normal membrane structure; inhibit root growth and formation of numerous short, brownish secondary roots. Cu becomes toxic for organisms when the rate of absorption is greater than the rate of excretion. As Cu is readily collected by plants and animals, it is very important to reduce its level in the watercourse.
4.4.3. Concentration of Chromium and Lead
The maximum value of Cr was 0.21 mg/L in the analyzed samples and was below the permissible limit set under NEQS (1.0 mg/L). Its toxicity is not considerably acute for fishes and invertebrate. At higher temperature, Cr is generally more toxic and a known human’s carcinogen. The toxic effect of Cr on plants shown as the roots remain small and the leaves narrow with reddish brown stains and small necrotic spots. The concentrations of Pb in all the samples were within the NEQS limit (0.5 mg/L). Pb is a toxic element that stores in the skeletal body. The toxic effects of Pb to fish drops with increasing water hardness and dissolved oxygen [57].
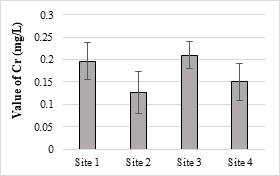
Figure 11. Chromium metal concentration in effluents
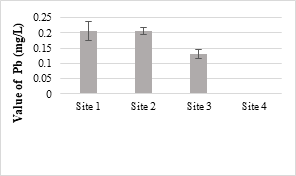
Figure 12. Lead metal concentration in effluents
4.5. Concentration Heavy Metals in Soil
Four sample sites were analyzed, and the maximum value was 21.63 mg/kg while the minimum value was 20.52 mg/kg and all the values were within the permissible limits. The concentration of Zn in the soil samples was ranged from 9.45 mg/kg to 11.42 mg/kg and all values were within the permissible limit of WHO for irrigation water. Zn is one of the important trace elements that play very important role in the physiological and metabolic processes of many organisms. Maximum value of Cd recorded was 0.63 mg/kg while minimum value was 0.06 mg/kg respectively. The maximum value of analyzed sample was 2.34 mg/kg and all the samples were within the safe limit. The values of Cr in all the analyzed samples were ranged from 0.26 mg/kg and 0.34 mg/kg and all were below the permissible limit. The results showed that the maximum value of Pb in soil sample was recorded as 1.63 mg/kg while minimum value was 1.42 mg/kg. It accumulates with time in bones, aorta, liver, spleen and kidneys. It is mostly ingested through food (65%), water (20%) and air (15%) and thus enter the human body.
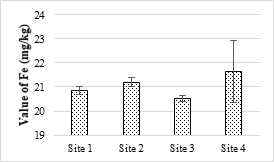
Figure 13. Concentration of Iron metal in selected samples of soil
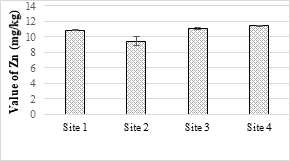
Figure 14. Concentration of zinc metal in selected samples of soil
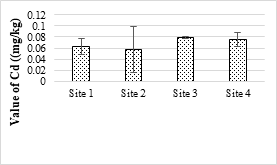
Figure 15. Concentration of cadmium metal in selected samples of soil
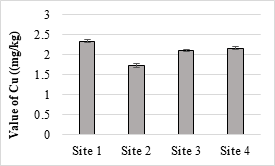
Figure 16. Concentration of copper metal in selected samples of soil
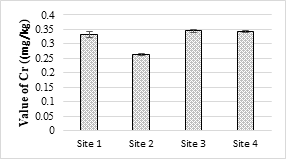
Figure 17. Concentration of chromium metal in selected samples of soil
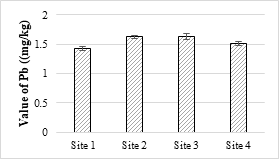
Figure 18. Concentration of lead metal in selected samples of soil
4.6. Seed Germination
Germination means the first appearance of the radicle by optical surveillance. Most of the crops give greater yields when irrigated with wastewater and decrease the demand for chemical fertilizers hence save the total costs of farmers [58]. Following calculation shows the collected and observed germination percentages of okra (Abelmoschus esculentus L) and tomato (Solanum lycopersicum).
Table 6. Effect of SME on seed germination percentage of okra and tomato plants
|
Effluent concentration (%) |
Seed germination percentage (%) |
Time of germination (Hour) |
||
|
Vegetable |
Okra |
Tomato |
Okra |
Tomato |
|
Control |
95 |
90 |
24 |
24 |
|
5 |
95 |
85 |
24 |
24 |
|
10 |
95 |
90 |
24 |
24 |
|
25 |
90 |
70 |
24 |
24 |
|
50 |
60 |
40 |
48 |
48 |
|
75 |
22 |
10 |
48 |
48 |
|
100 |
00 |
00 |
48 |
48 |
|
|
|
|
|
|
The values in Table 8 show that when the SME concentration increased, the seeds germination percentage decreased. The maximum germination of seeds was with control effluents (okra 95 % and tomato 90%) and the minimum germination was for 100 % SME concentration. Up to 25 % effluent concentration, maximum germination of seeds was observed while above that limit seeds germination decreased and at 100% SME the germination of seeds was zero.
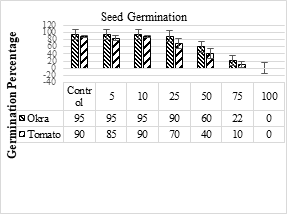
Figure 19 . Germination of selected plants.
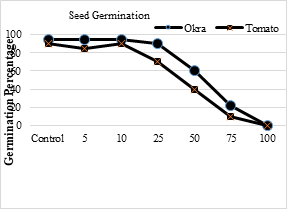
Figure 20. Percentage germination of Okra and Tomato plants
The root length and fresh and dry weight of the selected plants were determined by the Lenin (59).
4.7. Physiological Parameters of the Plants
The root and shoot lengths of the plants was measured at 40th day of germination. The shoot length was measured from the part which was above the soil while the root was measured from the part which was inside the soil. Garden fresh okra and tomato plants were taken and weighed. Then were dried in an oven at 80°C for 24 hours. The dry weight of plants samples was measured by using high accuracy electrical balance. The following table indicates the measured value of the selected plants physiological parameter
The results showed that maximum plants growth was observed for control and from 5% to 25% SME concentrations. Higher concentrations of SME used for irrigation decreased the growth of plants.
Table 7. Root and shoot length of okra and tomato grown in different concentrations of SME
|
Effluent concentration (%) |
Okra |
Tomato |
||
|
Root length (cm) |
Shoot length (cm) |
Root length (cm) |
Shoot length (cm) |
|
|
Control |
33.5±1.64 |
33.8±1.5 |
33±1.41 |
33±2.54 |
|
5% |
35±1.12 |
34±1.67 |
33±1.32 |
41±2.95 |
|
10% |
30±1.30 |
32±1.76 |
29±1.85 |
43±3.22 |
|
25% |
33.2±2.59 |
32±1.78 |
30±2.07 |
47±2.84 |
|
50% |
29±2.01 |
32±2.30 |
30±2.15 |
35±2.o5 |
|
75% |
33.5±2.5 |
31±2.51 |
28±3.21 |
34±2.30 |
|
100% |
00±00 |
00±00 |
00±00 |
00±00 |
Table 8. Fresh and dry weight of okra and tomato grown at different concentrations of Sugar mill effluent
|
Effluent concentration (%) |
Okra |
Tomato |
||
|
Fresh weight (gm) |
Dry weight (gm) |
Fresh weight (gm) |
Dry weight (gm) |
|
|
Control |
30±4.98 |
3±0.54 |
42±2.56 |
6±0.96 |
|
5% |
37±3.7 |
3±0.62 |
37±2.58 |
5±1.09 |
|
10% |
40±2.45 |
10±2.17 |
27±3.58 |
9±1.54 |
|
25% |
38±1.42 |
7±1.15 |
29±2.48 |
6±0.84 |
|
50% |
27±1.31 |
3±0.43 |
23±1.20 |
3±1.45 |
|
75% |
38±2.05 |
8±1.12 |
23±1.73 |
6±0.70 |
|
100% |
00±00 |
00±00 |
00±00 |
00±00 |
Values are mean ± standard error
4.8. One Sample t-test for Heavy Metals.
The following table 9 shows the value of the heavy metals one sample t-test which is mostly used for the mean variation of the values.
|
Parameters |
t |
Df |
Sig. (2-tailed) |
Mean Difference |
95% Confidence Interval of the Difference |
|
|
Lower |
Upper |
|||||
|
Fe |
12.880 |
3 |
0.001 |
1.86350 |
1.4030 |
2.3240 |
|
Zn |
6.988 |
3 |
0.006 |
1.51325 |
0.8241 |
2.2024 |
|
Cd |
4.345 |
3 |
0.023 |
0.13383 |
0.0358 |
0.2318 |
|
Cu |
1.440 |
3 |
0.245 |
0.51900 |
-0.6278 |
1.6658 |
|
Cr |
8.310 |
3 |
0.004 |
0.16750 |
0.1034 |
0.2316 |
|
Pb |
2.810 |
3 |
0.067 |
0.13250 |
-0.0175 |
0.2825 |
The table 9 shows the one sample value of heavy metals in sugar mill effluent.
It was interesting to find out that the seedling growth was lower in control than the effluent concentrations. Seed germination percentage was higher for okra than tomato at the SME concentrations of 5 %, 10 %, 25 % and 50 %. The TSS, TDS COD, BOD, turbidity, Na, Mg, Ca and Cl-1 levels in SME were higher than the permissible limits. The pH value was in acidic range. The concentrations of Cu, Fe and Cd in SME were above the limit. The SME concentrations of 5 %-10 % and 25 % showed better results (almost 90%) for seeds germination. At 75% and above concentrations of SME seeds germination and plants growth rate was almost zero. Concentrated SME can have negative impacts on plants and vegetable growth rate as well as on soil productivity. All these heavy metals and Physico chemical experiment sugar mill effluent was done in Pakistan council of research in water resource (PCRWR) and heavy metals in soil experiment was done in National Agriculture research center (NARC), Pakistan.
Recommendations
With regards to the present study recommendations are given as. The mills effluent should be treated before discharge into the environment by removing suspended solid and correcting the pH value. Coordination between institutions and industries should be strengthened to carry on research and development activities with the objectives to convert nutrient rich effluents into fertilizers to be used in agriculture. Such plants should be introduced which could grow well in such effluents and the plants could be used in industry. “Regular monitoring is necessary be done” by the industry and by law enforcement institution. In-house treatment plant should be installed by the industry. Existing laws should be implemented in true spirit. Farmers should be educated about the proper use of the effluents. Awareness programs should be conducted by the NGOs and Pak-EPA to encourage investor for investment in environment friendly technologies.
Javaid S, Shah SG, Chaudhary AJ, Khan MH. Assessment of trace metal contamination of drinking water in the Pearl Valley, Azad Jammu and Kashmir. CLEAN-Soil, Air, Water. 2008 Feb 1;36(2):216-21.
View ArticleShivappa D, Puttaiah ET, Kiran BR. Physico-chemical characteristics of sugar mill effluents-current scenario in Bhadravathi Taluk, Karnataka, India. Journal of Industrial Pollution Control. 2007;23(2):217-21.
Joshi NC. Effect of hot water treatment of setts for the control of red rot and smut disease of Sugar-cane. Effect of hot water treatment of setts for the control of red rot and smut disease of Sugar-cane.. 1954. 4(8), 23-27
Chhonkar PK, Datta SP, Joshi HC, Pathak H. Impact of industrial effluents on soil health and agriculture-Indian experience: Part I-Distillery and paper mill effluents. Journal of Scientific and Industrial Research, 59(5), 350-361.
Yadav RL, Solomon S. Potential of developing sugarcane by-product based industries in India. Sugar Tech. 2006 Sep 1;8(2):104-11.
View ArticleYaduvanshi NP, Yadav DV. Effects of sulphitation press mud and nitrogen fertilizer on biomass, nitrogen economy and plant composition in sugarcane and on soil chemical properties. The Journal of Agricultural Science. 1990 Jun;114(3):259-63.
View ArticleReddy SS, Raju AS, Kumar BM. Phytoremediation of sugar industrial water effluent using various hydrophytes. International Journal of Environmental Sciences. 2015 May 1;5(6):1147.1154
Manisankar P, Viswanathan S, Rani C. Electrochemical treatment of distillery effluent using catalytic anodes. Green chemistry. 2003;5(2):270-4.
View ArticleBharti PK, Tyagi PK, Singh V. Assessment of heavy metals in the water of Sahastradhara hill stream at Dehradun, India. International Journal of Environment. 2014 Sep 13;3(3):164-72.
View ArticleWiedenfeld B, Enciso J. Sugarcane responses to irrigation and nitrogen in semiarid south Texas. Agronomy Journal. 2008 May 1;100(3):665-71.
View ArticleQureshi AL, Mahessar AA, Leghari ME, Lashari BK, Mari FM. Impact of releasing wastewater of sugar industries into drainage system of LBOD, Sindh, Pakistan. International Journal of Environmental Science and Development. 2015 May 1;6(5):381.
View ArticleHsieh W, Sheen H, Chen C. An approach to zero-effluent in cane sugar factories. InProceedings of the XXII Congress International Society of Sugar Cane Technology 1995 (Vol. 1, pp. 226-31).
Verma A, Singh A. Physico-Chemical Analysis of Dairy Industrial Effluent. Int. J. Curr. Microbiol. App. Sci. 2017;6(7):1769-75.
View ArticleSanjay KS. Environmental pollution and sugar industry in India its management in: An appraisal. Sugar Tech. 2005;7(1):77-81.
View ArticleTrivedy C, Warnakulasuriya KA, Tavassoli M, Steingrimsdottir H, Penhallow J, Maher R, Johnson NW. p53 aberrations in oral submucous fibrosis and oral squamous cell carcinoma detected by immunocytochemistry and PCR‐SSCP. Journal of oral pathology & medicine. 1998 Feb 1;27(2):72-7.
View ArticleGüven G, Perendeci A, Tanyolaç A. Electrochemical treatment of simulated beet sugar factory wastewater. Chemical Engineering Journal. 2009 Aug 15;151(1):149-59.
View ArticleMancera A, Fierro V, Pizzi A, Dumarçay S, Gérardin P, Velásquez J, Quintana G, Celzard A. Physicochemical characterisation of sugar cane bagasse lignin oxidized by hydrogen peroxide. Polymer Degradation and Stability. 2010 Apr 30;95(4):470-6.
View ArticleReddy M, Yanagida JF, McWilliams B. Factors affecting technology adoption in sugar industry: further evidence from Fiji. University of the South Pacific, Centre for Development Studies, School of Social and Economic Development; 1999. 5(6), 1147-1158
Thorpe A, Van Anrooy R. Inland fisheries livelihoods in Central Asia: policy interventions and opportunities. Food and Agriculture Organization of the United Nations; 2009.
World Health Organization. Guidelines for drinking-water quality. World Health Organization; 2004 Aug 31.
Akbar NM, Khwaja MA. Study on effluents from selected sugar mills in Pakistan: potential environmental, health, and economic consequences of an excessive pollution load. Sustainable Development and Policy Institute, Islamabad. 2006 Jun.
Rahman MM, Salleh MA, Rashid U, Ahsan A, Hossain MM, Ra CS. Production of slow release crystal fertilizer from wastewaters through struvite crystallization-A review. Arabian journal of chemistry. 2014 Jan 31;7(1):139-55.
View ArticlePARB. (2016) Punjab Agriculture Research Board, Government of Punjab
Akbar NM, Khwaja MA. Study on effluents from selected sugar mills in Pakistan: potential environmental, health, and economic consequences of an excessive pollution load. Sustainable Development and Policy Institute, Islamabad. 2016 Jun.
Asif M. Sustainable energy options for Pakistan. Renewable and Sustainable Energy Reviews. 2009 May 31;13(4):903-9.
View ArticleIqbal MA, Saleem AM. Sugar beet potential to beat sugarcane as a sugar crop in Pakistan. American-Eurasian Journal of Agricultural and Environmental Sciences. 2015;15(1):36-44.
Agarwal SR, Chaturvedi C, Chaturvedi C. Effect of industrial effluents of a paper and sugar mill on the germination of wheat (Triticum aestivum). J. Livin. Wld. 1995;2:16-9.
Abdel-Rahman EM, Ahmed FB, Ismail R. Random forest regression and spectral band selection for estimating sugarcane leaf nitrogen concentration using EO-1 Hyperion hyperspectral data. International Journal of Remote Sensing. 2013 Jan 20;34(2):712-28.
View ArticleKumar DS, Srikantaswamy S. Evaluation Of Effluent Quality Of A Sugar Industry By Using Physico-Chemical Parameters‖. International Journal of Advanced Research in Engineering and Applied Sciences. 2015;4(1):16-25.
Shivappa D, Puttaiah ET, Kiran BR. Physico-chemical characteristics of sugar mill effluents-current scenario in Bhadravathi Taluk, Karnataka, India. Journal of Industrial Pollution Control. 2007;23(2):217-21.
Doke KM, Khan EM, Rapolu J, Shaikh A. Physico-chemical analysis of sugar industry effluent and its effect on seed germination of Vigna angularis, Vigna cylindrical and Sorghum cernum. Annals of Environmental Science. 2011;5(1):7-11.
Yildirim E, Taylor AG, Spittler TD. Ameliorative effects of biological treatments on growth of squash plants under salt stress. Scientia Horticulturae. 2006 Dec 4;111(1):1-6.
View ArticleHussain I, Iqbal M, Nawaz M, Rasheed R, Perveen A, Mahmood S, Yasmeen A, Wahid A. Effect of Sugar Mill Effluent on Growth and Antioxidative Potential of Maize Seedling. International Journal of Agriculture & Biology. 2013 Dec 1;15(6).
Federation WE, American Public Health Association. Standard methods for the examination of water and wastewater. American Public Health Association (APHA): Washington, DC, USA. 2005.
Yadav A, Rani J, Daulta R. Physico-chemical analysis of treated and untreated effluents from sugar industry. Journal of Environment and Human. 2014 Jul;1:113-9.
View ArticleAwasare, S. D., Bhosale, H. U., & Chavan, N. P.. Effluent Treatment Plant of Sugar Wastewater-A Review. International Journal of Scientific Research in Science and Technology. 2015,4(6), 8-13
Behera BK, Sayeed SA. Effect of sugar mill effluent on oxygen uptake and carbon dioxide output of rice (Oryza sativa Lcv Mushoori) seedlings. Environmental research. 1987 Jun 1;43(1):135-41. 80065-8
View ArticleSharma RK, Agrawal M, Marshall F. Heavy metal contamination of soil and vegetables in suburban areas of Varanasi, India. Ecotoxicology and environmental safety. 2007 Feb 28;66(2):258-66. PMid:16466660
View Article PubMed/NCBIFASIHI S, Malik KB, BASHIR-UD-DIN M, Asghar KA. Feasibility of intercropping sugarcane with wheat and sugar beet in the central region of West Pakistan. West Pakistan Journal of Agricultural Research. 1970;8(2):124-33.
Azeem HA. Analysis of industrial waste water from Kot Lakhpat area (Lahore, Pakistan) by atomic absorption spectrometer. Biologia (Pakistan). 2009;55(1&2):35-41.
Afzal S, Ahmad I, Younas M, Zahid MD, Khan MA, Ijaz A, Ali K. Study of water quality of Hudiara drain, India-Pakistan. Environment International. 2000 Aug 31;26(1):87-96. 00086-6
View ArticleJibril and Omprakash, . Effect of Distillery Industry Effluent on Fertility of Soil and Crops. International Journal of Soil and Crop Sciences. 2014 May 8; 2(3), 039-045
Gassama UM, Puteh AB, Abd-Halim MR, Kargbo B. Influence of municipal wastewater on rice seed germination, seedling performance, nutrient uptake, and chlorophyll content. J Crop Sci Biotech. 2015 Mar 1;18:9-19.
View ArticleKhan M, Kalsoom U, Mahmood T, Riaz M, Khan AR. Characterization and treatment of industrial effluent from sugar industry. Journal-Chemical Society Of Pakistan. 2003 Sep 1;25(3):242-7.
Pakistan WW. Pakistan's water at risk, water and health related issues and key recommendations. Freshwater & Toxics Programme, Communications Division, WWF Pakistan. 2007.
Badgujar, D. M. Impact assessment of sugarcane factory effluents on soil and water in Jalna District of Maharashtra. Indian Streams Research Journal. 2012; 4(12), 203-211
Hasan Z, Anwar Z, Khattak KU, Islam M, Khan RU, Khattak JZ. Civic pollution and its effect on water quality of river Toi at District Kohat, NWFP. Research Journal of Environmental and Earth Sciences. 2012 Mar 1;4(3):334-9.
Islam KN, Misbahuzzaman K, Majumder AK, Chakrabarty M. Efficiency of different coagulants combination for the treatment of tannery effluents: A case study of Bangladesh. African Journal of Environmental Science and Technology. 2011;5(6):409-19.
Janssen WG. Economic and agricultural development in West Asia and North Africa: The need for agricultural research. Food Policy. 1993 Dec 1;18(6):507-22. 90007-X
View ArticleKeshavarzi B, Mokhtarzadeh Z, Moore F, Mehr MR, Lahijanzadeh A, Rostami S, Kaabi H. Heavy metals and polycyclic aromatic hydrocarbons in surface sediments of Karoon River, Khuzestan Province, Iran. Environmental Science and Pollution Research. 2015 Dec 1;22(23):19077-92. PMid:26233736
View Article PubMed/NCBIAgale SV. Chronic leg ulcers: epidemiology, aetiopathogenesis, and management. Ulcers. 2013 Apr 22;2013.
View ArticleYasin S, Iqbal T, Arshad Z, Rustam M, Zafar M. Environmental Pollution from Automobile Vehicle Service Stations. Journal of Quality and Technology Management. 2012;8(1):61-70.
Chhonkar PK, Datta SP, Joshi HC, Pathak H. Impact of industrial effluents on soil health and agriculture-Indian experience: Part II-Tannery and textile industrial effluents.
Pandey DK, Sony P. Impact of distillery effluent on PV, MDG and time taken for germination of A. catechu and D. sisso. Indian J. Forestry. 1994;17(1):35-40.
Adriano, D. C.. Trace elements in the terrestrial environments: Biogeochemistry, bioavailability, and risks of heavy metals. Springer-Verlag, New York, NY. 2001; 2(3), 34-39
Lokhande RS, Singare PU, Pimple DS. Pollution in water of Kasardi River flowing along Taloja industrial area of Mumbai, India. World Environment. 2011;1(1):6-13.
View ArticleMuwanga A, Barifaijo E. Impact of industrial activities on heavy metal loading and their physico-chemical effects on wetlands of Lake Victoria basin (Uganda). African Journal of Science and Technology. 2006;7(1).
View ArticleEzhilvannan D, Sharavanan PS, Vijayaragavan M. Effect of sugar mill effluent on changes of growth and amino acid and protein contents of maize (Zea mays L.) plants. Journal of Ecobiotechnology. 2011 Nov 8;3(7).
Lenin M, Mariyappan KS, Thamarikannan MR. Effect of sago factory effluent on seed germination and seedling growth of gingelly (sesamum indicum L.) varieties. Int. J. Life Sc. Bt. & Pharm. Res. 2014;3(1):2250-3137.