Ademilua
E-MAIL: adeoladimeji@yahoo.com
A Geophysical Approach to Post-Construction Integrity Assessment of Earth Dam Embankment, Case Study of Ero Dam, Ikun- Ekiti Southwest Nigeria
Corresponding Author
Affiliation
*Ademilua, O. L.,Eluwole, A.B. and Talabi, A. O.
Department of Geology, Ekiti State University, P. M. B. 5363, Ado-Ekiti, Nigeria.
Citation
Ademilua Oladimeji Lawrence, A Geophysical Approach to Post-Construction Integrity Assessment of Earth Dam Embankment, Case Study of Ero Dam, Ikun- Ekiti Southwest Nigeria(2016)SDRP Journal of Earth Sciences & Environmental Studies 1(3)
Abstract
Dams and reservoirs are a dynamic slice of our national infrastructure and provide power, water, recreation, irrigation, flood protection, and many other advantages to growing populations across Nigeria. Assessing the integrity of these structures is a critical component of sustained operations. Post-Construction Integrity Assessment of Ero Dam at Ikun- Ekiti Southwest Nigeria was undertaken employing spontaneous potential (SP) and electrical resistivity surveys (VES and Dipole – Dipole) with a view to delineate the subsurface geoelectric sequence/parameters and identify structures such as faults and fractured zones, network of joints, seepages and basement depressions that are threats to the existence of the dam. SP survey revealed that the seepage zones were found within stations 2-4 inbetween distance 10-20m and stations 7-10 within 35-50m on the ground. The calculated SP depths for stations 2 – 4 and 7 – 10 were 5m and 6m respectively. The SP survey indicated the peak negative profile of the streaming potential which is a pointer to an area where there is possibility of seepage in the dam embankment. VES survey revealed that VES 1 depicted HK curve type while both VES 2 and 3 were characterized as H curve. There is marked variation in resistivity with depth across the study area with values that ranged from 37 - 251?m. Areas of lower resistivity are due to an increase in pore water content as revealed in the various resistivity values of the sounding locations. The seepage zone has low resistivity value and constitutes a point of weakness in the dam which can result in flooding of the embankment. Dipole – Dipole assessment of the Dam revealed that the first layer in the subsurface configuration of Ero Dam is laterite (? ranged from 100?m to 230?m). The second layer (leaky part of the dam core) is clay with apparent resistivity values ranging between 45?m and 85?m. The resistivity value between 105?m and 213 ?m approximately represents the intact dam core (weathered rock) which is the third layer characterizing competent zone. The moderately low resistivity layers are zones of interest in terms of post construction integrity assessment of a dam. The dam’s core is made up of clay indicating seepage problem. In view of the SP values and results of VES and Dipole – Dipole surveys, Ero Dam suffers seepage problem and needs rehabilitation and constant maintenance.
Introduction
Water is important for continuity of humans and maintenance/sustenance of ecosystem [1]. Surface water (streams, rivers and lakes) have failed in many occasions to meet human requirements especially in the generation of hydropower energy, provision of water for irrigation facilities, domestic and industrial uses and droughts/floods control. A dam is the cornerstone in the development and management of water resources development of a river basin. Therefore, in the quest for survival, humans have built small to very large and technically complex dams to meet their requirements [2], [3] and [4].
Dams are among the largest and most important civil engineering construction [5] and [6]. A dam may be defined as a solid barrier constructed at a suitable location across a river valley with the view of impounding water flowing through that river [7]. Dams are manmade structures requiring routine inspection and maintenance. Several dams fail every year due to lack of maintenance, and in most cases failure could have been prevented. The ultimate fate of all dams and reservoirs, unless they are carefully constructed and maintained, is deterioration and failure. Deterioration and failure may arise from poor design, improper construction, inadequate maintenance, filling by sedimentation or a combination of the listed factors [8], [9],and [10] examined causes of dam failures worldwide and discovered that 25% of the failures were due to geotechnical problems associated with seepage, inadequate seepage cut-off, faults, dam settlements, sediment filling and landslides. Every dam constitutes a real or potential threat to those who live and work in flow channels below it. In addition, in some locations where earthquake shocks, movements along bedrock faults beneath dams, or collapse of large volumes of earth materials into reservoirs of the dam are distinct possibilities of its failures that are disastrous to life and property. Ero-Ekiti Earth Dam has been constructed over a decade and as such prune to subsurface phenomena such as seepages, fractures, faults and joints which may cause distress on the dam structure and the surrounding environment.
Modern technology utilizes the combined talents of engineers and geoscientists and has arrived at a state of development that enables a pronounced reduction of the risks that are inherent in dam and reservoir construction. An adequate assessment of site geologic and geophysical conditions is one of the most important aspects of a dam safety evaluation. Evaluation of the safety of either a new or an existing dam requires, among other things, that its foundation has been adequately examined, explored and investigated. Dam failure may result in the loss of life, property and income. Therefore, this study examined the post construction integrity of Ero-Ekiti Earth Dam employing electrical resistivity survey with a view to delineate the subsurface geoelectric sequence, determine the geoelectric parameters and identify structures such as faults and fractured zones, network of joints, seepages and basement depressions that are threats to the existence of the dam.
Location and Geology of the Study Area
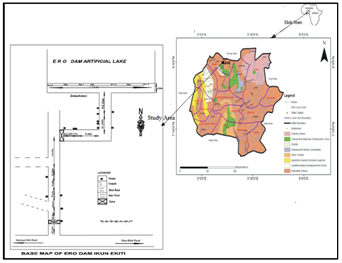
Ikun Ekiti is situated in Moba local government council of Ekiti state and Ero Dam that provides potable water to many towns and villages in the state is situated in Ikun town. The dam was constructed on River Ero which takes its source from the highland region of Orin-Ekiti in Ido-Osi Local Government Area. Many streams/rivers including Afintoto, Ayo, Igo, Igbegbe, Ipu, Irara, Ilogbe eran and Ofu flow as tributaries to River Ero. Geographically, Ero Dam is located on the intersect of latitude 70 35¹N of the equator and on longitude 50 31¹E of the Greenwich meridian. The dam site at Ikun- Ekiti is bounded in the North by Kwara state, in the West by Ikosu-Ekiti, in the South by Ijesamodu-Ekiti and in the East by Ilejemeje Local Government Area (Fig. 1). Ikun –Ekiti is a border town between Ekiti state and Kwara state and it is located at about 70km from Ado-Ekiti, the Ekiti state capital.
Ero dam is a rockfill Earth dam, it’s depth at the centre is about 20-22m and towards the embankment is about 11-15m, the embankment axis covers a total of 230m. The dam was commissioned in 1982 to provide potable water and serve as tourist attraction in Ekiti State. This dam supplies inadequate potable water to seven Local Government Areas (Oye, Moba, Ido-osi, Ilejemeje, Irepodun/Ifelodun, Ijero, and part of Ekiti West LGA.) in Ekiti State.
Two seasons occur in the area; the wet season (April – October) and the dry season (November – March). The town situates on relatively hilly and undulating lands. Geologically, the study area is underlain by Archaean-Early Proterozoic migmatite-gneiss with intercalations of charnockitic rocks of Pan-African age (Fig. 1).
Materials & Methods
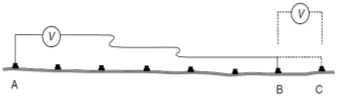
In the present study involving post construction integrity assessment of Ero dam the electrical methods (the self potential method (SP) and electrical resistivity) were employed. The SP method uses the natural current flowing in the ground generated by electrochemical processes to locate shallow bodies of anomalies. It measures the potential arising from the streaming potential, electrochemical, electrokinetic, thermoelectric, pressure gradient and bio-electric processes. The amplitude of the self potential varies from few millivolts up to one (1) volt. The SP survey was carried out using two electrodes separated by a small constant distance, commonly 5 or 10 mk to measure average field gradients relative to a fixed base. One electrode and the meter remain at this point and only the second electrode is moved. Sub-bases must be established if the cable is about to run out or if distances become too great for easy communication. Voltages measured from a base and a sub-base can be related provided that the potential difference between the two bases is accurately known. As illustrated in Fig.2, the end of the cable has almost been reached at field point B, but it is still possible to obtain a reading at the next point C, using the original base A. After differences have been measured between A and both B and C, the field electrode is left at C and the base electrode is moved to B. The value at the new base (B) relative to A is measured directly and also indirectly by measurements of the voltage at the field point C relative to both bases. The two estimates of the voltage difference between A and B are then averaged [11]. Interpretation of SP is qualitative with the anomaly half width providing a rough estimate of depth. SP data are plotted against distance, the depth of the anomaly was determined from the half width method which was calculated from the SP graph using Microsoft Excel. The symmetry or asymmetry of the anomaly provides information on the attitude of the body. The type of overburden can have a pronounced effect on the presence or absence of SP anomalies. Sand has little effect but a clay (the dam’s core) cover can mask the SP anomaly of an underlying body. The SP survey was complimented by the electrical resistivity method because quantitative interpretation is difficult and the depth of penetration is limited to about 30m.
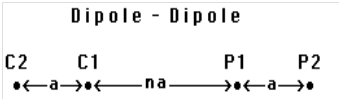
The electrical resistivity survey method employs artificially generated electrical currents using two electrodes to supply a controlled electrical current to the ground with the resulting potential differences measured at the surface using a second pair of electrodes. The Electrical resistivity methods which employ a 1-D vertical electrical sounding (VES) and 2-D subsurface electrical imaging (dipole dipole) were employed in this study. VES technique is extensively used in geotechnical surveys to determine overburden thickness and in hydrogeology to define horizontal zones of porous strata. Data were acquired using Ohmega Ω Resistivity Meter. Schlumberger array with maximum electrodes spread of 150m was used in the VES. Graphs of apparent resistivity against half current electrode spacing (AB/2) on a bi-log graph were plotted and subsequently subjected to partial curve matching. True resistivity and thickness of the layers were subsequently obtained by subjecting the model obtained from the partial curve matching to computer iteration. The 2-D subsurface electrical imaging (dipole dipole) takes into account horizontal changes in the subsurface resistivity in addition to vertical direction. The 2-D surveys are the most practical economic compromise between obtaining very accurate results and keeping the survey costs down [12]. The dipole-dipole arrays are normally used in profiling mode to map lateral as well as depth variations in resistivity. The dipole-dipole configuration employed in this study is presented in Fig 3.
The plotting convention is to plot the values of apparent resistivity at the intersection point of two 45° lines descending from the current pole or dipole and from the voltage pole or dipole.
Dipole dipole electrical resistivity method was presented as pseudo sections, using a computer assisted software Dipro.
Results
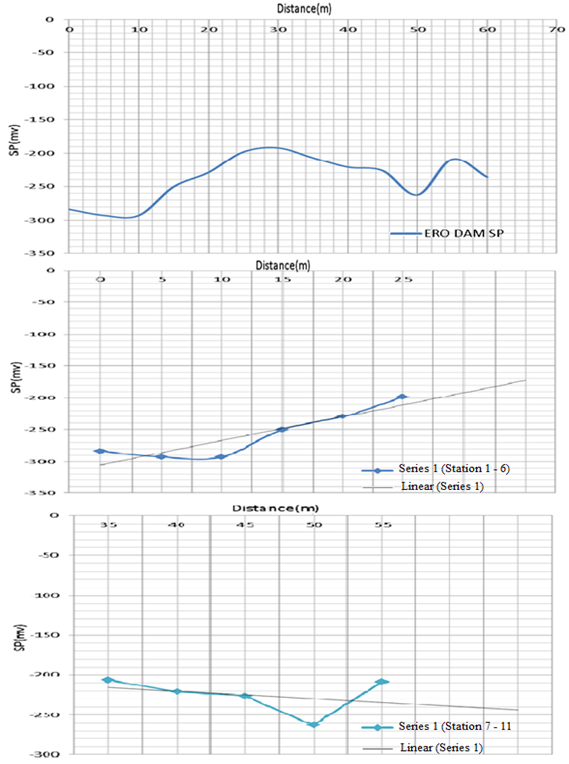
Results of the SP survey are presented as SP graphs (Fig.4). The graphs revealed the conductive and resistive layers of the subsurface. The depth of the anomaly was determined from the half width method which was calculated from the SP graph using Microsoft Excel. The SP graphs indicated the peak negative profile which is indicative of the streaming potential which is a pointer to an area where there is possibility of seepage in the dam embankment. The seepage zones was found within stations 2-4 inbetween distance 10-20m and stations 7-10 within 35-50m on the ground. Calculated SP depths for stations 2 – 4 and 7 – 10 were 5m and 6m respectively. Thus, points observed from SP as succeptible to seepage were slated for probe using VES method and dipole- dipole method.
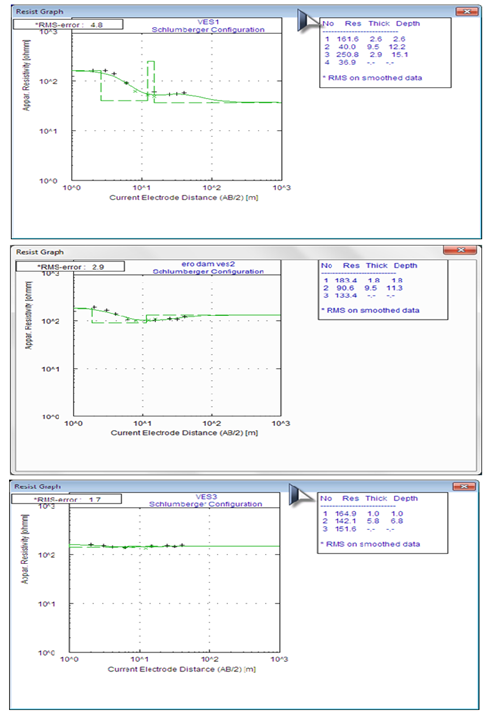
The results of the VES are presented in form of Table (Table.1) and geo-electric curves (Fig. 5). VES 1, 2 and 3 are located on 70 59.44531N and longitude 50 11.60551E, latitude 70 59.44311N and longitude 50 11.60491E and latitude 70 59.43081N and longitude 50 11.59191E respectively. VES 1 depicted HK curve type while both VES 2 and 3 were characterized as H curve. The H- and K- types curve being predominant are indicative of weathered and fractured layers [[13], [7]]. Furthermore, the results equally revealed that the lithology comprised of multilayer’s between 3 and 4 layers, namely the Top soil (lateritic), seepage zone (clay), intact dam’s zone (weathered rock unit), another seepage zone (the fractured rock). There is marked variation in resistivity with depth across the study area with values that ranged from 37 - 251Ωm. Areas of lower resistivity are due to an increase in pore water content as revealed in the various resistivity values of the sounding locations (Table 1 and Fig. 4). The competent dam core which is characterized by high resistivity values indicates lack of seepage zone. The seepage zone has low resistivity value and constitutes a point of weakness in the dam embankment which can result in flooding of the embankment. The moderately low resistivity layers are zones of interest in terms of post construction integrity assessment of a dam.
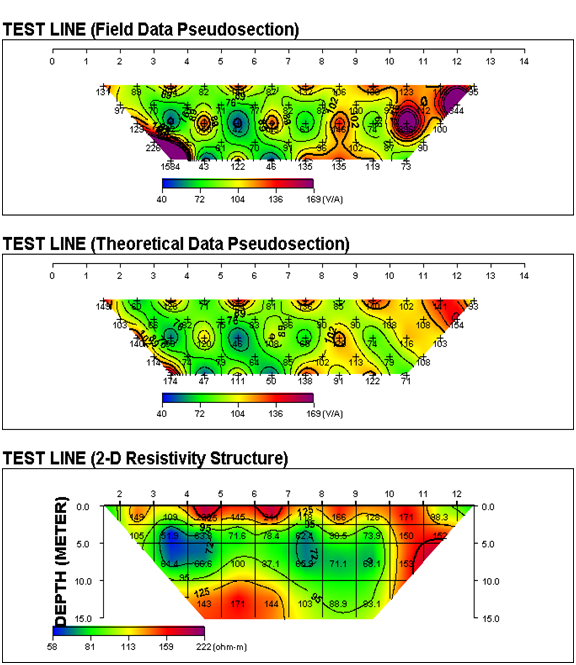
The Dipole – Dipole data were presented as measured apparent resistivity pseudo section, calculated apparent pseudo section and inverse model resistivity section for stations 1-12 (Fig.6). The result indicated that laterite which is the first layer is having resistivity values that ranged between 100Ωm and 230Ωm. The second layer has apparent resistivity values ranging from 45Ωm - 85Ωm which corresponds to the leaky part of the dam core. The resistivity values between 105Ωm to 213 Ωm approximately represent the competent dam core or bedrock which is the third layer. Interpretation from the inverse model resistivity indicates the first four meters (4m) has a high resistivity values indicating the presence of a high resistive material which is the laterite/ topsoil. The dam core (clay) which is the second layer covers approximately four to eleven meters (4-11m) in depth which is characterized by low resistivity values as a result of invasion by water seeping from the dam embankment. The seepage zones are well pronounced between stations two to five(2-5), 10-25m on ground and approximately three to nine meters (3-9) in depth and stations seven and eleven (7-11), 35-50m on ground and an approximate of three to nine meters (3-9m) in depth. The third layer which is the intact core/bedrock covering approximately eleven to fifteen meters (11-15m) in depth is characterized by relatively high resistivity values. Clay are impermeable sedimentary rock that impedes the flow of water, the dam’s core are made up of clay, by the rule of thumb the dam core are expected to have high resistivity values in absence of seepages, but contrary to this is shown by the relationship of the resistivity, SP and VES interpretation. Due to the seepage of water from the dam embankment, the zones saturated by water should be excavated before it leads to increasing deformation and a progressive declination on the integrity of the dam. These seepage zones can be corrected/abridged by grouting.
Conclusion
The post construction integrity of Ero Dam was carried out using SP, VES and Dipole – Dipole electrical resistivity methods. The SP survey indicated the peak negative profile of the streaming potential which is a pointer to an area where there is possibility of seepage in the dam embankment. VES revealed that VES 1 depicted HK curve type while both VES 2 and 3 were characterized as H curve. In addition, the competent dam core (non-seepage area) and the seepage zone have high and low resistivity values respectively. The seepage zone (low resistivity) constitutes the point of weakness in the dam embankment which can result into flooding. Dipole – Dipole assessment of the Dam revealed that the first layer in the subsurface configuration of Ero Dam is laterite ( ranged from 100Ωm to 230Ωm).
The second layer (leaky part of the dam core) is clay with apparent resistivity values ranging between 45Ωm and 85Ωm. The resistivity value between 105Ωm to 213 Ωm approximately represents the intact dam core (weathered rock) which is the third layer. The intact dam core or bedrock which is characterized by high resistivity value which is indicative of competent zone. The moderately low resistivity layers are zones of interest in terms of post construction integrity assessment of a dam. The dam’s core is made up of clay indicating seepage problem. In view of the SP values and results of VES and Dipole – Dipole surveys, Ero Dam suffers seepage problem and needs rehabilitation and constant maintenance.
Acknowledgement
The Authors wish to acknowledge with Gratitude and Appreciation the Geophysics Students’ project group of The Department of Geology of Ekiti State University, Ado Ekiti, Nigeria for their participation and assistance at all the stages of data acquisition for this research work.
Images and Tables
A PHP Error was encountered
Severity: Warning
Message: file_get_contents(): SSL operation failed with code 1. OpenSSL Error messages: error:14090086:SSL routines:ssl3_get_server_certificate:certificate verify failed
Filename: components/article-comp.php
Line Number: 630
Backtrace:
File: /home/siftdesk.org/public_html/application/views/components/article-comp.php
Line: 630
Function: file_get_contents
File: /home/siftdesk.org/public_html/application/views/components/article-details.php
Line: 70
Function: view
File: /home/siftdesk.org/public_html/application/views/article.php
Line: 7
Function: view
File: /home/siftdesk.org/public_html/application/controllers/Home.php
Line: 2262
Function: view
File: /home/siftdesk.org/public_html/index.php
Line: 316
Function: require_once
A PHP Error was encountered
Severity: Warning
Message: file_get_contents(): Failed to enable crypto
Filename: components/article-comp.php
Line Number: 630
Backtrace:
File: /home/siftdesk.org/public_html/application/views/components/article-comp.php
Line: 630
Function: file_get_contents
File: /home/siftdesk.org/public_html/application/views/components/article-details.php
Line: 70
Function: view
File: /home/siftdesk.org/public_html/application/views/article.php
Line: 7
Function: view
File: /home/siftdesk.org/public_html/application/controllers/Home.php
Line: 2262
Function: view
File: /home/siftdesk.org/public_html/index.php
Line: 316
Function: require_once
A PHP Error was encountered
Severity: Warning
Message: file_get_contents(https://www.siftdesk.org/articles/images/107/t1.html): failed to open stream: operation failed
Filename: components/article-comp.php
Line Number: 630
Backtrace:
File: /home/siftdesk.org/public_html/application/views/components/article-comp.php
Line: 630
Function: file_get_contents
File: /home/siftdesk.org/public_html/application/views/components/article-details.php
Line: 70
Function: view
File: /home/siftdesk.org/public_html/application/views/article.php
Line: 7
Function: view
File: /home/siftdesk.org/public_html/application/controllers/Home.php
Line: 2262
Function: view
File: /home/siftdesk.org/public_html/index.php
Line: 316
Function: require_once
References
Olajuyigbe A.E. and Fasakin J.O. (2010) Citizens? Willingness to Pay for Improved Sustainable WaterSupply in a Medium-Sized City in South Western Nigeria Current Research Journal of SocialSciences ISSN: 2041-3246 2(2): 41-50. maxwellsci.com/print/crjss/v2-41-50.pdf
Adams, WM (1975). The Downstream Impacts of Dams Construction, Nigeria Transactions. Institute of British Geographers New Series. No 10 Pg. 290 ? 307.
View ArticleTellam, J. H., Rivett, M. O., Israfilov, R. G. Herringshaw, L. M. (2006). Urban Groundwater Management and Sustainability. Springer Link, NATO Science Series Volume 74 p. 490
View ArticleSagar, S. (2015). Importance of Groundwater as Compatible with Environment. International Journal of Ecosystem 5(3A): 89-92.
View ArticleCoduto, DP (1999). Geotechnical Engineering: Principles and Practice. Prentice
Cai ,W, Zhu J, Zhou S (2007). Advances in environmental impact post project assessment. Environmental pollution and control. 29(7):548 -51. (in Chinese). Hall Inc. Upper Saddle River, New Jersey 07458.
View ArticleAdemilua, OL and Eluwole, AB (2013). Hydrogeophysical Evaluation of the Groundwater
View ArticlePotential of Afe Babalola University Ado-Ekiti, Southwestern Nigeria, Journal of Emerging Trends in Engineering and Applied Sciences USA, Vol. 4 (1) : 77 ? 83. pubs.sciepub.com/ajwr/2/1/4/
Brown, A.J. and Gosden, J.D. (2004) Interim guide to quantitative risk assessment for UK reservoirs, Thomas Telford Ltd., London.
View ArticleWang, QG, Du, YH, Su, Y and Chen, KQ (2012), Environmental Impact Post-Assessment of Dam and Reservoir Projects: A Review. The 18th Biennial Conference of International Society for Ecological Modelling. Procedia Environmental Sciences 13 (2012) 1439 ? 1443.
View ArticleBiswas AK, Charttergee S (1971). Dam Disasters - An Assessment. Eng. J. (Canada), 54(3): 3-8.
Milsom, J. (2003) Field Geophysics. Third Edition. John Wiley and sons, Chichester, United Kingdom.
Dahlin, T (1996). Two-dimensional resistivity for groundwater and environmental applications, in Proceedings of the International Congress on the Environment/Climate (ICE-96), March 1996, Rome, Italy, 1p.
Olorunfemi, MO, Ojo, JS and Akintunde, OM (1999). Hydro-geophysical, Evaluation of the Groundwater Potentials of the Akure Metropolis; Journal of Mining and Geology, Vol. 35 (2), Pp 207-228.