


The β-catenin-dependent Wnt signaling plays a role in adipogenesis, myogenesis, and glucose homeostasis.
The aim of this study was to assess adipose tissue and skeletal muscle expression of Wnt/β-catenin signaling genes in a young healthy population according to insulin sensitivity and its regulation by hyperinsulinemia and free fatty acids.
We examined 117 male volunteers. The participants were divided into subgroups of high-insulin sensitivity (IS) and low-IS on the basis of a 2-hour euglycemic clamp. In 20 subjects, the clamp was prolonged to 6 hours. After 1 week, another 6-hour clamp, with Intralipid/heparin infusion, was performed. Tissue biopsies were performed before each clamp and after 6-hour clamps. Additionally, we collected muscle biopsies from another group of 16 male subjects for cell cultures. Myotubes were treated with insulin separately and in combination with palmitate.
We found decreased adipose tissue WNT10B, FZD1/8, LRP5, DVL2, CTNN1B, TCF7L2, and AXIN2 and increased muscle WNT10B, FZD1/8, LRP6, DVL1, GSK3B, CTNNB1, TCF7L2, AXIN2, MYC, and CCND1 expression in the low-IS group. Hyperinsulinemia resulted in a decrease in adipose tissue FZD4, LRP5/6, TCF7L2, and AXIN2 and an increase in muscle FZD1/8, DVL1/2/3, TCF7L2, AXIN2, and MYC expression. These changes disappeared after free fatty acid elevation. In myotubes, insulin increased the expression of FZD1, DVL2, CTNNB1, and TCF7L2, whereas palmitate abolished these effects.
The association of β-catenin-dependent Wnt signaling with insulin resistance is tissue specific. Observed changes might reflect a compensatory mechanism to increase muscle glucose uptake and to generate new fat cells in insulin-resistant conditions.
The expression of Wnt signaling genes is decreased in adipose tissue and increased in skeletal muscle of subjects with low insulin sensitivity and is differentially regulated by hyperinsulinemia.
Insulin resistance is a state of decreased responsiveness of target tissues to insulin. It leads to a number of interrelated metabolic derangements, including type 2 diabetes (1).
Adipose tissue is an important factor in the regulation of whole-body insulin sensitivity. Adipocytes are highly specialized cells that play an important role in storing of energy as fat (2). Adipose tissue dysfunction contributes to insulin resistance and type 2 diabetes (3, 4). People with enlarged sc adipocytes are more hyperinsulinemic and are at an increased risk for the development of type 2 diabetes, relative to those with similar degrees of adiposity but smaller adipocytes (5, 6). The impaired potential for adipogenesis may cause the progressive filling of existing adipocytes, leading to an overflow of fat into other tissues (7). Adipogenesis is divided into two stages of mesenchymal stem cell commitment to preadipocyte and preadipocyte differentiation to adipocytes. Adipogenesis is tightly regulated at a molecular level by several transcription factors (8).
Another important site of insulin action is skeletal muscle. Decreased insulin-stimulated skeletal muscle glucose uptake is a key feature of insulin resistance and is related to intramyocellular lipid accumulation (9).
Many studies have focused on identifying molecular targets that regulate insulin sensitivity. This potential target could be Wnt signaling. The human genome contains 19 Wnt genes encoding highly conserved cysteine-rich secreted glycoproteins. The Wnt ligands activate either β-catenin-dependent or β-catenin-independent signaling pathways to control cell proliferation, survival, and behavior (10, 11).
The β-catenin-dependent pathway converges on the transcriptional regulator β-catenin. In the absence of Wnt proteins, cytoplasmic β-catenin is recruited to a degradation complex containing glycogen synthase kinase 3β (GSK3β), adenomatous polyposis coli (APC), and axin. This primes β-catenin for ubiquitination and proteasomal degradation. Wnt ligands bind to frizzled (Fzd) receptors and low-density lipoprotein (LDL)-receptor-related protein (LRP)-5 or LRP6 coreceptors and activate dishevelled (Dvl), leading to the inactivation of the degradation complex. This results in the accumulation of cytosolic β-catenin and its translocation to the nucleus in which it binds to the T-cell-specific transcription factor (TCF) family of transcription factors, which includes transcription-factor-7-like 2 (TCF7L2), to activate Wnt/TCF target genes, which include AXIN2, MYC, and CCND1 (10, 11).
The β-catenin-dependent Wnt signaling inhibits adipogenesis and stimulates myogenesis and muscle glucose uptake (12–14). The activation of β-catenin-dependent signal by Wnt member 10b (Wnt10b) represses adipogenesis by blocking the expression of transcriptional regulators of adipogenesis: CCAAT/enhancer-binding protein α (C/EBPα) and peroxisome proliferator-activated receptor-γ (PPARγ) (12). Wnt/β-catenin signaling modulates skeletal muscle development by acting on transcription factors controlling myogenesis such as MyoD (13). Finally, several genes involved in mitochondrial energy expenditure and glucose homeostasis are regulated by Wnt signaling (15, 16). Wnt signaling increases glucose transport through a differential activation of Akt1 and AMP-activated kinase (14). Additionally, the expression of insulin receptor substrate-1 is regulated by β-catenin (17).
Experimental studies indicate that this pathway may be involved in the pathogenesis of insulin resistance, but the data are inconsistent. Adipose-specific expression of Wnt10b impairs the development of adipose tissue and transgenic mice are resistant to diet-induced obesity (18). On the other hand, LRP6+/− mice are protected against diet-induced obesity and insulin resistance by the regulation of genes involved in adipogenesis, metabolism, and insulin signaling (19). However, in another study, the homozygous LRP5 knockout mice showed impaired glucose tolerance after a normal diet (20). It has been shown that Wnt10b deficiency plays a role in the increased intramyocellular lipid accumulation. Myoblasts isolated from Wnt10b-null mice display increased adipogenic gene expression (21).
In humans, genetic variants in the β-catenin-dependent Wnt signaling molecules are associated with type 2 diabetes (22, 23). A large scale genome-wide study revealed that certain single nucleotide polymorphisms in TCF7L2 were associated with the susceptibility for type 2 diabetes (22). However, the molecular mechanisms of the interplay between β-catenin-dependent pathway and insulin sensitivity are unclear, and human data are limited.
Therefore, the aim of our study was to assess adipose tissue and skeletal muscle expression of genes involved in β-catenin-dependent Wnt signaling in a young healthy population according to insulin sensitivity and its regulation by hyperinsulinemia and serum free fatty acid (FFA) elevation.
Materials and Methods
Participants
We examined 117 young (aged between 18 and 35 y), healthy male volunteers. In an additional experiment, designed for muscle cell cultures, we examined 16 male subjects with similar characteristics (mean age 24.44 ± 2.06 y, mean body mass index (BMI), 25.08 ± 2.51 kg/m2). All participants were recruited by local advertisements and from the medical staff and students. All subjects were nonsmokers, without serious diseases, and were not taking any drugs. Anthropometric measurements were performed as described (24). Subjects underwent an oral glucose tolerance test (OGTT), and all had normal glucose tolerance according to World Health Organization criteria. All the studies, including clamps and tissue biopsies, were performed after an overnight fast. The study was approved by the Ethics Committee of Medical University of Bialystok. All subjects gave written informed consent before entering the study.
Insulin sensitivity
Insulin sensitivity (IS) was measured with a 2-hour euglycemic hyperinsulinemic clamp, as described previously (24). Then participants were divided into subgroups with high IS (high-IS; above median from the clamp, 6.33 mg/kg fat free mass [ffm]/min, n = 58; males had 8.73 ± 2.21 mg/kg · min ffm) and low-IS (below median, n = 59; males had 4.75 ± 1.21 mg/kg · min ffm).
In the subgroup of 20 subjects, the clamp was prolonged to 6 hours. After 1 week, another 6-hour clamp, with concurrent Intralipid/heparin infusion, was performed as described (24). Heparin infusion was stopped 30 minutes before the end of the clamp. No difference in steady-state insulin concentration between these protocols was observed.
Muscle and adipose tissue biopsies
Before each clamp, skeletal muscle and adipose tissue biopsies were performed under local anesthesia with 1% lidocaine. Percutaneous biopsy of vastus lateralis muscle was performed with a skeletal biopsy needle of 4.5 mm diameter (Popper & Sons). A biopsy was taken approximately 15 cm above the patella, after a small skin incision of approximately 1 cm. Muscles were immediately placed in RNAlater solution (Ambion The RNA Company). Subcutaneous adipose tissue biopsy was obtained from the umbilical region using biopsy needle and collected to 1 mL of RNA stabilization reagent (Allprotect tissue reagent; QIAGEN GmbH). Tissues were kept at −80°C until analyses.
In the subgroup of 20 subjects, tissue biopsies were performed additionally after each 6-hour clamp.
In an additional experiment for muscle cell cultures, only muscle biopsies were performed.
Biochemical analyses
Plasma glucose was measured immediately by the enzymatic method using a glucose analyzer (YSI 2300 STAT PLUS; Yellow Springs Instruments). Serum lipids were assessed by the colorimetric assays using the autoanalyzer Cobas c111 (Roche Diagnostics). Serum insulin and FFAs were measured as described (24).
Primary human muscle cell cultures
Primary cultures were grown from satellite cells isolated from the muscle. After the biopsy, muscle (∼100 mg) was immediately placed in digestion media (DMEM high glucose 4.5 g/L [Sigma-Aldrich] containing 0.05% trypsin-EDTA [Sigma-Aldrich], 1 mg/mL collagenase IV [Gibco by Life Technologies], and 10 mg/mL BSA [BioShop Canada Inc]) at 4°C. Then the samples were placed in fresh digestion media at 37°C for 5 minutes. After sedimentation, the supernatant was collected to cold fetal bovine serum (FBS; Life Technologies) to inactivate the digestion process. Pelleted tissue debris were subjected to two to three further cycles of the process described above. The resultant supernatant was pooled with the previous cells and centrifuged for 7 minutes at 800 × g. The supernatant was removed and the pellet was washed with DMEM supplemented with 1% penicillin/streptomycin (PS; Sigma-Aldrich) and 1% amphotericin B (Fz; Sigma-Aldrich). To minimize fibroblast contamination, the cell suspension was seeded into a 60-mm culture plate and cultured for 3 hours in growth media (containing 20% FBS, 1% PS, and 1% Fz) in a humidified incubator with 5% CO2 at 37°C. Then the cell suspension was preplated to a collagen-coated (Collagen I, rat tail; Gibco by Life Technologies) 10-cm culture plate. After 3 days of incubation, the cell culture was transferred to a collagen-coated six-well culture plate. The cell culture medium was changed every day and cells were passaged every second day. The cells were grown until they reached about 80% confluence; at that time the medium was replaced with DMEM containing 2% horse serum (Sigma-Aldrich) for the induction of differentiation into myotubes. The differentiation medium was changed every 48 hours. During this period, myoblasts fused to form elongated, multinucleated myotubes. To validate the experiments, the expression of muscle cells markers (MYF5, MYH1, MYH2, and MFN2) was analyzed after differentiation of myotubes.
Cell treatment
Myotubes were treated with insulin separately and in combination with palmitate. Cells were stimulated in differentiation medium containing insulin at a concentration 100 nM (Actrapid HM; Novo Nordisk) for 45 minutes at 37°C. Palmitic acid (Sigma-Aldrich) was dissolved in ethanol and diluted 0.7 mM, in DMEM high-glucose containing 2% BSA, 1% FBS, 1% PS, and 1% Fz. Myotubes were incubated in treatment media for 20 hours. Then the myotubes were lysed.
Tissue gene expression analysis
Muscle and adipose tissue mRNA expression of WNT10B, FZD1/4/8, LRP5/6, DVL1/2/3, APC, GSK3B, CTNNB1 (encoding β-catenin), TCF7L2, AXIN2, MYC, and CCND1 was analyzed with quantitative real-time PCR. Additionally, adipose tissue CEBPA, PPARG and ADIPOQ and muscle MYOD1 and MYOG mRNA expression was measured.
In cultured myotubes, mRNA expression of FZD1, LRP6, DVL2, CTNNB1, and TCF7L2 was measured.
Tissue samples were washed in ribonuclease-free PBS, and the mRNA was extracted using the RNeasy minikit on a fully automated Qiacube (QIAGEN GmbH). RNA concentration and purity (A260:A280 ratio) was determined by spectrophotometric analysis (NanoDrop 2000; Thermo Scientific Inc). The quantity and integrity of the RNA were confirmed with the Agilent 2100 bioanalyzer (Agilent Technologies). Additionally, RNA was digested with deoxyribonuclease with a Turbo DNA-free kit (Ambion). The possible presence of DNA in the samples was verified using PCR (FastStartTaq DNA polymerase, dNTPPack; Roche Diagnostics GmbH). cDNA was synthesized from 0.5 μg total RNA using the QuantiTect reverse transcription kit (QIAGEN).
The samples were quantified with the LightCycler 480 II real-time PCR instrument (Roche Diagnostics GmbH) using gene-specific primers and probes in triplicates. Real-Time Ready Custom RT-qPCR assays (Roche Diagnostics GmbH) were used (Table 1). Glyceraldehyde-3-phosphate dehydrogenase (GAPDH) was used as an internal control. Relative quantification was performed using Light Cycler 480 software, release 1.5.0 SP3.
Assay Information
| Gene Symbol | Assay ID | Forward Primer Sequence | Reverse Primer Sequence |
|---|---|---|---|
| WNT10B | 145983 | CCCAGGACACATGGGAAT | TCCAAGAAATCCCGAGAGAA |
| FZD1 | 104351 | CGGCAAGACCCTCAACTC | CCTTGTTTGCTGTTGGTGAG |
| FZD4 | 104363 | TTCACACCGCTCATCCAGTA | TGCACATTGGCACATAAACA |
| FZD8 | 104377 | CGCCACGCGTTAATTTCT | ATCTCGGGTTCTGGAAACG |
| LRP5 | 104391 | GAACCTGCTGACCTGTGGAG | CTGTGGCACATGCAAACTG |
| LRP6 | 114571 | AATTTTGAACCCTCCACCATC | TGTTTGAAGAATATCCAAATTCCA |
| DVL1 | 104326 | TGGACTCGGACGAGGATG | CGGATGAGTCTGGATGAGGT |
| DVL2 | 104329 | TATTTCACTCTCCCCCGAAA | GGAAGGTGCCAGTCAGAGC |
| DVL3 | 104332 | CCACCATGTCACTCAACATCA | GTTGCTTTGGCCCACAAT |
| APC | 104277 | GCATGGACCAGGACAAAAAT | GAACACACACAGCAGGACAGAT |
| GSK3B | 101894 | TCTTCAACTTCACCACTCAAGAA | CCGAGCATGAGGAGGAATAA |
| CTNNB1 | 101627 | TTGGATATCGCCAGGATGAT | CATGGGGTCCATACCCAAG |
| TCF7L2 | 112071 | TGAACACAGCGAATGTTTCC | CTGTTGATCAAGGCCAAAGC |
| AXIN2 | 102998 | CCACACCCTTCTCCAATCC | TGCCAGTTTCTTTGGCTCTT |
| MYC | 100977 | TGCTCCATGAGGAGACACC | CTTTTCCACAGAAACAACATCG |
| CCND1 | 142502 | CAGTGGAGGTGGGGTGTT | GCAATGTGAGAATGCAAACCT |
| CEBPA | 144835 | GGAGCTGAGATCCCGACA | TTCTAAGGACAGGCGTGGAG |
| PPARG | 110607 | GACAGGAAAGACAACAGACAAATC | GGGGTGATGTGTTTGAACTTG |
| ADIPOQ | 113263 | GGTGAGAAGGGTGAGAAAGGA | TTTCACCGATGTCTCCCTTAG |
| MYOD1 | 140079 | TCCTGTAAATAAGAGTTGCTTTGC | CACACCATGCCTCAGAGATAAA |
| MYOG | 140684 | CCTTTCCAGGGAGGTAAAGC | CCTGAGCTGGGGCATACA |
| GAPDH | 101128 | CTCTGCTCCTCCTGTTCGAC | ACGACCAAATCCGTTGACTC |
Statistical analysis
The statistics were performed with the STATISTICA version 10.0 (Statsoft). All data are presented as mean ± SD. The variables, which did not have normal distribution, were log transformed before the analyses. For the purpose of the data presentation, absolute values are shown in Results. Differences between the groups were analyzed with the unpaired Student's t test. Differences in gene expression were adjusted for possible confounding factors (BMI, waist, cholesterol, triglycerides) with an analysis of covariance. Differences in gene expression before and after the clamps and between incubations in cultured myotubes were assessed with the paired Student's t test. The level of significance was accepted at a value of P < .05.
Results
Subjects with low-IS had higher BMI, waist circumference, percentage body fat, post-OGTT plasma glucose, fasting and post-OGTT serum insulin, total and LDL-cholesterol and triglycerides, and lower high-density lipoprotein-cholesterol (all P < .05, Table 2).
Clinical Characteristics of the Study Groups
| Low-IS (n = 59) | High-IS (n = 58) | |
|---|---|---|
| Age, y | 23.69 ± 3.07 | 22.94 ± 2.00 |
| BMI, kg/m2 | 27.20 ± 4.48 | 23.80 ± 2.44a |
| Waist circumference, cm | 94.66 ± 12.59 | 84.14 ± 6.01a |
| Body fat, % | 23.47 ± 8.22 | 16.47 ± 5.21a |
| Fasting plasma glucose, mg/dL | 87.78 ± 8.68 | 86.18 ± 8.27 |
| Post-OGTT glucose, mg/dL | 86.03 ± 21.74 | 76.47 ± 16.43a |
| Fasting serum insulin, μIU/mL | 13.39 ± 6.63 | 9.64 ± 4.84a |
| Post-OGTT insulin, μIU/mL | 29.95 ± 20.99 | 18.08 ± 14.45a |
| Cholesterol, mg/dL | 181.46 ± 32.18 | 158.95 ± 25.40a |
| Triglycerides, mg/dL | 109.11 ± 54.75 | 77.80 ± 30.85a |
| HDL-cholesterol, mg/dL | 55.25 ± 9.52 | 59.16 ± 9.55a |
| LDL-cholesterol, mg/dL | 111.10 ± 36.40 | 94.43 ± 26.12a |
Abbreviation: HDL, high-density lipoprotein.
P < .05 vs low-IS group.
Adipose tissue expression of Wnt signaling genes and markers of adipogenesis in low-IS and high-IS groups
In the low-IS group, we found decreased adipose tissue expression of WNT10B (P = .007), FZD1 (P = .014), FZD8 (P = .007), LRP5 (P = .009), DVL2 (P = .0007), CTNNB1 (P = .009), TCF7L2 (P = .009), and AXIN2 (P = .001) in comparison with the high-IS group (Table 3). All these differences remained significant after adjustment for BMI, waist circumference, cholesterol, and triglycerides (all P < .05), except LRP5 (adjusted for BMI and waist circumference) and FZD8 (adjusted for cholesterol and triglycerides).
Relative Adipose Tissue and Skeletal Muscle mRNA Wnt Signaling Gene Expression in Low-IS and High-IS Groups
| Adipose Tissue | Skeletal Muscle | |||
|---|---|---|---|---|
| Low-IS (n = 59) | High-IS (n = 58) | Low-IS (n = 59) | High-IS (n = 58) | |
| WNT10B | 1.16 ± 0.65 | 1.57 ± 0.55a | 1.02 ± 0.64 | 0.72 ± 0.50a |
| FZD1 | 0.91 ± 0.37 | 1.15 ± 0.52a | 1.26 ± 0.71 | 1.03 ± 0.54a |
| FZD4 | 1.08 ± 0.53 | 1.22 ± 0.59 | 0.92 ± 0.39 | 0.84 ± 0.33 |
| FZD8 | 1.12 ± 0.42 | 1.45 ± 0.71a | 1.25 ± 0.95 | 0.91 ± 0.59a |
| LRP5 | 1.28 ± 0.58 | 1.51 ± 0.49a | 1.11 ± 0.72 | 1.01 ± 0.50 |
| LRP6 | 0.64 ± 0.58 | 0.53 ± 0.39 | 1.02 ± 0.80 | 0.63 ± 0.31a |
| DVL1 | 1.11 ± 0.80 | 1.11 ± 0.54 | 0.93 ± 0.32 | 0.80 ± 0.36a |
| DVL2 | 1.34 ± 0.87 | 1.97 ± 0.92a | 1.24 ± 0.92 | 1.10 ± 0.74 |
| DVL3 | 0.99 ± 0.59 | 0.98 ± 0.35 | 0.96 ± 0.51 | 0.81 ± 0.67 |
| APC | 1.35 ± 0.64 | 1.44 ± 0.42 | 1.23 ± 0.74 | 1.00 ± 0.57 |
| GSK3B | 1.18 ± 0.88 | 1.23 ± 0.62 | 1.01 ± 0.76 | 0.76 ± 0.32a |
| CTNNB1 | 1.02 ± 0.28 | 1.21 ± 0.40a | 0.99 ± 0.40 | 0.81 ± 0.26a |
| TCF7L2 | 1.12 ± 0.58 | 1.44 ± 0.65a | 1.27 ± 0.95 | 0.87 ± 0.67a |
| AXIN2 | 0.94 ± 0.42 | 1.30 ± 0.58a | 1.27 ± 0.56 | 1.01 ± 0.42a |
| MYC | 0.87 ± 0.52 | 0.88 ± 0.58 | 1.28 ± 0.91 | 0.93 ± 0.56a |
| CCND1 | 1.14 ± 0.66 | 0.98 ± 0.56 | 1.35 ± 0.89 | 0.92 ± 0.53a |
P < .05 vs low-IS group.
Adipose tissue CEBPA (low-IS, 0.96 ± 0.27, high-IS, 1.21 ± 0.47, P = .004), PPARG (low-IS, 1.41 ± 0.84, high-IS, 1.82 ± 0.76, P = .0005), and ADIPOQ (low-IS, 1.30 ± 0.57, high-IS, 1.81 ± 0.91, P = .002) were also lower in the low-IS group. The difference in ADIPOQ remained significant after adjustment for BMI (P = .039) and waist circumference (P = .042), whereas the difference in PPARG was still significant after adjustment for BMI (P = .028), cholesterol (P = .018), and triglycerides (P = .014) but not for waist (P = .093), and the difference in CEBPA was independent of cholesterol (P = .049) and triglycerides (P = .019).
Skeletal muscle expression of Wnt signaling genes and markers of myogenesis in low-IS and high-IS groups
In contrast to adipose tissue, in skeletal muscle, subjects with low-IS had higher expression of Wnt signaling genes: WNT10B (P = .011), FZD1 (P = .041), FZD8 (P = .032), LRP6 (P = .003), DVL1 (P = .011), GSK3B (P = .031), CTNNB1 (P = .007), TCF7L2 (P = .012), AXIN2 (P = .01), MYC (P = .02), and CCND1 (P = .004) (Table 3). MYOD1 (low-IS, 1.09 ± 0.71, high-IS, 0.83 ± 0.53, P = .018) was higher in the low-IS group, whereas MYOG did not differ between the groups (low-IS, 2.04 ± 1.25, high-IS, 1.79 ± 1.00). All the observed differences remained significant after adjustment for BMI, waist circumference, cholesterol, and triglycerides (all P < .05), except FZD1 (all adjustments), FZD8 (adjusted for cholesterol and triglycerides), and CCND1 (adjusted for waist circumference, P = .053).
Differential effects of hyperinsulinemia on the expression of Wnt signaling genes in adipose tissue and skeletal muscle
No significant differences in the baseline tissue gene expression between the two clamps were observed.
In adipose tissue, 6 hours of hyperinsulinemia resulted in a decrease in FZD4 (P = .012), LRP5 (P = .005), LRP6 (P = .002), TCF7L2 (P = .0005), and AXIN2 expression (P = .032) (Figure 1A). Intralipid/heparin infusion resulted in a more than 4-fold increase in serum FFAs (P < .0001) and a decrease in IS by 42% during sixth hour of the clamp (P < .0001). Intralipid/heparin infusion abolished all the effects of hyperinsulinemia on relative adipose tissue Wnt signaling gene expression (Figure 1B).
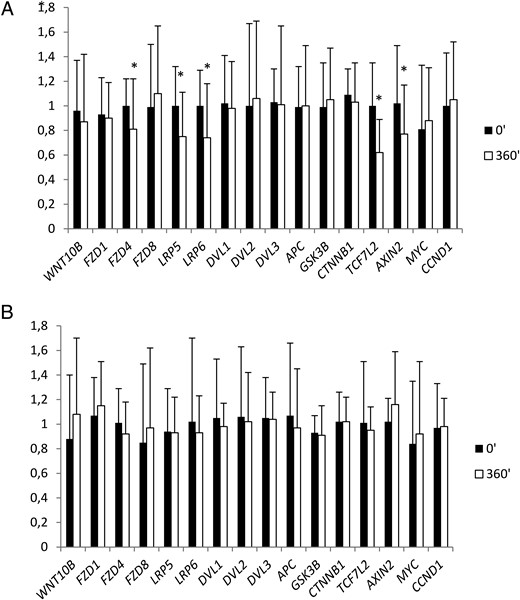
The effect of a 6-hour clamp without (A) or with (B) the concurrent Intralipid/heparin infusion on relative adipose tissue Wnt signaling gene expression (n = 20).
*, P < .05 vs 0 minutes.
In skeletal muscle, hyperinsulinemia resulted in an increase in the expression of the Wnt signaling genes: FZD1 (P = .014), FZD8 (P = .033), DVL1 (P = .028), DVL2 (P = .021), DVL3 (P = .021), TCF7L2 (P = .007), AXIN2 (P = .002), and MYC (P = .007) (Figure 2A). All these changes were abolished by the concurrent Intralipid/heparin infusion (Figure 2B).
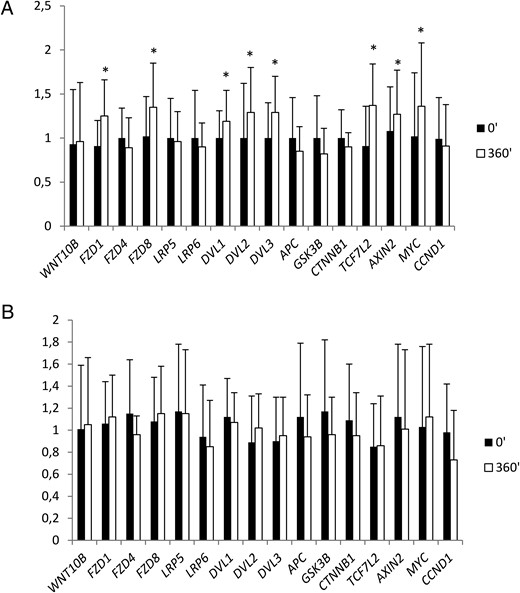
The effect of a 6-hour clamp without (A) or with (B) the concurrent Intralipid/heparin infusion on relative skeletal muscle Wnt signaling gene expression (n = 20).
*, P < .05 vs 0 minutes.
In this experiment, 11 subjects were from the low-IS group and nine were from the high-IS group. All insulin effects and their negation by Intralipid were similar in both subgroups.
The effects of insulin on the expression of Wnt signaling genes in cultured myotubes
Incubation with insulin resulted in an increase in the expression of FZD1 (P = .009), DVL2 (P = .03), CTNNB1 (P = .014), and TCF7L2 (P = .002) in cultured myotubes. None of these changes were observed during cotreatment with palmitate. No effect of the treatments on LRP6 expression was observed (Figure 3).
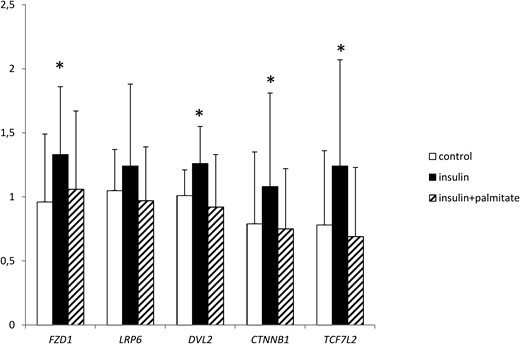
The effect of insulin and palmitate on relative Wnt signaling gene expression in cultured myotubes (n = 16).
*, P < .05 vs control.
Discussion
To our knowledge, this is the first human study that presents that the expression of genes involved in the β-catenin-dependent Wnt signaling is associated with the degree of IS in a tissue-specific manner. Furthermore, we discovered that hyperinsulinemia differentially regulated the β-catenin signaling genes expression in the adipose tissue and skeletal muscle.
We observed a decreased expression of genes associated with the β-catenin-dependent signaling in adipose tissue of subjects with low-IS. Appropriate adipogenesis is necessary for maintaining IS (25). Canonical Wnt ligands are secreted by several cell types of adipose tissue (26). Inhibition of β-catenin-dependent Wnt is required to induce the commitment of mesenchymal stem cells into preadipocyte differentiation (27). Wnt10b maintains preadipocytes in an undifferentiated state through the inhibition of C/EBPα and PPAR-γ. When Wnt signaling was inhibited by the overexpression of a dominant-negative TCF7L2, preadipocytes underwent enhanced differentiation, indicating that the inhibitory effect of Wnt10b on adipogenesis was mediated via the β-catenin-dependent pathway (12).
There is evidence that the dysfunction of adipose tissue, rather than the degree of adiposity, may cause metabolic abnormalities. The impaired potential of adipose tissue to recruit new fat cells may cause an abnormal increase in the size of the existing adipocytes. This insufficiency of adipose tissue may manifest with a lower expression of transcription factors, like PPAR-γ, and a lower adiponectin production (28). Subcutaneous adipose tissue mRNA level of transcription factors involved in adipogenesis is decreased in obese subjects with type 2 diabetes compared with control obese subjects and in insulin-resistant, first-degree relatives of type 2 diabetic individuals (3, 4). In line with the aforementioned data, we may hypothesize that decreased mRNA expression of β-catenin-dependent Wnt signaling components in young subjects with low IS might be a compensatory mechanism to promote new fat cell recruitment and preadipocyte differentiation in insulin-resistant conditions. Importantly, in our low-IS group, we observed a decreased gene expression of CEBPA, PPARG, and ADIPOQ, which suggests a dysfunction of adipose tissue. In our study, the low-IS and high-IS groups differed in BMI and waist circumference. However, differences in Wnt signaling gene expression remained significant after adjustment for these parameters, which indicates that insulin resistance, and not overweight or obesity, is the cause of our findings.
On the other hand, some data indicate that inappropriate β-catenin-dependent Wnt activation is associated with adipocyte hypertrophy and insulin resistance. The increased expression of TCF7L2 was observed in the adipose tissue of nonobese subjects with a genetic predisposition for type 2 diabetes (4) This was accompanied by adipocyte hypertrophy and insulin resistance. The discrepancy between these and our results may come from the different selection and characteristics of the study groups. In another study, higher TCF7L2 mRNA was found in subjects with the highest tertile of the homeostasis model assessment index of insulin resistance (29). However, the study population consisted only of subjects with obesity with mean BMI within the range of morbid obesity. This and our study were different regarding the number and age of participants and the method of estimation of IS.
In contrast to adipose tissue, skeletal muscle expression of Wnt signaling genes was up-regulated in men with low IS. Abiola et al (14) showed that Wnt/β-catenin signaling, unlike insulin signaling, increased glucose transport in both insulin-sensitive and insulin-resistant myotubes. Other data indicate that β-catenin signaling increases the transcription of insulin receptor substrate-1 (17). Singh et al (30) discovered a lower expression of insulin receptor in skeletal muscle of subjects with rare nonconservative LRP6 mutations. This mutation diminished the TCF7L2-dependent transcription of insulin receptor (31). In the context of the above-cited data, our results may indicate that higher muscle expression of Wnt signaling genes in low-IS group might be a compensatory mechanism to increase muscle glucose uptake in insulin-resistant conditions. Of note is the fact that the expression of GSK3β, a negative regulator of Wnt signaling, was increased in the skeletal muscle of the low-IS subjects, similarly to other components of Wnt signaling, However, GSK3β is also important for Wnt-induced LRP5/6 phosphorylation at the membrane. GSK3β may act as a dual regulator, having both positive and negative functions in Wnt signaling, depending on its cellular localization (31).
The β-catenin-dependent Wnt signaling controls the balance between myogenic and adipogenic potential in myoblasts. Stimulation of the β-catenin pathway decreased the intamyocellular lipid deposition in myotubes (13, 14). The Wnt/β-catenin signal is associated with type II to type I fiber transformation (32, 33). In insulin resistance, skeletal muscle exhibits not only lower glucose uptake but also lower myogenic potential and lower proportion of oxidative type I fibers (13, 34). We cannot exclude the possibility that higher muscle expression of Wnt signaling genes, observed in subjects with low IS, together with an increased expression of MYOD1, is a response to lower muscle myogenic and metabolic capability in insulin resistance.
Our data suggest that the observed differences in the tissue expression of Wnt signaling genes represent a compensatory mechanism to insulin resistance, both in adipose tissue and skeletal muscle, but in a differential and tissue-specific manner. Of note is the fact that our subjects were young, healthy, and without overt metabolic disturbances. Thus, our results might reflect the early changes in the development of insulin resistance.
To further study the association between Wnt signaling and insulin action, we examined the effects of hyperinsulinemia and FFAs on Wnt signaling gene expression. Similarly to the differences observed in the baseline state, this effect was tissue specific. Hyperinsulinemia decreased the expression of FZD4, LRP5/6, TCF7L2, and AXIN2 in adipose tissue. All these effects were not present during the concurrent Intralipid/heparin infusion. In agreement with our data, Ahlzén et al (29) found that insulin decreased TCF7L2 mRNA expression in human adipocytes in vitro, and this effect was attenuated in the cells incubated with FFAs. These results indicate a cross talk between insulin and Wnt signaling. Insulin is a proadipogenic factor, whereas the Wnt β-catenin-dependent pathway inhibits adipogenesis, Therefore, the effect of hyperinsulinemia on Wnt signaling gene expression may be important in the promotion of adipocyte differentiation. We found that hyperinsulinemia increased the expression of FZD1/8, DVL1/2/3, TCF7L2, AXIN2, and MYC in skeletal muscle in vivo. Additional confirmation of our in vivo results is an increase in the expression of FZD1, DVL2, CTNNB1, and TCF7L2 in cultured myotubes after incubation with insulin. As mentioned, the stimulation of Wnt/β-catenin increases muscle glucose uptake. We may speculate that there is a cross talk between insulin and Wnt signaling in skeletal muscle to enhance glucose uptake in the condition of hyperinsulinemia.
Elevation of circulating FFAs abolished the effect of hyperinsulinemia on Wnt signaling genes in both adipose tissue and skeletal muscle. Similarly, the insulin effects on Wnt signaling genes were no longer present after coincubation with palmitate. This result suggests that the inhibition of the effects of hyperinsulinemia on Wnt signaling genes may be important for FFA-induced insulin resistance. On the other hand, the action of hyperinsulinemia on Wnt signaling genes mimics the differences observed in low-IS subjects in the baseline state both in adipose tissue and in muscle, so the negation of this effect by FFAs might seem paradoxical. However, baseline differences reflect rather the chronic state of low IS in contrast to the acute effect of FFAs during Intralipid/heparin infusion. One cannot exclude the possibilities that the observed effect on Wnt signaling genes is present at the early stages of insulin resistance, whereas it no longer works in more advanced abnormalities, with higher circulating FFAs and insulin. However, further studies are required to clarify this issue.
In conclusion, our data indicate that the association of β-catenin-dependent Wnt signaling with insulin resistance is tissue specific. Observed changes in Wnt/β-catenin signaling gene expression might reflect a compensatory mechanism to increase muscle glucose uptake and to generate new fat cells in insulin-resistant conditions.
Acknowledgments
This work was supported by Grant UDA-POIG.01.03.01-00-128/08 from the Program Innovative Economy, 2007–2013 partly financed by the European Union within the European Regional Development Fund and by Grant 2011/01/B/NZ5/05380 from the National Science Center (Poland). M.K.-K. was supported by REFRESH Project Grant FP7-REGPOT-2010-1-264103.
Disclosure Summary: The authors have nothing to disclose.
Abbreviations
- APC
adenomatous polyposis coli
- BMI
body mass index
- C/EBPα
CCAAT/enhancer-binding protein-α
- Dvl
dishevelled
- FBS
fetal bovine serum
- FFA
free fatty acid
- ffm
fat-free mass
- Fz
amphotericin B
- Fzd
frizzled
- GSK3β
glycogen synthase kinase 3β
- IS
insulin sensitivity
- LDL
low-density lipoprotein
- LRP
LDL receptor-related protein
- OGTT
oral glucose tolerance test
- PPARγ
peroxisome proliferator-activated receptor-γ
- TCF
T cell-specific transcription factor
- TCF7L2
transcription-factor-7-like 2
- Wnt10b
Wnt member 10b.
