


Several international initiatives are currently underway to develop disease-modifying interventions that can delay symptom onset, slow progression and/or restore function in Huntington's disease. Reference Ross and Tabrizi1 For Huntington's disease, as for any slowly progressing neurodegenerative condition, the discovery of potential therapies depends on the availability of sensitive, objective and quantitative outcome measures (i.e. biomarkers) capable of showing decline across time frames relevant to the duration of clinical trials. Although neuroimaging measures are only now being adopted as outcome measures in clinical research, Reference Kozauer and Katz2 there is growing interest in their potential to pre-date functional decline in Huntington's disease. Reference Ross and Tabrizi1 Integrative multimodal neuroimaging approaches that bring together, for example, T1-weighted imaging and diffusion tensor imaging (DTI) provide independent yet complementary assessments of macrostructure (volume) and microstructure (diffusion), respectively. Such multimodal neuroimaging may generate valuable information regarding stage-dependent differences in sensitivity to neurodegeneration and may be able to identify differential responses to a therapeutic intervention in target regions across imaging modalities in early stage trials. Reference Borsook, Becerra and Fava3 To adequately assess the effect of a clinical intervention, it is also critical for multimodal biomarker development studies to evaluate changes in outcome measures longitudinally, over periods of time relevant to clinical trials. Reference Tabrizi, Scahill, Durr, Roos, Leavitt and Jones4 Several sensitive brain-imaging volumetric markers over periods of 12–36 months have already been reliably established in Huntington's disease, including progressive atrophy in grey and white matter, caudate and putamen. Reference Tabrizi, Scahill, Durr, Roos, Leavitt and Jones4–Reference Domínguez, Egan, Gray, Poudel, Churchyard and Chua10 However, IMAGE-HD is the only study to date to examine longitudinal changes in Huntington's disease across imaging modalities. In addition to volumetric changes over 18 months, IMAGE-HD is the first study to report diffusion changes in the caudate over the same period, but only after symptom onset. Reference Domínguez, Egan, Gray, Poudel, Churchyard and Chua10
Establishing links between brain changes and functional outcomes that may predict a clinical benefit is also essential for clinical trial development. In particular, and as noted by the US Food and Drug Administration, surrogate imaging measures must be ‘likely to ultimately predict clinical benefit’. Reference Kozauer and Katz2,Reference Katz11 The longitudinal large-scale Huntington's disease biomarker development study TRACK-HD reported significant, but weak, correlations between 12-month volumetric changes (predominantly whole brain and ventricular volume) and changes in functional outcomes. Reference Tabrizi, Scahill, Durr, Roos, Leavitt and Jones4 More research is therefore necessary to establish with greater degree of confidence the functional relevance of longitudinal change in volumetric biomarkers, particularly in subcortical structures that are primary, early target of neurodegeneration in Huntington's disease (i.e. striatum). Also, the functional relevance of measures of microstructural change is yet to be ascertained. In this IMAGE-HD investigation we therefore aimed to quantify macrostructural and microstructural disease progression in individuals with premanifest Huntington's disease and symptomatic Huntington's disease over 30 months using neuroimaging measures. A second objective was to establish the functional and clinical relevance of these measures through correlations with neurocognitive and neuropsychiatric decline, as well as with clinical and disease severity.
Method
Participants
Participants underwent magnetic resonance imaging (MRI) and were clinically assessed at baseline, 18 and 30 months. Data are presented for 36 individuals with premanifest Huntington's disease, 36 individuals with symptomatic Huntington's disease and 36 control participants who joined the study at baseline and a further 4 participants (premanifest Huntington's disease) who joined the study at 18 months. The healthy control sample was matched to the premanifest Huntington's disease group by age, gender and estimated IQ (National Adult Reading Test 2nd edition, NART-2). Reference Nelson and Willison12 The symptomatic Huntington's disease group was significantly older than both premanifest Huntington's disease (P<0.001) and control (P = 0.001) groups. CAG-expanded participants were clinically assessed (by A.C. or P.C.) with the Unified Huntington's Disease Rating Scale (UHDRS) 13 total motor score (TMS). Individuals with a UHDRS TMS ⩽5 were included in the premanifest Huntington's disease group and those with UHDRS TMS >5 were included in the symptomatic Huntington's disease group. Reference Tabrizi, Langbehn, Leavitt, Roos, Durr and Craufurd14 The mean diagnostic confidence score for the symptomatic Huntington's disease group was 2.9 (s.d. = 1.2) at baseline, 3.4 (s.d. = 1.2) at 18 months and 3.9 (s.d. = 0.4) at 30 months. See Table 1 for demographic and clinical characteristics. Details regarding sample sizes at each time point and reasons for drop-outs and exclusions are presented in the online data supplement (Tables DS1 and DS2).
Table 1 Demographic and clinical characteristics for study participants

| Controls | Premanifest Huntington's disease |
Symptomatic Huntington's disease |
Premanifest Huntington's disease v. controls |
Symptomatic Huntington's disease v. controls |
Symptomatic v. premanifest Huntington's disease |
||||
|---|---|---|---|---|---|---|---|---|---|
| t | P | t | P | t | P | ||||
| Participants/females, n | 36/24 | 40/24 | 36/15 | ||||||
| Age, years: mean (s.d.) | 42.4 (13.4) | 41.48 (11.2) | 52.3 (9.4) | −0.37 | 1.00 | 3.79 0.001 | 4.26 | <0.001 | |
| IQ estimate, mean (s.d.) | 118.0 (9.7) | 116.8 (11.2) | 113.7 (11.6) | −0.43 | 1.00 | −1.68 0.288 | −1.25 | 0.639 | |
| UHDRS, TMS: mean (s.d.) | 1.0 (1.2) | 18 (10.4) | 9.79 | <0.001 | |||||
| CAG, mean (s.d.) | 42.2 (1.9) | 43.1 (2.5) | 1.77 | 0.08 | |||||
| DBS, mean (s.d.) | 266.6 (53.4) | 379.4 (70.0) | 7.95 | <0.001 | |||||
| Estimated years to diagnosis, mean (s.d.) |
16 (7.0) | – | |||||||
| Years since diagnosis, mean (s.d.) | 1.9 (1.6) | ||||||||
UHDRS, Unified Huntington's Disease Rating Scale; TMS, total motor score (premanifest Huntington's disease <5; symptomatic Huntington's disease ⩾5); CAG, cytosine-adenineguanine repeat length; DBS, disease burden score age × (CAG-35.5).
IQ estimate from NART (National Adult Reading Test 2nd Edition). Group differences were assessed by means of t-tests.
A consistent set of procedures and protocols were followed across all three time points. Data analysis was carried out according to group assignment at baseline, i.e. either premanifest Huntington's disease or symptomatic Huntington's disease. Participants were free from brain injury, neurological and/or severe diagnosed psychiatric conditions (e.g. bipolar disorder, psychosis), other than Huntington's disease. Participants remained on their normal medication regime, which included antipsychotic medications, antidepressants, anxiety/mood stabilisers, and medications for vascular and heart conditions (online Table DS3). Testing was performed at the Royal Children's Hospital, Melbourne, Australia. The study was approved by Monash University and Melbourne Health Human Research Ethics Committees, and each participant gave written informed consent.
Procedures
Neurocognitive and neuropsychiatric assessments
The IMAGE-HD protocol included a comprehensive battery of assessments, selected based on their sensitivity in previous studies. Reference Tabrizi, Langbehn, Leavitt, Roos, Durr and Craufurd14,Reference Stout, Paulsen, Queller, Solomon, Whitlock and Campbell15 The neurocognitive battery included psychomotor performance (speeded and self-paced tapping tasks), Reference Stout, Paulsen, Queller, Solomon, Whitlock and Campbell15 and visuomotor speed and attention (Symbol Digit Modalities Test, SDMT, Reference Smith16 and Stroop Test, word reading condition). Reference Stroop17 In addition, within the functional MRI (fMRI) component of IMAGE-HD, participants performed two cognitive tasks. One was an N-BACK working memory task, which included three levels (0, 1 and 2-BACK). Reference Georgiou-Karistianis, Poudel, Domínguez, Langmaid, Gray and Churchyard18–Reference Poudel, Stout, Gray, Domínguez, Salmon and Churchyard20 The other assessed cognitive flexibility via a shifting response set (SRS) task, in which a letter–number pair was displayed on either side of a fixation cross. Reference Gray, Egan, Ando, Churchyard, Chua and Stout21 We have previously reported cross-sectional and longitudinal fMRI results for both these tasks Reference Georgiou-Karistianis, Poudel, Domínguez, Langmaid, Gray and Churchyard18–Reference Gray, Egan, Ando, Churchyard, Chua and Stout21 and the behavioural measures (accuracy and reaction time) provided additional measures for the neurocognitive assessment battery.
The neuropsychiatric battery included an assessment of frontal-striatal dysfunction (Frontal Systems Behaviour Scale, FrSBe) Reference Grace and Mallory22 and neuropsychiatric disturbances (Schedule of Obsessions, Compulsions and Pathological Impulses, SCOPI). Reference Watson and Wu23 All neurocognitive and neuropsychiatric assessments listed above are described in detail in the online data supplement.
Image acquisition and processing of neuroimaging data
T1-weighted and diffusion weighted imaging (DWI) data were acquired at baseline, 18 and 30 months on a Siemens Magnetom Trio Tim 3 Tesla MR scanner. Rigorous quality control was applied to all images including screening for full brain coverage and missing data, and artefacts (i.e. motion, aliasing, noise, susceptibility, loss of gradient-directions in DWI data). Spatial pre-processing and segmentation procedures for structural and diffusion data were consistent across testing sessions. For details see our cross-sectional Reference Georgiou-Karistianis, Gray, Domínguez, Dymowski, Bohanna and Johnston24 and 18-month longitudinal Reference Domínguez, Egan, Gray, Poudel, Churchyard and Chua10 papers. Grey matter, white matter, whole brain (grey matter+white matter) and cerebrospinal fluid (CSF, ventricular and intergyral) were delineated with FMRIB's Automated Segmentation Tool (FAST) Reference Zhang, Brady and Smith25 independently at each time point. For segmentation of structural subcortical structures (caudate, putamen, pallidum and thalamus), we tested several methods and brain imaging tools before adopting a semi-customised procedure based on SPM8 routines that yielded the most reliable results over time. FMRIB's Diffusion Toolbox (FDT) was used for calculation of diffusion tensors and principal eigenvectors, which allowed derivation of voxel-wise maps of mean diffusivity and fractional anisotropy, diffusivity measures that provide information regarding microstructural integrity (mean diffusivity is a measure of the total diffusion of water molecules within a tissue sample, whereas fractional anisotropy is a measure of the predominant direction of diffusion). Segmentation of the subcortical structures in mean diffusivity and fractional anisotropy images was performed with FMRIB's Integrated Registration and Segmentation Tool (FIRST). Reference Patenaude, Smith, Kennedy and Jenkinson26 Segmentations were visually inspected by two analysts, independently, to ensure their accuracy.
Statistical analysis
A generalised least squares (GLM) regression model was chosen to assess longitudinal group differences for each outcome measure separately as GLM allows variances between experimental groups to be unequal as well as for correlations between measurements of the same participant. We assessed all outcomes with models for absolute measures at baseline, 18 and 30 months. Contrasts specified tests for linear change across the three testing sessions and for differences in linear change across the three testing sessions between the Huntington's disease groups (premanifest Huntington's disease and symptomatic Huntington's disease) and controls. Total intracranial volume (grey matter+white matter+CFS, for analyses involving volume outcome measures), age and gender were included as covariates of no interest. We entered participants' ages at the three testing sessions as a control proxy of interscan interval.
To evaluate the consistency of results, without the potential age confound, we performed a secondary analysis with all groups matched for age. In this analysis, we excluded all participants in the control and premanifest Huntington's disease group who were younger than 35 at baseline. This resulted in a sample of 23 controls, 30 participants with premanifest Huntington's disease and 36 participants with symptomatic Huntington's disease. We then adopted an iterative sampling approach to avoid bias and to generate a robust estimate of the group differences. First, random sample sizes of n = 23 were selected from each of the premanifest Huntington's disease and symptomatic Huntington's disease groups to match the n = 23 controls. If the sampled groups differed in terms of age, the sample was discarded and a new sample was drawn until the samples did not statistically differ. Group differences were subsequently estimated with the same GLM model used in the full sample. This procedure was repeated 100 times and the outcomes of these analyses were then averaged. In addition, to assess the consistency of the results independent of the potential effect of antipsychotic medication (reported to induce brain volume loss), Reference Moncrieff and Leo27 we carried out a further secondary analysis excluding those taking antipsychotics. This left a sample of 39 participants with premanifest Huntington's disease, 27 participants with symptomatic Huntington's disease and 36 control participants. Group differences were then estimated with the same GLM model used in the full sample.
Partial correlations were used to evaluate relationships between longitudinal volume loss and longitudinal changes in diffusivity measures in subcortical structures; between longitudinal change in neuroimaging measures and longitudinal change in neurocognitive and neuropsychiatric measures; between longitudinal change in neuroimaging measures and neurocognitive/neuropsychiatric scores averaged across testing sessions; and between longitudinal change in neuroimaging measures with clinical and disease severity (i.e. UHDRS-TMS and disease burden score, DBS) Reference Penney, Vonsattel, Macdonald, Gusella and Myers28 respectively. For these analyses we used parameter estimates reflecting longitudinal change or cross-session average for each individual. Age and gender were included as covariates of no interest. All correlations were also controlled for DBS Reference Tabrizi, Scahill, Durr, Roos, Leavitt and Jones4 (see also the online data supplement).
Statistical significance for all analyses was defined using a Bonferroni-corrected threshold of α = 0.05. We report results from bootstrapped regressions performed on the basis of 5000 permutations for analyses where normality assumptions were violated. Stata 12 29 was used for statistical analysis.
Results
Group differences in neuroimaging measures
The symptomatic Huntington's disease group showed significantly greater longitudinal rates of change compared with controls in whole brain, grey matter, CSF, caudate and putamen volume. The premanifest Huntington's disease group showed a significantly greater rate of change over the 30 months in caudate volume only. The symptomatic Huntington's disease group also showed significantly greater longitudinal rate of change compared with controls in caudate fractional anisotropy (Fig. 1 and Table 2). Within-group changes across testing sessions in neuroimaging measures can be found in online Table DS4.
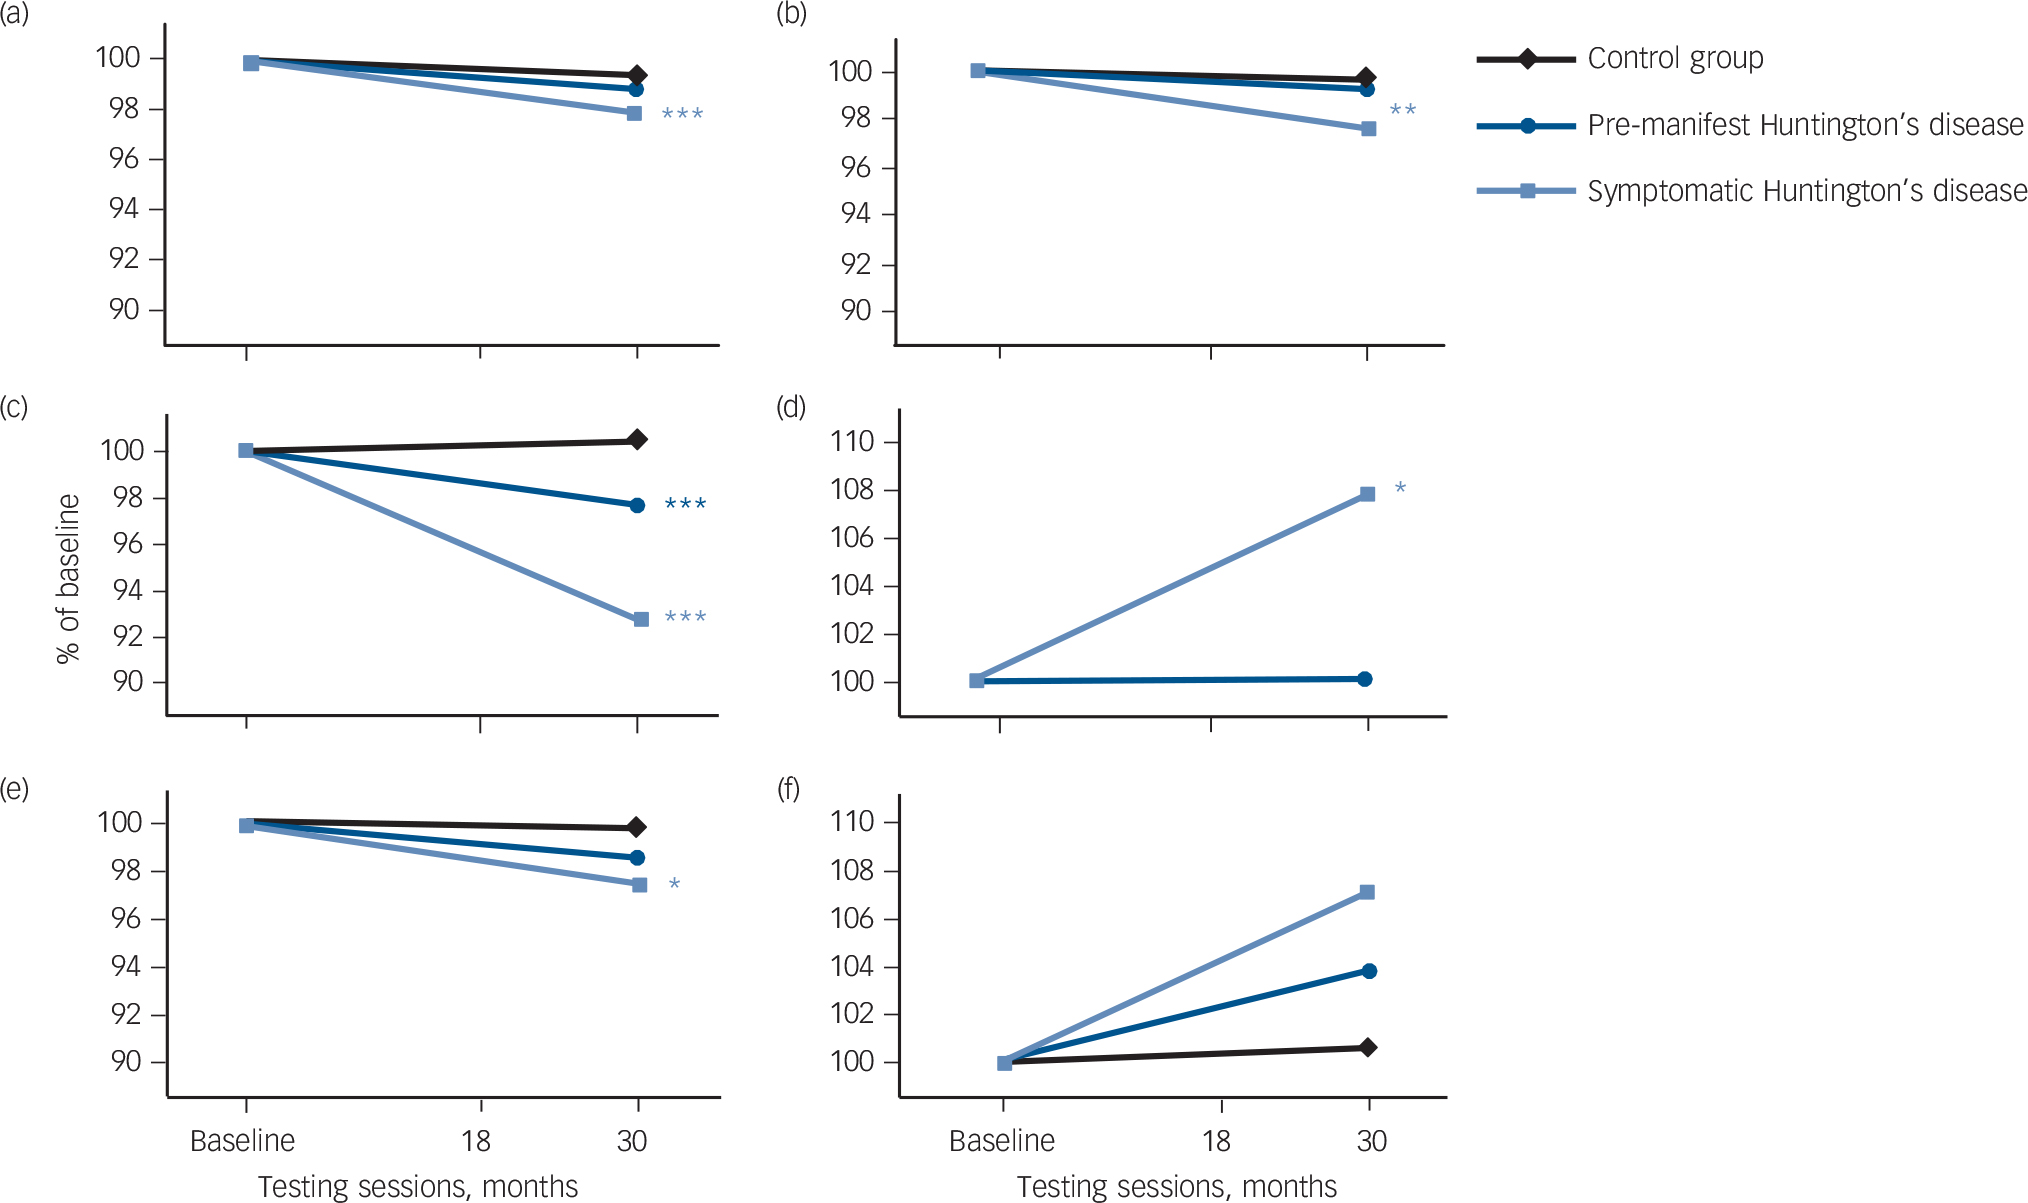
Fig. 1 Longitudinal changes in brain volume. Adjusted mean change over three testing sessions for: (a) whole brain volume; (b) Grey matter volume; (c) caudate volume; (d) caudate fractional anisotropy; (e) putamen volume; and (f) putamen fractional anisotropy. Significant longitudinal differences in participants with premanifest and symptomatic Huntington's disease relative to controls over 0, 18 and 30 months are represented by *P⩽0.05, **P⩽0.01, ***P⩽0.001 (corrected). Longitudinal change is expressed as per cent change from baseline.
Table 2 Longitudinal differences between Huntington's disease groups and controls in neuroimaging measures

| Premanifest Huntington's disease v. controls |
z | P | Symptomatic Huntington's disease v. controls |
z | P | |
|---|---|---|---|---|---|---|
| Volume, cm3 | ||||||
| Whole brain | −6.43 (4.65) | −1.38 | 0.33 | −15.39 (4.71) | −3.27 | 0.002 |
| Grey matter | −2.59 (3.82) | −0.68 | 0.99 | −11.95 (3.60) | −3.32 | 0.002 |
| White matter | −4.16 (3.83) | −1.09 | 0.56 | −0.57 (3.87) | −0.15 | 1.00 |
| CSF | 3.13 (4.29) | 0.73 | 0.93 | 16.45 (4.37) | 3.77 | <0.001 |
| Caudate | −0.080 (0.020) | −3.94 | <0.001 | −0.179 (0.021) | −8.71 | <0.001 |
| Putamen | −0.045 (0.027) | −1.67 | 0.19 | −0.075 (0.028) | −2.73 | 0.013 |
| Pallidum | 0.005 (0.008) | 0.60 | 1.00 | −0.010 (0.009) | −1.06 | 0.582 |
| Thalamus | −0.046 (0.044) | −1.04 | 0.59 | −0.047 (0.060) | −0.79 | 0.862 |
| Mean diffusivity, s/mm2 × 10−3 | ||||||
| Caudate | 0.024 (0.015) | 1.54 | 0.25 | 0.022 (0.021) | 1.05 | 0.59 |
| Putamen | 0.011 (0.007) | 1.51 | 0.26 | 0.021 (0.011) | 1.97 | 0.098 |
| Pallidum | −0.001 (0.010) | −0.10 | 1.00 | 0.020 (0.012) | 1.70 | 0.179 |
| Thalamus | −0.012 (0.008) | −1.60 | 0.22 | 0.001 (0.008) | 0.13 | 1.00 |
| Fractional anisotropy a | ||||||
| Caudate | 0.0001 (0.005) | 0.02 | 1.00 | 0.014 (0.006) | 2.58 | 0.02 |
| Putamen | 0.006 (0.005) | 1.18 | 0.47 | 0.013 (0.006) | 2.14 | 0.065 |
| Pallidum | −0.014 (0.015) | −0.95 | 0.69 | −0.017 (0.016) | −1.09 | 0.551 |
| Thalamus | −0.0003 (0.003) | −0.10 | 1.00 | −0.003 (0.004) | −0.94 | 0.694 |
CSF, cerebrospinal fluid.
a. Arbitrary units.
Data are adjusted longitudinal differences (across three testing sessions) between Huntington's disease groups and controls (s.e.). Statistically significant differences at a Bonferroni-corrected threshold of α = 0.05.
A secondary analysis, with age-matched groups, revealed the same pattern of results. That is, the group differences observed in the full analysis (with age used as a covariate) were still present, with similar effect sizes. However, group differences remained statistically significant only in caudate and putamen between symptomatic Huntington's disease and control groups. A further secondary analysis excluding participants taking antipsychotic medications revealed the same pattern of results: statistically significant differences between the symptomatic Huntington's disease and control groups were found in whole brain volume, CSF, caudate and putamen. Volume loss in the caudate was also significantly greater in participants with premanifest Huntington's disease, relative to controls.
Correlational analyses
Subcortical volume v. diffusivity measures
A partial correlation was conducted between within-participants change in caudate volume and fractional anisotropy as these measures significantly differed longitudinally between participants with Huntington's disease and controls. We found longitudinal volume loss was significantly correlated with increased fractional anisotropy in the caudate (r = −0.50, P<0.001; Fig. 2.)
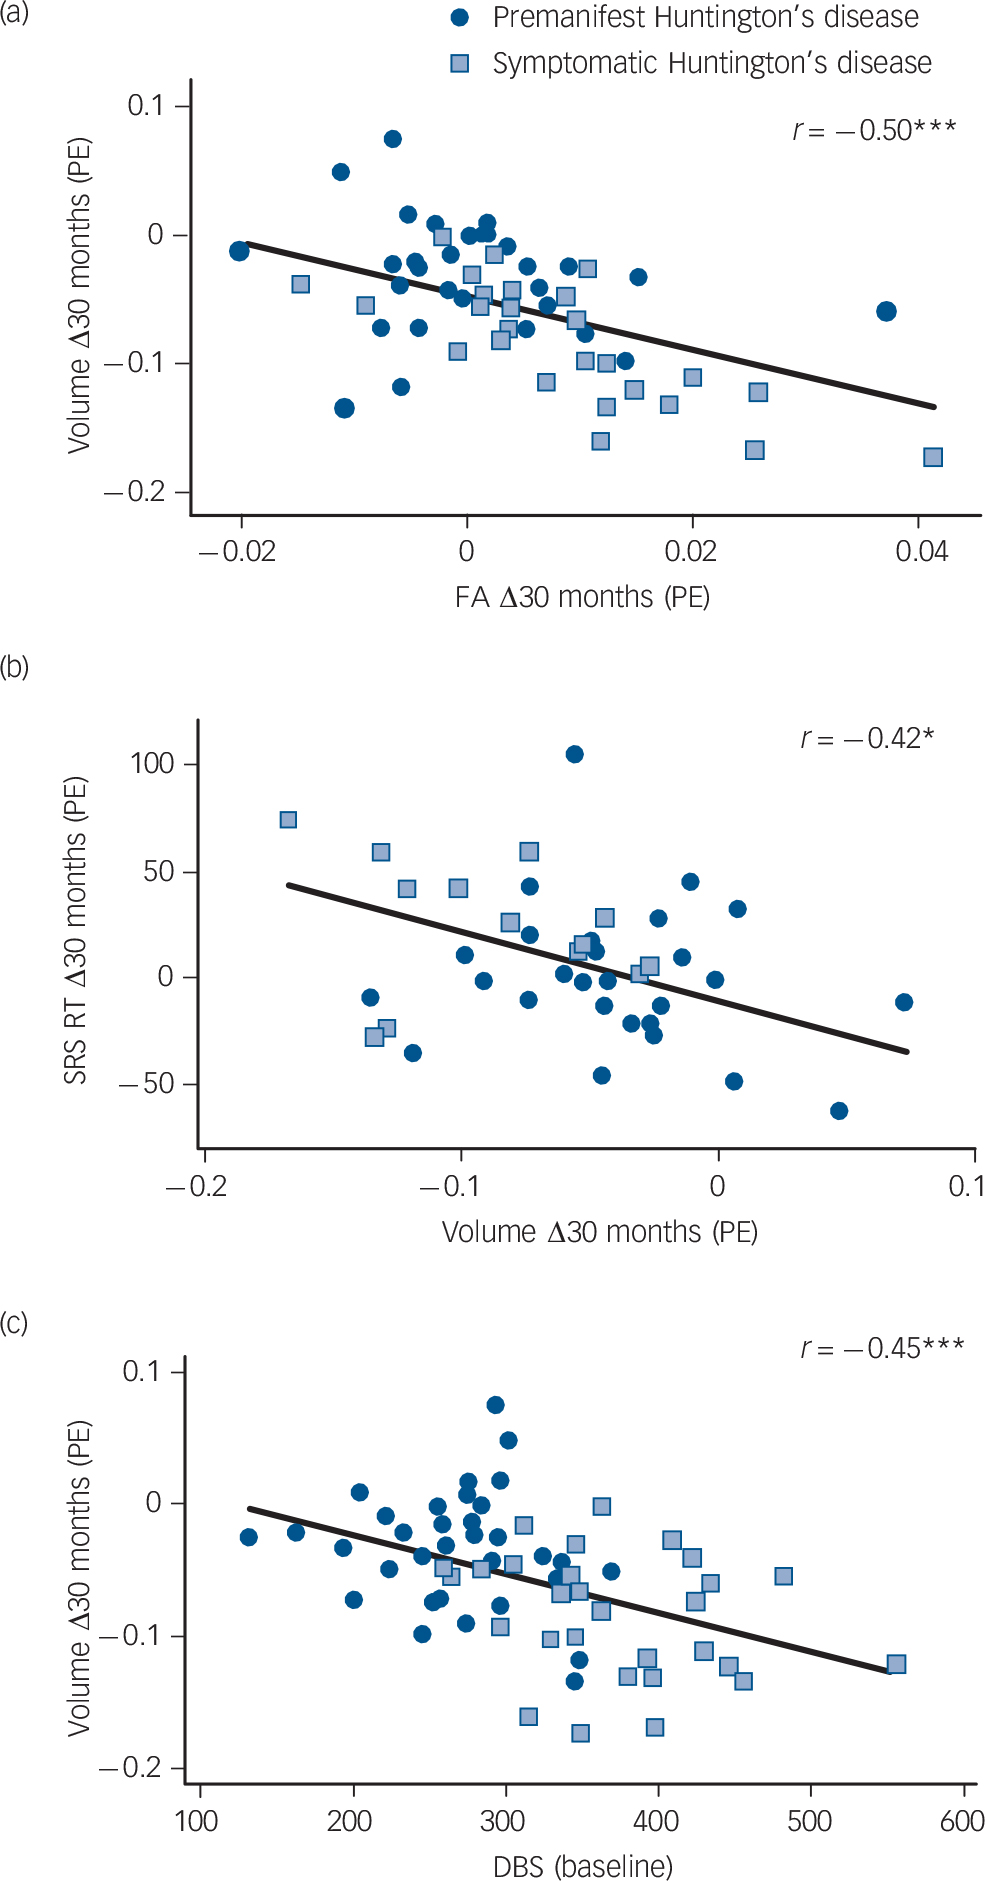
Fig. 2 Caudate correlations. Significant correlations (corrected) between longitudinal change in caudate volume and (a) longitudinal change in caudate fractional anisotropy (FA); (b) longitudinal change in shifting response set (SRS) Alternate response time (RT); and (c) disease burden score (DBS). PE, parameter estimates.
Neuroimaging v. neurocognitive and neuropsychiatric measures
Neuroimaging measures included in all subsequent correlation analyses comprised volume loss in whole brain, grey matter, caudate and putamen, and increase in caudate fractional anisotropy. All of these measures showed significant longitudinal differences between the Huntington's disease groups and controls. Of all neurocognitive and neuropsychiatric measures, only response time in SRS Letter and SRS Alternate exhibited significantly greater deterioration across time in the Huntington's disease groups, relative to controls. (See online Tables DS5 and DS6 for results of analyses of neurocognitive and neuropsychiatric variables.) These were therefore the only variables included in the analysis relating longitudinal change in neurocognitive/neuropsychiatric measures with longitudinal change in neuroimaging measures. Parameter estimates of longitudinal response time change in SRS Letter and SRS Alternate were calculated between 18 and 30 months and excluded baseline. This was done because novelty of testing at the first time point reduces the degree to which these scores are a true reflection of cognitive ability, as evidenced by well-documented practice effects in cognitive testing. Reference Calamia, Markon and Tranel30 Significant correlations were observed between longitudinal volume loss in the caudate and longitudinal deterioration in SRS Letter response time (r = −0.41, P = 0.05) and SRS Alternate response time (r = −0.42, P = 0.04; Fig. 2); and between longitudinal fractional anisotropy increase in the caudate and longitudinal deterioration in SRS Letter response time (r = 0.54, P = 0.004).
To further investigate the relationship between longitudinal change in neuroimaging measures and neurocognitive and neuropsychiatric status we used parameter estimates of the average of neurocognitive and neuropsychiatric measures across time points in a second round of correlation analyses. Averaging across sessions generated estimates of these measures that were representative for the period of assessment. Worsening of neurocognitive and/or neuropsychiatric measures across time points was expected to be associated with greater longitudinal deterioration in neuroimaging measures, thus reflecting their possible functional relevance. The correlation analyses included those neurocognitive and neuropsychiatric measures that were significantly worse in the Huntington's disease groups, compared with controls (i.e. all neurocognitive measures except from accuracy in 2-BACK and SRS Alternate; and, of the neuropsychiatric measures, SCOPI obsessive checking and pathological impulses, as well as FrSBe total and all subscales were included). (See online Tables DS5 and DS6 and Figs DS1 and DS2 for results of analyses of neurocognitive and neuropsychiatric variables.) Neurocognitive measures were averaged across the second and third time points (to avoid practice effects) and neuropsychiatric scores were averaged across the three testing sessions, and included baseline, since such measures are not subject to practice effects. Results showed significant longitudinal volume loss in the caudate correlated with deterioration in fast paced tapping precision (r = 0.40, P = 0.003), 1-BACK accuracy (r = 0.35, P = 0.02), 1-BACK response time (r = −0.36, P = 0.03) and 2-BACK response time (r = −0.39, P = 0.02). A significant correlation was also observed between longitudinal increase in caudate fractional anisotropy and slowing in 0-BACK response time (r = 0.45, P = 0.005).
Neuroimaging measures v. disease and clinical severity
Longitudinal whole brain and grey matter atrophy significantly correlated with higher UHDRS TMS (r = −0.33, P = 0.05 and r = −0.39, P = 0.01 respectively). Longitudinal atrophy in the caudate also significantly correlated with higher UHDRS TMS (r = −0.36, P = 0.02) and with higher DBS values (r = −0.45, P<0.001; Fig. 2).
Discussion
We report greater volume and diffusivity changes over 30 months in premanifest Huntington's disease and early symptomatic Huntington's disease, relative to controls. Longitudinal change in caudate volume was found to be sensitive to neurodegeneration both before and after symptom onset, making it the most robust measure across the disease continuum. Caudate fractional anisotropy was the only diffusion metric to longitudinally differ between Huntington's disease and controls and only after disease onset, which indicates diffusion measures are less sensitive than volume measures to disease progression. Importantly, we found associations between longitudinal caudate volume loss and decline in cognitive function, as well as clinical and disease severity. We also report for the first time a relationship between longitudinal change in a diffusivity metric (caudate fractional anisotropy) and deterioration in cognitive function. Collectively, our results show that a longitudinal multimodal neuroimaging strategy, including an investigation of both structural and microstructural changes, offers an important opportunity to track the trajectory of change in different tissue properties. This provides new knowledge in how Huntington's disease neuropathology develops in vivo over time, as well as its functional and clinical relevance.
Results from this study replicate the findings from our longitudinal 18-month investigation Reference Domínguez, Egan, Gray, Poudel, Churchyard and Chua10 and extend them further by providing an estimate of the rate of change over a longer period of disease progression (i.e. 30 months). Our results are also largely in agreement with previous findings Reference Aylward, Nopoulos, Ross, Langbehn, Pierson and Mills6,Reference Hobbs, Henley, Ridgway, Wild, Barker and Scahill9,Reference Hobbs, Barnes, Frost, Henley, Wild and Macdonald31–Reference Tabrizi, Reilmann, Roos, Durr, Leavitt and Owen33 that have demonstrated sensitivity of neuroimaging volumetric markers to longitudinal differences between Huntington's disease groups and controls. In particular, we found 30-month change in whole brain, grey matter, CSF and putamen volume differed between symptomatic Huntington's disease and controls. Importantly, we also found within-participant caudate volume loss was greater in both premanifest Huntington's disease and symptomatic Huntington's disease groups, relative to controls. In contrast with previous longitudinal studies over similar periods of time, Reference Aylward, Nopoulos, Ross, Langbehn, Pierson and Mills6,Reference Tabrizi, Scahill, Owen, Durr, Leavitt and Roos34 we did not find longitudinal group differences between premanifest Huntington's disease and control groups in whole brain, grey matter, CSF and putamen volume. In addition, we did not observe a longitudinal difference in white matter loss in either premanifest Huntington's disease or symptomatic Huntington's disease groups, which has been reported previously. Reference Tabrizi, Scahill, Owen, Durr, Leavitt and Roos34 These inconsistencies may be due to differences in sample sizes across studies (>100 per group in TRACK-HD and PREDICT-HD), years to diagnosis, and/or differences in methods and tools adopted for image pre-processing and segmentation. For example, the premanifest Huntington's disease group in the present study was further from onset (median 14.8 years) than in TRACK-HD (median 10.8 years). Moreover, our cortical and subcortical regions were derived independently for baseline and follow-up scans. In contrast to previous studies that used local registration of serial images before segmentation, Reference Aylward, Nopoulos, Ross, Langbehn, Pierson and Mills6,Reference Hobbs, Henley, Ridgway, Wild, Barker and Scahill9,Reference Hobbs, Barnes, Frost, Henley, Wild and Macdonald31,Reference Tabrizi, Scahill, Owen, Durr, Leavitt and Roos34 we opted for independent segmentation to ensure that a given region was identified in its entirety across serial scans and segmentation was unbiased to any specific time point (which otherwise may result in overestimation of effect sizes). Reference Reuter, Schmansky, Rosas and Fischl35 In addition, we used SPM and FSL tools for spatial pre-processing and segmentation, whereas other studies Reference Aylward, Nopoulos, Ross, Langbehn, Pierson and Mills6,Reference Hobbs, Henley, Ridgway, Wild, Barker and Scahill9,Reference Hobbs, Barnes, Frost, Henley, Wild and Macdonald31,Reference Tabrizi, Scahill, Owen, Durr, Leavitt and Roos34 have used BRAINS Reference Magnotta, Harris, Andreasen, O'Leary, Yuh and Heckel36 and MIDAS. Reference Freeborough, Fox and Kitney37
We found diffusion measures to be less sensitive to disease progression, with caudate fractional anisotropy the only measure to significantly increase in Huntington's disease, relative to controls, and only after disease onset. Increased caudate fractional anisotropy in symptomatic Huntington's disease is in accord with our 18-month investigation Reference Domínguez, Egan, Gray, Poudel, Churchyard and Chua10 and is consistent with previous cross-sectional findings, Reference Georgiou-Karistianis, Gray, Domínguez, Dymowski, Bohanna and Johnston24,Reference Rosas, Tuch, Hevelone, Zaleta, Vangel and Hersch38–Reference Sánchez-Castañeda, Cherubini, Elifani, Peran, Orobello and Capelli40 with evidence suggesting that it may represent the selective degeneration of fibre tracts within differentially oriented projections in the striatum. Reference Douaud, Behrens, Poupon, Cointepas, Jbabdi and Gaura39 The absence of significant longitudinal group differences in mean diffusivity is consistent with our 18-month investigation and two previous longitudinal studies with symptomatic Huntington's disease over 12 Reference Sritharan, Egan, Johnston, Horne, Bradshaw and Bohanna41 and 24 Reference Vandenberghe, Demaerel, Dom and Maes42 months. However, we expected group differences in mean diffusivity given the longer period of time (30 months) in this study and well-established cross-sectional differences in mean diffusivity between Huntington's disease groups and healthy controls in subcortical areas. Reference Georgiou-Karistianis, Gray, Domínguez, Dymowski, Bohanna and Johnston24,Reference Douaud, Behrens, Poupon, Cointepas, Jbabdi and Gaura39,Reference Sánchez-Castañeda, Cherubini, Elifani, Peran, Orobello and Capelli40 The lack of longitudinal group differences in mean diffusivity may be in part accounted for by a number of processes that contribute to real and apparent reduction in diffusivity metrics, including increased numbers of oligodendroglia present in Huntington's disease developmentally, Reference Myers, Vonsattel, Paskevich, Kiely, Stevens and Cupples43–Reference Mandelli, Savoiardo, Minati, Mariotti, Aquino and Erbetta45 as well as remyelination processes Reference Bartzokis, Lu, Tishler, Fong, Oluwadara and Finn46 and greater iron accumulation Reference Sánchez-Castañeda, Cherubini, Elifani, Peran, Orobello and Capelli40,Reference Bartzokis, Lu, Tishler, Fong, Oluwadara and Finn46,Reference Rosas, Chen, Doros, Salat, Chen and Kwong47 in Huntington's disease.
The present study provides a comprehensive longitudinal multimodal neuroimaging investigation characterising the relationship between change in neuroimaging markers and their long-term functional significance in Huntington's disease across neurocognitive, neuropsychiatric domains and clinical domains. We report moderate-to-strong associations between longitudinal caudate volume change and deterioration in cognitive performance (psychomotor function (longitudinal response time change in SRS Letter and SRS Alternate; average across time points of 1- and 2-BACK response time, and fast-paced tapping precision) and working memory (average across time points of 1-BACK accuracy)). We also provide the first report of neurocognitive associations with longitudinal change in diffusivity (between caudate fractional anisotropy and psychomotor function (longitudinal response time in SRS Letter and average across time pointsof 0-BACK)). These are novel and important findings that establish the functional significance of longitudinal neurodegeneration of the caudate. The large-scale TRACK-HD study Reference Tabrizi, Scahill, Durr, Roos, Leavitt and Jones4 has reported significant but weak correlations between 12-month longitudinal atrophy and neurocognitive measures: whole-brain volume with circle tracing and SDMT; and caudate volume with speeded tapping only. In the present study we were able to more strongly link longitudinal caudate atrophy with a broader array of measures of cognitive decline. Results from the present study, together with those from TRACK-HD, indicate that neurodegeneration in the caudate is a strong indicator of psychomotor deterioration. No imaging measure of longitudinal change was, however, associated with neuropsychiatric dysfunction.
Longitudinal measures of whole brain, grey matter and caudate volume loss correlated with UHDRS-TMS, a clinical measure of disease progression, and DBS (caudate only), a symptom-free indicator of time point in disease progression. Other studies have similarly found associations between longitudinal change in whole brain, grey matter and caudate volume and measures of clinical or disease severity. Reference Tabrizi, Scahill, Durr, Roos, Leavitt and Jones4,Reference Hobbs, Henley, Ridgway, Wild, Barker and Scahill9,Reference Tabrizi, Scahill, Owen, Durr, Leavitt and Roos34 We also found for the first time a significant association between longitudinal change in caudate volume and fractional anisotropy, which further confirms the caudate as a focal target of neuropathology in Huntington's disease.
Limitations
When interpreting our results it is important to consider that the symptomatic Huntington's disease group was significantly older than the premanifest Huntington's disease and control groups. This poses a limitation for assessing longitudinal differences between symptomatic Huntington's disease and controls, despite the fact that age was included as a covariate in all analyses. To address this issue directly, a secondary analysis with age-matched groups revealed group differences with effect sizes similar to those in the full analysis. However, in this analysis only caudate and putamen volume differences remained statistically significant between symptomatic Huntington's disease and controls. The lack of significant group differences in the other measures may be due to the loss of power associated with the reduced sample. It is possible that the significant differences observed in these measures (with the full sample) may be due to age-related effects; however, this is unlikely given the effect sizes. On the other hand, the finding of significant caudate and putamen volume differences between symptomatic Huntington's disease and controls in the age-matched samples further highlights the robustness of these measures. Moreover, care should be taken when interpreting our results due to possible effects of medication status on outcome measures. However, a secondary analysis excluding participants on antipsychotic medications revealed a pattern of significant results consistent with the full analysis, except for grey matter and caudate fractional anisotropy. The reduced sample may have contributed to the lost effect of grey matter and caudate fractional anisotropy between symptomatic Huntington's disease and controls. It is also possible that the significant differences observed in these measures (with the full sample) may be due to the effects of antipsychotic medication. Participants in our sample were also taking antidepressants, which have been shown to reduce or prevent atrophy in the hippocampus. Reference Tanis, Newton and Duman48 There was, however, no scope for a secondary analysis that excluded participants taking antidepressants, as the number of exclusions would have been too large leading to a significant loss of power. Better powered studies should control for the effect of medications in the future. In addition, although we adopted a well-established approach where images from all time points were segmented independently (thus avoiding introducing bias to a reference image), promising longitudinal analysis methods may provide unbiased techniques to improve their precision and discriminatory capacity of data common to each participant's serially acquired images. Reference Reuter, Schmansky, Rosas and Fischl35,Reference Hua, Hibar, Ching, Boyle, Rajagopalan and Gutman49
Implications
Collectively, our results show that a multimodal neuroimaging approach offers an important opportunity to track the trajectory of different tissue properties in Huntington's disease in parallel, providing important information about how neuropathology develops over time. Our findings confirm the utility of a number of cortical and subcortical volume measures and caudate fractional anisotropy as longitudinal markers of disease progression after symptom onset. Furthermore, caudate volume was found to be sensitive to neurodegeneration both before and after symptom onset, making it the most robust measure across the disease continuum. Diffusion measures were found to be less sensitive to disease progression, with caudate fractional anisotropy becoming sensitive only after symptom onset. Importantly, longitudinal caudate volume loss was correlated with longitudinal increase in caudate fractional anisotropy in participants with Huntington's disease, and both these measures were associated with decline in cognitive function. Furthermore, caudate atrophy was associated with both clinical and disease severity. These results indicate that caudate neurodegeneration, especially caudate atrophy, may represent an imaging outcome measure that is predictive of meaningful clinical benefit. Our findings suggest that caudate volume may be the most suitable candidate surrogate biomarker for consideration in the development of early stage clinical trials.
Funding
We are grateful to the CHDI Foundation, New York (USA) (grant number A – 3433), and to the National Health and Medical Research Council (NHMRC) (grant number 606650), for their support in funding this research. This research was also supported by the VLSCI's Life Sciences Computation Centre, a collaboration between Melbourne, Monash and La Trobe Universities and an initiative of the Victorian Government, Australia.
Acknowledgements
We acknowledge the contribution of all the participants who took part in this study. We also thank the Royal Childrens Hospital for the use of their 3T MR scanner.


eLetters
No eLetters have been published for this article.