Abstract
This paper presents a new method for measuring localized corrosion under disbonded coatings by means of an electrochemical sensor, denoted differential aeration sensor (DAS). It measures the distribution of electrochemical currents over an electrode array surface partially covered by a crevice that simulates a disbonded coating. The DAS has been evaluated using immersion tests at open circuit and under cathodic protection (CP) conditions. Under both conditions, anodic as well as cathodic current densities were detected within the crevice. A fundamental understanding for the detection of anodic currents under CP has been explained in terms of basic electrochemistry. Based on the current distribution data provided by the sensor, two different analysis methods have been used to estimate corrosion and its distribution. These methods consisted of a direct application of Faraday's Law to the anodic currents detected by the array, and on a sensor-specific method denoted 'corrected currents' method. It has been demonstrated that under diffusion controlled conditions this latter method produces a better corrosion estimation than the direct application of Faraday's Law. The 'corrected currents' method allowed the estimation of corrosion patterns outside the crevice under CP. Good correlation between electrochemical calculations and surface profilometry results has been obtained.
Export citation and abstract BibTeX RIS

This is an open access article distributed under the terms of the Creative Commons Attribution 4.0 License (CC BY, http://creativecommons.org/licenses/by/4.0/), which permits unrestricted reuse of the work in any medium, provided the original work is properly cited.
Cathodic protection (CP) is typically applied in combination with barrier coatings to prevent corrosion of steel on buried structures such as in water and energy pipelines. However, this combination is not always effective. Industrial experience has shown that severe localized corrosion issues such as pitting, microbiological induced corrosion and stress corrosion cracking can still occur within these structures, and these occurrences are often related to disbonded coatings.1–6 Coating disbandment is common in buried pipes, particularly when CP is applied,3,7 leading to the formation of a crevice (or gap) between the metal surface and the disbonded coating layer. Solution from the surrounding environment can access these crevices, resulting in enclosed corrosive environments. Furthermore, the effectiveness of the applied CP is believed to decrease significantly within the crevice due to a phenomenon often referred to as cathodic shielding. This phenomenon is particularly serious for buried pipelines, because the typically resistive soil solution could prevent CP current from reaching deep into the crevice created by the disbondment.8–23 Disbonded coatings are generally considered a 'worst case scenario' for pipeline corrosion. Therefore, early detection of insufficient CP and corrosion within such crevice environments is critical.
Potential survey methods, currently used by the pipeline industry, are not able to provide information about the CP effectiveness under a disbonded coating.
Whilst the use of in-line metal loss inspection tools can detect pipeline corrosion (including that produced under disbonded coatings), they are sensitive only to attack that has advanced considerably and their costs are only justified in cases where leakages represent a significant safety or environmental concern.24,25 Using sensors to simulate and detect early stages of corrosion or to measure corrosion susceptibility under disbonded coatings could provide a valuable and inexpensive means of obtaining in situ monitoring information on the health of a structure. However, several challenges need to be addressed before a sensor could be practically applied to monitor CP performance and corrosion rates under disbonded coatings in buried structures. Corrosion monitoring via conventional weight-loss coupons is generally considered unsuitable for buried structures due to difficulties and high costs involved in their retrieval. In addition, only time averaged information is obtained with this method. Electrical resistance probes are another non-electrochemical method that has been used in industry. Although these probes allow inexpensive remote interrogation of in-situ corrosion rates in the environments to which a pipeline is exposed, they are generally not appropriate for localized corrosion evaluation despite plausible attempts to overcome these limitation via multifilament designs.26,27 Electrochemical monitoring methods, on the other hand, are characterized by a high sensitivity to corrosion processes. These methods, which include potential monitoring, linear polarization resistance (LPR) and electrochemical impedance spectroscopy (EIS), have been employed for measuring corrosion related parameters in soil, at open circuit potential (OCP).28,29 However, CP introduces significant challenges when using such techniques for measuring corrosion rates, since these traditional electrochemical methods are not directly applicable at an externally fixed CP potential.30,31 Furthermore, given that disbonded coatings promote the development of a local environment that significantly differs from the bulk,8–22,32,33 the use of either corrosion coupons or sensors directly exposed to the bulk soil does not adequately represent the corrosion susceptibility under disbonded coatings. Therefore, the development of a sensor that could use electrochemical means to evaluate corrosion under more realistic conditions would be an important step.
Traditionally, laboratory measurements of CP performance within a crevice are carried out by evaluating solution potential profiles.8–13,15,16,18,19,21,23,33 However, it is difficult to correlate local potential values with corrosion rates without more information regarding the local conditions. Corrosion rates are related to the anodic dissolution kinetics which are constantly influenced by factors such as CP potential, as well as changes in oxygen concentration,11–13,17,18,22,23,32 pH,10,12,13,16–19,21,22,33–35 and concentration of other species16,17,22,35 present under disbonded coatings, which affect the passivity of the metal. Therefore, the ability to directly measure anodic current densities under disbonded areas would provide a more direct way to evaluate corrosion rates. Although only cathodic currents are generally detected under CP, the current density profiles obtained using segmented electrodes presented by Li et al.1,5 Brousseau et al.10 and Wang et al.23 showed unexpected anodic current densities at discrete locations. Li et al.15 related the anodic currents to preferential corrosion of those electrode sites, however, no theoretical support or discussion on the practical implications of such measurements were provided.
In this paper, we present an electrochemical sensor, denoted differential aeration sensor (DAS), which is based on this possibility to detect anodic currents on metals subjected to CP under disbonded coatings by the use of segmented electrodes. Two-dimensional electrochemically integrated electrode arrays such as the wire beam electrode (WBE)36–41 and the coupled multielectrode array sensor (CMAS)42 have been previously used to study non-homogeneous corrosion conditions. The DAS takes advantage of the higher spatial and temporal resolution of the WBE compared to segmented electrodes used in previous studies of current distribution under disbonded coatings. Preliminary work on the development of the DAS can be found elsewhere.43–45 In this work, the DAS ability to measure corrosion rates under disbonded coatings at OCP and under cathodically protected conditions is evaluated, and a recently published method46 for estimating corrosion rates of bare metals under CP is integrated to enhance the technique capabilities. Such a sensor could be electrically connected to and buried alongside a coated structure, where coating disbondment is suspected and aggressive corrosion conditions are expected, thereby giving early warnings of the likelihood of critical corrosion damage at a 'worst case scenario' condition and providing a greater ability to quantify this type of corrosion compared with the current methods.
Materials and Methods
The DAS and electrochemical cell
A 100 steel (UNS no. G10350) electrodes WBE36–39 was used as the basis for the DAS. All the 1.6 mm diameter wires were closely packed into a 10 by 10 array of 18.5 by 18.5 mm and mounted in epoxy resin avoiding electrical contact between them. Before each test, the sensor surface was progressively abraded with 240, 600 and 1200 grit silicon carbide paper and cleaned with acetone followed by ethanol. To simulate the disbonded coating, a polymethyl methacrylate (PMMA) cover with an incorporated rubber seal was used. Fig. 1 illustrates the geometry of the WBE and the simulated disbonded coating. The crevice gap between the PMMA cover and the array's surface was fixed at 0.25 mm by introducing spacers at the areas indicated in Fig. 1. The PMMA cover and rubber seal were cleaned with ethanol and mounted over the WBE epoxy body using four AISI 316 stainless steel screws. In all cases, two rows of electrodes were directly exposed to the bulk solution outside of the crevice (simulating a coating holiday), and the eight remaining rows were under the PMMA cover (simulating a disbonded area). Fig. 2 illustrates the basic geometry of the electrochemical cell and the electrical connections used to measure current density maps under CP. The 2.5L cell was constructed from polyethylene and glass, with a flange connection for quick installation of the DAS. All potentials were measured against a Silver/Silver Chloride/Saturated KCl reference electrode. A Luggin capillary was used to minimize IR drops. The capillary tip was located 4 mm away from the section of the electrode array not covered by the crevice. Two 4.5 mm diameter graphite rods immersed to a depth of 120 mm in the solution were used as counter electrodes. The cell lid was designed to maintain a constant distance between the DAS, the reference and the counter electrodes in all tests. All tests were performed at a controlled room temperature of 22 ± 2°C.
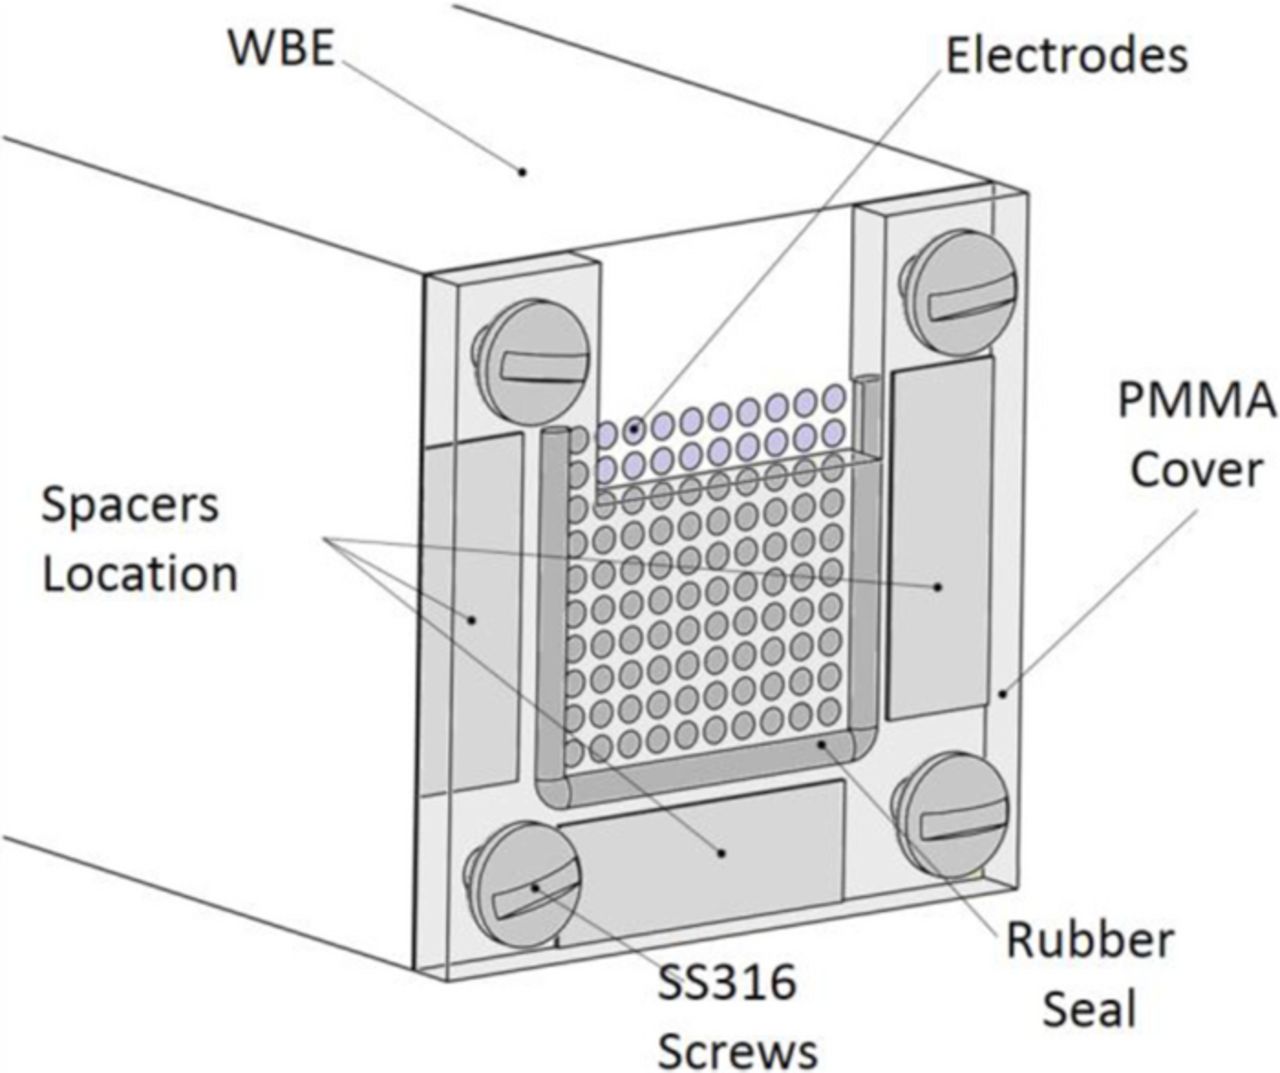
Figure 1. Schematic diagram of the differential aeration sensor.
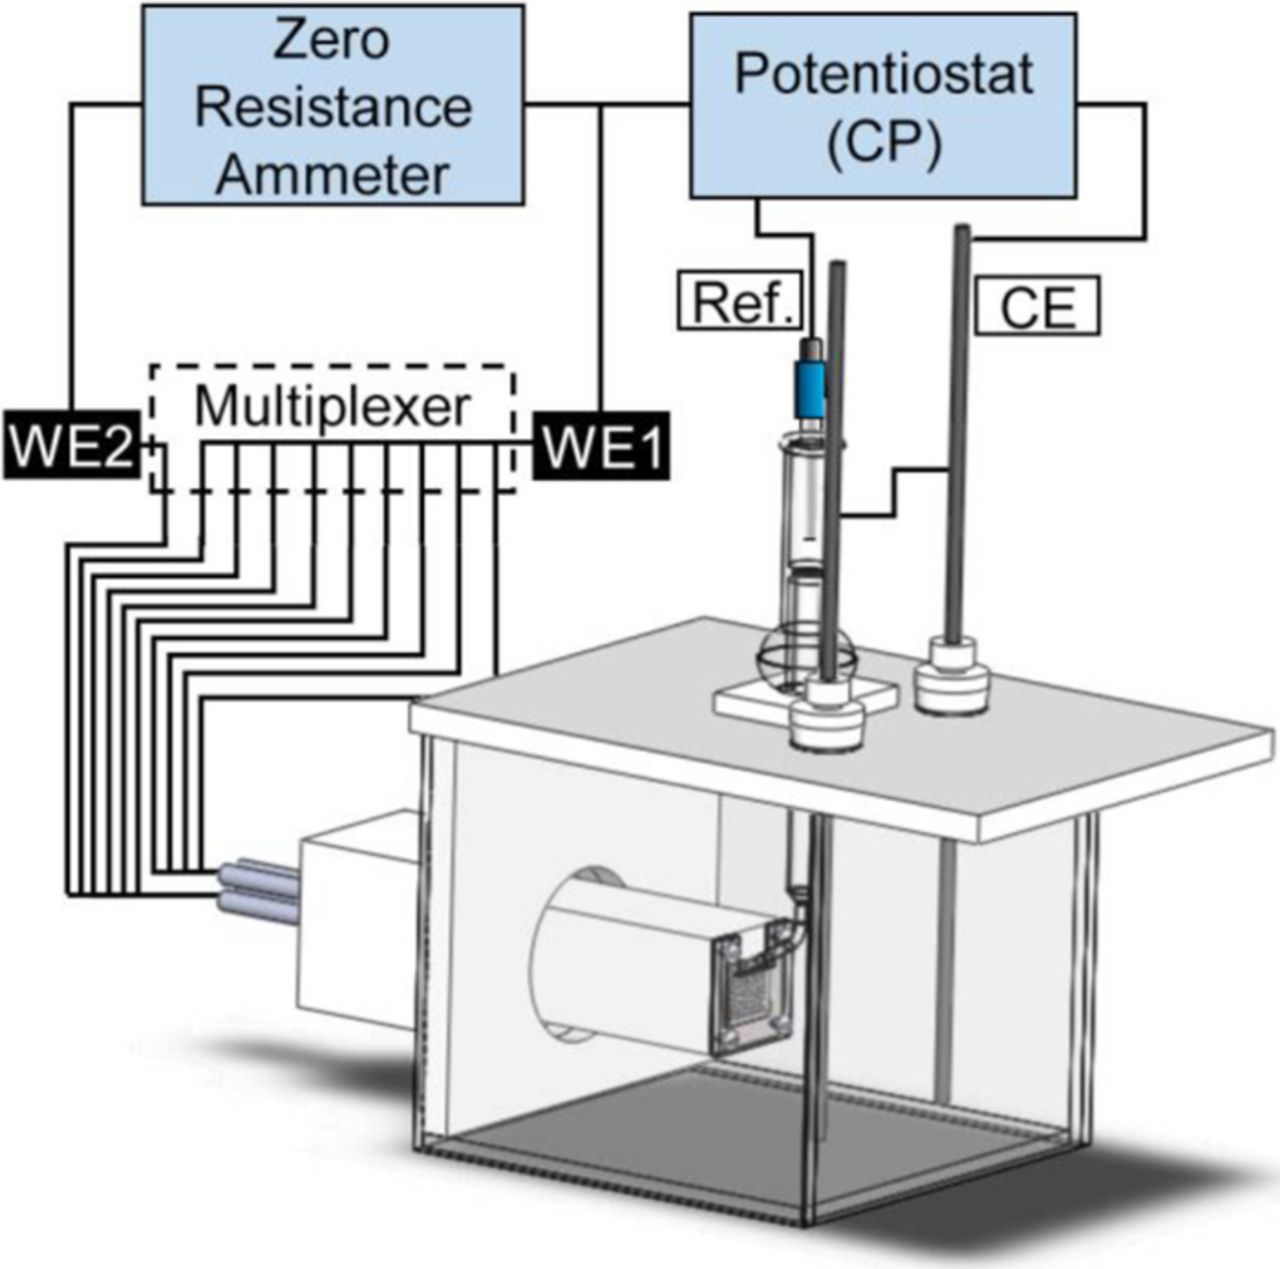
Figure 2. Schematic diagram of the experimental arrangement for determination of current density maps under CP.
Solutions and test conditions
Test solutions were prepared from analytical grade reagents and ultrapure water. Solutions were purged with air overnight to ensure oxygen saturation and were left open to air during the tests. The DAS was exposed for 50h in 0.1M NaCl, with initial pH values around 6.2, and phosphate buffer solutions of pH 7.8. In NaCl solutions, the DAS was tested at open circuit potential (OCP) and at −730 mVAg/AgCl. Although the selected NaCl concentration is too high to be considered representative of a typical soil, the objective of its selection is to maximize corrosion in order to assess the performance of the DAS in accelerated tests. The phosphate buffer solution was prepared by adding 227 mL of 1M K2HPO4 solution and 23 mL of 1M KH2PO4 to 5L of ultrapure water. Tests performed in pH 7.8 buffer solution, aiming to reduce the likelihood of steel passivation under CP, were also performed. In this case the DAS was tested at a less negative CP potential of −680 mVAg/AgCl.
Measuring method
Current densities across the sensor surface were mapped at regular intervals during all immersion tests. These current densities were measured using a 100 channel multiplexer (Fig. 2). The multiplexer was programmed to maintain 99 electrodes connected to the WE1 terminal while leaving the remaining electrode connected to the WE2 terminal. After a certain sample time, the electrode connected to WE2 was changed following a predetermined scanning sequence that swept the whole array. To avoid CP potential fluctuations when switching from one electrode to another, a make-before-break switching sequence was followed. CP was controlled by a Bio-logic VMP3 potentiostat using a typical three electrode setup where WE1 was used as the working electrode. A Gill AC potentiostat, used as zero resistance ammeter (ZRA), was interconnected between WE1 and WE2 to measure currents and, simultaneously, achieve the same electrical potential in all electrodes. Ground loops between both potentiostats were avoided as a result of the floating ground capability of the potentiostat acting as ZRA. The current sampling rate was 100 Hz in all cases. For all three experimental conditions, current densities were mapped every 10 min measuring the currents for 1 second at each electrode. At the end of each test, the bulk solution was removed from the cell and the pH of the solution trapped between the PMMA cover and the array was measured with strips of pH indicator paper.
Surface profilometry
Once the DAS was detached from the electrochemical cell, the PMMA cover was removed, the electrode array surface was cleaned with water followed by acetone and ethanol, and photographed. Corrosion products were then removed using ASTM G1-03 C.3.1 solution (1L HCl sp gr 1.19, 20g Sb2O3, 50g SnCl2).4.7 In all cases, the array was exposed to ASTM G1-03 solution for less than a minute before being rinsed with water followed by ethanol. After removing the corrosion products, the surface of the electrode array was photographed again. Due to the large size of the electrode array, surface profilometry measurements could not be performed directly on it. Therefore, surface replicas of the electrode array were obtained using a Struers repliset-F5 kit, and profilometry measurements were performed over the surface replicas instead.
Optical surface profilometry measurements of each electrode in the array were performed over the surface replicas using a Wyko NT9100 interferometry profilometer. The surface profilometry results were processed to calculate the negative volume (volume below the mainline). An additional surface replica of the electrode array in "as polished" condition was also measured to identify the negative volume associated with the surface roughness. This roughness negative volume was subtracted from all measurements and the result was divided by the area of each electrode in order to express the results in average thickness loss.
Current distribution data post-processing
An ad-hoc (MATLAB R2012b, MathWorks, Inc., Massachusetts, USA) script was used to process the raw data obtained from the ZRA. This script segmented the data corresponding to each electrode and current map based on the switcher scanning sequence and rate. These data were then used to calculate the average current value at each electrode. Current densities were calculated based on the area of a single electrode. Each electrode current density value was arranged in a matrix following the electrode address. Current density surface maps were generated using linear interpolation of the 10 by 10 data matrix.
Cathodic polarization curves
In order to study the cathodic reactions, additional tests were performed incorporating a 1 mm diameter by 10 mm long Pt electrode at the crevice mouth. Potentiodynamic polarization curves at a scanning rate of 10 mV/min where obtained for each of the experimental conditions after 25 h of exposure. For the experimental conditions where the DAS was maintained under potentiostatic CP, two channels of a Bio-logic VMP3 potentiostat were used as bi-potentiostat to maintain the DAS potential while polarizing the Pt electrode.
Results
Fig. 3 presents the cathodic polarization curves obtained by a Pt electrode placed outside the crevice in both test solutions. In both cases, the curves presented plateaus related to the diffusion controlled oxygen reduction reaction that extended for several hundred millivolts until the contribution of hydrogen evolution became significant. The potentials from which the hydrogen evolution contribution produced a departure from the diffusion controlled behavior were approximately −780 mV for the NaCl solution and −730 mV for the phosphate buffer solution. In the case of steel, these potentials would be more negative than for Pt due to the lower hydrogen evolution exchange current density. Based on these data, CP potentials of −730 mV and −680 mV (indicated by dashed vertical lines in Fig. 3) were selected for the NaCl and phosphate buffer solution respectively, to perform the DAS immersion tests. Notice that in both cases, at these potentials, the overall cathodic reaction is diffusion controlled.
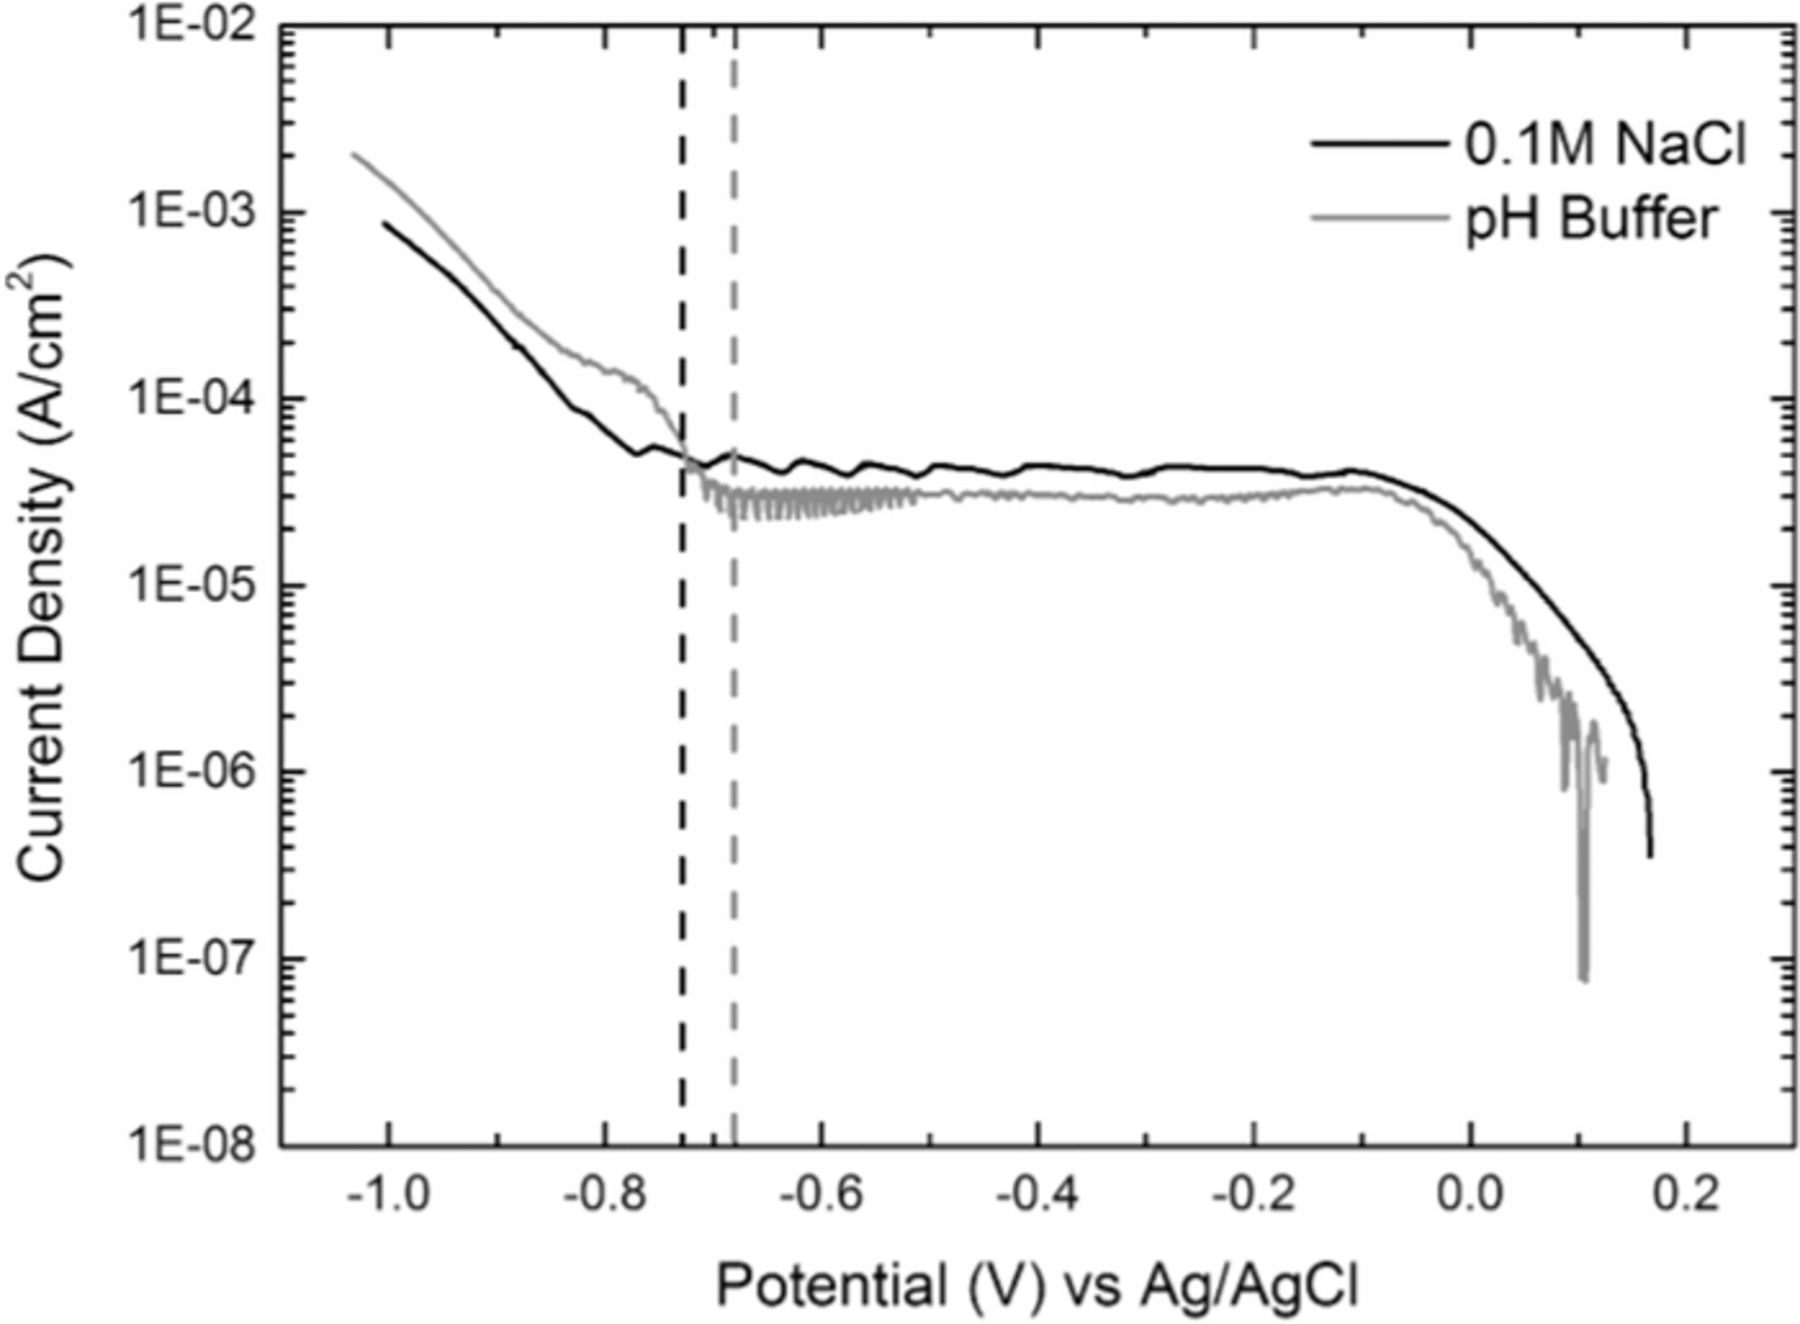
Figure 3. Cathodic polarization curves in 0.1 M NaCl and pH 7.8 phosphate buffer solutions.
Figs. 4–6 present typical current density maps from 50h immersion tests at each of the three evaluated experimental conditions (Videos showing dynamic behavior in greater detail are presented as a supplementary material to the online version of this paper). Cathodic current densities are displayed as negative values (blue color) while anodic values are displayed as positive values (red color). The first two rows of electrodes correspond to the area outside the crevice, while the remaining rows correspond to the simulated disbonded area within the crevice.
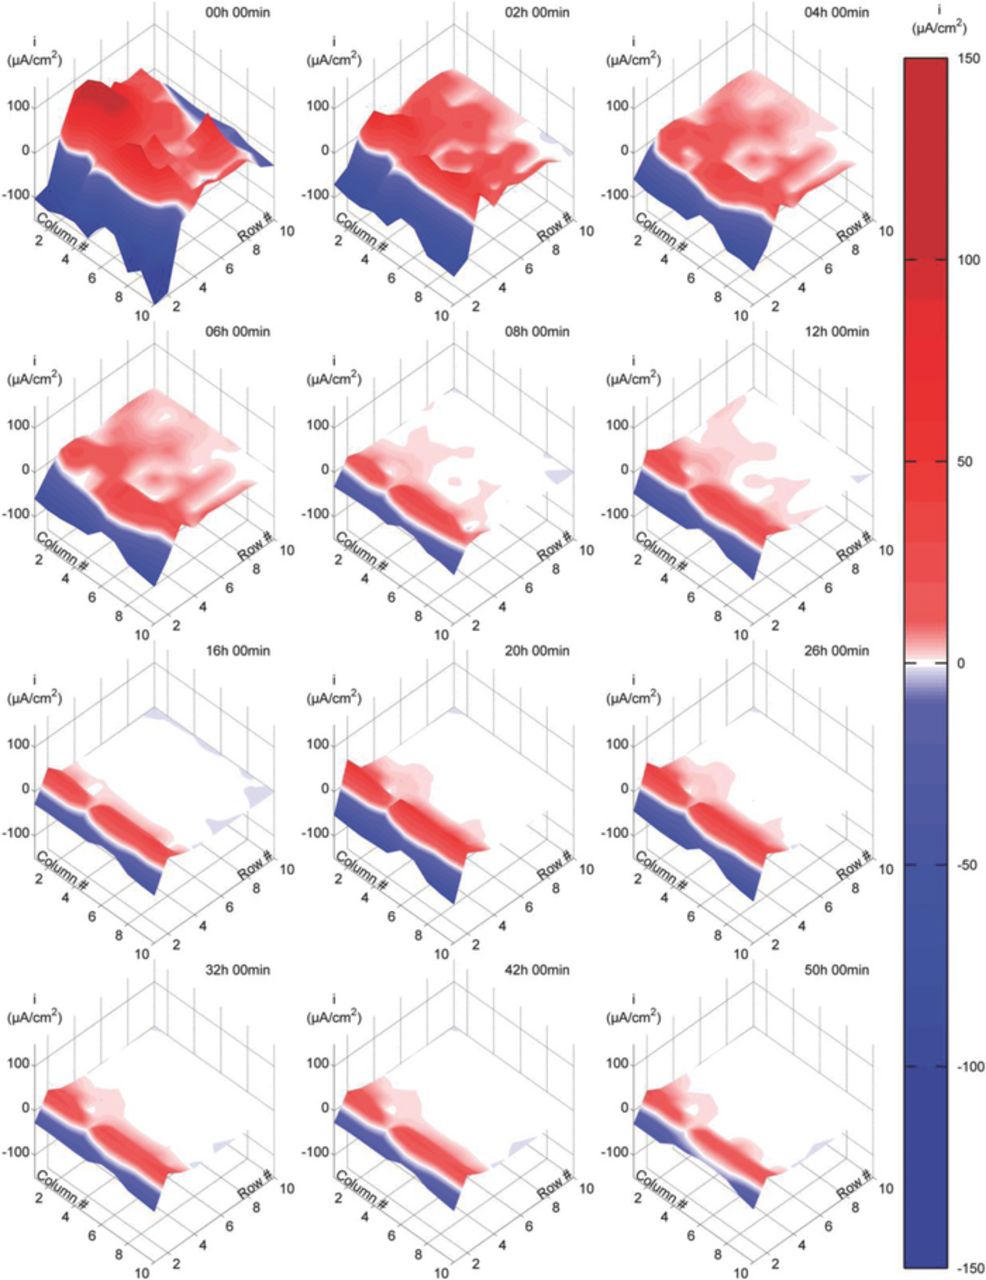
Figure 4. Current density maps at various immersion times in 0.1 M NaCl solution at OCP.
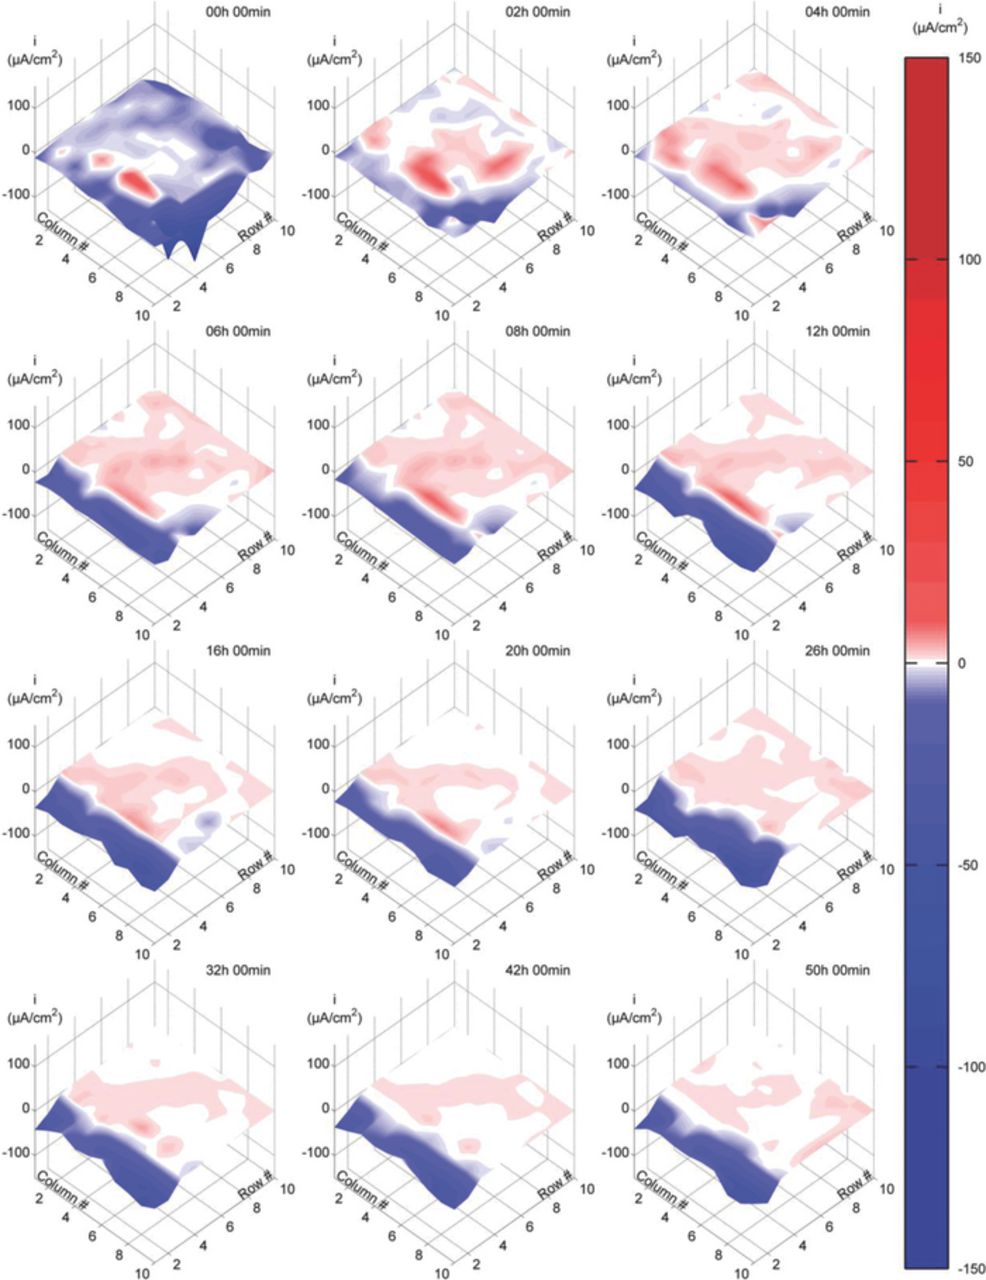
Figure 6. Current density maps at various immersion times in pH 7.8 buffer solution with CP. CP potential: −680 mV against Ag/AgCl/Sat. KCl reference electrode.
When the DAS was exposed in 0.1M NaCl and no CP was applied (Fig. 4), initial cathodic sites were mainly located outside the crevice, while within the crevice large anodic currents were found, especially in the proximity of the mouth of the crevice. Soon after the test started, the number of cathodic sites and the magnitude of cathodic currents within the crevice decreased rapidly until eventually they completely vanished. The number of anodic sites and the magnitude of anodic currents deep inside the disbonded area also decreased as the test progressed. With the continuation of the test, the anodic region, which was initially located within the crevice, moved towards the crevice mouth and covered part of the area outside the crevice. The pH measurements of the test solution within the crevice at the end of the test recorded a value of approximately 7, i.e. no significant changes from the initial value (pH 6.2).
When the DAS was exposed in 0.1M NaCl at a fixed CP potential of −730 mVAg/AgCl (Fig. 5), current density maps showed different features from those shown in Fig. 4. Outside the crevice, large cathodic currents were registered during the whole test period. Relatively high cathodic current densities were also registered inside the crevice, along the third row of electrodes. Deeper into the crevice, relatively low magnitude anodic and cathodic current densities were observed. These currents changed significantly during the course of the test, initially presenting mostly cathodic values that decreased during the first several hours of exposure with some becoming anodic in later stages. These anodic current densities reached a maximum of about 2.6 μA/cm2, and gradually decreased with time to less than 1.1 μA/cm2. In this case, the pH inside the crevice increased significantly reaching an average final value of 11 at the end of the test.
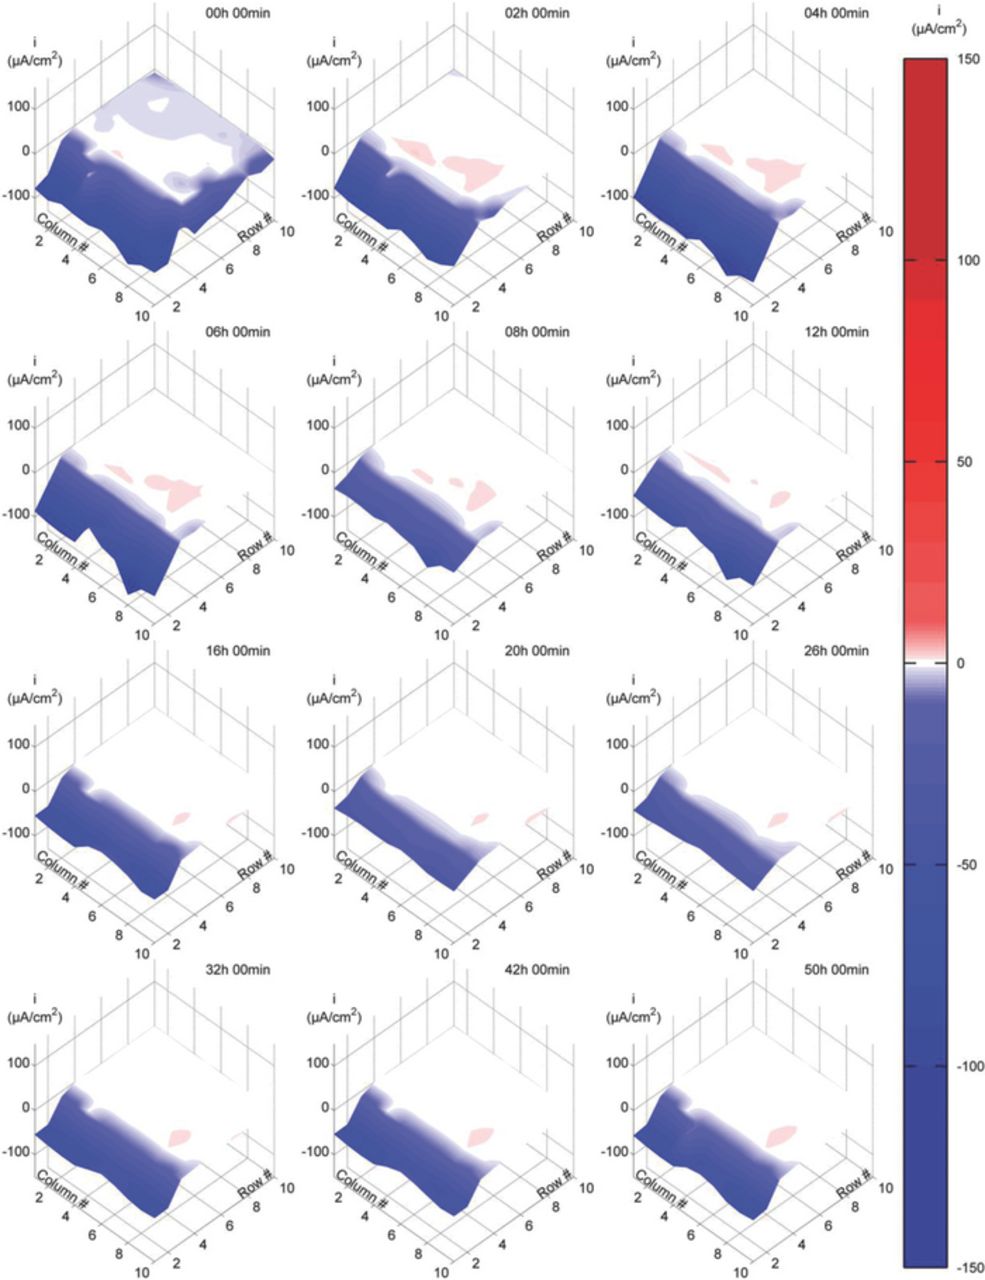
Figure 5. Current density maps at various immersion times in 0.1 M NaCl solution with CP. CP potential: −730 mV against Ag/AgCl/Sat. KCl reference electrode.
Fig. 6 presents the current density results obtained when exposing the DAS in pH 7.8 buffer solution at a constant CP potential of −680 mVAg/AgCl for 50h. In general, the current distribution maps are similar to those found under CP in NaCl solution (Fig. 5). Outside the crevice, although some areas presented anodic current densities at the beginning of the test, these areas became cathodic after the first several hours of exposure. After this initial transient, large cathodic current densities of similar magnitude to those observed in NaCl solution under CP (Fig. 5) prevailed at the area outside of the crevice for the rest of the test.
Inside the crevice, a combination of anodic and cathodic currents was observed at the beginning of the test. The cathodic areas within the crevice decreased during the first several hours of the test until only anodic current densities were detected at locations beyond the 4th row of electrodes. When comparing the anodic current densities detected within the crevice in buffer solution (Fig. 5) and NaCl solution (Fig. 4), significantly more anodic areas where detected in the buffer solution case. These anodic current densities also were larger and persisted for longer periods than in NaCl solution.
Fig. 7 illustrates the condition of the electrode array at the end of the test at OCP in NaCl solution, presenting images of the array before and after removal of corrosion products and the results of surface profilometry. The most severely attacked areas were located outside the crevice, along the 2nd row and some electrodes of the 1st row. Inside the crevice, accumulation of corrosion products (Fig. 7a) and signs of metal loss (Fig. 7b) were observed mostly in the proximity of the crevice mouth. According to surface profilometry measurements metal losses outside the crevice were around 0.4 μm for the corroded electrodes and less than 0.05 μm for the non-corroded ones. Inside the crevice, metal losses were significantly lower, ranging between 0 μm and 0.2 μm.
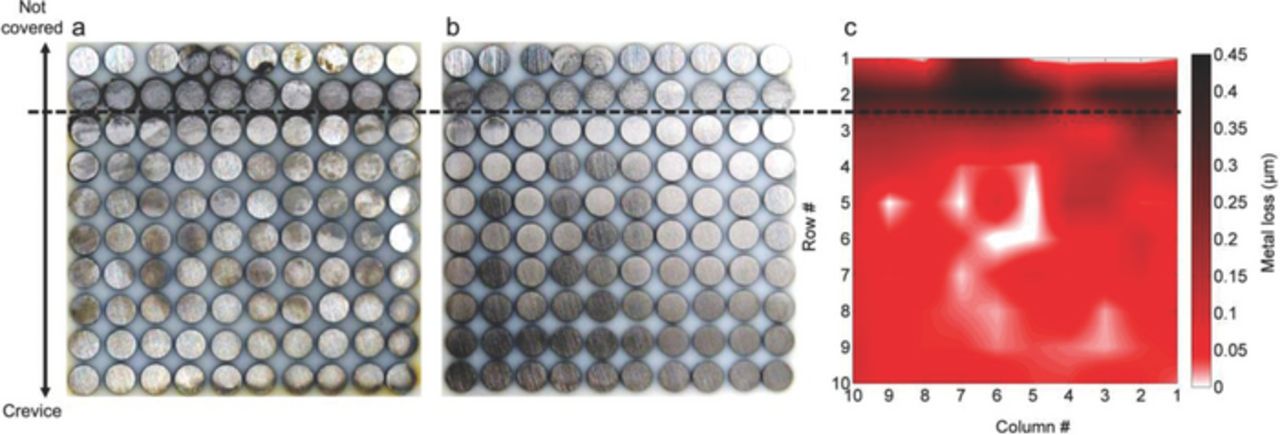
Figure 7. Condition of the sensor's array surface after 50h immersion in 0.1 M NaCl solution at OCP. Surface before corrosion products removal (a), surface after corrosion products removal (b) and Surface profilometry results (c).
Pictures of the surface of the electrode array and surface profilometry results for the test performed in 0.1M NaCl solution at −730 mV are presented in Fig. 8. The corrosion attack in this case has been significantly lower than on the test performed at OCP in the same solution (Fig. 7). Outside the crevice, some electrodes presented evidence of pitting corrosion. Within the crevice, although some corrosion products were found between electrode rows 3 and 6 (indicated in Fig 8a), after removing the corrosion products no obvious evidence of corrosion was found at those electrodes. Surface profilometry measurements indicated metal losses as high as 0.3 μm for those electrodes presenting pits outside the crevice and very small metal losses, smaller than 0.03 μm, inside the crevice. The metal loss distribution inside the crevice (Fig. 8c) did not show an obvious correlation with the location of the corrosion products indicated on Fig. 8a.
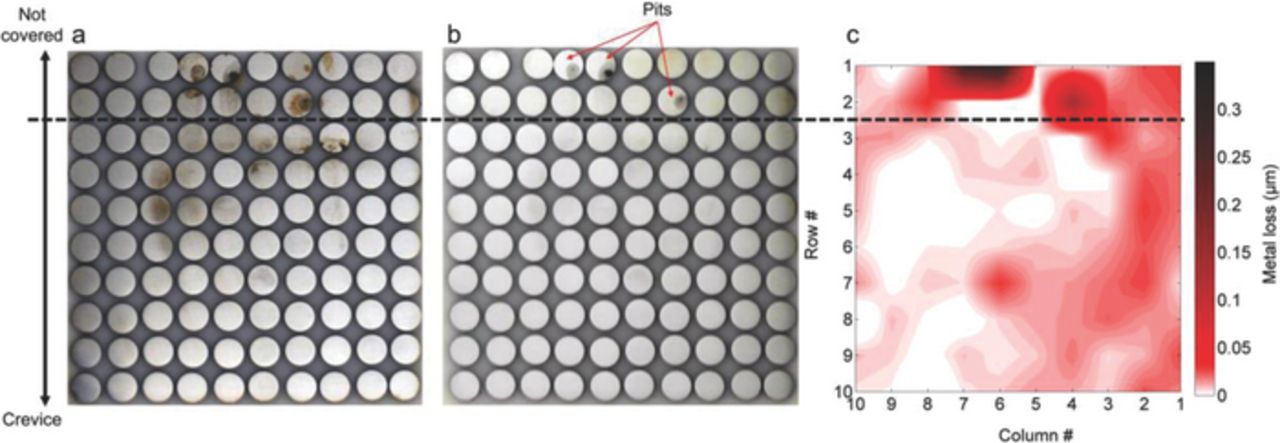
Figure 8. Condition of the sensor's array surface after 50h immersion in 0.1 M NaCl with CP (−730 mVAg/AgCl). Surface before corrosion products removal (a), surface after corrosion products removal (b) and Surface profilometry results (c).
The condition of the electrode array surface after 50h in pH buffer solution at −680 mV and the associated surface profilometry results are presented in Fig. 9. Outside the crevice, most electrodes presented signs of generalized corrosion. One electrode in particular (indicated in Figs. 9a and 9b) presented a renewed surface with no signs of the polishing marks that could still be observed on the rest of the electrodes. Within the crevice, corrosion products were observed at the 3rd row of electrodes, around the edges of the electrode array and in the centre of the array, changing from left to right with increasing electrode row numbers. After corrosion products were removed, corrosion signs within the crevice were less evident, especially at the centre of the array. Surface profilometry measurements indicated metal losses of about 0.4 μm at electrodes outside the crevice, and metal losses lower than 0.13 μm inside the crevice.
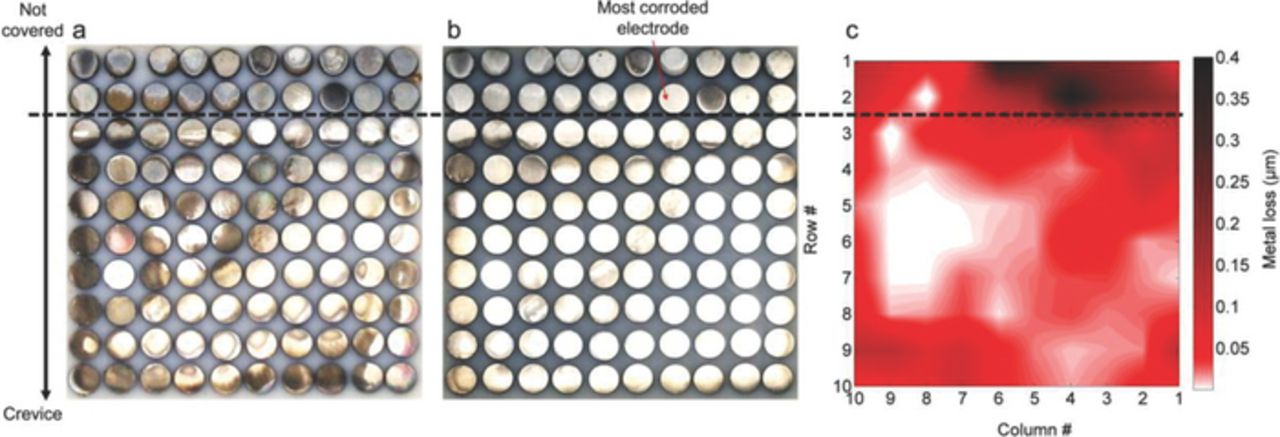
Figure 9. Condition of the sensor's array surface after 50h immersion in pH 7.8 buffer solution with CP (−680 mVAg/AgCl). Surface before corrosion products removal (a), surface after corrosion products removal (b) and Surface profilometry results (c).
Fig. 10 presents the result of the summation of the currents measured for each current density map for all three experimental conditions. As expected, the resultant current for each current map in the OCP case was zero. In the cases where the DAS was subjected to potentiostatic CP, despite presenting significant oscillations, the total current supplied to the DAS was cathodic at any given moment throughout the tests.
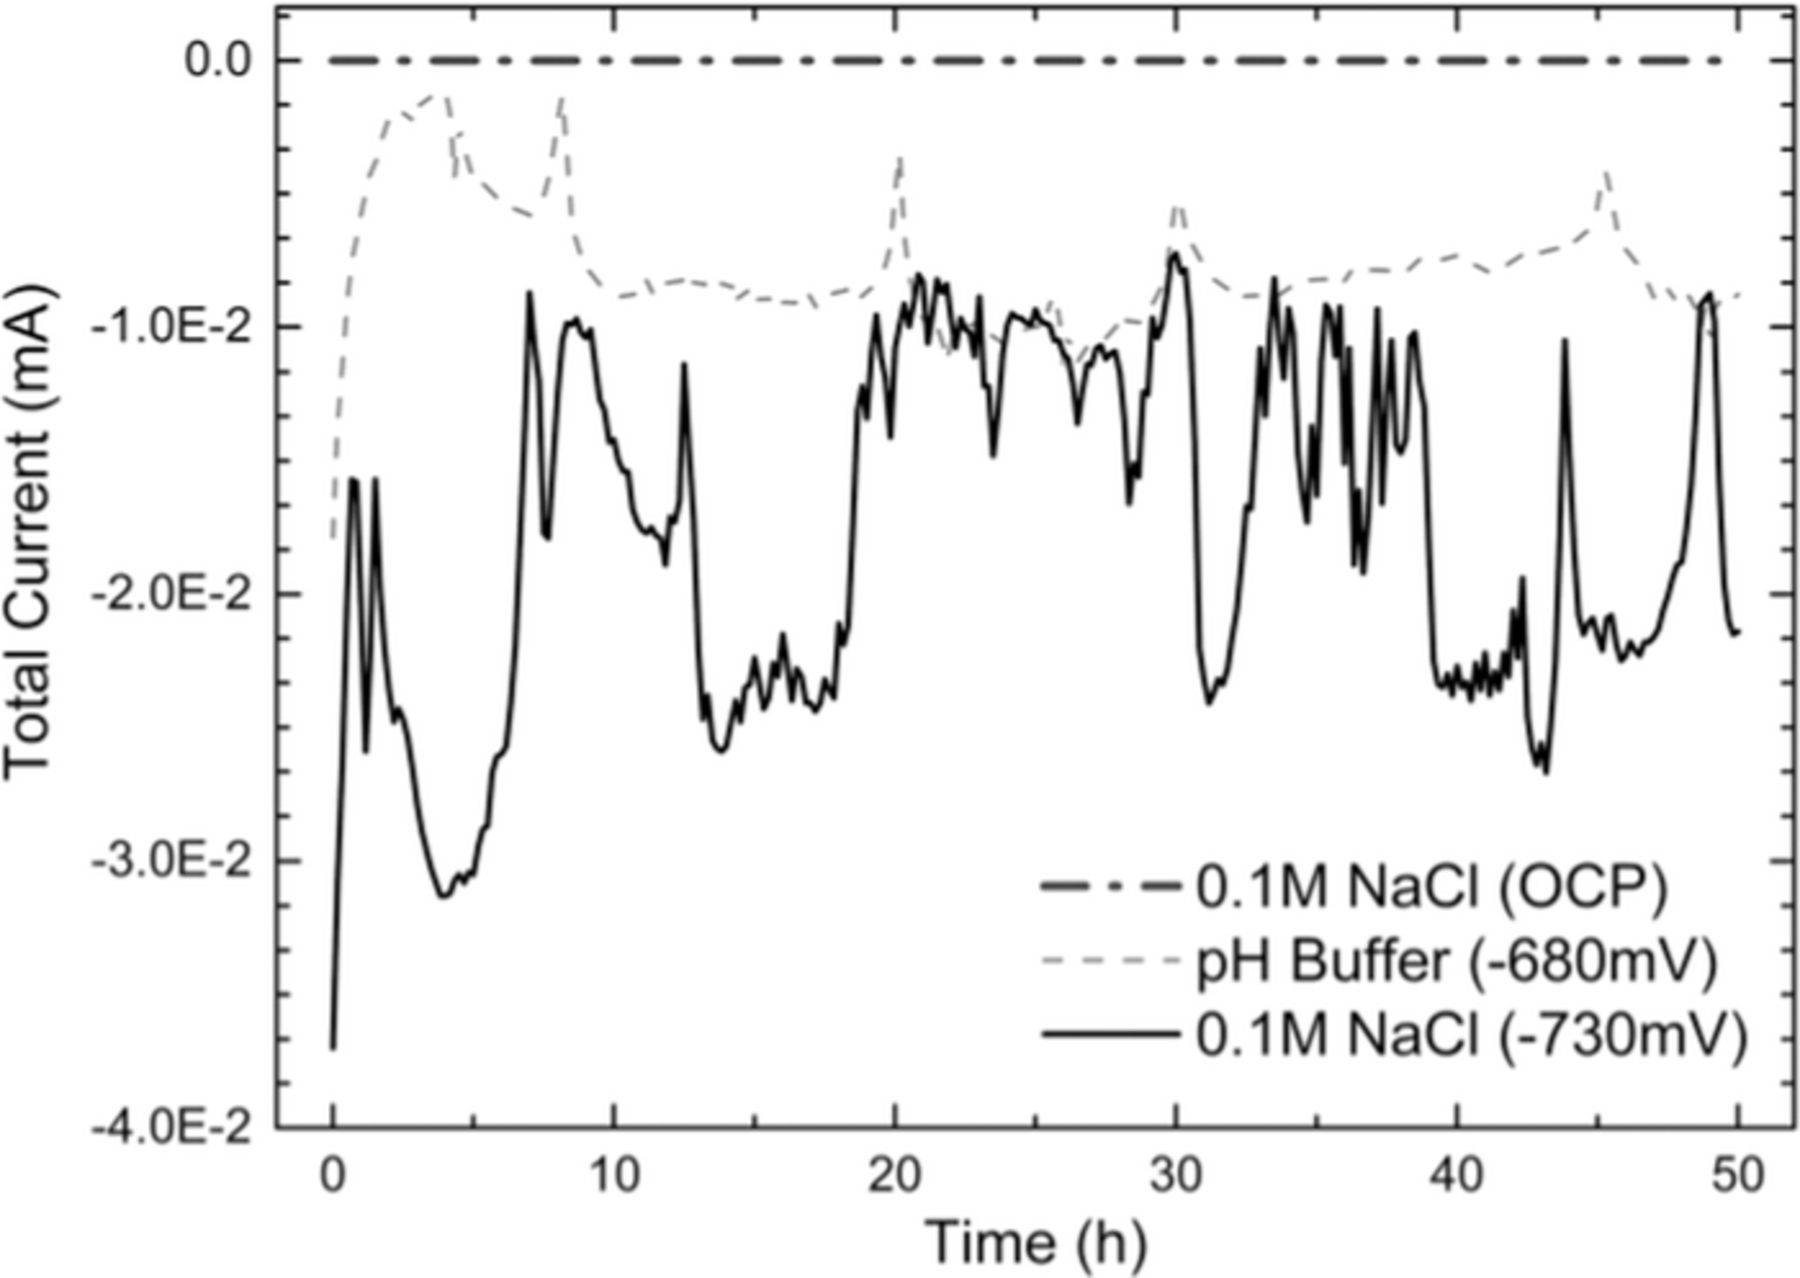
Figure 10. Total current supplied to the DAS.
Discussion
The current density distribution maps obtained under both OCP (Fig. 4) and CP (Figs. 5 and 6) conditions are in general agreement with previous research findings reported in the literature.10,11,15,17,23 For instance, in all cases the cathodic currents registered inside the crevice presented a rapid decrease at the beginning of the test. This decrease in cathodic current can be associated to a decrease in dissolved oxygen concentration within the crevice. The oxygen concentration within disbonded coatings was studied by many researchers12–14,17,18,22,32 and found to decrease until reaching virtually zero concentrations, independent of the CP potential applied.
In the OCP case, the current distribution profile along the crevice measured at the beginning of the test agrees with Song's model, which predicts the formation of cathodes outside and anodes inside the crevice area.17 However, Song's model is unable to predict the further development of corrosion. As shown in Fig. 4 (04 h 00 min), anodes started to grow outside the crevice area. This is understandable since carbon steel does not develop a passive film at neutral pH, and consequently the anode could move outside the crevice where the solution path resistance between anodes and the main cathode would be minimized.
In both cases where CP was applied, potentials were less negative than the iron immune potential, thus CP was not able to completely prevent corrosion but to reduce its rate. The fact that more corrosion was observed outside than inside the crevice might be counterintuitive. Particularly in the NaCl solution case where the CP potential applied was the industrially accepted −730 mVAg/AgCl (−850 mV vs copper/copper sulfate reference electrode), at which little corrosion might be expected. However, this CP potential criteria refers to steel buried in soil where a high pH could develop. In aqueous solutions, outside the crevice, the open geometry and natural convection of the solution would have made the alkali produced by the cathodic reactions diffuse from the negatively polarized steel surface, preventing the pH from increasing sufficiently to induce passivation of the steel. Within the crevice, the alkali produced by consumption of the oxygen initially available remained mostly in the crevice, since the diffusion would be more restricted in such a confined geometry and diffusion would be against any potential gradient produced by CP shielding. Consequently a high pH environment (pH 11) was developed by the end of the test in this area. The development of this high pH environment within the crevice is in agreement with previous research using neutral salt solutions.12,18 This suggests that, although CP potentials within the crevice could have been less negative due to IR drop effects, the higher pH and passivity made the area within the crevice less susceptible to corrosion. In the buffer solution case, a less negative CP potential was applied and pH changes were controlled by the solution, consequently, higher corrosion rates were developed inside and outside the crevice.
The current density profiles found under CP were also, in general, similar to those previously reported in the literature.10,11,15,23 Large cathodic currents were present outside the crevice and up to the 3rd row of electrodes, presumably since oxygen from the bulk solution is able to readily diffuse there.17,32 Within the crevice areas, cathodic current values were significantly lower and anodic currents were also detected. Anodic currents within crevices under CP have rarely been detected or reported by other researchers.10,15,23 The distribution of anodic currents is important for predicting the pattern of localized corrosion occurring under disbonded coatings, and the worst case localized corrosion rate. For critical structures such as a gas pipeline, the worst case localized corrosion rate would be a critical parameter for providing warning of failure risks. The anodic currents and their distribution shown in Fig. 5 and Fig. 6 can be explained based on the theory described below.
Calculation of metal loss distribution based of Faraday's Law
Consider an electrochemically coupled electrode array (e.g. WBE,36–41 CMAS42 or any other10,15,23) exposed to an electrolyte at OCP. In order to satisfy the principle of conservation of charge, the summation of the net current measured at all the electrodes must equal zero. Discriminating the anodic component ((ia)j) from the cathodic component ((ic)j) at each j-electrode, the conservation of charge for a n-electrodes array can be expressed by Eq. 1.
![Equation ([1])](https://content.cld.iop.org/journals/1945-7111/162/10/C515/revision1/jes_162_10_C515eqn1.jpg)
Since the electrodes in the array are electrochemically coupled, they can interact with each other. In other words, Eq. 1 does not necessarily imply that the anodic and cathodic current components at each electrode must be equal (Eq. 2).
![Equation ([2])](https://content.cld.iop.org/journals/1945-7111/162/10/C515/revision1/jes_162_10_C515eqn2.jpg)
In fact, if Eq. 2 were the only way to satisfy Eq. 1, the net currents measured at each electrode would be zero and the electrode array would not be capable of providing information regarding current distributions. Although Eq. 2 satisfies the principle of conservation of charge, it only represents the particular cases where the corrosion cells at each electrode operate isolated from each other. The results obtained when the DAS was exposed at OCP agree with this theory. While the total net current flowing in or out the array was constantly zero (Fig. 10), the current distribution maps (Fig. 4) indicated predominantly cathodic and anodic areas across the array surface.
When the electrode array is being cathodically polarized, independent of whether under potentiostatic or galvanostatic control, the net current resulting from all cathodic and anodic reactions on the array, must be cathodic. This condition is mathematically expressed in Eq. 3.
![Equation ([3])](https://content.cld.iop.org/journals/1945-7111/162/10/C515/revision1/jes_162_10_C515eqn3.jpg)
Similarly to the OCP case, the possible electrochemical interaction between electrodes in the array implies that (Eq. 4) is a sufficient but not necessary condition to satisfy (Eq. 3).
![Equation ([4])](https://content.cld.iop.org/journals/1945-7111/162/10/C515/revision1/jes_162_10_C515eqn4.jpg)
In other words, despite the whole array being cathodically polarized, some electrodes could still present a net anodic current. Whether a particular electrode will present a net anodic or cathodic current depends upon the balance between anodic and cathodic reactions occurring at its surface. The DAS takes advantage of this, by controlling the distribution of cathodic reactions which allows the detection of anodic currents at the simulated disbonded coating area.
As shown in Fig. 3, under both experimental conditions where CP was applied, oxygen reduction was the main cathodic reaction. However, it is known from previous experimental12,13,18 and theoretical analyses14,17,22,32 that oxygen concentration is not constant across a crevice formed beneath disbonded coatings. According to the Chin32 and Song17,22 models, dissolved oxygen should be totally depleted under the disbonded coatings at a distance equivalent to four crevice gaps in the steady state. This suggests that along disbonded coatings, there are two distinctive scenarios based on the accessibility to oxygen. A schematic Evan's Diagram illustrating the corrosion in the bulk solution case, representative of the area outside the crevice, is presented in Fig. 11a. In this figure, the anodic curve (in dashed lines) is a generic representation. For the discussion to follow, the only value of relevance in this curve is the anodic current density at the applied CP potential (ia). Outside the crevice, even though ECP is less negative than the iron dissolution equilibrium potential and metal dissolution indeed occurred, the recoded current density values at this location were rarely anodic. This is because the difference between small anodic currents (ia) and the larger cathodic currents (ilim.1), results in net cathodic currents being measured at these electrodes (iM1). This not only explains why the sensor was unable to detect anodic currents outside the crevice, but also why no anodic currents were detected deep inside the crevice at the beginning of the test when sufficient oxygen still existed, i.e., even though anodic reactions still occur, the cathodic reactions dominate. However, deep inside the crevice, as the reactions proceed and the oxygen concentration decreases below a certain level, the situation changes considerably. This condition is represented by an Evans Diagram shown in Fig. 11b. In an extreme case, this lower oxygen limiting current (ilim.2) could reach negligible values in the steady state. Consequently, the difference between ia and ilim.2 would be iM2 (almost equal to ia) providing a way to evaluate anodic currents within the crevice and thus the localized corrosion rates. Depending on the IR drop produced along the crevice, the local potential can change (due to cathodic shielding), but since the method does not require knowledge of the local potentials, this does not affect the measurement process.
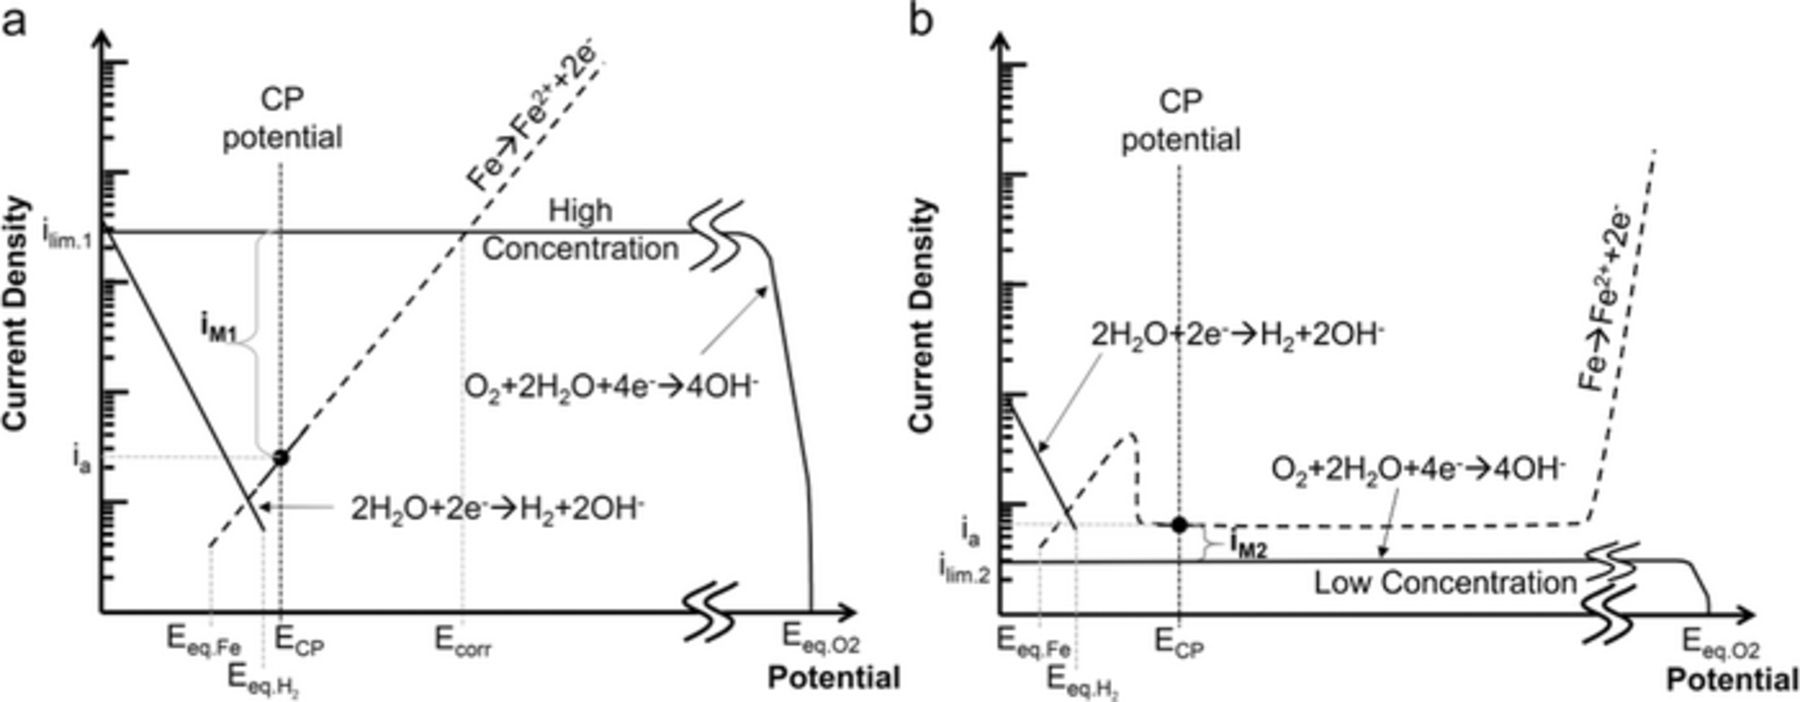
Figure 11. Schematic Evan's diagrams of typical environments developed along the sensors surface. Outside the crevice (a) Inside the crevice (b).
The accumulated charge of the anodic current densities that were measured throughout the course of an experiment were used to calculate the metal loss distributions by means of Faraday's Law. Fig. 12 presents the results of these calculations for all experimental conditions and the same surface profilometry results shown in Figs. 5c, 6c and 7c re-scaled to allow an easier comparison with the electrochemical results.
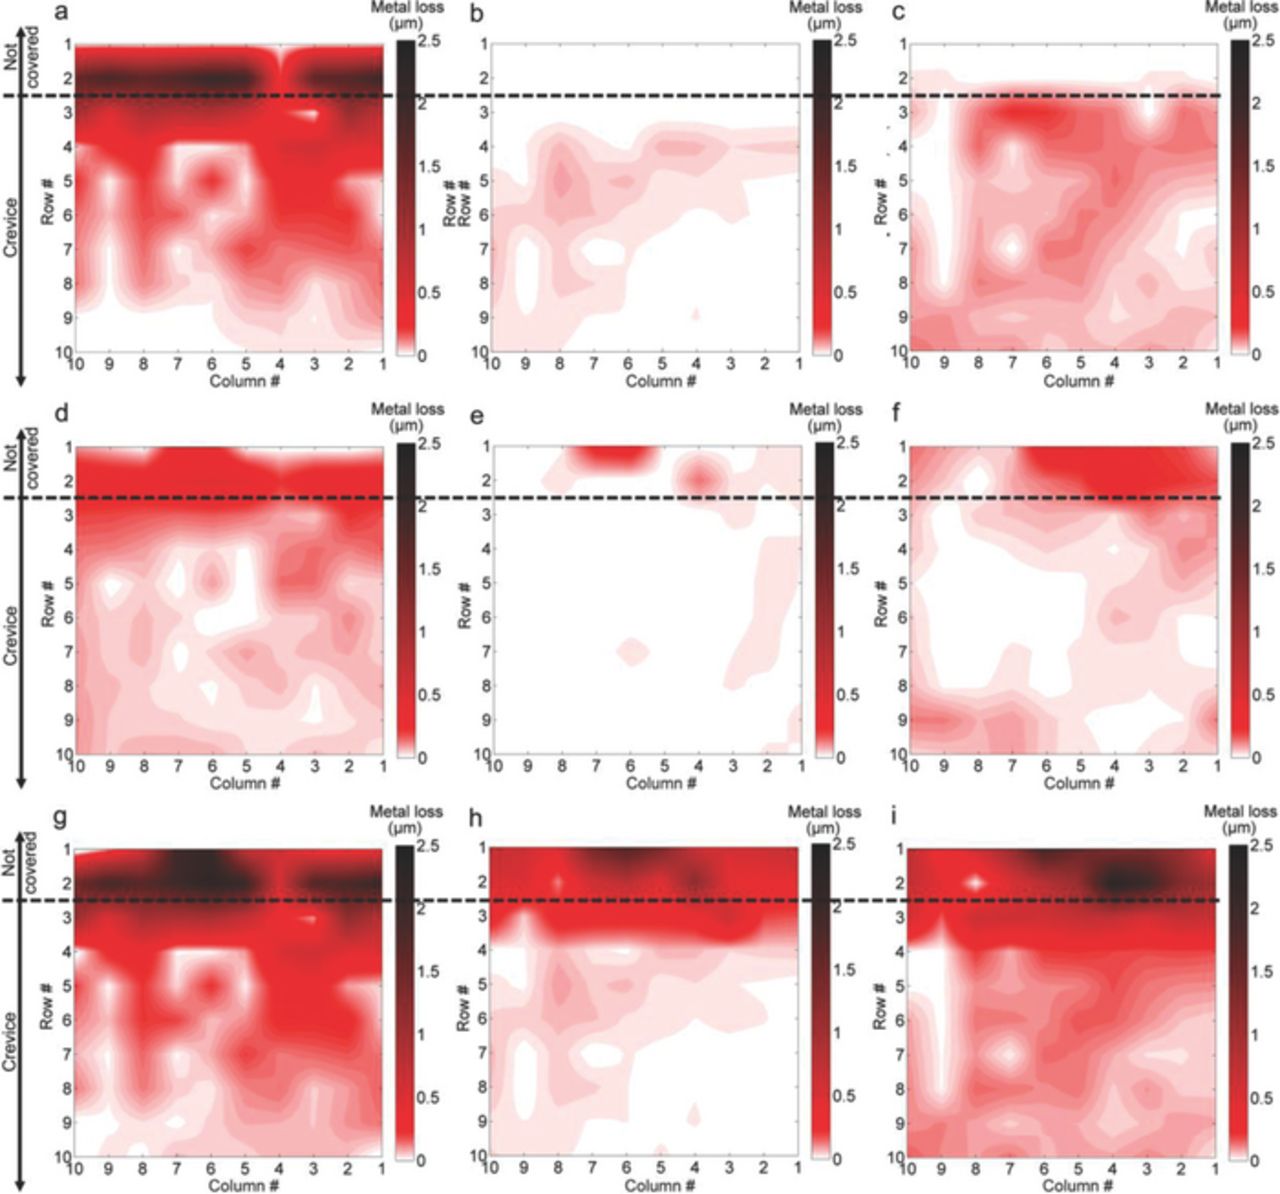
Figure 12. Metal loss maps calculated based on Faraday's Law. 0.1 M NaCl at OCP (a), 0.1 M NaCl with CP (−730 mVAg/AgCl) (b) and pH 7.8 buffer with CP (−680 mVAg/AgCl) (c). Re-scaled surface profilometry results. 0.1 M NaCl at OCP (d), 0.1M NaCl with CP (−730 mVAg/AgCl) (e) and pH 7.8 buffer with CP (−680 mVAg/AgCl) (f). Metal loss maps calculated based on the corrected currents method. 0.1M NaCl at OCP (g), 0.1M NaCl with CP (−730 mVAg/AgCl) (h) and pH 7.8 buffer with CP (−680 mVAg/AgCl) (i).
When comparing the metal loss distribution from Faraday's law found for the OCP case (Fig. 12a) with the corresponding surface profilometry results (Fig. 12d), a high correlation in the distribution of the attack was found inside and outside the crevice area. On the other hand, the metal losses measured electrochemically for the test performed under CP in NaCl solution (Fig. 12b) did not show an obvious correlation with the corresponding surface profilometry results (Fig. 12e). Despite the fact that most of the corrosion damage was observed outside the crevice, no corrosion was detected electrochemically at this location. Inside the crevice, although a certain correlation was observed between the corrosion pattern measured electrochemically (Fig. 12b) and the corrosion products found on the array surface (Fig. 9a), the corresponding surface profilometry results (Fig. 12e) did not present the same pattern. This is likely due to the very small metal losses produced under these experimental conations and the uncertainties associated with surface profilometry measurements. When the DAS was exposed in pH buffer solution at a less negative CP potential, where significantly more corrosion was produced within the crevice, a better correlation in metal loss distribution was obtained between electrochemically calculated (Fig. 12c) and profilometry results (Fig 12f) at that location. Outside the crevice, in the same way as for the NaCl case under CP, no corrosion was detected electrochemically although the most severe corrosion attack was found at this area. Outside the crevice, the predominance of cathodic currents drives Faraday's Law based calculations to falsely indicate that almost no corrosion is taking place. This important limitation on the direct application of Faraday's Law to current density maps recorded under CP is addressed in the discussion below.
Calculation of metal loss distribution based on the "corrected currents method"
Based on the previously described theoretical framework and our recently published data analysis method,46 a technique to estimate the corrosion damage outside the crevice can also be developed. Fig. 13 considers the case where cathodic reactions are greater than anodic reactions (as in Fig. 11a), but takes into account two different electrodes with the same cathodic but different anodic behavior. Differences in anodic behavior between electrodes in the same row can be expected due to the complex microstructure of commercial carbon steels and the very heterogeneous conditions developed under disbonded coatings. In Fig. 13 the currents measured by both electrodes are cathodic (iM1 and iM1'), but present different magnitudes. In fact, the larger the cathodic current measured, the lower the anodic current at that electrode. Consequently, if the largest cathodic current measured is taken as a 'baseline', then the difference between this value and the current measured on any other electrode, with the same access to oxygen, could be used as an estimation of the anodic component at this second electrode (iest = iM1-iM1'). Iest is considered the corrected anodic current value for that second electrode.
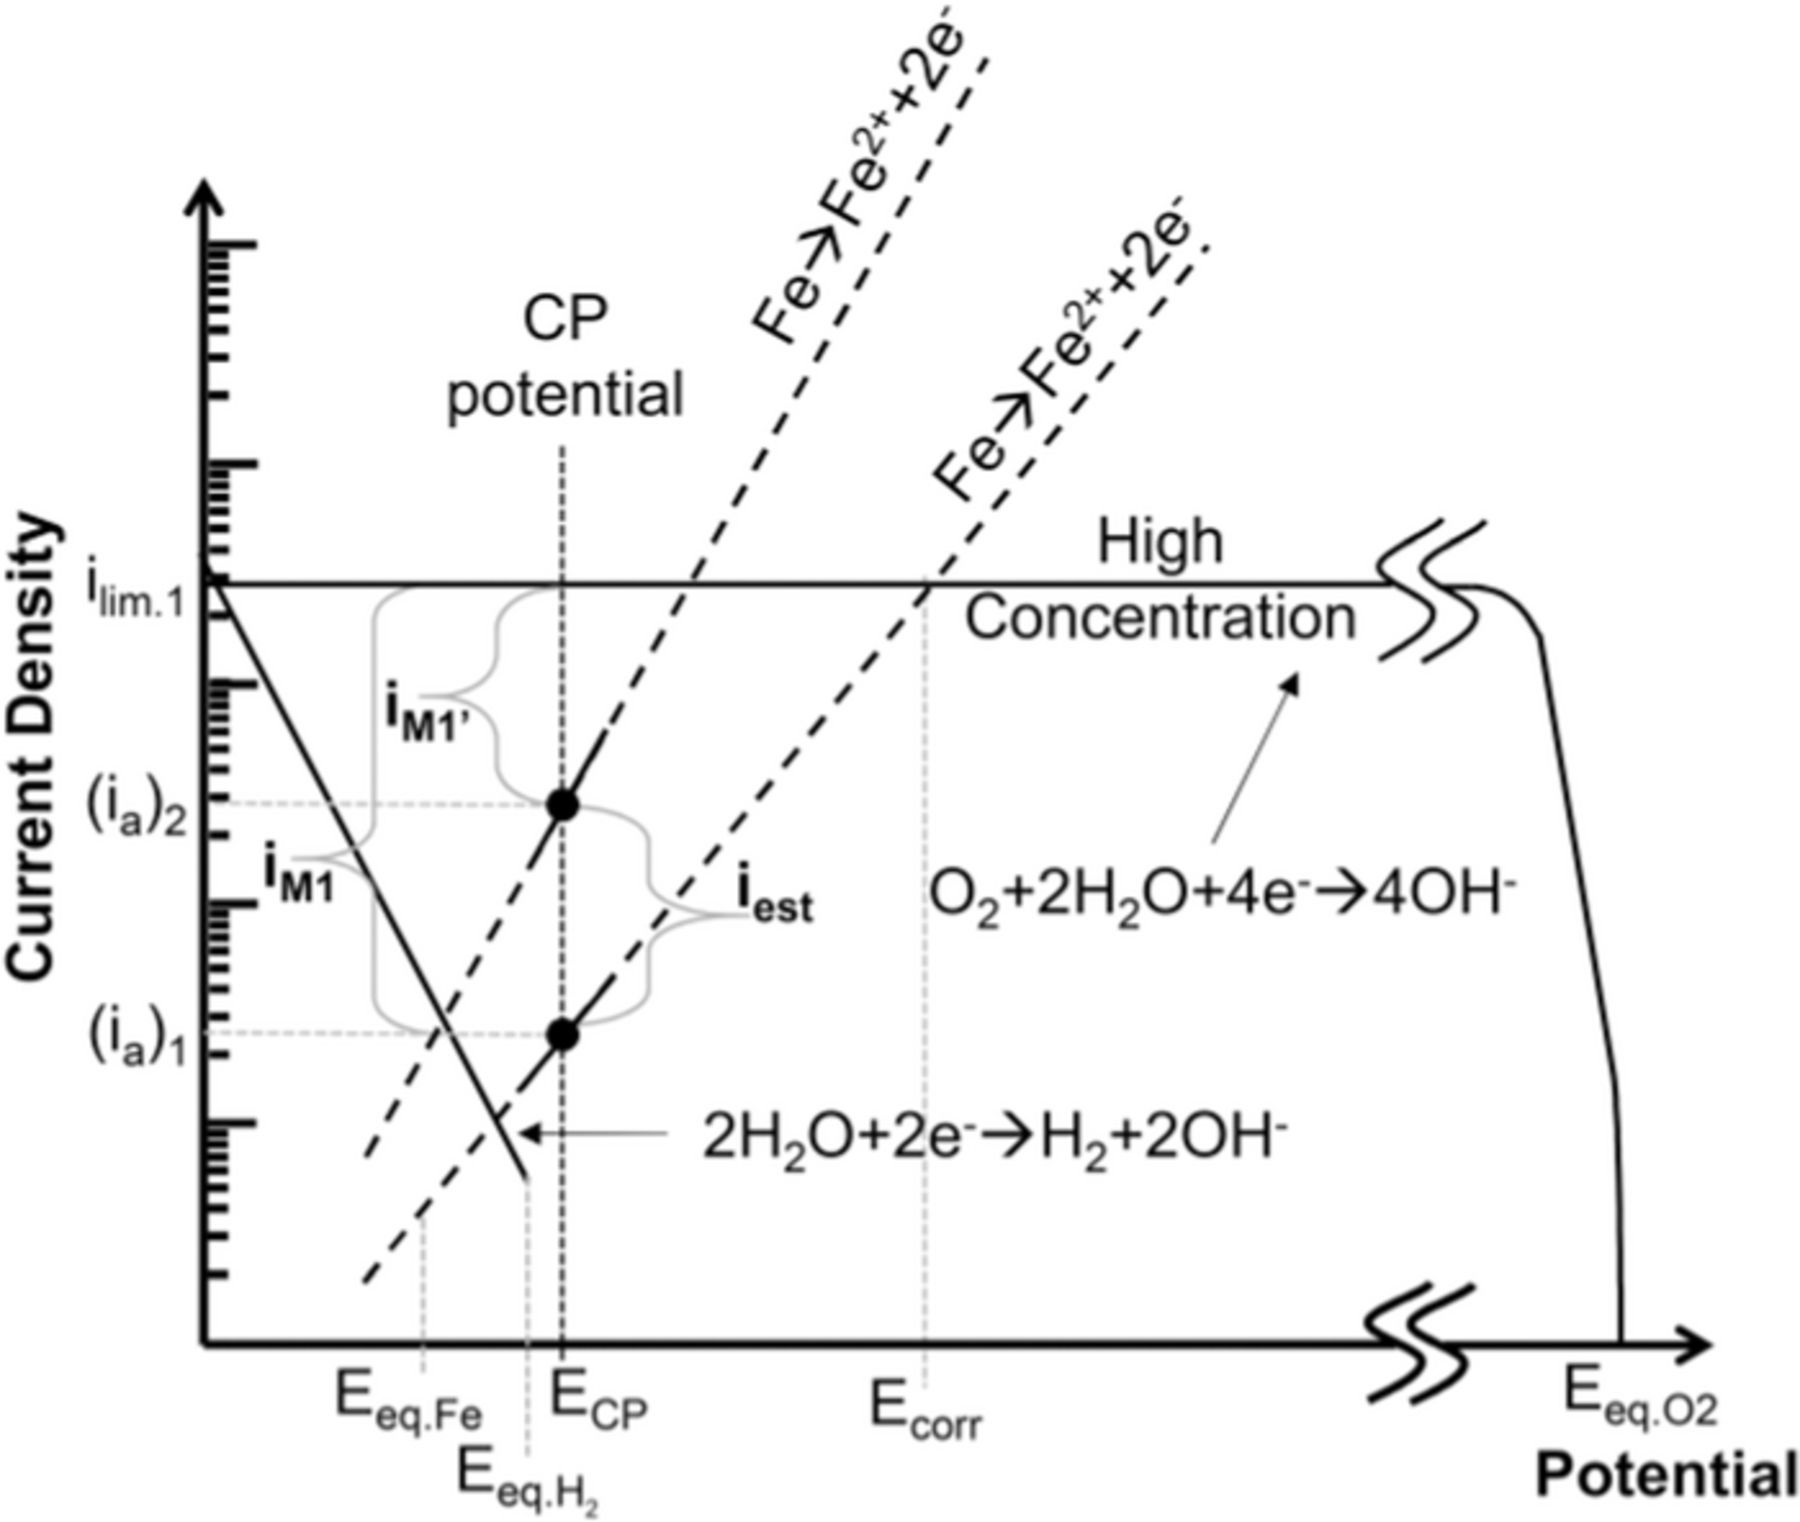
Figure 13. Schematic Evan's diagrams illustrating the corrected currents method.
A critical step in the implementation of this method to the DAS, is to determine which electrodes are comparable. As mentioned before, this method is only applicable between electrodes with the same cathodic reaction rates. This is not generally the case across the sensors surface, but taking advantage of the geometry of oxygen diffusion along this uniform gap crevice, it is acceptable to assume that oxygen has the same access to all the electrodes in the same row. As shown in Fig. 3, in all experimental conditions the main cathodic reaction was diffusion controlled. Under these conditions, the oxygen limiting current would only depend on the oxygen accessibility and not on variables such as pH and potential, providing a stable baseline for comparison. An exception needs to be considered for the electrodes at the extreme ends of each row, where a small gap left between the rubber seal and array surface would have provided an extra solution volume with additional oxygen, producing the abnormally large cathodic currents observed in Figs. 5 and 6.
Nonetheless, this method implicitly assumes, by taking the electrode with the largest cathodic current as the baseline, that the anodic current component at this electrode is zero. Although in the general case this assumption is not always satisfied, it can be demonstrated (demonstration presented in Appendix) that for a row of electrodes presenting a cathodic or zero total net current, the method always produces an equally or more accurate corrosion estimation than the direct application of Faraday's Law to the anodic current density values measured by the array. However, when the total net current flowing through the analyzed row of electrodes is anodic, the 'corrected currents' method could lead to a larger underestimation of corrosion than that produced by Faraday's Law.
Despite the fact that the DAS was tested under CP and at OCP conditions, cases of anodic total net current for a given row of electrodes were commonly observed. In order to avoid the cases where corrected currents would lead to a larger underestimation of corrosion compared with the direct application of Faraday's Law, the corrected currents calculation method compares the corrected currents with the anodic values at each electrode as follows.
First, for each current map, the largest cathodic current measured for each electrode row (except those at the extreme ends of each row) are identified as 'baseline' values. Then, the differences between the currents registered at other electrodes and the baseline corresponding to its row are computed as the preliminary corrected currents, for that current map. These corrected currents are then compared against the measured current at each electrode. If the value estimated by the corrected currents method is lower than the anodic value measured by the electrode, the value estimated by the corrected currents is replaced by the measured value. Finally, the accumulated charge from all current maps is used to calculate the corrosion damage based on Faraday's Law.
The metal loss maps calculated with the 'corrected currents' method are presented in Figs. 12g to 12i. In the OCP case (Fig. 12g), the method outperformed the direct application of Faraday's Law (Fig. 12a), presenting an improved correlation with the corrosion pattern observed over the electrode array in the first row of electrodes (Fig. 7). The observed differences between Figs. 12a and 12g indicate that this method may successfully estimate the anodic component at electrodes where cathodic currents are dominant. When this calculation method was applied to the current maps obtained under CP (Figs. 12h and 12i), the resultant metal loss maps showed a good correlation with the corrosion patterns observed outside the crevice (Figs. 8 and 9) in both cases. Within the crevice, the differences between metal losses predicted by this method and the direct application of Faraday's Law (Figs. 12a to 12c), were smaller. This suggests that cathodic current components at this location were small.
The proposed working principle of the DAS not only provides a reasonable explanation of the experimental observations, but also the opportunity to anticipate some of its limitations. For instance, one may expect that anodic currents component can only be directly measured under a disbonded coating when other cathodic reactions, besides oxygen reduction, are negligible. This may not generally be the case, oxygen and other oxidizing species could permeate through the coating, or if the system does not allow the pH to increase, water reduction rate could become significant at any location within the crevice. The corrected currents method could still be applicable in the cases where oxidizing species permeate through the coating because the transport of species would still be described as a two dimensional (2D) diffusion problem (simple geometry crevices), and the resultant cathodic reactions should still occur at the same rate over all electrodes in the same row. Due to the crevice geometry, similar local potentials could be expected for electrodes in the same row, and this could provide the basis to extend the corrected currents method to most activation controlled reactions. However, the case for water reduction would be different. Because not only is this reaction pH dependant, but also it produces H2 bubbles that would affect the local potential of each electrode within the same row in an unpredictable way. Thus, the corrected currents method would not be applicable in this case.
The current distributions measured by the electrode array when H2 evolves at a significant rate could still assist in the estimation of corrosion. At locations near the crevice opening, where CP effectively polarizes the steel, the large cathodic currents would most likely conceal any anodic current component and corrosion would be undetected. However, sufficiently deep into the crevice, where CP is completely shielded, the overall cathodic reaction rate must be equal to the overall anodic reaction rate. At this location, the electrode array would be able to measure the imbalance between the anodic and cathodic current components at each electrode. The evaluation of these hypotheses requires an extensive redesign of our experimental setup and will be subject of further research.
The installation of the sensors presented in this work would be similar to that of the CP coupons commonly used to monitor OFF-potentials.48,49 The DAS would be permanently buried next to the pipeline at areas of high corrosion susceptibility and an electrical connection between the pipeline and the WE1 terminal (Fig. 2) would be required to maintain the sensor under CP.
Conclusions
- A new corrosion monitoring sensor was introduced. This sensor physically simulates a disbonded coating and uses an electrode array to measure the distribution beneath that disbonded coating.
- The sensor's ability to detect anodic currents under CP was explained based on the oxygen depletion expected under simulated disbonded coatings.
- Current density maps measured with and without applied CP generally agree with the literature. In the cathodically protected case however, anodic currents were more consistently found than in previous reports, presumably due to the smaller gap size and lower CP potential used.
- Corrosion patterns were estimated based on the current density distributions from two different methods. The acceptable level of correlation with the corrosion damage observed at the array surface at the end of the tests suggests that the DAS has the potential to monitor localized corrosion under disbonded coatings.
- Results based on the second calculation method generally showed a correlation with the corrosion patterns observed outside the crevice, even under CP. This suggests that we have developed a method which is capable of estimating the anodic corrosion current component even at electrodes where cathodic currents are dominant.
Acknowledgments
The authors wish to thank Prof. Bruce R. W. Hinton for his experienced advice, support and comments on the manuscript.
This work was funded by the Energy Pipelines CRC, supported through the Australian Government's Cooperative Research Centres Program. The funding and in-kind support from the APIA RSC is gratefully acknowledged.
: Appendix
Given that the current density measured at each electrode (iM) is the algebraic sum of its anodic (ia) and cathodic (ic) current density components, and that the cathodic current density at each electrode is determined by the oxygen limiting current (ilim), it can be determined that the direct application of Faraday's Law underestimates the anodic component at each electrode by ilim (Eq. A2).
![Equation ([A1])](https://content.cld.iop.org/journals/1945-7111/162/10/C515/revision1/jes_162_10_C515eqn5.jpg)
![Equation ([A2])](https://content.cld.iop.org/journals/1945-7111/162/10/C515/revision1/jes_162_10_C515eqn6.jpg)
To calculate the maximum error introduced on the current corrections by a non-zero anodic current value at the baseline electrode, let us consider a row containing n-electrodes where the electrode presenting the lowest iM is selected as the baseline for that row. The total net current of that row of electrodes (itotal) can be expressed by Eq. A3.
![Equation ([A3])](https://content.cld.iop.org/journals/1945-7111/162/10/C515/revision1/jes_162_10_C515eqn7.jpg)
The net current measured at the baseline electrode (ibaseline) can be expressed by Eq. A4 where ilim and ierror are the cathodic and anodic current components at the baseline electrode respectively.
![Equation ([A4])](https://content.cld.iop.org/journals/1945-7111/162/10/C515/revision1/jes_162_10_C515eqn8.jpg)
Using Eq. A4, ibaseline can be removed from the summation in Eq. A3.
![Equation ([A5])](https://content.cld.iop.org/journals/1945-7111/162/10/C515/revision1/jes_162_10_C515eqn9.jpg)
Since the cathodic reaction is diffusion controlled and all the electrodes on the same row share the same access to oxygen, (ic)j = ilim ∀ j. Therefore,
![Equation ([A6])](https://content.cld.iop.org/journals/1945-7111/162/10/C515/revision1/jes_162_10_C515eqn10.jpg)
Subtracting and adding ierror from each term in the summation, the previous equation can be rewritten as Eq. A9.
![Equation ([A7])](https://content.cld.iop.org/journals/1945-7111/162/10/C515/revision1/jes_162_10_C515eqn11.jpg)
![Equation ([A8])](https://content.cld.iop.org/journals/1945-7111/162/10/C515/revision1/jes_162_10_C515eqn12.jpg)
![Equation ([A9])](https://content.cld.iop.org/journals/1945-7111/162/10/C515/revision1/jes_162_10_C515eqn13.jpg)
Eq. A9 indicates that for a given set of itotal and ilim values, the larger ierror, the lower the result of summation must be. On the other hand, given that the baseline electrode has the lowest anodic component of all the electrodes in the row, the left side of Eq. A9 must always be zero or positive.
![Equation ([A10])](https://content.cld.iop.org/journals/1945-7111/162/10/C515/revision1/jes_162_10_C515eqn14.jpg)
This suggests that the maximum value for ierror (ierror.max) can be calculated by equalling the left side of Eq. A9 to zero.
![Equation ([A11])](https://content.cld.iop.org/journals/1945-7111/162/10/C515/revision1/jes_162_10_C515eqn15.jpg)
![Equation ([A12])](https://content.cld.iop.org/journals/1945-7111/162/10/C515/revision1/jes_162_10_C515eqn16.jpg)
Using Eq. A3 to replace itotal, Eq. A12 can be expressed as:
![Equation ([A13])](https://content.cld.iop.org/journals/1945-7111/162/10/C515/revision1/jes_162_10_C515eqn17.jpg)
![Equation ([A14])](https://content.cld.iop.org/journals/1945-7111/162/10/C515/revision1/jes_162_10_C515eqn18.jpg)
![Equation ([A15])](https://content.cld.iop.org/journals/1945-7111/162/10/C515/revision1/jes_162_10_C515eqn19.jpg)
Eq. A15 indicates that the maximum error produced is equal to the average of all (ia)j in that row. In addition, since ierror is also the minimum of all (ia)j, it can be concluded that ierror will be maximum only when all the anodic components (ia) are equal to each other. To compare the error produced by the corrected currents and the error produced by direct application of Faraday's Law, each member of Eq. A3 should be divided by the number of electrodes in the row.
![Equation ([A16])](https://content.cld.iop.org/journals/1945-7111/162/10/C515/revision1/jes_162_10_C515eqn20.jpg)
![Equation ([A17])](https://content.cld.iop.org/journals/1945-7111/162/10/C515/revision1/jes_162_10_C515eqn21.jpg)
For the cases where itotal is cathodic (negative), Eq. A17 is:
![Equation ([A18])](https://content.cld.iop.org/journals/1945-7111/162/10/C515/revision1/jes_162_10_C515eqn22.jpg)
![Equation ([A19])](https://content.cld.iop.org/journals/1945-7111/162/10/C515/revision1/jes_162_10_C515eqn23.jpg)
Eq. A19 indicates that, when itotal is cathodic, the maximum error associated with the corrected currents is lower than ilim, which is the error associated with Faraday's Law based calculations.
Following the same approach it can also be found that when itotal is zero or anodic, ierror.max must be equal or more than ilim, respectively. Therefore, the corrected currents can produce a better or equal corrosion estimation than the direct application of Faraday's Law providing that itotal for that row of electrodes is cathodic or zero. When itotal is anodic and all the anodic components of the electrodes in that row are sufficiently similar, then the 'corrected currents' method leads to a larger underestimation of corrosion than that produced by Faraday's Law.