Abstract
A SiO2/C composite was obtained by modifying biomass rice husk ash (RHA) with ball milling, followed by mixing with coal tar electrode pitch (CTEP) and pyrolyzing under high temperature. The modified SiO2/C material gained a significant improvement in electrochemical performance, including cycle performance, initial Coulombic efficiency (ICE) and electrical impedance. Meanwhile, it maintained a good reversible specific capacity of 404 mA h g−1 over 500 cycles at the current density of 0.25 C. Therefore, the modification method provides a potential for offsetting defects and promoting electrochemical performance of biomass-based anode materials of lithium ion batteries (LIBs).
Export citation and abstract BibTeX RIS
Lithium ion batteries (LIBs) have become an important part in modern energy storage systems due to their high energy density and long cycle life. Because of the demand for some portable electronic devices, LIBs have attracted great attention of research groups these years.1–4 Due to the high Coulombic efficiency and excellent cycle performance, graphite has been widely used as the commercial anode material of LIBs for several decades. However, the theoretical specific capacity of graphite is only 372 mA h g−1 (by forming intercalation compounds (LiC6)),5 which cannot meet the demands of high power batteries. Therefore, it is necessary to seek for another material as anode of LIBs, which has high specific capacity and moderate price.6
Biomass-derived materials have been investigated as anode for LIBs with high capacity and good capacity retention.7–9 Among the biomass-derived materials, rice husk (RH) is undoubtedly a productive and cheap material with a worldwide annual production of more than 100 million tons.10 The main components of RH include silicate, lignin, cellulose, and hemicellulose. After pyrolysis, a composite material with silica and amorphous carbon was obtained from RH. Silica showed a specific capacity of 1965 mA h g−1,11 which is 5 times higher than that of graphite. However, the application of silica in LIBs was limited because of its inactive electrochemical performance and poor conductivity.12 The carbon in the composite material may improve the performances of silica. Wang et al.13 calcinated RH into rice husk ash (RHA) at 900°C under inert atmosphere, and the obtained composite was used as anode material of LIBs. At a current density of 0.04 C, the discharge specific capacity of the first cycle showed up to 611 mA h g−1, but the initial Coulombic efficiency (ICE) was only 50%. This may be caused by the side reaction of SiO2 as well as the parasitic reaction of electrolyte reduction, leading to the formation of solid electrolyte interphase (SEI) film. Moreover, the observed poor cycle performance may be caused by the unstable connections of the composite materials. Therefore, it is still a challenge to improve the electrochemical performance of RH-based anode material.
Coal tar electrode pitch (CTEP) was used in traditional technology, which promoted the electrochemical performance of various electrode materials, such as graphite and silicon.6,7,14 CTEP melts and becomes sticky at about 105°C, and it can permeate the cracks of materials acting like a binder. Amorphous carbon is formed during the pyrolysis of CTEP at high temperature, which can fix the construction of SiO2/C composite and prevent it from collapsing during cycling of LIBs. Meanwhile, CTEP fills the cracks and partial large pores on the surface of the bulk material to reduce its specific surface area, which could reduce the formation of SEI film and improve ICE.14–16 Yang et al.17 and Wen et al.18 modified silicon with CTEP and graphite, and the performances of lithium-ion batteries were improved, such as impedance, ICE and cycle stability. Wang et al.19 coated silicon anode with pyrolytic carbon of CTEP, which retained the specific capacity of LIBs up to 71.3% after 1000 cycles. Therefore, acting as a kind of binder, CTEP plays a critical role in promoting electrochemical performance of LIBs.
In this work, RHA after ball milling process was mixed with CTEP, and the mixture was pyrolyzed under high temperature. Theoretically, ball milling was aimed at eliminating the non-uniform carbon blocks, and distributing CTEP evenly. Meanwhile, the addition of pyrolytic carbon of CTEP can diminish the surface cracks and boost the composite structure, which could contribute for improving cycle performance and alleviating the problems of low ICE. The combination of cost-effective with simple method may have a huge promotion for RHA-based anode materials for LIBs.
Experimental
Preparation of CTEP-BM-RHA
3 g RHA (Kaiyu biomass new materials co., Ltd, Jilin, China) was loaded into the zirconia jar, containing 90 g zirconia balls with non-uniform size. The ball milling process was controlled at 800 rpm min−1 for 6 h. After ball milling, 0.5 g of the sample was dispersed into 250 mL ethanol by ultrasound for 30 min. Then 0.5 g CTEP (Chaolian new materials co., Ltd, Shandong, China) was added into the mixture followed by ultrasound for 30 min. Ethanol was then removed by distillation, and the obtained residue was dried in a vacuum oven at 100°C for 12 h. The residual black solid was heated in a quartz tube furnace at 120°C for 1 h and then heated to 850°C for 3 h under nitrogen with a heating rate of 5°C min−1, followed by cooling to room temperature naturally. The resulting product was obtained as CTEP-BM-RHA. BM-RHA was obtained without mixing CTEP and CTEP-RHA was obtained without ballmilling, which were both used as reference materials to compare the effect of CTEP and ball milling on the property of the obtained products.
Characterization
The morphologies of products were examined using a field emission scanning electron microscope (SEM, JSM-6700F, Japan) and transmission electron microscope (TEM, Tecnai G2 S-Twin F20, Netherlands). The structure was characterized by X-ray diffractometer using Cu Kα radiation (XRD, D/MAX2550, Japan) operated at 50 kV and 50 mA with a scanning speed of 5 degrees per minute. Raman spectra (INVIA, England) was collected from 100 to 3200 cm−1 with a He-Ne laser at the wavelength of 532 nm. The thermogravimetric analysis (TGA) was performed by using a TGA Q500 thermogravimetric analyzer with a heating rate of 10°C min−1 at air atmosphere. Nitrogen adsorption and desorption isotherms were obtained on an ASAP 2420 surface area analyzer at 77 K using the Brunauer–Emmett–Teller (BET) method.
Electrochemical measurements
The obtained materials were assembled into CR2025 coin cells as anode materials and the electrochemical measurements were carried out. The CR2025 coin cells were assembled in an argon-filled glove box by serving single-layer metal lithium foil as the counter electrode, Celgard 2500 separator as the separator, and 1 M LiPF6 in EC:EMC:DMC (1:1:1, v/v/v) as the electrolyte. Electrochemical measurements were carried out after setting aside for 10 h. The working electrode was fabricated by compressing a mixture of the active material (80 wt%), conductive material (acetylene black) (10 wt%), and binder (polyvinylidene fluoride) (10 wt%) onto a copper foil current collector, then dried at 80°C for 12 h. The composite anodes were punched into wafers with a diameter of 1.2 cm and active materials mass loading of 0.8–1.2 mg cm−2. Galvanostatic charge-discharge measurement was performed using a Neware CT-4008W battery test system from 0.01 to 3.0 V (vs. Li/Li+) at a current density of 0.05 C, 0.1 C and 0.25 C. The rate performance was tested at various current densities from 0.05 to 0.5 C and electrochemical impedance spectroscopy (EIS) was conducted at ambient temperature with CHI 760D electrochemical workstation, which was carried out at open circuit potential from 100 kHz to 0.01 Hz with an amplitude of 10 mV.
Results and Discussion
The XRD patterns are shown in Figure S1. All materials have the same peak positions with broad band at 23° and 44°, which indicate that substances in composite materials are amorphous and the addition of CTEP exerts no influence on the amorphous state of RHA. It is reported that there are different degrees of defects on the amorphous substances, which can provide active sites for Li+ to embed in, leading to increasing specific capacity.20,21
Figure 1a shows TG curves of all samples, which were heated under air atmosphere. A mass loss appears at around 100°C for all the samples, which is ascribed to the evaporation of water. An obvious weight loss occurred from 500°C, which indicates that carbon in materials reacted with oxygen in the air. The weight losses of RHA and BM-RHA are both about 62%. These are compared with 72% for CTEP-BM-RHA and 80% for CTEP-RHA, indicating that CTEP in CTEP-RHA decomposed less completely during the pyrolysis and CTEP-RHA contained higher amount of organic residue. This phenomenon may be attributed to the uneven size of the carbon in RHA, which resulted in the uneven dispersion and heating of CTEP.22 The carbon of CTEP-BM-RHA burned up completely at about 800°C, while the burnout temperature of the other three samples is about 100 degrees lower, which may be inferred that CTEP-BM-RHA possesses a higher binding energy and a better stability than the others. Figure 1b shows the Raman spectra from 100 cm−1 to 3200 cm−1. The peak of D-band at 1342–1353 cm−1 represents the lattice defect degree of carbon and the peak of G-band at 1590–1601 cm−1 represents the strength of stretching vibration of the carbon whose mode of hybridization is sp2. A higher value of R (R = Id/Ig) represents lower order degree of carbon in the material.22,23 R values of RHA and BM-RHA are calculated to be 0.866 and 0.889 respectively, as ball milling process could lead to a higher degree of disorder.11 Caused by the ball milling process and the addition of amorphous carbon, R values of CTEP-RHA and CTEP-BM-RHA are calculated to be 0.937 and 0.971, which indicate there is a higher concentration of defects and more active sites in CTEP-BM-RHA, increasing the storage capacity of anodes.
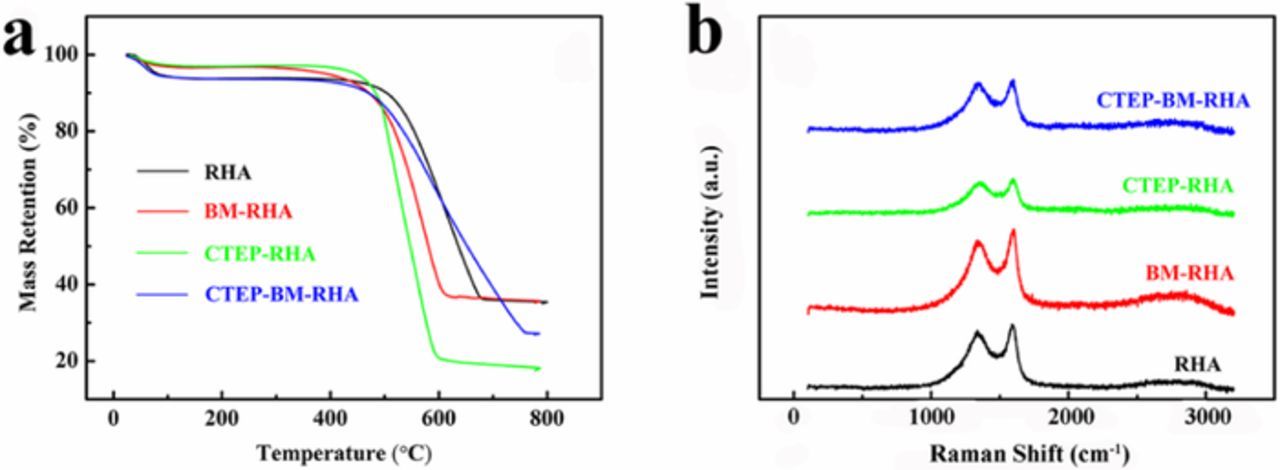
Figure 1. (a) TG curves and (b) Raman spectra of all obtained samples.
SEM images of all materials are shown in Figure 2 and Figure S2. Some irregular carbon blocks with 5–10 μm in size, which caused for uneven dispersion of CTEP, are mainly distributed on the surface of RHA and CTEP-RHA (Figure S2a and Figure 2a), while some reticulated structure, obtained from CTEP after pyrolyzing, appears under the irregular carbon blocks of CTEP-RHA (Circled in Figure 2b). The similar reticulated structure almost covers the entire image in Figure 2d. Combined with TG curves, it can be known that the reticulated structure possesses a high binding energy and an excellent stability.24 In addition, the flat surface of CTEP-BM-RHA shows fewer cracks, reducing the risk of collapsing for electrode and promoting cycling performance during cycling of LIBs. Moreover, fewer cracks contribute to the reduction of electrode impedance, providing a smooth channel for the electron transfer.
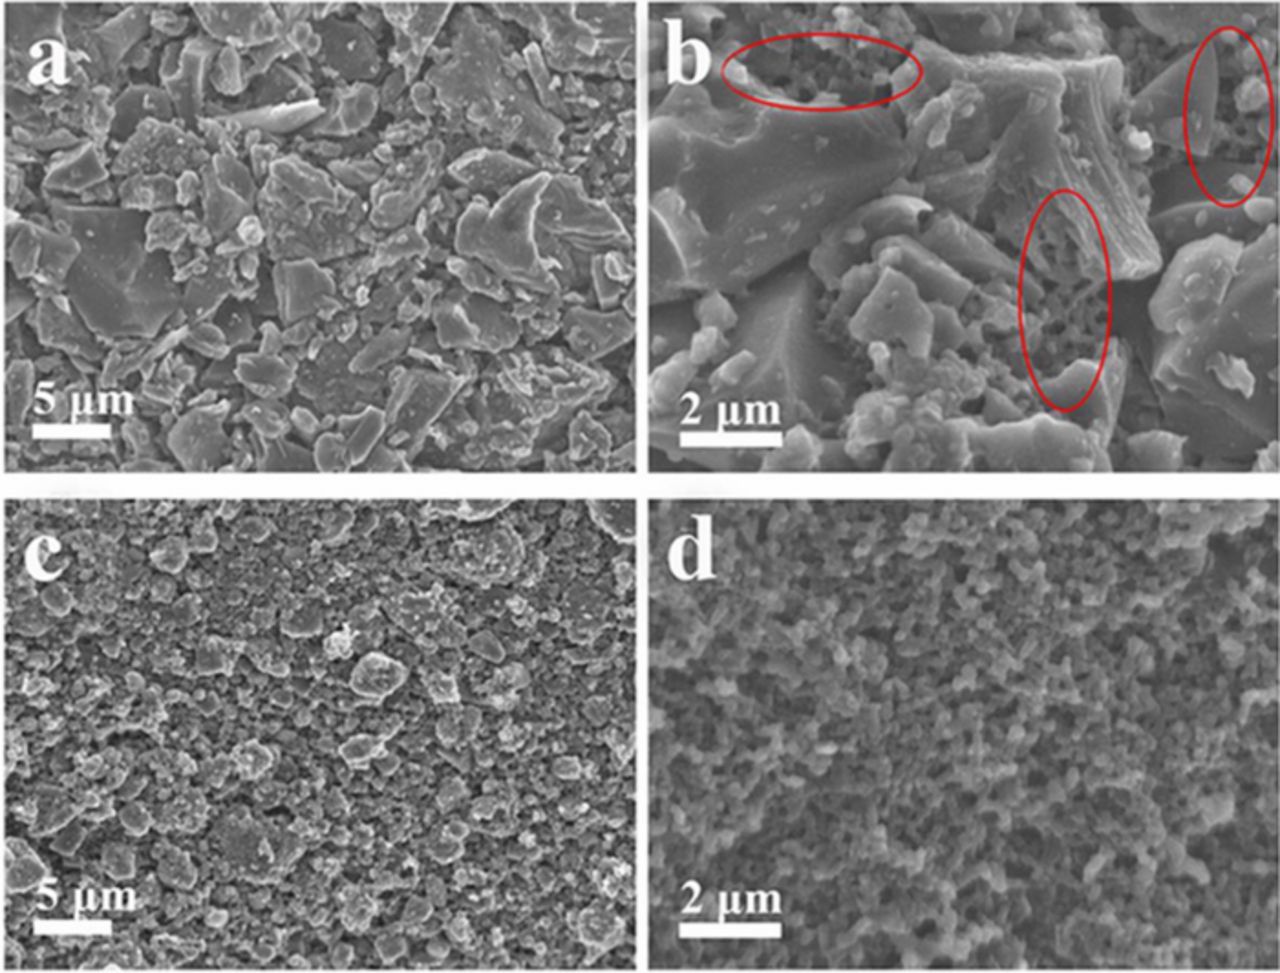
Figure 2. SEM images of (a, b) CTEP-RHA; (c, d) CTEP-BM-RHA.
Galvanostatic charge-discharge profiles of RHA and CTEP-BM-RHA at first cycle (0.05 C) are shown in Figures 3a and 3b. Raw RHA without any further process has a first discharge specific capacity of 834 mA h g−1, with the ICE of around 45%. Ball milling can provide more active sites of Li+ and increase the first discharge specific capacity, exceeding 1000 mA h g−1 (Figure S4a: BM-RHA), which is consistent with the result of Raman spectra. The specific capacity of CTEP-RHA is 759 mA h g−1, which is slightly lower than that of RHA, with the ICE of 48%. It can be referred that simply mixing cannot produce a stable structure and the uneven distribution hindered the transmission of Li+ ions. After the assistance of ball milling, the discharge specific capacity at first cycle of CTEP-BM-RHA is 1032 mA h g−1, with the ICE of 56%. The high specific capacity may due to the orderly reticulated structure in Figure 2d, which promotes the transportation of lithium ions. The ICE of CTEP-BM-RHA is about 10% better than that of the original RHA, because of the reduction of specific surface area (SSA). In order to verify the SSA of the obtained materials, a series of nitrogen adsorption and desorption experiments were carried out. As shown in Figure S5, all of the materials have micropore structure, and the diameters of the pores are mainly distributed at 1.7 - 1.9 nm, occupying more than 95% of total pore volume. The SSA of RHA, BM-RHA, CTEP-RHA, CTEP-BM-RHA was calculated to be 175.80 m2 g−1, 225.71 m2 g−1, 152.39 m2 g−1, 81.56 m2 g−1, respectively. Large SSA can lead to the formation of a large area of solid electrolyte interface (SEI) film, resulting in consumption of lithium ions and a large quantity of irreversible capacity.25 The addition of CTEP can effectively fill pores and cracks on the surface of materials. Therefore, CTEP-BM-RHA has the lowest SSA, and the corresponding ICE is the highest.
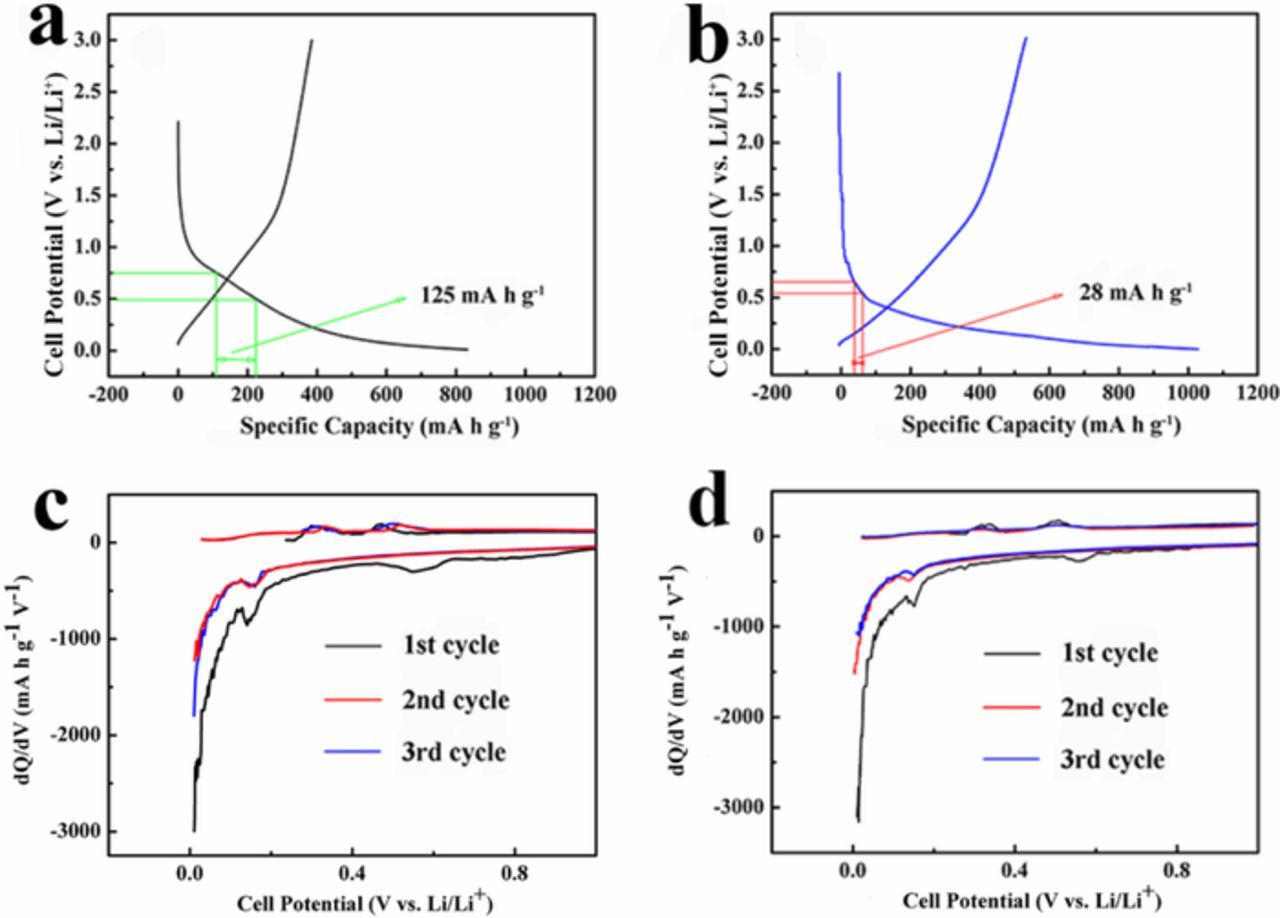
Figure 3. Galvanostatic charge-discharge profiles at first cycle (0.05 C) of (a) RHA; (b) CTEP-BM-RHA and capacity differential profiles of (c) RHA; (d) CTEP-BM-RHA.
The capacity differential profiles of RHA and CTEP-BM-RHA are shown in Figures 3c and 3d. Known from the XRD patterns (Figure S1) and TG curves (Figure 1a), after pyrolyzing CTEP, no element was added other than amorphous carbon, indicating that no new reactions occurred. Therefore, the positions of the oxidation and reduction peaks of RHA and CTEP-BM-RHA remain the same. The reduction peak at 0.16 V corresponds to the reaction between SiO2 and Li+. The reactions are as follows.26
![Equation ([1])](https://content.cld.iop.org/journals/1945-7111/166/12/A2425/revision1/d0001.gif)
![Equation ([2])](https://content.cld.iop.org/journals/1945-7111/166/12/A2425/revision1/d0002.gif)
![Equation ([3])](https://content.cld.iop.org/journals/1945-7111/166/12/A2425/revision1/d0003.gif)
![Equation ([4])](https://content.cld.iop.org/journals/1945-7111/166/12/A2425/revision1/d0004.gif)
As both Reaction 1 and 2 are irreversible, the SiO2 reduction accounts for the irreversible capacity. Reaction 3 and 4 are reversible reactions, which are the main source of the reversible specific capacity.26 At 0.6 V, there is another reduction peak, corresponding to the formation of SEI film. For RHA, the reduction peak ranges from 0.5 V to 0.75 V, compared with a peak from 0.55 V to 0.65 V for CTEP-BM-RHA. Combined with the galvanostatic charge-discharge profiles, the specific capacity varies 125 mA h g−1 during the interval of 0.50 - 0.75 V for RHA and 28 mA h g−1 for CTEP-BM-RHA. The results indicate that CTEP-BM-RHA reduces 97 mA h g−1 consumption, which belongs to irreversible capacity resulted from the SEI film formation. This calculation result is equivalent to 9.4% of the first discharge specific capacity and close to the increase of ICE (11%). Moreover, the total irreversible capacity caused by SEI formation in RHA occupies 15% of the total discharge specific capacity, so 11% increase of ICE means a prominent promotion for this method. At 0.37 V and 0.56 V, the oxidation peaks correspond to the reversible Reaction of 5 and 6, which provide primary reversible specific capacity for LIBs.26
![Equation ([5])](https://content.cld.iop.org/journals/1945-7111/166/12/A2425/revision1/d0005.gif)
![Equation ([6])](https://content.cld.iop.org/journals/1945-7111/166/12/A2425/revision1/d0006.gif)
Figures 4a and 4b display cycling performance of all materials at 0.05 C. (All the materials were tested after 3 cycles at 0.05 C, and the data in the 3 cycles were not shown in figures. So does the following test at high current densities.) As SiO2 converts to element Si at first and the theoretical specific of Si is higher than that of SiO2, the specific capacity of all materials increases slightly within the first several cycles. The irreversible products, Li2O and Li4SiO4, can effectively improve the strength of SEI film, preventing SEI film from being impaired and reducing lithium ion consumption subsequently.27 Therefore, an excellent Coulombic efficiency of 99% was found after several cycles. Among the four materials, CTEP-BM-RHA performs the best cycling performance within 100 cycles. At higher current densities, its stable cycling performances were also observed. (Figures 4c and 4d). After 100 cycles, the specific capacity maintains as large as 571 mA h g−1 at 0.1 C and 404 mA h g−1 at 0.25 C, respectively. Moreover, a long cycling performance at a current density of 0.25 C was carried out, showing a capacity retention of 404 mA h g−1 over 500 cycles, which is consistent with the capacity retention over 100 cycles. The excellent cycling performance of CTEP-BM-RHA at different current densities can be attributed to the reticulated structure in Figure 2d, providing a matrix to buffer volume expansion and keeping the structure stable during charge-discharge process.
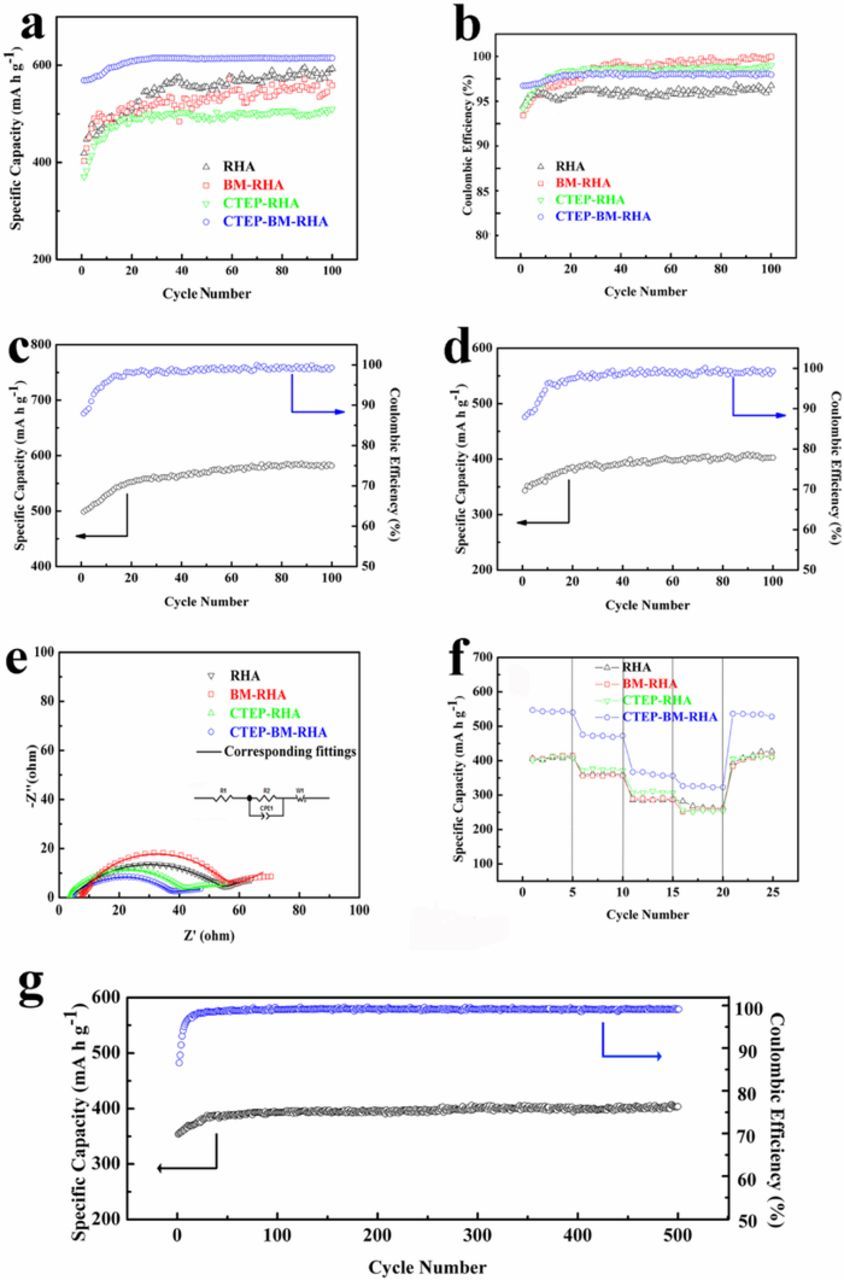
Figure 4. (a) Cycling performance and (b) Coulombic efficiency of all obtained samples at 0.05 C; Cycling performance of CTEP-BM-RHA at a current density of (c) 0.1 C and (d) 0.25 C. (e) Nyquist plots after 100 cycles (after 100th charging) at 0.05 C and (f) rate performance from 0.05 C-0.5 C of all obtained samples. (g) Long cycling performance of CTEP-BM-RHA at 0.25 C over 500 cycles. All the cycling performance was tested after 3 cycles at 0.05 C.
SEM images of RHA and CTEP-BM-RHA before and after charging-discharging were compared in Figure 5 to verify the impact of CTEP on promoting the cycling performance. It is worthy to mention that various cracks were observed on the surface of RHA after charging-discharging 100 cycles, while for CTEP-BM-RHA, the surface is flat. Under higher magnifications, cracks with several micrometers are more apparent on RHA, which can make the partial electrode collapse and lose electrical contact, as well as electrical activity. Nevertheless, there are regular pores with dozens of nanometers on the surface of CTEP-BM-RHA and no remarkable cracks can be seen. It is believed that CTEP-BM-RHA has more excellent cycling performance due to its stable structure.
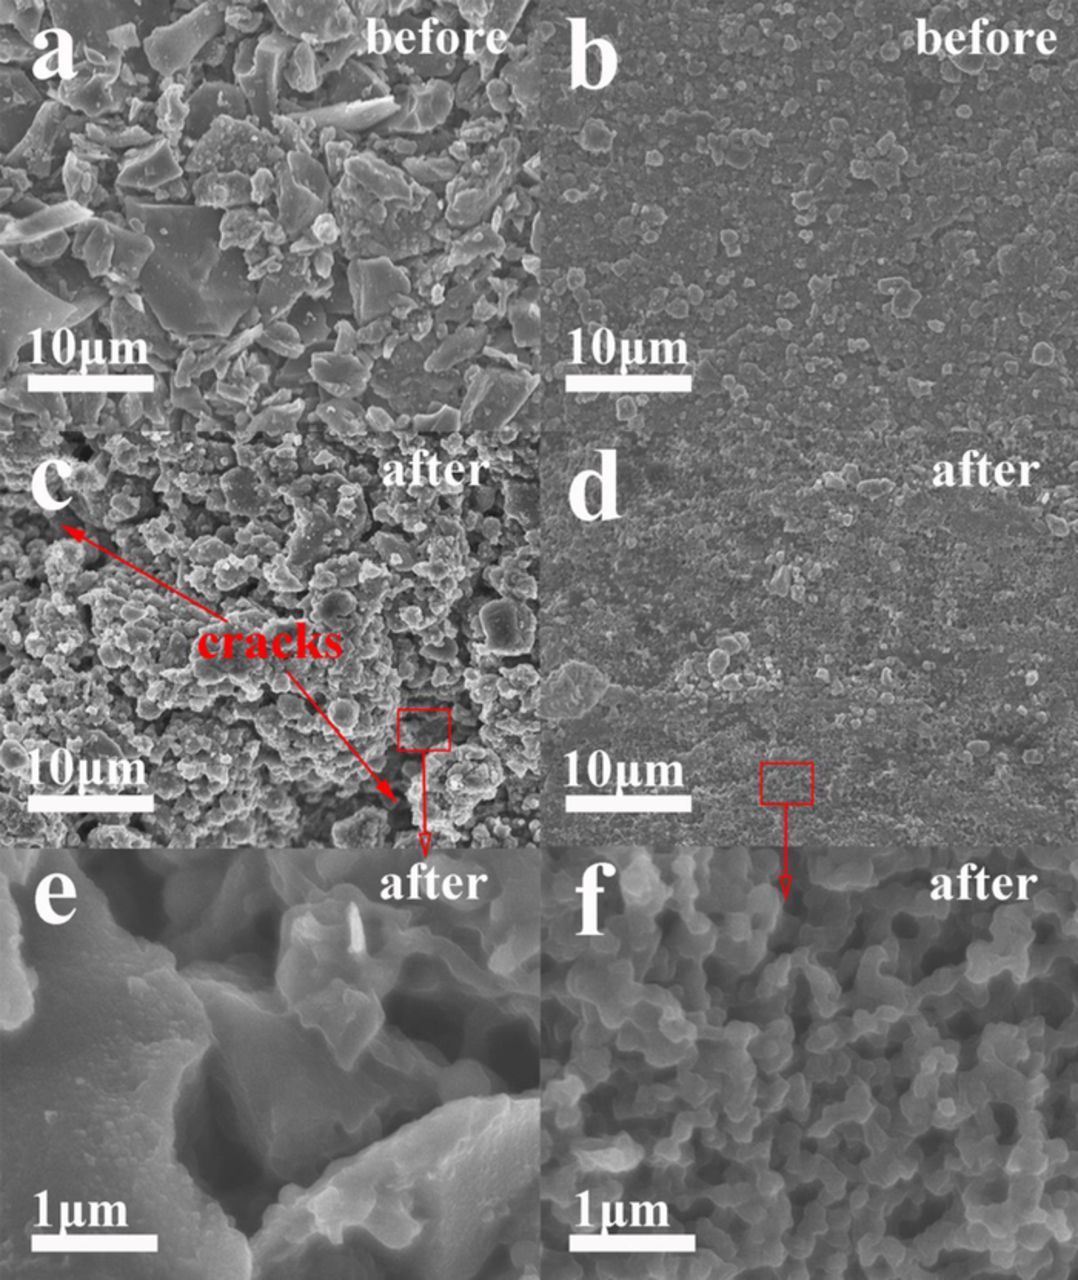
Figure 5. SEM images of (a) RHA and (b) CTEP-BM-RHA before cycling; (c, e) RHA and (d, f) CTEP-BM-RHA at 0.05 C after 100 cycles.
The results of EIS test after 100 cycles (after charging) at 0.05 C with the equivalent circuit model are shown in Figure 4e. R1 represents the impedance of the interface between the electrode and the electrolyte. R2 is the charge transfer impedance of the electrode material, which is related to the internal structure of the material. W1 is the ion diffusion impedance caused by polarization and CPE is a constant phase angle element, which is equal to a double-layer capacitance.18 The EIS results are shown in Table I. The interface impedance and the internal resistance of CTEP-BM-RHA are smallest among all materials. The result can be attributed to the addition of CTEP, filling cracks to enable CTEP-BM-RHA to possess excellent connection. The exchange current density of materials can be calculated from the R2 by the formula i0 = RT/nFR2. R is the gas constant 8.31. T represents the experimental temperature (Kelvin). In this test, the temperature is 298 K under standard conditions. n is the number of electrons of Li+. F is Faraday's constant and R2 is the charge transfer impedance of the electrode after cycling.28 At the equilibrium of the electrode, the current exchange density is 6.95 × 10⁻⁴ mA cm−2, which is higher than the other three groups of data. That is to say, under the same condition, the capability of Li+ transmission of CTEP-BM-RHA is better than the other three materials, which makes it more prone to react with Li+ for the electrode.
Table I. Impedance parameters after 100 cycles and their exchange current density.
| Electrode material | R1/Ω | R2/Ω | i0/mA cm−2 |
|---|---|---|---|
| RHA | 3.97 | 45.00 | 5.70 × 10⁻⁴ |
| BM-RHA | 3.868 | 43.77 | 5.86 × 10⁻⁴ |
| CTEP-RHA | 2.779 | 45.43 | 5.65 × 10⁻⁴ |
| CTEP-BM-RHA | 2.238 | 36.91 | 6.95 × 10⁻⁴ |
Rate performance of RHA, BM-RHA, CTEP-RHA and CTEP-BM-RHA at the current density of 0.05 -0.5 C is shown in Figure 4f. At 0.05 C, the specific capacity of RHA, BM-RHA and CTEP-RHA is around 400 mA h g−1, which is compared with a specific capacity 548.4 mA h g−1 for CTEP-BM-RHA. When the current density increases to 0.5 C, the specific capacity of RHA, BM-RHA, CTEP-RHA, CTEP-BM-RHA is 299 mA h g−1, 202 mA h g−1, 252 mA h g−1 and 327 mA h g−1, respectively. Remarkably, when the current density is restored to 0.05 C, the specific capacity of all materials recovers completely. The excellent rate performance of the four materials can be attributed to the amorphous carbon in RHA, which provides a matrix to buffer SiO2, preventing electrode from being damaged under a high current density.29 Moreover, the amorphous carbon also has a compact connection with SiO2, which enhances conductivity of the materials and facilitates fast electronic transportation and ionic diffusion. For CTEP-BM-RHA, the extra amorphous carbon can enhance the stability of electrode and provide a further insurance for LIBs.
Conclusions
In summary, SiO2/C composite with reticulated structure was prepared by a ball milling process, followed by mixing CTEP and pyrolyzing. The reticulated structure improved the structure stability and reduced the SSA of the obtained materials. The process of ball milling eliminated carbon blocks with non-uniform size to enable an even distribution of CTEP. The addition of CTEP diminished cracks on the surface and improved the structure stability of SiO2/C composite, resulting in improving the cycle performance and reducing the formation of SEI film. Meanwhile, the formed reticulated structure provided a smooth channel for electron transfer, leading to a high reversible specific capacity and low impedance. Furthermore, due to the effect of both intrinsic carbon buffer layer and the pyrolytic carbon of CTEP, CTEP-BM-RHA possessed an excellent rate performance. Hence, the combination of ball milling and CTEP can make biomass materials become good candidates as anodes for LIBs.
Acknowledgments
This work was supported by National Nature Science Foundation of China (No. 51502108); the Foundation of Jilin Province Development and Reform Commission, China (No. 2014N145); Graduate Innovation Fund of Jilin University (No. 101832018C176); and Jilin Engineering Research Center for Biomass Resource Utilization and National Key Research and Development Program of China (No. 2016YFF0201204).
ORCID
Xiaoyang Liu 0000-0002-7128-8457
Xiaofeng Wang 0000-0003-0454-5932