Article Text

Abstract
Objectives To describe distributions and concordance of retinal microvasculature measurements in a population-based sample of Australian parent–child dyads at child age 11–12 years.
Design Cross-sectional Child Health CheckPoint study, between waves 6 and 7 of the national population-based Longitudinal Study of Australian Children (LSAC).
Setting Assessment centres in seven Australian cities, February 2015–March 2016.
Participants Of the 1874 participating families, 1288 children (51% girls) and 1264 parents (87% mothers, mean age 43.7) were analysed. Diabetic participants and non-biological pairs were excluded from concordance analyses.
Outcome measures Retinal photographs were taken by non-mydriatic fundus camera. Trained graders scored vascular calibre using semi-automated software, yielding estimates of central retinal arteriolar equivalent (CRAE) and central retinal venular equivalent (CRVE) and arteriolar–venular ratio (AVR). Pearson’s correlation coefficients and multivariable linear regression models assessed parent–child concordance. Survey weights and methods accounted for LSAC’s complex sampling, stratification and clustering within postcodes.
Results Mean (SD) of CRAE and CRVE were larger in children (159.5 (11.8) and 231.1 (16.5) μm, respectively) than parents (151.5 (14.0) and 220.6 (19.0) μm), yielding similar AVR (children 0.69 (0.05), parents 0.69 (0.06)). Correlation coefficients for parent–child pairs were 0.22 (95% CI 0.16 to 0.27) for CRAE, 0.23 (95% CI 0.17 to 0.28) for CRVE and 0.18 (95% CI 0.13 to 0.24) for AVR. Mother–child and father–child values were similar (0.20 and 0.32 for CRAE, 0.22 and 0.29 for CRVE, respectively). Relationships attenuated slightly on adjustment for age, sex, blood pressure, diabetes and body mass index. Percentiles and concordance are presented for the whole sample and by sex.
Conclusions Arteriolar and venular calibre were similar to previously documented measures in midlife adult and late childhood populations. Population parent–child concordance values align with moderate polygenic heritability reported in smaller studies.
- retinal vessel calibre
- retinal vessels
- epidemiology
- reference values
- parents
- children
- inheritance patterns
- correlation studies
- epidemiologic studies
- cross-sectional studies
This is an open access article distributed in accordance with the Creative Commons Attribution Non Commercial (CC BY-NC 4.0) license, which permits others to distribute, remix, adapt, build upon this work non-commercially, and license their derivative works on different terms, provided the original work is properly cited, appropriate credit is given, any changes made indicated, and the use is non-commercial. See: http://creativecommons.org/licenses/by-nc/4.0/.
Statistics from Altmetric.com
- retinal vessel calibre
- retinal vessels
- epidemiology
- reference values
- parents
- children
- inheritance patterns
- correlation studies
- epidemiologic studies
- cross-sectional studies
Strengths and limitations of this study
This is the largest Australian population-based study to investigate the concordance of microvascular structural measurements.
Our adult sample provides novel data regarding the relatively neglected midlife phase, with most other adult population samples being elderly.
We used gold-standard methodology and demonstrated high inter-rater and intra-rater reliability.
Most of the participating parents were mothers, resulting in less precise descriptive and concordance estimates for fathers.
Introduction
The role of the microvasculature (ie, small vessels) is increasingly recognised in the pathogenesis of cardiovascular disease.1–3 Microvascular abnormalities already present in early life are thought to predispose to both cardiovascular risk factors and outcomes (eg, stroke, myocardial infarction).4–6
The retina offers a fast, non-invasive platform to study microvascular health in vivo, with similar pathological changes associated with abnormalities and diseases in the cerebral, coronary and renal microvasculatures.7–10 The most commonly assessed retinal microvasculature measure is the vessel calibre (diameter),10 summarised as the central retinal arteriolar equivalents (CRAE) and central retinal venular equivalent (CRVE) and its ratio, the arteriolar–venular ratio (AVR). Meta-analyses have demonstrated statistically significant correlations of smaller retinal arteriolar and wider retinal venular vessel calibre with subsequent cardiovascular disease, including stroke, obesity and coronary heart disease.11–14 Cardiovascular risk factors (such as hypertension, diabetes mellitus and obesity) have been similarly associated with smaller retinal arterioles and larger retinal venules via both shared and unique underlying pathophysiology.6 15 16 Thus, the retinal vasculature has been suggested to be a robust biomarker of cardio-metabolic diseases and allows studying the natural course of small vessel changes over life and its relationship to cardiovascular outcomes in later years.10 15
However, an important gap in the literature is that the natural course and determinants of the retinal vascular calibre are not fully documented. There is some evidence for distinct but differing curvilinear relationships of arteriolar and venular calibres with age.10 15 Thus, from disparate cross-sectional studies, Ikram’s 2012 narrative review reported that both arteriolar and venular calibre increased from birth (85.5 and 130.0 µm respectively) to age 6 years (165.6 and 232.0 µm). Arteriolar calibre increased further by midlife (202.3 µm) while venular calibre remained static, with calibres of both arterioles and venules reduced from midlife to old age.10 However, limitations to this literature include differing protocols for imaging and scoring and a marked under-representation of population studies, with few data from young and mid-adulthood. These limitations preclude robust conclusions regarding reference ranges and predictive cutpoints across the lifespan.
While heritability of retinal vascular calibres appears substantial from small community-based samples using a variety of protocols,15 large studies of parent–child pairs drawn from the general population are lacking. Parent–child correlations for CRAE and CRVE respectively were 0.24 and 0.27 in 341 American adult pairs (aged 43–86 years) in the Beaver Dam Eye Study17; 0.13 and 0.20 for 174 adult pairs from the Flemish Study on Environment, Genes and Health Outcomes (aged 20+ years)18 and 0.12 and 0.31 in 304 pairs from the strabismus, amblyopia and refractive error in Singaporean Children study (mean ages: 40 years for parents, 9 years for children).19 In all three studies, spousal concordance was negligible for both metrics. In contrast, monozygotic twins have shown much higher concordance (CRAE 0.60 to 0.80, CRVE 0.63 to 0.88) than dizygotic pairs (CRAE 0.12 to 0.50 and CRVE 0.13 to 0.35),20–24 with higher heritability estimates in twin (CRAE 0.56 to 0.70, CRVE 0.64 to 0.83) than parent–child pairs (CRAE 0.25 to 0.54, CRVE 0.28 to 0.72).17–23 Genome-wide studies have identified several promising loci associated with retinal vessel calibre.23 25 However, it remains unclear whether these values remain constant across the lifecourse or what opportunities these offer for preventive health.
Thus, understanding the population epidemiology of retinal calibre in larger studies of healthy midlife adults and children would inform age-specific and sex-specific reference values and facilitate secular trend analyses, international comparisons and, potentially, early risk stratification. The Child Health CheckPoint, a cross-sectional biophysical assessment nested within the Longitudinal Study of Australian Children (LSAC), provided an opportunity to address this issue/question in a national population-based sample of Australian parent–child dyads at child age 11–12 years. We aimed to (1) assess the distribution of retinal vessel calibre in both age groups and (2) investigate parent–child concordance of these measures.
Methods
Study design and participants
Details of the initial LSAC study design and recruitment are outlined elsewhere.26 27 Briefly, LSAC recruited a nationally representative birth cohort (B cohort) of 5107 infants using a 2-stage clustered design. First, 10% of Australian postcodes (stratified by state and urban/rural locations) were randomly selected, then in-age children (born between March 2003 and February 2004) within those enrolled in the Medicare Australia database (Australia’s universal healthcare system into which 98% of children are enrolled by their first birthday) were selected. Study participants were then followed up in biennial ‘waves’ of data collection up to 2015.27 The initial recruitment rate in 2004 was 57.2%, of whom 73.7% (n=3764) were retained to LSAC wave 6 in 2014. At the wave 6 visit, all contactable and consenting families (n=3513) were invited to consent to their contact details being shared with the Child Health CheckPoint team. In 2015, families that consented to contact were sent an information pack via post and received an information and recruitment phone call. The CheckPoint’s detailed cross-sectional biophysical assessment, nested between LSAC waves 6 and 7 at child age 11–12 years, took place between February 2015 and March 2016. A total of 1874 families participated. A more detailed description of the CheckPoint study design is available elsewhere.28 29
Consent
The attending parents/caregivers provided written informed consent for themselves and their children to participate in the study.
Procedure
Retinal photographs were taken during each participant’s 3.5-hour visit to the CheckPoint assessment centres in 7 large cities (mainly state capitals) around Australia. During this visit, each child and parent rotated sequentially and separately through a number of 15 min assessment stations.28 At the ‘See Here’ station, participants sat in front of a fundus camera (EOS 60D SLR) while the procedure was explained; the room was then darkened while the participant rested chin and forehead on the head rest of the fundus camera for several minutes. Two digital photographs (one each centring on the optic disc and macula) were taken for each eye using standard protocols from the Centre for Eye Research Australia. Because CheckPoint was unable to transport its single retinal camera to smaller regional centres or home visits, 518 CheckPoint families did not contribute to retinal vessel calibre data (figure 1).

Participant flow through Child Health CheckPoint. *Unable to collect image due to equipment failure or time constraints. ~Data excluded for images that did not meet quality criteria for ’Big 6' analysis. ^Data from 10 non-biological child-parent pairs and 29 diabetic participants excluded from concordance analyses. c, number of children; HV, home visit assessment; LSAC, Longitudinal Study of Australian Children; MAC, main assessment centre; mAC, mini assessment centre; n, number of families; p, number of attending adults
Retinal image scoring
Right eye images were selected as first choice for scoring. Reasonable correlations (r>0.71) of retinal vascular diameters between right and left eyes have previously been reported,30 31 and this allowed harmonisation with other vascular measures obtained in CheckPoint, such as pulse wave velocity and blood pressure, that also assessed the right-side circulation. Left eye images were used where right eye images were deemed ungradable. Issues preventing grading of images included poor focus (potentially blurring vessel edges), dark images (increasing the difficulty for graders to visually validate the vessel trace), and confounding pathology (which can obscure the vessels). Images were evaluated at the Zhongshan Ophthalmic Centre in Guangdong, China (77%) and the Centre for Eye Research Australia in Melbourne, Australia (23%), separately. In total, 2624 images were graded, including 1307 from children and 1317 from parents (87% and 92% from the right eye for children and parents, respectively). Nineteen child and 53 parent images did not meet the quality criteria for use in analyses.
Each image was graded by one of four experienced graders (two from China and two from Australia) masked to participant characteristics who measured the diameters of retinal vessels using the software programme Integrative Vessel Analysis (IVAN, University of Wisconsin, Madison, USA). Retinal vessels were identified as arterioles or venules from a specific area (one-half to one disc diameter from the margin of the optic disc). Each grader then selected a segment of each vessel within this area for measurement. Diameters of all the selected segments were measured automatically by the IVAN software. For each participant, summary estimates of the average retinal vascular calibre were calculated according to the Big6 (revised Knudston-Parr) formula,30 which combines measurements of the six largest arterioles or venules, represented as the CRAE and CRVE. The AVR was calculated as CRAE divided by the CRVE.
Other sample characteristics
Measures of potential confounding variables were included as detailed elsewhere.28 Briefly, age was calculated to the nearest week using the date of birth, either imported from Medicare Australia’s database at the time of LSAC enrolment (child) or self-reported (parent), and date of assessment. Sex was self-reported.
Body mass index (BMI) was calculated as kg/m2, using measured height and weight.28 For children, age-adjusted and sex-adjusted BMI z-scores were calculated using the US Centers for Disease Control and Prevention growth reference charts.32
Brachial blood pressure was measured using the SphygmoCor XCEL (AtCor Medical Pty, West Ryde, NSW, Australia), following 7 min rest. Mean arterial blood pressure was calculated from the systolic and diastolic measures.
In Australia, Socio-Economic Indexes for Areas provide standardised scores for socio-economic position by geographical area (postcode of family domicile) compiled from 2011 Australian census data. We used the Socio-Economic Indexes for Areas index of Relative Socio-economic Disadvantage (Disadvantage Index) which numerically summarises the social and economic conditions of Australian neighbourhoods (national mean of 1000 and SD of 100, where higher values represent less disadvantage).33 Parents reported child and parent medical histories via iPad-administered questionnaires at the assessment centre.
Child and parent participants who attended the CheckPoint assessment centres also completed a visual acuity assessment (not conducted in home visits). As part of this assessment, they were asked if they ‘usually wear glasses or contact lenses’. Staff members recorded their response as yes or no; the strength of prescription was not captured.
Statistical analyses
All analyses were performed using Stata V.14.2.
Continuous descriptive variables were summarised using weighted means and SD; categorical variables were summarised by number and weighted percentage for children and adults separately and by sex. Survey weights were calculated taking into account the selection probability of each child, and were adjusted for non-response, loss to follow-up and benchmarked to population numbers in major (post stratification) categories of the population of children born in 2004. Standard errors were calculated taking into account the complex design and survey weights.34 More details on the calculation of survey weights is provided elsewhere.28 35
Concordance between parents and children was assessed by (1) Pearson’s correlation coefficient (CCs) with 95% CIs; (2) linear regression with child variable as dependent variable and parent variable as independent variable adjusted for parent and child age, BMI, mean arterial blood pressure, Disadvantage Index score and sex where appropriate and (3) partial correlation coefficients adjusted for the same covariates. The Pearson’s correlation and linear regression analyses were repeated using weighted multi-level survey analyses; as these yielded similar results, unweighted results are displayed. Twenty nine diabetic participants, and 10 non-biological child-parent pairs were excluded from concordance analyses.
Reliability of retinal vessel calibre measurements
Inter-grader reliability was assessed by three of the four graders reanalysing a subset of 50 randomly chosen images. To assess intra-grader reliability, the same three graders each re-graded 25 of the 50 randomly chosen images. Hence, an assessment was made as to reproducibility of grading made by different graders and repeatability of gradings made by the same grader. Two-way mixed-effects intraclass correlation coefficients were used for the reliability analysis.
Patient and public involvement
Because LSAC is a population-based longitudinal study, no patient groups were involved in its design or conduct. To our knowledge, the public was not involved in the study design, recruitment or conduct of the LSAC study or its CheckPoint module. Parents received a summary health report for their child and themselves at or soon after the assessment visit. They consented to take part knowing that they would not otherwise receive individual results about themselves or their child.
Results
Sample characteristics
A total of 2552 participants (1288 children and 1264 adults) were included in the descriptive aim 1 analyses (figure 1). This represents 95% of the 1356 pairs who attended CheckPoint assessment centres (where retinal photography was offered). Reasons for participants not having retinal photography images and data are attendance at smaller assessment centres without a retinal camera or home visit (n=518 participants), participant refusal (n=160 participants), and image not taken (eg, the camera required repair) or the quality was too poor (n=5 participants, figure 1). A total of 1186 parent–child pairs were included in aim 2 analyses; 10 non-biologic adult–child pairs and 29 diabetic participants were excluded from the concordance assessments (figure 1).
Table 1 shows sample characteristics of children and parents stratified by sex. In children, sex was evenly represented (51% girls), while mean age-specific and sex-specific BMI z-scores were higher than Center for Disease Control historical norms (0.37). The parent sample largely comprised mothers (86.6%). Participants on average were slightly more advantaged (Disadvantage Index mean score 1011, SD 61) than the national Australian population (mean 1000, SD 100).33
Sample characteristics and retinal vessel calibre measures, stratified by sex, of children and parents
Descriptive epidemiology of retinal vessel calibre
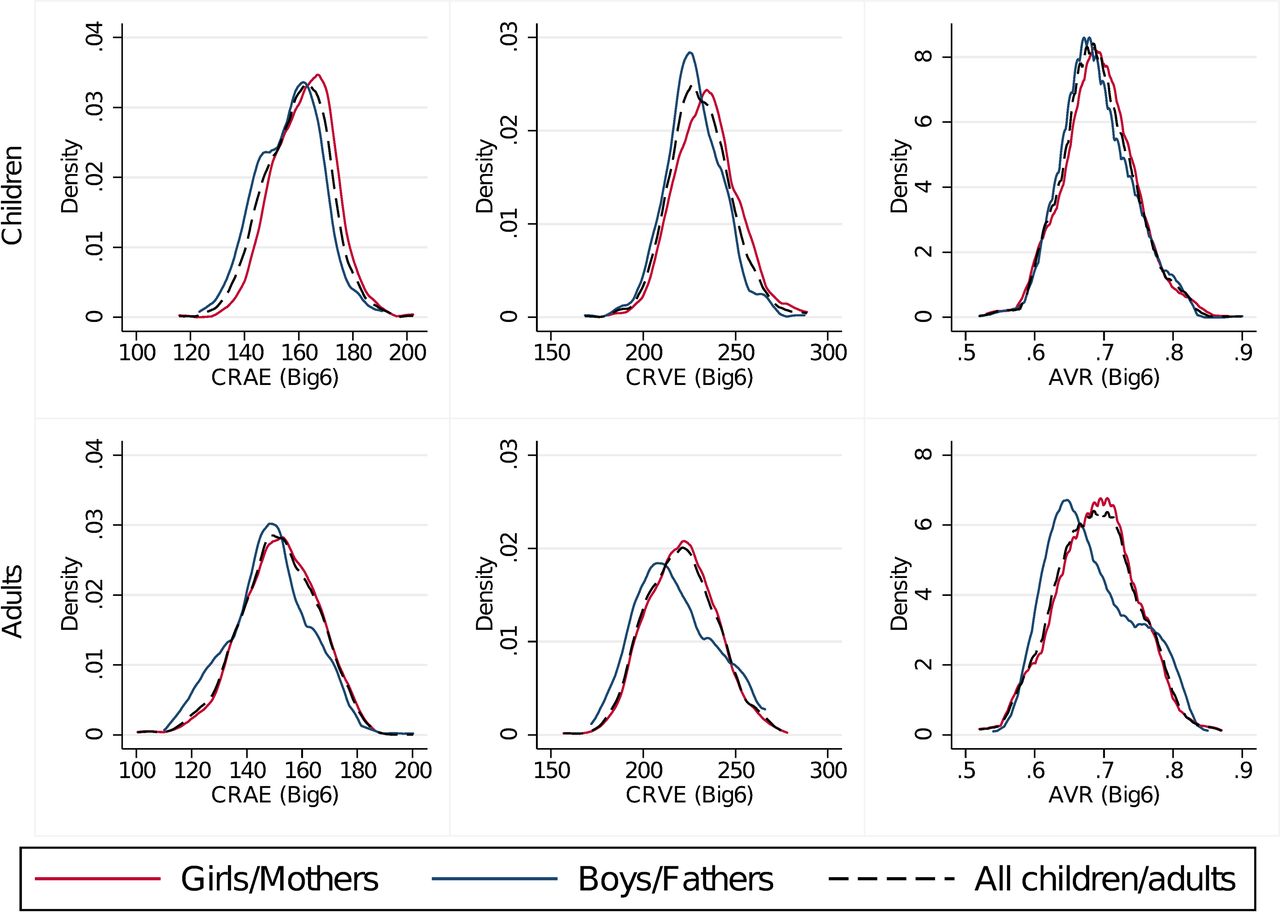
Summary statistics for parent and child retinal values are displayed in table 1, and broken down for reference into 5th to 95th percentiles in table 2. The corresponding distribution graphs (figure 2) demonstrate approximately normal distribution in all measures for both children and adults. Mean CRAE and CRVE were around 0.6 SD larger in children (159.5 (11.8) and 231.1 (16.5) μm, respectively) than parents (151.5 (14.0) and 220.6 (19.0) μm), yielding similar AVR (children 0.69 (0.05), parents 0.69 (0.06)), table 1). Boys’ CRAE and CRVE mean values were marginally smaller than girls’ values (CRAE 156.8 µm vs 162.1 µm, CRVE 227.8 µm vs 234.3 µm), and fathers similarly showed smaller mean values than mothers (CRAE 148.4 µm vs 152.0 µm, CRVE 217.9 µm vs 221.0 µm). Mean AVR was strikingly similar in parents and children and between all four groups.

Density plots for retinal vessel calibre measures. AVR, arteriolar–venular ratio; CRAE, central retinal arteriolar equivalent; CRVE, central retinal venular equivalent; BIG6, revised Knudston-Parr formula for calculating CRAE and CRVE using IVAN software.30
Retinal vessel calibre percentiles
Parent–child concordance
Correlations for the 1186 parent–child pairs are displayed in table 3. CCs for parent–child dyads were 0.22 for CRAE and 0.23 for CRVE, and (as expected for a derived ratio value) slightly smaller for AVR (0.18). Mother–child and father–child correlations are presented for reference but not compared statistically; noting slightly higher values for father–child dyads but wider CIs in keeping with the much smaller numbers. In linear regression adjusting for all covariates, estimates attenuated only marginally and all associations remained strong (estimated regression coefficients for parent–child dyads: CRAE 0.18, CRVE 0.20, AVR 0.16) with the exception of father–child AVR. Similarly, partial correlations adjusted for covariates attenuated slightly (correlation coefficient decreased by 0.01 to 0.06, data not shown).
Parent–child concordance
Reliability analysis
Within-grader intraclass correlations were very high for all three graders for CRAE (0.90 to 0.99, 95% CI 0.76 to 0.99) and CRVE (0.92 to 0.98, 95% CI 0.82 to 0.99). This equated to a greater within-grader range for the derived AVR variable (0.69 to 0.97, 95% CI 0.28 to 0.99). Between-grader interclass correlations were also high at 0.79 (95% CI 0.47 to 0.91), 0.92 (95% CI 0.77 to 0.96) and 0.75 (95% CI 0.58 to 0.86) for CRAE, CRVE and AVR respectively.
Unplanned post-hoc analysis
As noted above, both CRAE and CRVE were around 0.6 SD smaller in the midlife parents than the 11–12-year olds. This contrasts with Ikram’s 2012 review, from which we had expected that CRAE would be substantially larger by midlife, but that CRVE would remain static (prior to both reducing in old age).10 Because these results were surprising, we therefore conducted some unplanned post-hoc analyses to determine how our findings fit within the existing literature. These should be considered as exploratory and hypothesis-generating only.
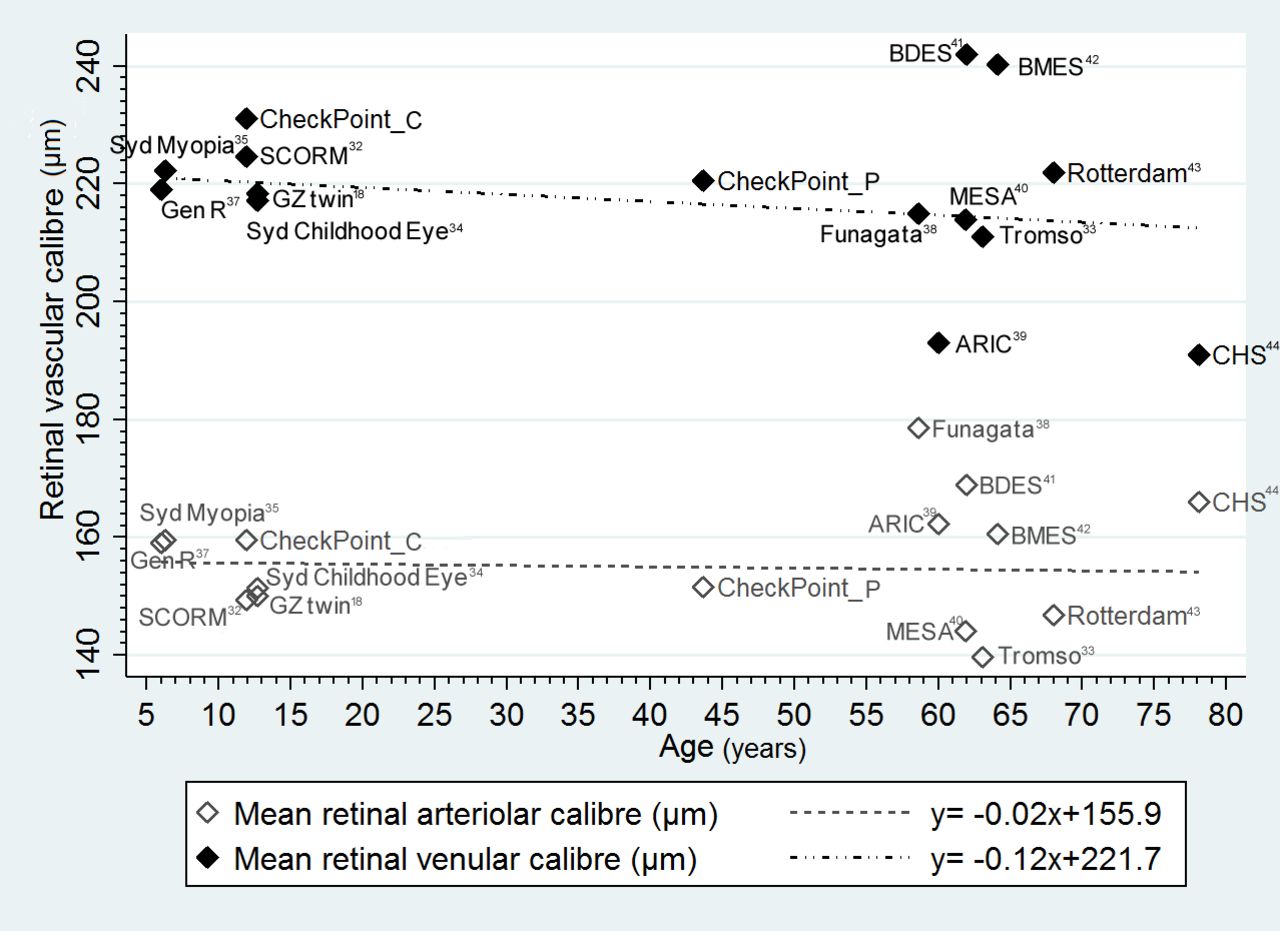
We plotted mean values for CRAE and CRVE by mean age (figure 3) for 15 community-based studies published since 2004 with participants aged from 6 years to old age.11 22 36–47 We included all adult studies (summarised in online supplementary table 1) in Sun et al’s systematic review15 that had a community or population-based sample of >1000 individuals40–47; the Norwegian Tromso Eye Study was identified through cited reference searches.37 Sun’s review also identified the child population in the Singapore Cohort Study of the Risk Factors for Myopia (SCORM),36 and we searched the SCORM study’s bibliography and other published reviews for additional children’s cohorts.11 22 38 39 We superimposed the results from CheckPoint, separately for adults and children. As visual inspection did not suggest a curvilinear relationship, we then fitted two exploratory linear regression models, with mean age for each study (CheckPoint children and parents considered separately) as the independent variable and with calibre size (arteriolar and venular) as the two dependent variables. It can be seen that venular calibre appears to narrow slightly (though not significantly differently from 0) at a rate of approximately −1.2 µm per decade from childhood through adulthood (β coefficient −0.12, 95% CI −0.37 to 0.14, R2=0.03). However, there was no obvious trend for arteriolar calibre (β coefficient −0.02, 95% CI −0.21 to 0.17, R2=0.002). Two striking features of the figure are the dearth of published values between childhood and late life, and the marked spread of mean values in the elderly.
Supplemental material

Epidemiology of retinal vascular calibre by age. Mean retinal arteriolar and venular calibre by age from CheckPoint and published community-based studies with n>1000. Each symbol represents the mean value for a single study. Each study is summarised in online supplementary table 1, and the paper from which that study’s data are drawn is provided in the list of references. ARIC, Atherosclerosis Risk in Communities Study; BDES, Beaver Dame Eye Study; BMES, Blue Mountains Eye Study; CHS: Cardiovascular Health Study; CheckPoint_C, Child Health CheckPoint data of children; CheckPoint_P, Child Health CheckPoint data of parents; MESA, Multi-Ethnic Study of Atherosclerosis; SCORM, Singapore Cohort Study of the Risk Factors for Myopia.
Discussion
Principal findings
We provide the first national population-based percentile values for the pattern and distributions of retinal vessel calibre in Australian 11–12 year old children and midlife adults. Surprisingly, in light of previous literature, mean scores for both CRAE and CRVE were around 0.6 SD smaller in parents than in children. Parent–child correlations were similar for all retinal vessel calibre metrics (CRAE 0.22, CRVE 0.23, AVR 0.18) to studies whose offspring probands were already adults, suggesting that the strong element of heritability in microvascular anatomical structure is largely phenotypically overt within the first decade of life.
Strengths and weaknesses
Strengths include the national recruitment basis for this large study, providing a reference point for microvascular measurement for future Australian studies and also filling a significant international gap in population-based studies of these age groups. Results were largely consistent with previous studies and should generalise to the wider Australian child population.
Limitations include our under-representation of the most disadvantaged sector (reflecting social biases in both recruitment and retention, issues common to large longitudinal studies) and the small number of fathers in the parent sample. We adjusted only for a limited range of potential confounders. While the distributions of parent retinal vessel calibre might have changed slightly had we further adjusted for smoking status, sedentary lifestyle and diet (all previously associated with altered retinal vessel calibre48), their impact on concordance would likely be small because these factors are all strongly socially patterned. By 2019 this cohort will also be able to consider genome-wide association (GWAS) data, potentially shedding further light on the roles of genetic and shared environmental factors. We were not able to measure refractive errors in this study. Retinal vascular calibre measurements may be influenced by refractive errors and refraction is different between children and adults.49 50 However, we would expect these effects to be small, particularly as other sources of systematic bias were minimised (measured on the same day with the same equipment by the same person who was blind to dyadic membership).
Meaning and implications for clinicians and policy makers
Findings for all outcomes are consistent with the previous literature. We showed a larger SD in the parent than the child group, indicating a greater spread of variation in retinal calibre with age. This would be in keeping with greater physiological dysregulation for some individuals with age in response to genetic and risk exposure (eg, higher blood pressure, obesity etc) over multiple decades. Direct comparisons of CRAE and CRVE across the lifecourse and between ethnicities remain difficult due to differences in equipment, software and analysis formulae for CRAE and CRVE. Such factors could well account for the differences between our own and three international studies at mean age 11.1–12.7 years: smaller mean CRAE and CRVE in Chinese twins (CRAE 150.1 µm, CRVE 218.4 µm) and Singapore Chinese children (CRAE 149.3 µm, CRVE 224.6 µm), but much larger values in a smaller study of German children (CRAE 208 µm, CRVE 236.2 µm).22 36 51 These discrepancies highlight the need for a uniform approach to measurement of retinal parameters in future epidemiological investigations. Our post-hoc analysis of published literature suggests both a dearth of population studies between childhood and old age and a likely fall in venular calibre from childhood through midlife. An individual participant meta-analysis would be the next step to more precisely determine how retinal calibre varies by age, incorporating any additional large-scale studies that now exist.
The moderate parent–child correlations of this Australian population are very similar to those in previous studies with much older adult offspring, suggesting that in terms of microvasculature, children do not become more phenotypically similar to their parents between childhood and midlife. Although this is the first study to report intergenerational concordance by parent sex, our marginally stronger father–child than mother–child correlations must be taken with caution due to the small sample of fathers. Like all other parent–child and twin studies, except the Beaver Dam Eye study, our CRVE correlations were marginally larger than those for CRAE.17–23 Previously, Li et al have postulated that the retinal arteriolar phenotype may be more sensitive to environmental influences than the venular phenotype, despite having a significant, moderate degree of inheritance.19 This is further supported by GWAS studies, where only CRVE showed significant associations with the identified gene loci.23 25
Unanswered questions and future research
We provide normative values for retinal vessel calibre for Australian children aged 11–12 years and midlife adults using standardised protocols. Our findings make explicit the need for reliable age-specific normative reference values across the life course. Ideally, this would be extended to large long-running cohort studies with access to clinical outcomes if retinal calibre is to realise the potential as a population screening and risk stratification tool for cardiovascular disease, with or without consideration of otherretinal vascular features such as branching angles, tortuosity and fractal dimension, polygenic risk scores and macrovascular risk.
Acknowledgments
This paper uses unit record data from the Growing Up in Australia, the Longitudinal Study of Australian Children. The study is conducted in partnership between the Department of Social Services (DSS), the Australian Institute of Family Studies (AIFS) and the Australian Bureau of Statistics (ABS). REDCap (Research Electronic Data Capture) electronic data capture tools. More information about this software can be found at: www.project-redcap.org. The authors thank the LSAC and CheckPoint study participants, staff and students for their contributions.
References
Footnotes
Contributors MW, TYW, DPB and KL contributed to the study design. JD, ML and MH contributed to the acquisition of data. ACG, KL, ML and JD conducted the data analysis. JD drafted the manuscript with critical input from all authors. MW and KL supervised JD. MW is the principal investigator of the Child Health CheckPoint and conceived the paper. All authors read and approved the final manuscript.
Funding This work was supported by the National Health and Medical Research Council (NHMRC) of Australia (Project Grants 1041352, 1109355), The Royal Children’s Hospital Foundation (2014-241), the Murdoch Children’s Research Institute (MCRI), The University of Melbourne, the National Heart Foundation of Australia (100660) and Financial Markets Foundation for Children (2014-055, 2016-310). The following authors were supported by the NHMRC: Senior Research Fellowships to MW (1046518) and DPB (1064629); Early Career Fellowship to KL (1091124). The following authors were supported by the National Heart Foundation of Australia: Honorary Future Leader Fellowship to DPB (100369); Postdoctoral Fellowship to KL (101239). MW was supported by Cure Kids New Zealand and ML by a Melbourne International Research Scholarship. The MCRI administered the research grants for the study and provided infrastructural support (IT and biospecimen management) to its staff and the study, but played no role in the conduct or analysis of the trial. DSS played a role in study design; however, no other funding bodies had a role in the study design and conduct; data collection, management, analysis and interpretation; preparation, review or approval of the manuscript; and decision to submit the manuscript for publication. Research at the MCRI is supported by the Victorian Government’s Operational Infrastructure Support Program.
Disclaimer The findings and views reported in this paper are those of the authors and should not be attributed to DSS, AIFS or the ABS.
Competing interests All authors have completed the ICMJE uniform disclosure form at www.icmje.org/coi_disclosure.pdf and declares financial support as described in the funding section. MW received support from Sandoz to present at a symposium outside the submitted work.
Ethics approval The CheckPoint data collection protocol was approved by The Royal Children’s Hospital Melbourne Human Research Ethics Committee (33225D) and The Australian Institute of Family Studies Ethics Committee (14-26).
Provenance and peer review Not commissioned; externally peer reviewed.
Data sharing statement The Longitudinal Study of Australian Children datasets and technical documents are available to researchers at no cost via a licence agreement. Data access requests are co-ordinated by the National Centre for Longitudinal Data. More information is available at https://dataverse.ada.edu.au/dataverse/lsac.
Patient consent for publication Not required.