


Abstract
The seismic structure of Earth's inner core is highly complex, displaying strong anisotropy and further regional variations. However, few seismic waves are sensitive to the inner core and fundamental questions regarding the origin of the observed seismic features remain unanswered. Thus, new techniques to observe different types of inner core waves are imperative to improve data coverage. Here, we detail our method for detecting exotic inner core phases such as PKJKP and PKIIKP, using inner core compressional waves as proof of concept. We use phase weighted stacking on long period data from a global distribution of stations, and employ several synthetic methods, including normal mode summation and SPECFEM, to identify and confirm the inner core phases. We present evidence for two observations of exotic inner core compressional waves, and apply the technique to a previously detected inner core shear wave. A possible new inner core shear wave remains unconfirmed. Additionally, we show how our method is important for rejecting potential observations, and distinguishing between waves with similar traveltime and slowness. The method is most successful for detecting exotic inner core compressional waves, and will provide a new approach for studying the compressional wave structures in the upper inner core.
1 INTRODUCTION
Following the observation of an inner core inside the fluid outer core (Lehmann 1936), seismologists have sought confirmation that it is solid. Mineralogical (Birch 1940; Bullen 1946) and normal mode studies (Dziewoński & Gilbert 1971) provided indirect evidence for inner core solidity. Inner core shear waves such as PKJKP, which would provide direct evidence, have proved difficult to detect. The inner core displays strong lateral and depth variations in its seismic properties, such as anisotropy and hemispheres (Morelli et al.1986; Woodhouse et al.1986; Shearer 1994; Song & Helmberger 1995; Tanaka & Hamaguchi 1997; Creager 1999; Niu & Wen 2001; Deuss et al.2010; Waszek et al.2011; Waszek & Deuss 2011; Deuss 2014). The origins of these various features are not yet known, however. The small-scale structure of the inner core, which may help us to understand the large-scale differences, remains unconstrained. This is in part due to a lack of global data coverage. In this study, we seek to determine a method to observe ‘exotic’ inner core body waves, which will provide new data to study the inner core.
Body waves are the only technique which reveal the short period properties in the inner core. Direct inner core compressional phases, such as PKIKP, are present in single seismograms. These are the body waves most frequently used for investigations into the compressional wave structure of the inner core (Tanaka & Hamaguchi 1997; Creager 1999; Niu & Wen 2001; Waszek et al.2011). However, PKIKP data suffers from poor distribution of ray paths in some regions due to limited earthquake-station geometries, particularly the southern hemisphere (Waszek & Deuss 2011). As a result, the detailed properties within the hemispheres, such as depth and regional variations, have not yet been constrained. ‘Exotic’ inner core compressional phases, such as PKIIKP which reflects from the underside of the inner core boundary (ICB), have smaller amplitudes and are rarely detected on individual traces (Niu & Chen 2008), but may be observed in stacked data. Due to their different inner core ray paths to PKIKP, observations of exotic compressional waves will provide a new type of data for studying the compressional structures of the uppermost inner core, and enhance global data coverage. These phases will also provide constraints on the sharpness of the ICB.
Observations of inner core shear waves, such as PKJKP, are essential to investigate the corresponding shear wave structure in the inner core. However, these waves have proved difficult to observe due to their small amplitudes. The phases lose energy from strong shear attenuation in the inner core, and inefficient conversion from compressional to shear waves at the ICB (Bullen 1951). It has been proposed that the signals are too small to be detected (Doornbos 1974), apart from in exceptional circumstances (Shearer et al.2011). Two of the five reported inner core shear wave observations have been contested (Julian et al.1972; Okal & Cansi 1998), leaving only three observations that have been verified using ‘fluid inner core’ synthetic tests (Deuss et al.2000; Cao et al.2005; Wookey & Helffrich 2008; Cao & Romanowicz 2009). Since body waves are the only technique which provide information regarding small-scale properties, we know little about the detailed shear wave structure of the inner core.
Here, we present and analyse a method for observation of small amplitude exotic inner core waves such as PKIIKP and PKJKP. Using long period, globally distributed data, we employ phase weighted stacking to extract the small inner core signals, and fluid inner core synthetic tests for identification. Since shear waves do not exist in a fluid, this technique allows us to identify inner core shear phases. The fluid inner core test will also reveal inner core compressional waves, since all inner core phases are affected by the solidity of the inner core. Lower compressional wave attenuation in the inner core means that the exotic compressional phases have larger amplitudes compared to inner core shear waves. Hence, they are also ideal for assessing our method.
We will first outline our method for detection, using two observations of exotic inner core compressional waves as proof of concept. Subsequently, we successfully apply the method to the confirmed inner core shear wave observation made by Deuss et al. (2000). We also show a potential new inner core shear wave, which are unable to confirm with certainty, highlighting the difficulty in observing inner core shear waves. For signals comprising two or more inner core phases arriving with similar traveltimes, we show how synthetic techniques allow us to determine the major component of the arrival. Using a compressional wave observation, we compare global stacking with regional stacking, showing how a global distribution of data is needed to remove the effects of mantle structure. We also employ synthetics to examine the influence of 3-D mantle and crustal structure compared to a 1-D model. Finally, we show how our method may be used to reject potential inner core shear wave observations.
2 DATA AND METHOD
2.1 Exotic inner core phases
We search for two types of exotic inner core waves: underside reflected compressional waves, such as PKIIKP, and shear waves, such as PKJKP (Fig. 1). These phases arrive with similar traveltimes and slownesses. Exotic inner core compressional waves (‘II-phases’) reflect from the underside of the ICB. Inner core shear waves (‘J-phases’), travel through the fluid outer core as compressional waves (‘K’) and convert to shear waves (‘J’) at the ICB. They have much smaller amplitudes due to inefficient conversion from compression to shear at the ICB, and the much stronger shear attenuation in the inner core. Other combinations of II and J-phases also exist, including pPKIIKP, SKIIKP, pPKJKP and SKJKP. For comparison, Fig. 1 also shows PKIKP, which travels directly through the inner core and therefore has a larger amplitude than II-phases.
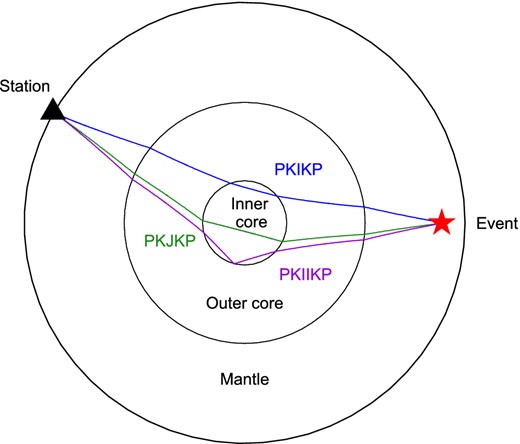
Travel paths of exotic inner core phases. Inner core shear waves, such as PKJKP, traverse deeper regions than the compressional phases, such as PKIKP and PKIIKP.
Here, we search for every direct exotic inner core phase, plus surface reflections, using theoretical arrival times and slownesses from PREM as a guide. The inner core compressional phases we include are PKIIKP, pPKIIKP, sPKIIKP, SKIIKP, pSKIIKP, sSKIIKP, PKIIKS, pPKIIKS, sPKIIKS, SKIIKS, pSKIIKS and sSKIIKS. The inner core shear phases included are PKJKP, pPKJKP, sPKJKP, SKJKP, pSKJKP, sSKJKP, PKJKS, pPKJKS, sPKJKS, SKJKS, pSKJKS and sSKJKS. Phases which are compressional waves in the mantle will have larger amplitudes than shear waves, due to stronger shear attenuation in the mantle. Direct waves usually have larger amplitudes than surface reflections, although this depends on the radiation pattern. Additionally, phases arriving as compressional waves at the seismic station will have larger amplitudes on the vertical component data we use, so we are unlikely to be observing phases arriving as shear waves.
Since inner core phases travel through the deepest parts of the Earth, their take off angles are close to the vertical plane. Shear waves are emitted from near to the nodal planes of the focal mechanisms, whereas compressional waves emanate from the centre of the quadrants. Thus, we are unlikely to observe phases which are emitted as compressional waves and phases emitted as shear waves in the same seismogram. This includes, for example, the combinations of pPKIIKP and sPKIIKP or PKJKP and SKJKP. Examining the focal mechanisms will help us to determine which phases are more likely to be observed for each event.
2.2 Data criteria and processing
We seek data from large events (Mw ≥ 7.3) with deep sources (≥300 km), to generate observable signals and avoid crustal and upper mantle phases. Large and deep events also have impulsive rupture mechanisms, producing short source time functions. For example, the 2004 December 26 Sumatra earthquake proved unsuitable for this study, due to its shallow depth (<15 km) and long source duration (>600 s). The exotic inner core phases are predicted by WKBJ (Chapman 1976) to have maximum signal amplitudes at epicentral distances of ∼130–140°. We therefore obtain data in the distance range of 115–160°. A broad distribution of stations helps to cancel out regional mantle signals in the stack, as localized structures will not be coherent between different stations. The phases are major arc, and thus have a negative slowness.
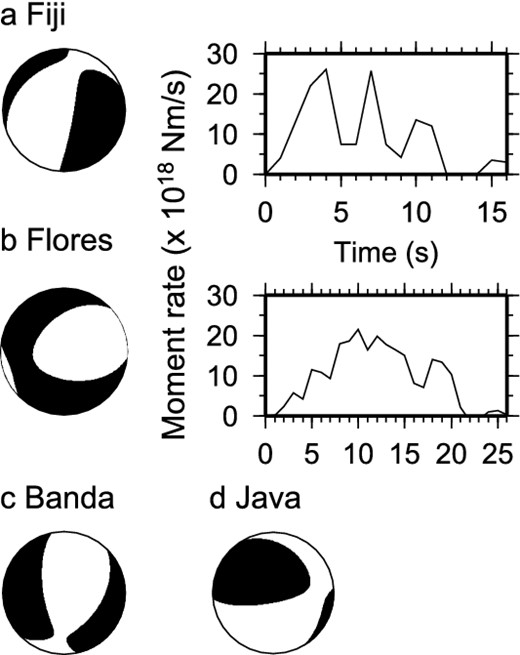
We download broadband vertical component data from IRIS for every suitable earthquake from 1990 January to 2013 June, a total of 15 events (Table 1). In this paper we present results from the Fiji (1994), Flores Sea (1996), Banda Sea (2006) and Java (2007) events. Moment tensor solutions for all four events and published source time functions for two of the events are shown in Fig. 2. The data are bandpass filtered between 0.01 and 0.1 Hz to remove higher frequency energy. The long period filter also means that if the inner core phases arrive slightly earlier or later in individual seismograms, the signals will still stack coherently. Likewise, any pre or post-cursors which arrive within 10 s of the main phase will not be distinct in the stack.
Event information for the 15 earthquakes we examined for exotic inner core waves. Event parameters are taken from the CMT catalogue (Ekström et al.2005).
| Location | Date | Lat | Lon | Depth (km) | Mw |
|---|---|---|---|---|---|
| Fiji | 1994 March 3 | − 17.7 | − 178.1 | 567.8 | 7.6 |
| Bolivia | 1994 June 9 | − 13.8 | − 67.3 | 647.1 | 8.2 |
| Flores | 1996 June 17 | − 7.4 | 123.0 | 584.2 | 7.8 |
| Fiji | 1996 August 5 | − 20.7 | − 178.2 | 555.0 | 7.4 |
| Bonin | 2000 August 6 | 28.9 | 139.7 | 411.3 | 7.3 |
| Kuril | 2002 November 17 | 47.8 | 146.5 | 478.8 | 7.3 |
| Sumatra | 2004 July 25 | − 2.7 | 104.4 | 600.5 | 7.3 |
| Sumatra | 2004 December 26 | 3.1 | 94.3 | 28.6 | 9.0 |
| Banda Sea | 2006 January 27 | − 5.6 | 128.2 | 397.4 | 7.6 |
| Java | 2007 August 8 | − 6.0 | 107.6 | 304.8 | 7.5 |
| Volcano Islands | 2007 September 28 | 21.9 | 143.1 | 275.8 | 7.5 |
| Fiji | 2007 December 9 | − 25.8 | − 177.2 | 149.9 | 7.8 |
| Okhotsk Sea | 2008 July 5 | 54.1 | 153.4 | 610.8 | 7.7 |
| Okhotsk Sea | 2008 November 24 | 54.3 | 154.7 | 502.3 | 7.3 |
| Okhotsk Sea | 2012 August 14 | 50.0 | 145.7 | 598.2 | 7.7 |
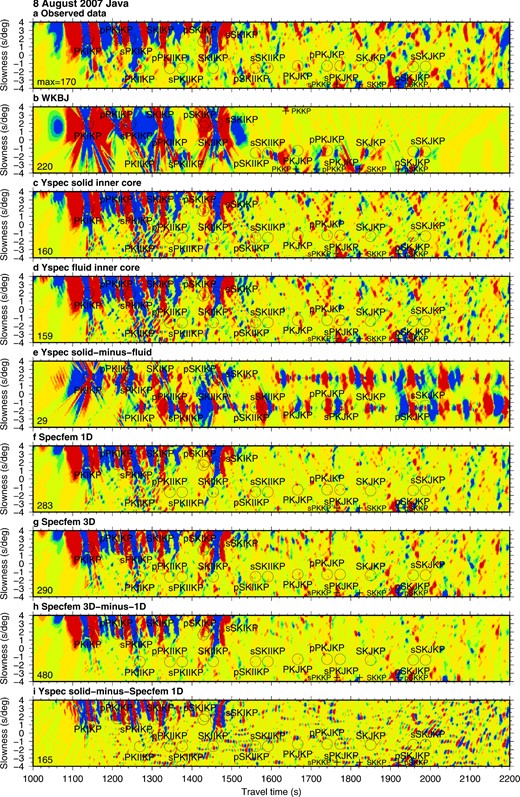
Prior to filtering, we perform quality checks on individual seismograms. PKIKP is the first phase to arrive on the seismograms, and we require this phase to be detected clearly, with minimal noise beforehand. Fig. 3(a) shows the filtered seismograms from the 2007 Java event, with PREM traveltime curves for phases from the inner core (blue), outer core (orange) and mantle (red) superimposed. Included are PP, PPP, PKP, SKP, PKKP, SKKP, PKIKP and SKIKP, plus surface reflections and the exotic inner core phases (purple and green). All of the phases, in their order of arrival, are included in the caption of Fig. 3. Corresponding figures for the Banda, Fiji and Flores events are in the Supporting Information (Fig. S1). Of the inner core waves, only the direct I-phase signals are visible in the individual seismograms. There are no signals from exotic inner core waves distinguishable in the single seismograms because they are so strongly attenuating, and so we must stack and use synthetics tests to detect the phases.
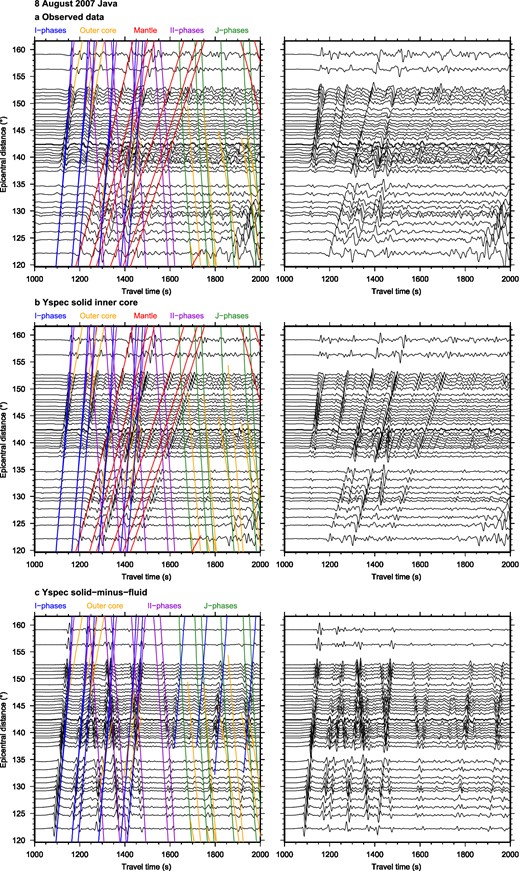
Vertical component observed and synthetic seismograms for the 2007 Java event. The left panels have the PREM traveltime curves of inner core, outer core and mantle phases superimposed; the right panels with no curves are shown for ease of observing the inner core signals. The phases shown are PP, PPP, PKP, SKP, PKKP, SKKP, PKIKP, SKIKP, plus surface reflections and the exotic inner core phases. (a) Observed data. (b) Yspec solid inner core. (c) Yspec solid-minus-fluid difference synthetics. In order of arrival, direct inner core phases (blue): PKIKP and PKiKP, pPKIKP and pPKiKP, sPKIKP and sPKiKP, SKIKP and SKiKP, pSKIKP and pSKiKP, sSKIKP and sSKiKP. Outer core phases (yellow): PKP, SKP, pPKP, sPKP, pSKP, sSKP, PKKP, pPKKP, sPKKP, SKKP, pSKKP, sSKKP. Mantle phases (red): P, PP, pPP, sPP, PPP, pPPP, sPPP. II-phases (purple): PKIIKP, pPKIIKP, sPKIIKP, SKIIKP, pSKIIKP, sSKIIKP. J-phases (green): PKJKP, pPKJKP, sPKJKP, SKJKP, pSKJKP, sSKJKP. The extra inner core phases (blue, 1600–2000 s) included for the solid-minus-fluid synthetics are PcPPKIKP, ScPPKIKP, sPcPPKIKP and sScPPKIKP. Mantle phases are not shown here as they do not exist for the solid-minus-fluid differences. Although PKIKP is visible in all seismograms, there are no coherent signals in the observed or Yspec solid seismograms at the predicted traveltimes for the exotic inner core phases. The data must be stacked using the phase weighted stacking method in order to observe these inner core arrivals. The II and J-phases become clearly visible in individual seismograms for the Yspec solid-minus-fluid synthetics, highlighting the importance of the fluid inner core test for shear phase observations.
2.3 Phase weighted stacking
The data are stacked into vespagrams using the phase weighted stacking method (Schimmel & Paulssen 1997), which has been used to observe J-phases successfully in previous studies (Deuss et al.2000; Cao et al.2005; Wookey & Helffrich 2008). The technique uses weighting to maximize coherent phase signals and suppress incoherent noise, and is thus ideal for extracting small amplitude inner core signals. Several other studies have used array data (Cao et al.2005; Wookey & Helffrich 2008), however we prefer to use a global distribution of stations for stacking. In addition to cancelling regional mantle structure, a global range provides good slowness resolution, which is especially important as the slowness of inner core phases is small (less than 2.0 s deg−1).
3 SYNTHETIC MODELLING
The data contain not only inner core phases but also outer core and mantle signals, plus noise which has not been suppressed by the phase weighted stacking. Phases with inner core slowness (less than 2.0 s deg−1) can arise from scattering in the mantle, coherent interference of different mantle phases, or if random noise happens to be coherent between seismograms. Thus, we need synthetic seismograms in order to correctly identify and verify the inner core signals. We calculate synthetic seismograms for PREM (Dziewoński & Anderson 1981) using WKBJ (Chapman 1976), Yspec (Al-Attar & Woodhouse 2008) and SPECFEM3D_GLOBE (‘Specfem’; Komatitsch et al.2002). WKBJ is a ray tracing method to synthesize specified phases, Yspec uses direct radial integration to generate full wavefield synthetics, and Specfem is a spectral elements code which produces the full wavefield with 3-D structure included. We use Yspec to generate fluid inner core synthetics, by setting inner core shear wave velocity to zero while keeping compressional velocity the same.
We generate the synthetic seismograms using the CMT solution to account for the focal mechanism (Ekström et al.2005; Fig. 2). The seismograms are convolved with a published event source time function if available. For events with no published solution, we do not use any source time function. We investigate the effects of different source time functions for the Flores event for WKBJ and Yspec (Fig. S2), comparing the published result, a triangular-shaped source time function with width equal to the source duration, and no source time function. The published source time function produces most realistic results. The triangular source time function oversimplifies the vespagram to an unacceptable extent. With no source time function, the signals are close to delta pulses, however the J-phases are observable and thus this is preferable when no other option is available. Realistic source time functions were used for the following events: Fiji (1994) and Bolivia (1994) (Lundgren & Giardini 1995), Flores Sea (1996) (Goes et al.1997), Fiji (1996) and Bonin (2000) (Tibi et al.2003) and Sumatra (2004) (Ammon et al.2005). Of the data presented here, the Java and Banda Sea events are not convolved with source time functions. The source time functions for the Fiji and Flores Sea events are shown in Fig. 2. The synthetic seismograms are then filtered and stacked in the same way as the real data.
We investigate the effects of random noise in the synthetic seismograms by using the Gaussian white noise generator function in SAC (Goldstein et al.2003), with a maximum signal-to-noise amplitude ratio of 20. All of our inner core phase observations have been confirmed using synthetics with random noise added. However, as the noise in the data is difficult to quantify accurately, we present results without white noise added in the main paper. The Supporting Information contains vespagrams with noise added to the synthetic data for the exotic inner core phase observations in the Banda Sea, Flores Sea and Java events (Figs S10, S12, S13, S15). Although the noise influences all of the signals in the synthetic vespagrams, it does not change the observability of our inner core signals. As expected, the phase weighted stacking method helps to suppress some of the random noise.
3.1 The fluid inner core test
The fluid inner core test is arguably the most important technique for identifying inner core shear waves (Deuss et al.2000; Cao et al.2005; Wookey & Helffrich 2008). Full wavefield synthetics are generated for PREM, and for PREM with inner core shear velocity set to zero. This simulates a solid inner core and fluid inner core, respectively. The exotic inner core shear waves cannot be detected in single seismograms for the solid inner core (Fig. 3b). We simulate a fluid inner core by setting inner core shear wave velocity to zero, with compressional wave velocity as in PREM.
Setting the inner core shear velocity to zero affects all inner core phases. Since shear waves cannot traverse a fluid inner core, signals which are present in the solid inner core synthetics but absent for a fluid inner core correspond to inner core shear waves (e.g. PKJKP). A fluid inner core also alters the reflection and transmission coefficients of the ICB, so any compressional phases which interact with the inner core will simultaneously be affected. This includes both reflected and transmitted phases, such as PKIIKP and PKIKP.
It is not possible to detect differences between the solid and fluid inner core synthetics by eye in single seismograms as the differences are too subtle. The differences become apparent when we subtract the fluid inner core synthetics from the solid inner core synthetics prior to filtering. This creates ‘solid-minus-fluid’ inner core synthetics, which contain only phases affected by the solidity of the inner core (Fig. 3c). A comparison with the Yspec solid inner core synthetics (Fig. 3b) highlights the efficacy of the method for detecting exotic inner core phases. The solid-minus-fluid seismograms are then filtered and stacked to generate solid-minus-fluid vespagrams.
The fluid inner core test not only allows us to verify inner core phases, but also to identify which phases are not from the inner core. Outer core and mantle phases can arrive with inner core slowness, and the fluid inner core test is used to distinguish these from inner core signals. If a signal is present in the solid and fluid inner core synthetics, and no corresponding arrival is present in the solid-minus-fluid synthetics, then the signal is not an inner core phase.
3.2 Comparison of synthetics
WKBJ (Chapman 1976) generates ray theoretical synthetics for a 1-D earth model, for single seismic phases which are specified by the user. Thus, WKBJ is very useful for isolating individual phases, which is not possible with the other synthetic techniques we use. Due to the limitations of ray theory, non-geometric energy loss effects such as intrinsic attenuation or scattering are not included. We specify only the direct II and J-phases plus corresponding surface reflections, enabling us to use the WKBJ synthetics to locate the inner core signal in the vespagrams by comparing traveltime, slowness and polarity. We also use WKBJ to examine relative predicted amplitudes of individual phases for the different focal mechanisms, by generating separate synthetics for phases which emanate as compressional waves (‘WKBJ P’ synthetics), and for phases which emanate as shear waves (‘WKBJ S’ synthetics).
Yspec (Al-Attar & Woodhouse 2008) uses direct radial integration to calculate full wavefield synthetic seismograms for a 1-D earth model, and includes attenuation and gravity. We use Yspec to perform the fluid inner core test, which helps us to identify the phases that are affected by inner core solidity. This method was first used by Deuss et al. (2000), and is described in detail below.
Specfem (Komatitsch et al.2002) is a spectral elements code with which we produce a full 3-D wavefield, incorporating crustal structure from Crust2.0 (Bassin et al.2000) and mantle shear wave structure using S20RTS (Ritsema et al.1999). Other features include attenuation, gravitation, rotation, ellipticity, oceans and topography. We use Specfem to investigate the effects of 3-D crust and mantle structure compared to the 1-D model PREM. We are unable to model a fluid inner core using Specfem, as the fluid–solid ICB conditions are fixed in the code. The 3-D structure will affect all phases which traverse the mantle, including the exotic inner core phases. Thus, variation between Specfem 1-D and 3-D does not necessarily indicate interference of mantle noise, but may be mantle effects on the inner core phases.
We compare synthetic seismograms from the three different methods to the observed data in Fig. 4. The synthetic seismograms have been generated for the Java event, station SADO (epicentral distance 140.8°), using PREM, and are filtered between 0.01 and 0.1 Hz. All synthetics contain higher frequency waveforms than the observed data (Fig. 4a), as a result of not using a source time function in the synthetics. This is because there is no published source time function available for the Java event, and we previously determined that using no source time function is preferable to using one which is too simplistic (Fig. S2). Phases from the inner core, outer core and mantle are identified in the observed data (Fig. 4a), and signals for the largest amplitude major arc compressional phases are indicated for the exotic inner core WKBJ synthetics (Fig. 4c). As expected, the WKBJ seismograms are least realistic (Figs 4b and c), since only the specified inner core phases are modelled.
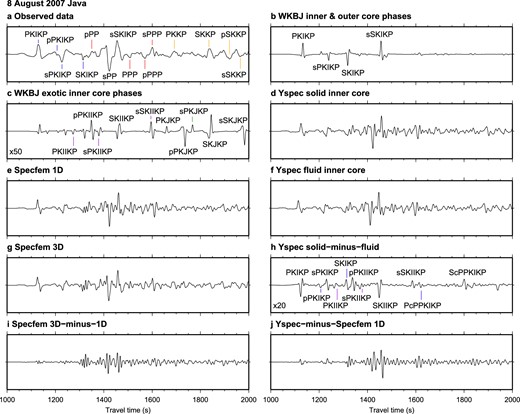
Vertical component observed and synthetic seismograms for the 2007 Java event for station SADO, at an epicentral distance of 140.8°. (a) Observed data, (b) WKBJ synthetics, (c) WKBJ synthetics for exotic inner core phases, (d) Yspec solid inner core synthetics, (e) Specfem 1-D synthetics, (f) Yspec fluid inner core synthetics, (g) Specfem 3-D synthetics, (h) Yspec solid-minus-fluid inner core synthetics, (i) Specfem 3-D-minus-1-D synthetics, (j) Yspec solid-minus-Specfem 1-D synthetics. Identified phases from the inner core, outer core and mantle are indicated in the observed data, and inner core phases are indicated for the WKBJ and Yspec solid-minus-fluid synthetics.
It is not possible to distinguish between the Yspec solid and fluid inner core synthetics by eye alone (Figs 4d and f), however they become clear when we take the difference between the solid and fluid inner core synthetics (Fig. 4h). The Yspec solid inner core synthetics (Fig. 4d) and Specfem 1-D synthetics (Fig. 4e) appear similar to each other, as expected since they both include all phases predicted by PREM. Differences between these synthetics arise from the extra features modelled in Specfem, specifically ellipticity, oceans, topography and rotation. This is observed in the Yspec-minus-Specfem 1-D seismogram, which shows that the largest differences are at the predicted arrival times of mantle phases (Fig. 4j). The Specfem 3-D synthetics show small differences compared to the Specfem 1-D synthetics (Fig. 4g), and the Specfem 3-D-minus-1-D differences are largest for mantle phases (Fig. 4i). Fig. S4 shows synthetic seismograms for all stations for this event, for WKBJ, Yspec and Specfem.
4 INTERPRETATION OF VESPAGRAMS
Vespagrams for the Java event are presented in Fig. 5. Corresponding data for the Banda Sea, Fiji and Flores Sea events are in the Supporting Information (Fig. S3). The PREM theoretical arrival times and slownesses for inner core shear waves and inner core compressional waves are indicated. The exotic inner core waves are major arc phases, with negative slowness between 0 and −2.0 s deg−1. Searching for energy at these times and slownesses is the preliminary stage in phase detection. In the example vespagrams (Fig. 5) we show slownesses between ±4.0 s deg−1, to include the minor arc inner core phases such as PKIKP, in addition to mantle and outer core phases. For WKBJ, we have modelled extra phases in order to identify some arrivals which are not exotic inner core phases. These include minor arc inner core phases such as PKIKP, and outer core phases such as PKKP, plus surface reflections. The maximum amplitude for each panel is indicated in the bottom left corner in nanometres.
Observed and synthetic vespagrams for the 2007 Java event, showing the difference between the synthetic techniques and the fluid inner core test. (a) Observed data, (b) WKBJ synthetics, (c) Yspec solid inner core synthetics, (d) Yspec fluid inner core synthetics, (e) Yspec solid-minus-fluid inner core synthetics, (f) Specfem 1-D synthetics, (g) Specfem 3-D synthetics, (h) Specfem 3-D-minus-1-D synthetics, (i) Yspec solid-minus-Specfem 1-D synthetics. Predicted traveltimes for exotic inner core phases, direct inner core phases and some outer core phases are indicated. The maximum amplitude for each panel is indicated in the bottom left corner in nanometres.
In Fig. 5 we compare the different synthetic techniques for PREM, show an example of the fluid inner core test, and contrast the effects of 1-D versus 3-D mantle structure for Specfem. First, comparing the synthetic techniques, we find that the WKBJ synthetics (Fig. 5b) are the least complicated. The Yspec solid inner core (Fig. 5c) and Specfem 1-D synthetics (Fig. 5f) appear very similar, however there are some differences due to the additional structures modelled in Specfem (Fig. 5i).
Examining the Yspec synthetics and the fluid inner core test, it is difficult to identify differences between the solid inner core (Fig. 5c) and fluid inner core synthetics (Fig. 5d) by eye alone. The solid-minus-fluid synthetics (Fig. 5e) help locate the differences, which correspond to inner core phases (note the much smaller maximum amplitude for the solid-minus-fluid synthetics). As expected, the solid-minus-fluid synthetics show some resemblance to the WKBJ synthetics, with the isolated exotic inner core phases in the negative slowness region from 1500 to 2000 s. The solid-minus-fluid synthetics contain many more phases than WKBJ, especially in the positive slowness region, which corresponds to minor arc inner core waves such as PcPPKIKP. This is because they show every phase affected by the change in inner core solidity, whereas in WKBJ we model only the exotic inner core phases, and the main phases from the inner core, outer core and mantle which might interfere.
The addition of 3-D mantle and crustal structure in Specfem produces noticeable changes within the vespagrams, primarily affecting slownesses larger than ±2.0 s deg−1 (Figs 5f and g). However, we can also see that some phases with inner core slowness are also affected (Fig. 5h). This may include the exotic inner core phases themselves, as they will be affected by structure along their paths through the mantle. The 3-D structure in addition to the fluid inner core test will further help us to confirm the exotic inner core phases.
Some of the noise and unexplained arrivals in the observed data is a result of actual noise in the individual seismograms, although this will be largely suppressed during the phase weighted stacking process. The main source of noise arises from outer core and mantle waves. The synthetic vespagrams show that phases which are not from the inner core can also constructively interfere at slownesses between ±2.0 s deg−1. It is very counter intuitive to detect mantle and outer core signals random appearing at inner core slowness, but it is one of the main problems encountered when observing exotic inner core waves, and easily leads to false claims of observations. Most of the signals interfering with the inner core phases are in fact phases from the outer core and mantle.
One such problem are phases which do not have inner core slowness, but extend into the inner core slowness range of ±2.0 s deg−1 due to their large amplitude. For example, in the WKBJ synthetics (Fig. 5b), the only waves we have modelled which arrive before 1200 s are PKIKP and PKiKP. These phases are minor arc with positive slowness, and predicted to arrive at 1138 and 1141 s, with slownesses of 1.75 and 2.1 s deg−1, respectively. However, Fig. 5(b) shows that the arrivals have a slowness which ranges from in excess of 4.0 to −4.0 s deg−1. Strong arrivals from the outer core and mantle, with slowness larger than ±2.0 s deg−1, will also extend into the inner core slowness range.
There are also phases with slowness between ±2.0 s deg−1 that are not from the inner core. Since slowness is a measure of the arrival angle of the phase, it follows that any multiply reflected waves which arrive close to the vertical direction will have small slownesses. The Yspec solid-minus-fluid synthetics (Fig. 5e) show only inner core phases, and we can compare these to the Yspec solid and fluid inner core vespagrams (Figs 5c and d) to determine the non-inner core signals in the slowness range 0 to −2.0 s deg−1. We have identified some of these signals as outer core phases such as PKKP, however it is not possible to identify all of the arrivals, particularly complicated mantle waves. This is not a problem, however; if the signals are present in the Yspec synthetics, we will be able to determine whether they are inner core phases or not via the fluid inner core test.
5 ‘II’-PHASE OBSERVATIONS
Our method is very successful for detecting II-phases, which also serves as proof of concept for observing J-phases. We present two examples of exotic inner core II compressional waves. We also show how WKBJ can be used to infer which phases are more likely to be observed for different focal mechanisms. As a clear PKIKP is one of our requirements for data quality, we first show vespagrams for the inner core phase PKIKP for the Banda Sea event for comparison (Fig. 6). We observed a strong PKIKP signal, which arrives initially as the negative polarity red signal at 1108 s (Fig. 6a). We confirm the observation with WKBJ (Fig. 6b). The signal is present in both the Yspec solid and fluid inner core synthetics (Figs 6c and d), and there is a positive polarity blue signal at the same time in the solid-minus-fluid synthetics (Fig. 6e). This indicates that the fluid inner core has magnified the PKIKP signal. There is only a small difference between the Specfem 1-D and 3-D synthetics (Figs 6f and g), confirmed with the Specfem 3-D-minus-1-D differences (Fig. 6). The corresponding pPKIKP vespagrams from the Banda Sea event, and PKIKP and pPKIKP vespagrams from the Flores Sea event are presented in the Supporting Information (Figs S5–S7).
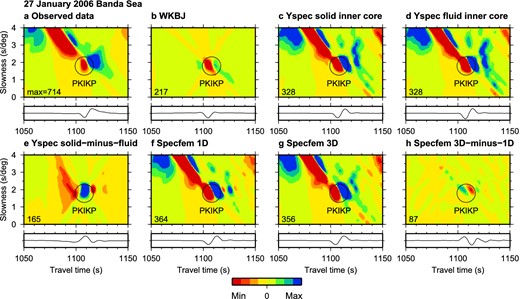
Vespagrams for the 2006 Banda Sea event, showing PKIKP. Seismograms beneath the vespagrams are cross-sections through the slowness of maximum inner core phase amplitude. (a) Observed data, (b) WKBJ synthetics, (c) Yspec solid inner core synthetics, (d) Yspec fluid inner core synthetics, (e) Yspec solid-minus-fluid synthetics, (f) Specfem 1-D synthetics, (g) Specfem 3-D synthetics, (h) Specfem 3-D-minus-1-D synthetics. The PKIKP signal is the red arrival at 1108 s.
5.1 Banda Sea, 2006 January 27
We find strong evidence for a pPKIIKP phase in the Banda Sea event of 2006, arriving as a negative polarity signal at 1375 s, with a slowness of −1.4 s deg−1 (Fig. 7a). The WKBJ (Fig. 7b) and Yspec solid inner core synthetics (Fig. 7e) both contain a signal with the same polarity at the predicted time and slowness. There is no arrival for a fluid inner core (Fig. 7f), and correspondingly a signal is present in the solid-minus-fluid synthetics (Fig. 7g). The Specfem 3-D-minus-1-D synthetics predict some influence from 3-D mantle variation at the time and slowness as the pPKIIKP signal (Fig. 7j). Luckily, the Specfem 3-D synthetics provide a much better match the observed data in amplitude and waveform of the pPKIIKP signal than then Specfem 1-D results (Figs 7h and i), due to the 3-D model affecting the mantle paths of the II-phase.
Vespagrams for the 2006 Banda Sea event. Seismograms beneath the vespagrams are cross-sections through the slowness of maximum inner core phase amplitude. (a) Observed data, (b) WKBJ synthetics, (c) WKBJ P synthetics, (d) WKBJ S synthetics, (e) Yspec solid inner core synthetics, (f) Yspec fluid inner core synthetics, (g) Yspec solid-minus-fluid synthetics, (h) Specfem 1-D synthetics, (i) Specfem 3-D synthetics, (j) Specfem 3-D-minus-1-D synthetics. The pPKIIKP signal is the negative amplitude arrival at 1375 s, verified with the fluid inner core test. The sPKIIKP signal cannot be confirmed. The sPKIIKP phase amplitude is predicted to be over 10 times smaller than the pPKIIKP signal (note the different amplitude scales).
The Specfem 3-D synthetics (Fig. 7i) also provide a better match to the observed data than the Specfem 1-D synthetics (Fig. 7h) for the later arrivals around 1425 s. The interaction with a positive amplitude mantle signal, which arrives between 1360 and 1370 s with a slowness of between −1.7 and −1.2 s deg−1, is the reason why the pPKIIKP phase appears to arrive slightly later in the Yspec solid inner core synthetics compared to the solid-minus-fluid results. This highlights the difficulty of making accurate traveltime measurements from the vespagrams, as even small amplitude noise will affect the position of the signal maxima. The addition of random noise to the synthetics slightly decreases the amplitudes of the inner core signal, however it can still be clearly observed throughout the vespagrams (Fig. S10), and confirmed with the fluid inner core test.
Although sPKIIKP is also predicted to arrive at 1410 s, we do not observe it. There is no energy at the predicted time or slowness in any of the synthetics. Examining the moment tensor solution for the Banda Sea 2006 earthquake (Fig. 2c), we see that the quadrant centres are close to vertical. Thus we would expect to preferentially detect phases which emit as compressional waves. We confirm this with WKBJ synthetics, which show that sPKIIKP (Fig. 7d) is predicted to be over 10 times smaller than pPKIIKP (Fig. 7c). Thus, the absent sPKIIKP signal is a result of the earthquake source radiation pattern.
As this is our most robust observation, we also investigate the effects of using regional data, by stacking for stations located in North America only (Fig. S11). The pPKIIKP signal is observed in the regional stack as a negative amplitude arrival at 1380 s (Fig. S11a). The signal is confirmed with the Yspec fluid inner core test (Figs S11e–g). We find that the observed data are much noisier for the regional stack, and the pPKIIKP signal is less clear among the background noise, due to localized mantle structure. The effects of regional mantle structure can also be observed in the Specfem results (Figs S11h–j), which show significant influence on the inner core phase. Although the global stack may cancel out regional inner core structure, the regional stack is unable to remove much 3-D mantle structure.
5.2 Flores Sea, 1996 June 17
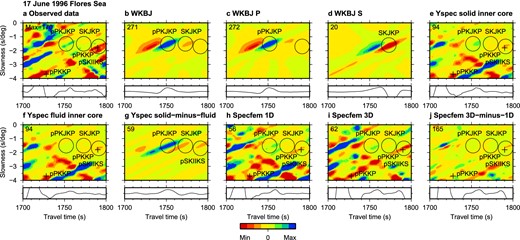
We observe a second pPKIIKP signal in the Flores Sea event of 1996, visible as a negative polarity arrival at 1360 s, with a slowness of −1.4 s deg−1 (Fig. 8a). The phase is identified in the WKBJ synthetics by a signal with the same arrival time and polarity (Fig. 8b), and verified with the Yspec fluid inner core test (Figs 8e–g). Some mantle energy is predicted to arrive at the time of the pPKIIKP signal by the 3-D mantle model (Fig. 8j), however the inner core phase remains visible in both Specfem 1-D and 3-D synthetics (Figs 8g and h). The 3-D mantle structure in Specfem improves the appearance of some of the other phases in the vespagram (Fig. 8i), although the Specfem 1-D synthetics match the observed data more closely in the vicinity of the pPKIIKP signal, indicating that the mantle structure may not be modelled accurately here (Fig. 8h). Adding random noise to the synthetics decreases the relative amplitude of the inner core signal compared to the background signals, and means that a very small red signal is present in the Yspec fluid inner core synthetics (Fig. S12). However, the pPKIIKP phase can still be identified.
Vespagrams for the 1996 Flores Sea event. Seismograms beneath the vespagrams are cross-sections through the slowness of maximum inner core phase amplitude. (a) Observed data, (b) WKBJ synthetics, (c) WKBJ P synthetics, (d) WKBJ S synthetics, (e) Yspec solid inner core synthetics, (f) Yspec fluid inner core synthetics, (g) Yspec solid-minus-fluid synthetics, (h) Specfem 1-D synthetics, (i) Specfem 3-D synthetics, (j) Specfem 3-D-minus-1-D synthetics. The inner core phase pPKIIKP is the negative amplitude arrival at 1365 s, verified with the fluid inner core test. 3-D mantle structure in Specfem improves the appearance of the wavefield. The SKIIKP phase is predicted to overlap with the pPKIIKP phase, but with an amplitude 20 times smaller, thus explaining its non-observation.
The phase SKIIKP is predicted to arrive at 1380 s, but is not observed. Energy is visible close to the predicted arrival time in the observed data (Fig. 8a). A corresponding positive polarity signal appears in both the Yspec solid and fluid inner core synthetics (Figs 8e and f). However this signal is not present in the WKBJ (Fig. 8b) nor the Yspec solid-minus-fluid inner core synthetics (Fig. 8g), suggesting that it is a mantle phase generated in PREM. Just as for the Banda Sea event, in the focal mechanism the quadrant centres are close to the vertical plane (Fig. 2b), corresponding to stronger signals for phases emitted as compressional waves. The WKBJ P and S synthetics confirm that the predicted amplitude of the pPKIIKP phase (Fig. 8c) is over 20 times larger than the SKIIKP phase (Fig. 8d). Furthermore, the second part of the pPKIIKP signal is predicted to overlap with and obscure the SKIIKP arrival. Hence, it is likely that SKIIKP is too small to be observe, in addition to being masked by a mantle signal.
6 ‘J’-PHASE OBSERVATION
We now extend the procedure to J-phases. We re-examine the pPKJKP and SKJKP observation in the Flores Sea event made by Deuss et al. (2000), to confirm that the method is successful at identifying inner core shear waves. Here, we also show how our technique may be used to determine which of the phases is the major component of the signal, when two inner core waves arrive with similar traveltimes and slownesses.
6.1 Flores Sea, 1996 June 17
We revisit the first confirmed observation of an inner core shear wave in the Flores Sea event of 1996 (Deuss et al.2000). Two positive amplitude arrivals are visible at 1758 s, −1.5 s deg−1, which are a combination of pPKJKP and SKJKP (Fig. 9a). They were originally verified using the fluid inner core test with normal mode synthetics. Here, we reconfirm the observation using Yspec synthetics and Specfem (Figs 9e–j). The addition of random noise in the synthetics enhances the amplitude of the inner core signal compared to the background wavefield, further confirming the observation (Fig. S13).
Vespagrams for the 1996 Flores Sea event. Seismograms beneath the vespagrams are cross-sections through the slowness of maximum inner core phase amplitude. (a) Observed data, (b) WKBJ synthetics, (c) WKBJ P synthetics, (d) WKBJ S synthetics, (e) Yspec solid inner core synthetics, (f) Yspec fluid inner core synthetics, (g) Yspec solid-minus-fluid synthetics, (h) Specfem 1-D synthetics, (i) Specfem 3-D synthetics, (j) Specfem 3-D-minus-1-D synthetics. The pPKJKP and SKJKP signal is the positive amplitude arrival at 1758 s in the observed data. The signal was verified by Deuss et al. (2000) using normal mode synthetics; here we confirm the arrival using Yspec. The inclusion of 3-D structure in Specfem improves the correspondence of non-inner core signals with slowness less than −2.0 s deg−1. The pluses indicate arrivals from two branches of pPKKP. The pPKJKP has an amplitude over 20 times larger than SKJKP, and although the phases overlap, this indicates that the major component of the signal is therefore pPKJKP.
An issue with the original observation was a lack of similarity between the observed data and the PREM synthetics. For example, some of the signals between arrival times 1710 to 1750 s, with slownesses 0 to −2.0 s deg−1 are not predicted accurately by PREM. This similarity is improved with 3-D mantle structure in the Specfem synthetics (Fig. 9i), meaning that although the additional signals appear with inner core slowness, they are not actually inner core phases. The Specfem 3-D-minus-1-D synthetics show that negligible mantle energy is predicted to arrive at the traveltime and slowness of the pPKJKP signal, further verifying the observation as an inner core phase (Fig. 9j). Two branches of the outer core phase pPKKP are indicated by pluses, identified with WKBJ in Fig. S14.
It is unlikely that the pPKJKP and SKJKP contribute to the signal equally, due to the strong directionality of the inner core phases. Examining the focal mechanism (Fig. 2b), the centre of the quadrants are close to the vertical plane. This indicates that phases emitted as compressional waves are strongest. In the WKBJ P and S synthetics (Figs 9c and d), pPKJKP is predicted to be an order of magnitude larger than SKJKP. Thus, the signal is most likely primarily composed of pPKJKP.
7 UNCONFIRMED J-PHASE OBSERVATIONS
The search for inner core shear wave signals is difficult due to their small amplitude and the interference from other mantle and outer core phases. We find many instances of unconfirmed, misindentified or absent signals, which highlight the importance of the fluid inner core test for verification. Here, we show one potential but unconfirmed observation from the Java event and two examples of unsuccessful observations from the Java and Fiji events. For comparison, the PKIKP and pPKIKP signals from the Java event are shown in Figs S8 and S9.
7.1 Java, 2007 August 8
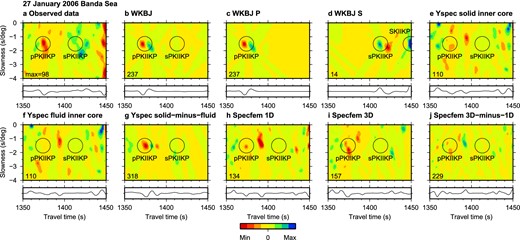
In the 2007 Java event, we find an unconfirmed pPKJKP signal, and absent sPKJKP and SKJKP phases. The possible pPKJKP phase is detected as a negative polarity red arrival at 1742 s, with slowness −1.3 s deg−1 (Fig. 10a). A signal with the same polarity and similar arrival time and slowness is present in the WKBJ (Fig. 10b) and Yspec solid inner core synthetics (Fig. 10e). This phase is absent for a fluid inner core (Fig. 10f), with energy at the predicted time and slowness in the solid-minus-fluid synthetics (Fig. 10g). The 3-D mantle structure in Specfem improves the appearance of the inner core signal, but not the mantle arrivals (Fig. 10h), and the addition of random noise in the synthetics does not affect the fluid inner core test (Fig. S15). We identify the outer core phase sPKKP using WKBJ (Fig. S16), and it is indicted in the vespagram by a plus. However, the potential pPKJKP signal has a smaller amplitude compared to the background wavefield in the observed data than in the synthetic signal. Although the synthetic signal passes the fluid inner core test, we cannot be certain it is the same phase as the signal in the observed data. Hence, this observation remains unconfirmed.
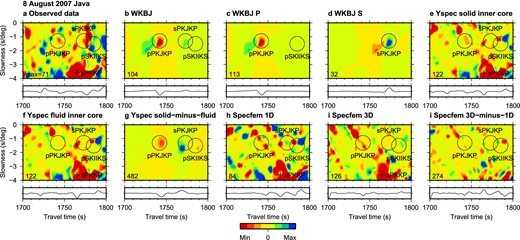
Vespagrams for the 2007 Java event. Seismograms beneath the vespagrams are cross-sections through the slowness of maximum inner core phase amplitude. (a) Observed data, (b) WKBJ synthetics, (c) WKBJ P synthetics, (d) WKBJ S synthetics, (e) Yspec solid inner core synthetics, (f) Yspec fluid inner core synthetics, (g) Yspec solid-minus-fluid synthetics, (h) Specfem 1-D synthetics, (i) Specfem 3-D synthetics, (j) Specfem 3-D-minus-1-D synthetics. The potential new pPKJKP observation is the negative amplitude arrival at 1742 s. The signal is confirmed with the fluid inner core test, however as the amplitude is smaller than many of the surrounding arrivals, we cannot verify this as an inner core signal with absolute certainty. The 3-D structure in Specfem provides some improvement on the inner core signal, but not the appearance of the wavefield. The pPKJKP signal is predicted to have an amplitude approximately four times that of the sPKJKP phase. Thus, sPKJKP may be hidden by another arrival. The sPKKP arrival is indicated by a plus.
sPKJKP and pSKIIKS are predicted to arrive within the same time window, however there is no obvious candidate for either phase. Examining the WKBJ P and S synthetics, we find that the pSKIIKS signal is too small to be observed (Fig. 10c), since incoming shear waves have small amplitudes on vertical component seismograms. sPKJKP is predicted to be about four times smaller than the pPKJKP signal (Fig. 10d), so it is likely that the large positive amplitude signal at 1780 s, −1.0 s deg−1 is masking its arrival.
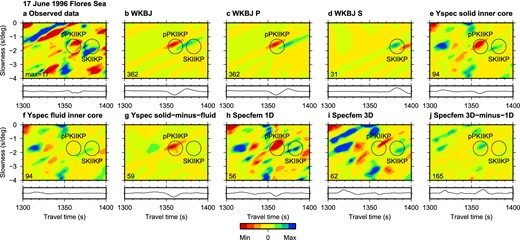
SKJKP is predicted to arrive at 1850 s with a slowness of −2.0 s deg−1. A positive arrival at this time and slowness therefore seems a likely candidate (Fig. 11a), with a similar signal in the WKBJ synthetics (Fig. 11b) and the Yspec solid-minus-fluid synthetics (Fig. 11e). However, the same signal is present in both the Yspec solid and fluid inner core synthetics (Figs 11c and d), and therefore this cannot be solely an inner core phase. Thus, it is not possible to confirm whether the green arrival in the observed data is SKJKP or another phase. Specfem 3-D matches the observed data better in the 1850–1900 s time window (Fig. 11g) than Specfem 1-D (Fig. 11f), however neither Specfem synthetics match well in the vicinity of SKJKP. A lack of energy near to the predicted SKJKP arrival time in the Specfem 3-D-minus-1-D synthetics suggests that SKJKP is not hidden by 3-D mantle noise, but is too small to detect within the PREM background wavefield (Fig. 11h). Thus, we conclude that we cannot observe SKJKP. An arrival of SKKP is indicated by a plus. Fig. S17 shows how this is identified with WKBJ.
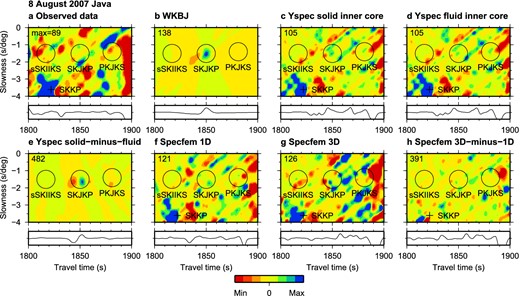
Vespagrams for the 2007 Java event. Seismograms beneath the vespagrams are cross-sections through the slowness of maximum inner core phase amplitude. (a) Observed data, (b) WKBJ synthetics, (c) Yspec solid inner core synthetics, (d) Yspec fluid inner core synthetics, (e) Yspec solid-minus-fluid synthetics, (f) Specfem 1-D synthetics, (g) Specfem 3-D synthetics, (h) Specfem 3-D-minus-1-D synthetics. The SKKP arrival is indicated by a plus. The SKJKP signal is predicted to be a positive amplitude arrival at 1830 s, but is hidden behind another signal.
7.2 Fiji, 1994 March 9
PKJKP is predicted to arrive at 1630 s with slowness of −1.5 s deg−1 in the WKBJ synthetics (Fig. 12b). Although there is a phase visible at a similar time and slowness in the observed data (Fig. 12a), the Yspec synthetics indicate that this is not PKJKP because signals are present in both the solid and fluid inner core synthetics (Figs 12c and d). The solid-minus-fluid synthetics (Fig. 12e) corresponds well with the WKBJ synthetics however. This indicates that the PKJKP is hidden behind a mantle signal. A large negative polarity arrival at the predicted time of sSKIIKP is not present in the Yspec solid or fluid inner core synthetics (Figs 12d and c), but can be seen in the solid-minus-fluid difference (Fig. 12e). The signal is also not observed in the Specfem 1-D synthetics (Fig. 12f), however a negative polarity phase is present for Specfem 3-D (Fig. 12g). This suggests that the signal in the observed data is a result of 3-D mantle structure, and hides the small sSKIIKP arrival. Arrivals of PKKP are indicated by pluses, identified in Fig. S18 using WKBJ.
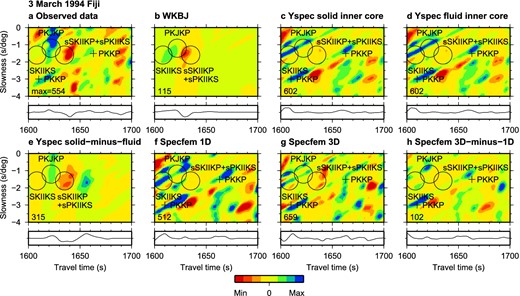
Vespagrams for the 1994 Fiji event. Seismograms beneath the vespagrams are cross-sections through the slowness of maximum inner core phase amplitude. (a) Observed data, (b) WKBJ synthetics, (c) Yspec solid inner core synthetics, (d) Yspec fluid inner core synthetics, (e) Yspec solid-minus-fluid synthetics, (f) Specfem 1-D synthetics, (g) Specfem 3-D synthetics, (h) Specfem 3-D-minus-1-D synthetics. The pluses indicate arrivals of PKKP. The PKJKP signal is suggested to be a positive amplitude arrival at 1620 s, however the synthetics and observed data do not show good enough correspondence to identify any inner core signals. Furthermore, the fluid inner core test shows that other phases arrive at the same time, masking the PKJKP signal.
8 DISCUSSION
The main obstacle to observing exotic inner core waves is interference from other larger arrivals, and we require an optimal method to consistently extract the small signals. Phase weighted stacking suppresses incoherent signals, such as phases from regional mantle structure and other noise. We also find that a global distribution of stations helps to further cancel mantle variation. High density arrays may be more suitable for regional inner core studies, because global stacks average structure in the inner core (Wookey & Helffrich 2008). On the other hand, regional studies may not be able to average out localized structure in the mantle, as observed in Fig. S11. Also, because inner core waves have a small slowness, a regional array may not give enough slowness resolution. Thus, we applied global stacking in the current study. For the first time, we have used Specfem to incorporate the influence of 3-D mantle structure. We have also investigated the effects of adding random noise to our synthetic data. The limited impact on the inner core signals highlights the efficacy of the phase weighted stacking for minimizing incoherent noise.
We started by using II-phases as proof of concept, since they may be detected in single seismograms (Niu & Chen 2008), and are more straightforward to identify than J-phases. This is a result of lower compressional wave attenuation in the inner core, and smaller energy loss at the ICB. Furthermore, their earlier arrival times in the vespagram means less interference from other waves. We find that our method is successful in identifying exotic inner core compressional phases, and therefore provides a new approach to studying inner core compressional wave structure. In the epicentral distance range 115–160°, the exotic compressional phases turn between 140 and 360 km deep in the inner core. Thus, these phases are ideal for investigating the upper layers of the inner core. However, the global distribution of ray paths we employ here means that any regional structure in the upper inner core will be averaged. Indeed, the hemispherical variation in seismic velocity and anisotropy may explain why only a few II-phases could be detected (Tanaka & Hamaguchi 1997; Niu & Wen 2001; Deuss et al.2010; Waszek & Deuss 2011). In future, selecting regional data based on the location and direction of ray paths through the inner core might allow more detailed investigations of the inner core to be performed. However, such studies may suffer from increase mantle interference (Fig. S11).
We also successfully applied our method to a previously observed inner core shear wave (Deuss et al.2000), however were unable to make any further confirmed observations of J-phases. Although we find one potential inner core shear wave which passes the fluid inner core test (Fig. 10), we cannot confirm the observation due to its low amplitude compared to the background wavefield. The global stacking which we used to enhance the inner core phases prevents us from observing detailed inner core shear structures. In the epicentral distance range 115–160°, the shear phases turn between 850 and 1050 km deep in the inner core. Combined with the global distribution of stations, this means that the long rays sample most of the inner core. Thus, with global data, it is not possible to detect any hemispherical structure in shear velocity, as was previously observed using normal modes (Deuss et al.2010). Furthermore, any shear wave splitting from anisotropy would differ between stations due to the variation in ray path directions and turning depths, and would therefore be suppressed by the phase weighted stacking. Due to the long period filter, splitting of more than 10 s is required in order to be resolved. Indeed, lateral inner core structure may be the reason for the difficulty in making J-phase observations, since different arrival times between stations would prevent coherent stacking. The use of regional data may therefore help to detect more inner core shear waves, although this will be complicated by regional mantle structure.
For the focal mechanisms used in this study, we find that exotic inner core phases which emit as compressional waves are predicted to have larger amplitudes. Also, phases which arrive as shear waves are predicted to have very small amplitudes because we are using the vertical component only. Thus, the optimal waves for observation are PKIIKP, pPKIIKP, PKJKP and pPKJKP, depending on focal mechanism. This is indeed confirmed by our observations of pPKIIKP and pPKJKP, but no observations of the corresponding phases emitted as shear waves.
Comparing the synthetic techniques, the Yspec fluid inner core test is the most useful method for identifying the inner core phases, particularly the solid-minus-fluid inner core results. We find that the WKBJ synthetics are ideal for calculating theoretical amplitudes of single phases, and determining the most likely candidate for the observed signals in the data. For example, Fig. 9 shows that the pPKJKP+SKJKP signal detected by Deuss et al. (2000) is primarily composed of pPKJKP. The inclusion of 3-D mantle and crust models in Specfem is a useful tool to identify potential mantle interference, or the effects of 3-D mantle structure on the inner core phases themselves.
We are unable to make inferences about inner core compressional or shear attenuation using our method for two reasons. First, factors other than attenuation can affect the amplitudes of the exotic inner core phases, including variations in velocity and anisotropy (Waszek & Deuss 2013). Secondly, since phase weighted stacking artificially enhances coherent signals, using amplitude measurements from the vespagrams may give inaccurate results. The next step to understanding inner core structure with these data is to alter inner core velocity and quality factor in the synthetics, and to include 3-D inner core structure.
9 CONCLUSIONS
Although exotic inner core phases are extremely difficult to detect, they can be observed using phase weighted stacking of long period global data and making comparisons with synthetics for a solid and fluid inner core. Two new observations of exotic inner core compressional wave pPKIIKP provide proof of concept of our method, which we apply to a previously confirmed observation of pPKJKP+SKJKP. A potential new observation of pPKJKP remains unconfirmed due to its relatively small amplitude. The method is most successful for inner core compressional waves, and provides a new approach to studying the compressional velocity structure of the upper inner core. Synthetic seismograms are a powerful technique to distinguish between two phases which arrive with similar traveltimes and slowness. Further investigation into lateral inner core structure using regional data is required.
LW is funded by a research fellowship from Homerton College, University of Cambridge. AD is funded by the European Research Council under the European Community's Seventh Framework Programme (FP7/2007-2013)/ERC grant agreement number 204995, and a Leverhulme Prize. We thank three anonymous reviewers for helpful and constructive comments. We also thank David Al-Attar for help with the Yspec synthetic code. The facilities of the IRIS Data Management System, and specifically the IRIS Data Management Center, were used for access to waveform and metadata required in this study. The IRIS DMS is funded through the National Science Foundation and specifically the GEO Directorate through the Instrumentation and Facilities Program of the National Science Foundation under Cooperative Agreement EAR-1063471.
REFERENCES
SUPPORTING INFORMATION
Additional Supporting Information may be found in the online version of this article:
Figure S1. Observed seismograms for the (a) 2006 Banda Sea, (b) 1994 Fiji and (c) 1996 Flores Sea events, with the PREM traveltime curves of inner core phases superimposed.
Figure S2. Synthetic vespagrams for the 1996 Flores Sea event, showing the effects of different source time functions for WKBJ (top row) and Yspec (bottom row). Cross-sections are taken through slowness −1.5 s deg−1. (a,d) Realistic source time function (Goes et al.1997); (b,e) basic triangle source time function; (c,f) no source time function.
Figure S3. Vespagram of observed data from the (a) 2006 Banda Sea, (b) 1994 Fiji and (c) 1996 Flores Sea events. PREM theoretical arrival times and slownesses of exotic inner core phases are indicated.
Figure S4. Synthetic seismograms for the 2007 Java event, with the PREM traveltime curves of inner core phases superimposed. (a) WKBJ, (b) Yspec solid inner core, (c) Yspec fluid inner core, (d) Yspec solid-minus-fluid inner core, (e) SPECFEM with PREM, (f) SPECFEM with S20RTS and Crust2.0.
Figure S5. Vespagrams for the 2006 Banda Sea event, showing PKIKP. Seismograms beneath the vespagrams are cross-sections through the slowness of maximum inner core phase amplitude. (a) Observed data, (b) WKBJ synthetics, (c) Yspec solid inner core synthetics, (d) Yspec fluid inner core synthetics, (e) Yspec solid-minus-fluid synthetics, (f) Specfem 1D synthetics, (g) Specfem 3D synthetics, (h) Specfem 3D-minus-1D synthetics. The PKIKP signal is the red arrival at 1108 s.
Figure S6. Vespagrams for the 1996 Flores Sea event, showing PKIKP. Seismograms beneath the vespagrams are cross-sections through the slowness of maximum inner core phase amplitude. (a) Observed data, (b) WKBJ synthetics, (c) Yspec solid inner core synthetics, (d) Yspec fluid inner core synthetics, (e) Yspec solid-minus-fluid synthetics, (f) Specfem 1D synthetics, (g) Specfem 3D synthetics, (h) Specfem 3D-minus-1D synthetics. The PKIKP signal is the red arrival at 1119 s.
Figure S7. Vespagrams for the 2006 Banda Sea event with random white noise included in the synthetics, generated using the Gaussian white noise generator function in SAC (Goldstein et al.2003). The noise is generated to have a maximum signal-to-noise amplitude ratio of 20. Seismograms beneath the vespagrams are cross-sections through the slowness of maximum inner core phase amplitude. (a) Observed data, (b) WKBJ synthetics, (c) WKBJ P synthetics, (d) WKBJ S synthetics, (e) Yspec solid inner core synthetics, (f) Yspec fluid inner core synthetics, (g) Yspec solid-minus-fluid synthetics, (h) Specfem 1D synthetics, (i) Specfem 3D synthetics, (j) Specfem 3D-minus-1D synthetics. The pPKIIKP signal is the negative amplitude arrival at 1375 s.
Figure S8. Vespagrams for the 1996 Flores Sea event, with random white noise included in the synthetics, generated using the Gaussian white noise generator function in SAC (Goldstein et al.2003). The noise is generated to have a maximum signal-to-noise amplitude ratio of 20. Seismograms beneath the vespagrams are cross-sections through the slowness of maximum inner core phase amplitude. (a) Observed data, (b) WKBJ synthetics, (c) WKBJ P synthetics, (d) WKBJ S synthetics, (e) Yspec solid inner core synthetics, (f) Yspec fluid inner core synthetics, (g) Yspec solid-minus-fluid synthetics, (h) Specfem 1D synthetics, (i) Specfem 3D synthetics, (j) Specfem 3D-minus-1D synthetics. The inner core phase pPKIIKP is the negative amplitude arrival at 1365 s.
Figure S9. Vespagrams for the 1996 Flores Sea event, with random white noise included in the synthetics, generated using the Gaussian white noise generator function in SAC (Goldstein et al.2003). The noise is generated to have a maximum signal-to-noise amplitude ratio of 20. Seismograms beneath the vespagrams are cross-sections through the slowness of maximum inner core phase amplitude. (a) Observed data, (b) WKBJ synthetics, (c) WKBJ P synthetics, (d) WKBJ S synthetics, (e) Yspec solid inner core synthetics, (f) Yspec fluid inner core synthetics, (g) Yspec solid-minus-fluid synthetics, (h) Specfem 1D synthetics, (i) Specfem 3D synthetics, (j) Specfem 3D-minus-1D synthetics. The pPKJKP and SKJKP signal is the positive amplitude arrival at 1758 s in the observed data. The plusses indicate arrivals from two branches of pPKKP.
Figure S10. Synthetic vespagrams for the 1996 Flores Sea event, showing the relative amplitudes and arrival times of outer core phases with respect to the inner core signals. Cross-sections are taken through slowness −1.5 s deg−1. (a) J and I phases, (b) pPKKP, (c) SKKP, (d) PcPPKIIKP, (e) all phases. Note two separate pPKKP arrivals, which correspond to two branches with different slownesses but similar arrival times.
Figure S11. Synthetic vespagrams for the 2007 Java event, showing the relative amplitudes and arrival times of outer core phases with respect to the inner core signals. Cross-sections are taken through slowness −1.5 s deg−1. (a) J and I phases, (b) pPKKP, (c) sPKKP, (d) SKKP, (e) PKKS, (f) all phases.
Figure S12: Synthetic vespagrams for the 1994 Fiji event, showing the relative amplitudes and arrival times of outer core phases with respect to the inner core signals. Cross-sections are taken through slowness −1.5 s deg−1. (a) J and I phases, (b) PKKP, (c) pPKKP, (d) sPKKP, (e) all phases. Note two separate PKKP arrivals, which correspond to two branches with different slownesses. (Supplementary Data).
Please note: Oxford University Press is not responsible for the content or functionality of any supporting materials supplied by the authors. Any queries (other than missing material) should be directed to the corresponding author for the article.
