
Abstract
A large number of oxides has been investigated in the last twenty years as possible new materials for various applications ranging from opto-electronics to heterogeneous catalysis. In this context, ferroelectric oxides are particularly promising. The electric polarization plays a crucial role at many oxide surfaces, and it largely determines their physical and chemical properties. Ferroelectrics offer in addition the possibility to control/switch the electric polarization and hence the surface chemistry, allowing for the realization of domain-engineered nanoscale devices such as molecular detectors or highly efficient catalysts. Lithium niobate (LiNbO3) is a ferroelectric with a high spontaneous polarization, whose surfaces have a huge and largely unexplored potential. Owing to recent advances in experimental techniques and sample preparation, peculiar and exclusive properties of LiNbO3 surfaces could be demonstrated. For example, water films freeze at different temperatures on differently polarized surfaces, and the chemical etching properties of surfaces with opposite polarization are strongly different. More important, the ferroelectric domain orientation affects temperature dependent surface stabilization mechanisms and molecular adsorption phenomena.
Various ab initio theoretical investigations have been performed in order to understand the outcome of these experiments and the origin of the exotic behavior of the lithium niobate surfaces. Thanks to these studies, many aspects of their surface physics and chemistry could be clarified. Yet other puzzling features are still not understood. This review gives a résumé on the present knowledge of lithium niobate surfaces, with a particular view on their microscopic properties, explored in recent years by means of ab initio calculations. Relevant aspects and properties of the surfaces that need further investigation are briefly discussed. The review is concluded with an outlook of challenges and potential payoff for LiNbO3 based applications.
Export citation and abstract BibTeX RIS

Original content from this work may be used under the terms of the Creative Commons Attribution 3.0 licence. Any further distribution of this work must maintain attribution to the author(s) and the title of the work, journal citation and DOI.
1. Introduction
1.1. Ferroelectrics and ferroelectric surfaces
Ferroelectrics are a subclass of piezoelectric materials with at least two electric polarization states, which remain stable in the absence of an electric field. In addition, it is possible to switch between different polarization states by applying a sufficiently large electric field (Rabe et al 2007). Cutting a ferroelectric perpendicularly to the polarization axis results in the formation of two oppositely polarized surfaces, which are characterized by a macroscopic electric dipole moment aligned perpendicularly to the surface. An electric field (usually referred to as depolarization field) is formed to stabilize ferroelectric surfaces. The depolarization field can be accomplished by several stabilization mechanisms. These include deep modifications in the surface morphology and stoichiometry, such as the spontaneous desorption of atoms, faceting, surface reconstructions, adsorption of foreign species, etc, or fundamental changes of the surface electronic structure, with, e.g. total or partial filling of surface states, occasionally leading to surface metallization (Noguera 2000, Goniakowski et al 2008, Ostendorf et al 2008).
These phenomena are the hallmark of ferroelectric (or more in general polar) surfaces, and lead to new surface configurations, in which the microscopic environment of the surface atoms is very different from their volume counterpart or from non-polar terminations, and the surface electronic structure is different from that of the substrate. As a result, surface atoms may show unusually high or low valence states, with important implications on the surface reactivity. Thus, the interplay of many stabilization processes eventually determines the surface's chemical and physical properties.
The investigation of ferroelectric structures has flourished in the last two decades, owing to recent advances in the experimental techniques for the surface analysis, and fueled by the growing demand for outstanding materials to be employed in applications ranging from opto-electronics over surface acoustic waves to heterogeneous catalysis. Among the ferroelectric surfaces, lithium niobate cuts have become a lot of attention and have been employed for a multitude of applications, which will be shortly outlined in the next section.
Lithium niobate is a human-made dielectric material with a trigonal crystal structure, and is characterized by favorable pyroelectric, piezoelectric, electro-optic, and photo-elastic properties, which have their origin in the singular crystal structure (Weis and Gaylord 1985). The lithium niobate structure at temperatures below the ferroelectric Curie temperature (approximately 1483 K) consists of layers of O atoms in a distorted hexagonal close-packed configuration. The resulting oxygen octahedral cages are occupied in equal measure by Li atoms, by Nb atoms, or are vacant (see figure 1). In the  (or
(or  , or [0 0 0 1]) direction, the atoms in the octahedral interstices occur in the order: → Nb, vacancy, Li, Nb, vacancy, Li, →. The (positively charged) cations are not exactly at the center of the (negatively charged) oxygen cages or within an oxygen plane, but slightly shifted along the z axis. The charge separation arising from the shift of the cationic sublattice with respect to the oxygen octahedra causes LiNbO3 to exhibit a spontaneous polarization, which has the same orientation of the cation's shift.

Figure 1. Schematic representation of the ferroelectric LiNbO3 crystal structure highlighting the cationic positions with respect to the oxygen octahedra.
Download figure:
Standard image High-resolution imageUpon compression the cations move closer to the high symmetry (i.e. to the centered, or paraelectric) positions with respect to the oxygen layers, thereby reducing the net polarization. This leaves an excess amount of negative compensating charge on the  face, causing the
  face to become negative. Similarly, when the crystal is heated, the elastic forces pull the Li and Nb ions towards the paraelectric positions (the paraelectric phase is the high-temperature phase). Again, this reduces the net polarization along the z axis, and produces an excess of negative compensating charge on the
  face, also causing the
  face to become negatively charged (Weis and Gaylord 1985). Due to the material's response to temperature and pressure, the standard method of determining the orientation of the z axis is to compress the crystal in this direction. The
  axis is defined as being directed out of the z face that becomes negative upon compression. A second method to determine the polarization direction exploits the pyroelectric properties of the crystal. The
  axis is directed out of the z face that becomes positive upon cooling (Boyd et al 1964). The spontaneous polarization (0.7 C
  ) is unusually high and only directed along the z axis (uniaxial ferroelectric) (Volk and Wöhlecke 2009). Thus the material's cuts perpendicular to this direction are two strongly polarized (0 0 0 1) surfaces with peculiar properties, such as a surface charge layer and a non-stoichiometric composition.
Lithium (meta)niobate LiNbO3 is a material with a variable composition, having a large solid solution range of about 6 mol% at  °C. Figure 2 shows the phase diagram of the Li2O−Nb2O5 system. The liquid-solid curve reveals a diffuse maximum at approximately 48.45% Li2O. Thus, Czochralski grown lithium niobate is strongly Li deficient (congruent LiNbO3) (Lerner et al 1968). Nearly stoichiometric composition can be achieved by more elaborate growth processes (Kitamura et al 1992, Malovichko et al 1992, Polgár et al 1997). While bulk properties such as the refractive index are composition dependent, it is still not clear whether the surfaces of congruent and stoichiometric materials are different. Part of the experimental results regard measurements on congruent samples and part on stoichiometric samples (Skryleva et al 2016). Though, the theoretical simulations only model the stoichiometric composition, which might introduce some uncertainty. Because of the high Curie temperature of lithium niobate, the paraelectric phase is not relevant for technical applications, and the remainder of this paper will discuss only the ferroelectric surfaces.

Figure 2. Schematic phase diagram of the Li2O−Nb2O5 system, redrawn from Lerner et al (1968).
Download figure:
Standard image High-resolution image1.2. Applications and relevance of LiNbO3 surfaces
Many different devices take advantage of the unique properties of LiNbO3 surfaces. Traditional applications are settled in the field of surface acoustic waves and exploit its excellent piezoelectric properties (Lee et al 2003). These applications typically implement the LiNbO3(2  0) surface, which is the only technologically relevant LiNbO3 surface that is neither polar nor piezoelectric. This surface, commonly referred to as lithium niobate x-cut, is moreover particularly suitable as a substrate for the deposition of stoichiometric LiNbO3 thin films (Kräußlich et al 2007) required for devices in integrated optics, and is largely employed and in x-cut optical waveguides (Bentini et al 2002).
In recent years, however, ferroelectric surfaces and interfaces have attracted the attention of scientists and engineers with respect to a variety of novel applications. These rely typically on the structural, stoichiometric and surface charge differences of oppositely polarized surfaces, or on their different chemical reactivity. As an example, ferroelectric domains can be written on (and read from) a substrate just as the pits of a DVD, however at a much smaller scale, allowing for the realization of high density media for data storage.
The probably most innovative applications exploit the interaction of ferroelectric surfaces with (i) polar solids and (ii) molecules.
With regard to the first point, high quality GaN and AlN crystals have been grown by molecular beam epitaxy using lithium niobate as a substrate (Doolittle et al 2003, Namkoong et al 2005, Tsuchiya et al 2006). This is a potential breakthrough in materials science, as most III–V semiconductors do not possess a native substrate, which constitutes a severe handicap for many applications. As an example, GaN is usually epitaxially grown on α-Al2O3 (Lee et al 2006). However, the lattice mismatch of about 16% between GaN and its substrate negatively affects the grown layer and yields to a high density of point and extended lattice defects. This might not be a serious issue for the realization of devices such as light emitting diodes, but surely represents a drawback for the realization of devices that require a precise band engineering such as Schottky-junctions. LiNbO3 provides a relatively small lattice mismatch with respect to GaN and is characterized by an outstanding cost-performance ratio (Doolittle et al 2003, Namkoong et al 2005, Tsuchiya et al 2005).
Both LiNbO3 and α-Al2O3 have the hexagonal symmetry that characterizes wurtzite GaN. However, while the lattice mismatch between the (0 0 0 1) planes of GaN and sapphire is substantial, the nominal lattice mismatch between the (0 0 0 1) planes GaN and lithium niobate amounts to 6.8%. This results in a low defect concentration and an overall high GaN crystal quality. Yet, the key advantage of using lithium niobate as a substrate for the GaN growth is not related to its lattice structure, but rather to its polar nature. Indeed, the LiNbO3 polarization can be employed to control the GaN growth, allowing for the realization of novel polarization engineered structures. Indeed, GaN/LiNbO3 heterostructures have been fabricated to realize electro-acoustic filters (Namkoong et al 2005). Despite this intriguing potential and the first promising successes, technical issues still tend to degrade the electrical and optical properties of the devices, such as the formation of LiNb3O8 interfacial layers, the diffusion of Li atoms into GaN, etc). Several growth techniques, including pulsed laser deposition and low temperature growth have been proposed to overcome these problems (Hansen et al 2005, Namkoong et al 2005, Tsuchiya et al 2005, 2006, Lee et al 2006, Nam et al 2009).
Concerning the second point, the ability to manipulate the dipole orientation in ferroelectric oxides has been employed as a tool to tailor the surface chemistry for specific applications (Liu et al 2006, Li et al 2008). As ferroelectric domains can be patterned at the nanoscale, domain-specific surface chemistries may provide a pathway for fabrication of microscopic devices such as molecular detectors or catalysts. The maximum efficiency of a fixed catalytic surface occurs when the interaction with adsorbates is strong enough to drive the reactions forward, and weak enough to permit the products' desorption (Kakekhani and Ismail-Beigi 2015). While such a compromise can fundamentally limit the catalytic activity, ferroelectric materials offer surfaces with tunable chemistry—between strong binding (rapid dissociation) and weak binding (easy desorption). The idea of using ferroelectric surfaces as catalysts is not new and dates back to 1952, when Parravano found out that the catalytic oxidation of carbon monoxide is affected by ferroelectric transitions (Parravano 1952). Nowadays ferroelectric surfaces represent a popular pathway to switchable surface chemistry and catalysis (Kakekhani and Ismail-Beigi 2016a, Kakekhani et al 2016), as shown in figure 3. Besides a direct role as catalysts, LiNbO3 can be used to control the activity of a catalytic layer. Kim et al e.g. described the intriguing possibility to modulate the activity of a catalytic Pd layer adsorbed on LiNbO3 by switching the substrate polarization (Kim et al 2011).

Figure 3. Catalytic cycle for NO direct decomposition into N2 and O2 proposed in Kakekhani and Ismail-Beigi (2015). The polarization direction is indicated by the arrows. The cycle starts with a clean positively polarized surface and returns to this state after multiple steps, thereby efficiently dissociating two NO molecules into N2 and O2.
Download figure:
Standard image High-resolution imageAtomic polarization in ferroelectrics can be furthermore manipulated to control electronic structure and local chemical reactivity, allowing for a novel approach to fabricating multicomponent, complex nanostructures (Kalinin et al 2002, 2004). Photoreduction on chemically patterned lithium niobate crystals is used to fabricate metallic nanostructures (Sun and Nemanich 2011, Carville et al 2012). Moreover, LiNbO3 is employed as a photovoltaic substrate for massive parallel manipulation and patterning of nano-objects (Carrascosa et al 2015) and for the photocatalytic nanoparticle deposition on LiNbO3 nanodomain patterns via photovoltaic effect (Liu et al 2007). An alternative way to produce surface nanoscale periodic structures in congruent lithium niobate is given by domain reversal patterning and following differential etching (Grilli et al 2005), which will be described in the next section.
Experiments with the adsorption of acetic acid (Yun and Altman 2007), NO (Choso et al 1997, Tabata et al 1997), 2-propanol (Yun et al 2007a), dodecane (Yun and Altman 2007), water, methanol (Garra et al 2009) and the anchoring of liquid crystal molecules (Bharath et al 2008) indicate an influence of the LiNbO3 surface polarization on the adsorption characteristics. Lithium niobate surface charges were found to enable the photo-assisted reduction of CO2, i.e. artificial photosynthesis (Stock and Dunn 2011) and to drive photocatalytic dye decolorization (Stock and Dunn 2012). The interactions of larger (macro)molecules with ferroelectric surfaces are interesting as well, from both the scientific and technological point of view. The integration of ferroelectric thin films with liquid environments is investigated in the context of lab-on-chip device designs, e.g. for localizing, sensing or activating charged biomolecules (Yeo and Friend 2009, Länge et al 2008, Ferris et al 2012), and cells (Esseling et al 2013, Pozza et al 2014, Zaltron et al 2015). LiNbO3 crystal surfaces have been employed to trap and pattern nano- and micro-meter particles using the evanescent light-induced photovoltaic fields in photovoltaic tweezers (Villarroel et al 2011). High surface electric fields due to pyroelectricity were found to efficiently pole electro-optic polymers (Huang et al 2012) and to lead to the reversible fragmentation and self-assembling of nematic liquid crystals (Merola et al 2012). Exploiting the same principle, Habicht et al, achieved selective decoration of LiNbO3 domains with polystyrene microspheres from an aqueous solution (Habicht et al 2008).
In order to achieve a good patterning for the described applications, a precise poling process is required. Poling with different techniques, including UV assisted poling, or conventional electric field poling with an overpoling step that inverts all the material apart from a thin surface region directly below a patterned photoresist allows for the realization of multiform domain structures (Busacca et al 2002) or periodic structures with homogeneous submicron gratings (Valdivia et al 2005). Further improving the lithium niobate technology and applications requires a detailed understanding of the material's surfaces. Therefore, several investigations have been dedicated to the characterization of the LiNbO3 cuts, which will be described in the following section.
1.3. Present knowledge of the LiNbO3 surfaces
Among the LiNbO3 surfaces, the (0 0 0 1) or z-cut is by far the most extensively investigated, from experiment as well as form first-principles theory. Low-energy electron diffraction and reflection high-energy electron diffraction (LEED/RHEED) indicated that both the positively and negatively polarized surfaces have ( ) periodicity, with no evidence of longer range periodic reconstructions (Yun et al 2007b). X-ray' and ultraviolet photoelectron spectra showed only minor differences between the positively and negatively polarized surfaces, apart from a high binding energy feature on the oxygen 1s core-level of the negative z-cut (Yun et al 2007b). UV-photoelectron emission microscopy on periodically poled LiNbO3 samples revealed sizeable differences in the ionization energy of opposite domains. While the photothreshold of the negative z-cut is 4.6 eV, that of the positive z-cut is greater than 6.2 eV (Yang et al 2004). Different scattering spectroscopy methods have been applied to reveal the surface termination morphology and stoichiometry (Kawanowa et al 2003, Saito et al 2004), however they did not yield a conclusive picture, due to the different cross sections of Nb, Li, and O to different ion beams. Agreement has been achieved about the fact that LiNbO3 z-cuts can be rendered atomically smooth by annealing (Lee 2002, Saito et al 2004). However, a temperature treatment of the samples in vacuum leads ineluctably to the evaporation of several distinct Li and O gases depending on the annealing temperature, as pointed out with mass spectrometry, temperature programmed desorption measurements and Auger electron spectroscopy and Yun et al (2007b), Lushkin et al (1999). These studies showed that the LiNbO3 spontaneous polarization causes an asymmetry in the evaporating species from surfaces of opposite polarities (Lushkin et al 1999). Ultraviolet and x-ray excited photoelectron spectroscopies (UPS/XPS) have furthermore shown that in thermally treated samples the loss of Li and O leads to the formation of
  ,
,  ions and further unidentified defects (Courths et al 1980). Time resolved Kelvin probe microscopy has revealed the activation of the surface ionic subsystem, with electric fields inducing the injection of surface charges (Strelcov et al 2014). The surface temperature response and the thermally stimulated field emission of congruent and stoichiometric lithium niobate single crystals were also investigated by pyroelectric electron emission current measurements, current distribution collecting and proximity-imaging techniques (Rosenblum et al 1974, Bourim et al 2006).
In spite of many intriguing applications, far less detailed information on the LiNbO3 x- and y-cuts is available. Lee has investigated coarse surfaces of commercial x-cut samples by atomic force microscopy, demonstrating that they can be made smooth at the atomic scale by a direct temperature treatment in air (Lee 2002). Nagata has shown by Fourier transform IR spectrometry that the ion concentration of the hydroxyl groups, usually present in the wafers as unintentional dopant, varies alongside the z axis in x-cut samples (Nagata et al 1997, Nagata 1998). Bentini et al (2005) have studied x-cut single crystals of LiNbO3 implanted with different ions by secondary ion mass spectrometry, x-ray diffraction, and Rutherford back-scattering spectroscopy. They have shown that carbon implantation at low fluency does not produce substantial surface damage and does not lead to the formation of any new phase. Yet, the implantation causes a sizeable tensile strain at the surface and yields to a corresponding expansion of the crystal unit cell. In agreement with this behavior, Kalabin et al could not observe the formation of any new surface phase upon tempering and Ti indiffusion (Kalabin et al 2003).
As a further peculiarity of LiNbO3, second harmonic generation (SHG) can be exploited for surface investigation. Lithium niobate is an optical material with pronounced nonlinear coefficients for photon energies above 1.5 eV. The energy dependence of the bulk contribution to the four nonvanishing components of the second-order polarizability tensor as calculated from first principles by Riefer et al (2013) are presented in figure 4 and compared with experiments, represented by the dots, squares etc (Boyd et al 1964, Kleinman and Miller 1966, Miller and Savage 1966, Bjorkholm 1968, Hagen and Magnante 1969, Miller et al 1971, Levine and Bethea 1972, Choy and Byer 1976, Shoji et al 1997). The comparison with the calculated spectra within the independent particle approximation (IPA, red lines) and within the independent quasiparticle approximation (IQA, blue lines) shows that the former overestimates the measured data, whereas, the IQA calculations, which include electronic self-energy effects, describe the optical nonlinearities better. A further improvement of the agreement between theory and experiment is achieved considering the congruent composition (dotted lines in figure 4). In non-centrosymmetric materials, second harmonic generation contributions from bulk and from the surface cannot be separated. However, since lithium niobate exhibits high UV absorption, the penetration depth of UV light is limited to a sub μm layer, corresponding to few hundred atomic planes. Thus, employing a fundamental beam in the visible range, surface selectivity using reflection SHG can be realized. This will result in an SHG beam in the UV range originating only from the top atomic layers (Sono et al 2006).

Figure 4. Coefficients of the second-order polarizability tensor  for lithium niobate calculated within the independent particle approximation (red lines) and including quasiparticle effects (blue lines), compared to experimental data represented by diamonds, squares, crosses, etc (experimental references in the text). Solid lines represent calculations for stoichiometric LiNbO3, while dotted lines represent calculations modeling the congruent composition. See Riefer et al (2013) for more details.
Download figure:
Standard image High-resolution imageDue to the technological relevance of all the lithium niobate cuts, some information regarding growth techniques and post-growth treatments to improve the sample surface quality (in particular to quench the very strong tendency towards faceting) can be found in the literature (Solanki et al 2003). However, the surface structure at the atomic scale of the LiNbO3 surfaces has remained for a long time experimentally inaccessible. Indeed, charging effects prohibit the application of electron tunneling or diffraction techniques and unscreened surface charges hinder atomic force microscopy in lithium niobate. A breakthrough was achieved by Rode et al (2012) performing the atomic force microscopy (AFM) measurement in liquid environment, in order to screen the AFM tip from the surface charges. This allowed for the first time true atomic resolution imaging of the z- and then of the x-cuts (Sanna et al 2014b). No surface reconstruction was found in both cases for stoichiometric samples, however geometrical patterns not compatible with truncated bulk terminations were revealed on the x-cut. Successively, measurements on z-cut samples annealed at different temperatures showed a peculiar thermal behavior, which is discussed in section 1.4.
1.4. The puzzling behavior of polar LiNbO3 surfaces
Despite the successful employment of lithium niobate surfaces in a multitude of applications and the knowledge originating from the investigations described in the previous section, there are several aspects of these surfaces, which are far from being completely understood. These include, among others, the impact of molecules and adsorbates and the temperature behavior.
In the previous section we have provided several examples of molecular adsorption phenomena affected by the ferroelectric domain orientation and discussed potential applications. Vice versa, the impact of molecules on ferroelectric surfaces can be exploited to tune their chemical and physical properties, or even to alter the morphology or polarization. However, different aspects of this phenomena are still not clear or even puzzling. An extreme example in this sense is given by the chemical etching. Differently polarized surfaces are characterized by extremely different etching rates (Bermúdez et al 1998, Xue and Kitamura 2002). Due to this phenomenon, it is possible to visualize ferroelectric domains of, e.g. LiNbO3 or LiTaO3 by etching with HF and HNO3 acid mixtures, as shown, e.g. in figure 5 (Nassau et al 1965, Barry et al 1998, Liu et al 2005). Even if this technique is routinely used (Sones et al 2002, Mailis et al 2003), the reason for the different etching rate is still unknown (Argiolas et al 2005).

Figure 5. Scanning electron microscopy image showing a circular feature patterned on the LiNbO3  face, after poling and etching with HF and HNO3 acids in a 1:2 ratio. Reprinted from Barry et al (1998), Copyright 1998, with permission from Elsevier.
Download figure:
Standard image High-resolution imageFurthermore, the molecular adsorption (as well as surface defects (Gao et al 2011b)) influences the ferroelectric phase transition, and therefore the polarization reversal properties of the substrate. In a very recent experimental study (Ramos-Moore et al 2011) a modification of ferroelectric hysteresis in Pb(Nb,Zr,Ti)O3 thin films due to CO2 adsorption was found and attributed to the existence of a depolarizing field induced by molecular adsorption at the surface. Also Yun and Altman (2007) have shown that the adsorption energy differences between positive and negative surfaces of ferroelectric oxides are large enough to switch the polarity of thin films. In the work of Sun et al, it was noted that the size of nano-scale ferroelectric domains on LiNbO3 single crystals expands or shrinks with increases or decreases in the environmental humidity, i.e. the amount of adsorbed water molecules on the surface (Sun et al 2012). Thus, ferroelectric chemical sensors such as gas detectors can be envisioned, where adsorption switches the polarization of a thin ferroelectric gate of a field effect device. For broader samples instead, it has been proposed that the application of external electric fields will suffice to switch adsorption and catalytic properties; first successful experiments in this area have already made their appearance in the literature (Giocondi and Rohrer 2001). This notwithstanding, both the mechanisms of the ferroelectric poling at the microscopic scale, as well as their modification by molecular adsorbates need further investigations.
The evolution of the LiNbO3 z-cut with increasing temperature shows a rich variety of morphologies. The existence of a  reconstruction formed at high temperatures was demonstrated first by Rakova with RHEED measurements (Rakova 1993). More recently, an AFM investigation has shown a series of structural transformations on samples annealed at different temperatures (Sanna et al 2013). Regular patterns of different form and size as shown in figure 6 are formed at determined temperatures. A Fourier analysis demonstrated the occurrence of a
  surface reconstruction, stable only in a limited temperature range. Interestingly, after annealing above 1270 K—a temperature is rather close to the LiNbO3 Curie temperature
  K (Volk and Wöhlecke 2009) any reconstruction disappears. The evolution of the surface structure with increasing temperature was discussed as the result of the interplay between several surface stabilization mechanisms.

Figure 6. Tapping mode atomic force microscopy image of the LiNbO3  -cut (left hand side) and
  -cut (right hand side) taken in air after cleaning in an ultrasound bath and subsequent annealing at 700° (b) or 800° (a), (c), (d). Reprinted figure with permission from Sanna et al (2013), Copyright 2013 by the American Physical Society.
Download figure:
Standard image High-resolution imageThe etching rate and the temperature behavior are not the only LiNbO3 surface properties that are unusual and strongly polarization dependent. Also it was found that water freezes differently and at different temperatures on positive and negative ferroelectric surfaces (Ehre et al 2010), and that the electron affinity of differently polarized surfaces differs by about 2 eV (Yang et al 2004).
1.5. Purpose and organization of this review
The aim of this review is to summarize our knowledge of LiNbO3 surfaces and interfaces, especially in the light of recent theoretical advances. These allowed for a comprehensive understanding of some of the fundamental properties of technologically relevant LiNbO3 faces and their peculiar characteristics. Many experiments could be interpreted on the basis of the microscopic surface structure, and many of the unusual properties described above could be explained. The second section introduces the established crystallographic notations for ferroelectric LiNbO3 and defines the different crystallographic directions, which, due to the highly anisotropic nature of LiNbO3 crystals, are crucial to understand the material's surfaces. The third section gives an overview of the first principles, atomistic calculations employed for the simulation of ferroelectric surfaces. Different aspects of this method, including the slab approach and the related issues with the boundary conditions are discussed. The thermodynamic framework underlying the investigation is described as well. Approximations and simplifications within the approach are explained in detail to give an estimate of the reliability level and predictive power of the models. Sections 4–6 deal with the technological relevant LiNbO3 faces, usually referred to as lithium niobate x- y- and z-cut, respectively. Most emphasis is given to the discussion of the z-cut, a polar surface that has been investigated in a multitude of experiments due to its huge potential for novel applications. After a short overview of further relevant LiNbO3 surfaces in section 8, the work is concluded with a short summary and a survey on future applications of ferroelectric surfaces.
2. Crystallography in LiNbO3
2.1. Definition of the three commonly used coordinate systems
LiNbO3 is a highly anisotropic material, and a consistent definition of the crystal axis is of fundamental importance to model and understand the inherent characteristics of the materials surfaces and interfaces. As different representations of the crystal structure are currently employed, we briefly explain the notation we follow in this work.
Ferroelectric LiNbO3 is a trigonal crystal belonging to the space group R3c and point group 3m. It is characterized by the threefold rotational symmetry about the crystallographic z axis and by three mirror planes containing this axis. Crystals belonging to the trigonal group are typically described either by a hexagonal or by a rhombohedral primitive cell. The first can be moreover represented by different sets of primitive vectors (spanning an angle of 60° or 120°). Furthermore an orthorhombic cell is used for the specification of the LiNbO3 properties described by a tensor, such as the electro-optic coefficients. Figure 7 illustrates the different cells used to model bulk lithium niobate. The smallest unit cell is the rhombohedral cell in figure 7(a) and is made up of ten atoms, corresponding to two formula units. The conventional hexagonal unit cell is larger, and contains 30 atoms or six formula units. The orthorhombic cell, with orthogonal translation vectors parallel to the x, y, and z Cartesian axis, is the largest unit cell, containing 60 atoms or 12 formula units. Most of the material properties exploited in technological applications (dielectric constants, non-linear optical, elastic stiffness and piezoelectric strain coefficients) as well as symmetries and surfaces are usually specified within the orthorhombic system.

Figure 7. Rhombohedral (a), hexagonal (b), and orthorhombic unit cell of ferroelectric LiNbO3. The ferroelectric axis is indicated in terms of the corresponding translation vectors  ,
,  , and
, and  . For the sake of clarity the atomic basis is not shown.
Download figure:
Standard image High-resolution imageFurther widely diffused coordinate systems such as the orthohexagonal and the pseudocubic rhombohedral systems, which are described in Räuber (1978), are not essential to describe LiNbO3 surfaces and will not be introduced in this work.
2.2. Technologically relevant LiNbO3 surface cuts and their properties/morphology
The existence of different coordinate systems as well as some inconsistence in the application of the conventions used to define them causes a lot of confusion. We follow Weis and Gaylord (1985) and Sanna and Schmidt (2010c) to define the LiNbO3 x, y, and z-cuts, which are shortly described in the following. Figure 8 shows the standard translation vectors  ,
,  and
and  of the hexagonal lattice, with an angle of 120° between
  and
and  . According to Weis and Gaylord (1985), the crystallographic axis [0 0 0 1], usually referred to as c axis, corresponds to the z direction. The x axis is perpendicular to the z axis and is chosen as one of the hexagonal vectors
  or
or  , representing equivalent directions of the LiNbO3 crystal structure. In the basis of the hexagonal translation vectors, the threefold degenerate x axis is represented by one of the three vectors (1 0 0), (0 1 0) and (
 0). Applying the conventional transformation

it is found that the x axis is equivalent to the crystallographic directions [2 
 0], [
0], [ 2
2  0] and [
 2 0] of the hexagonal lattice. After that the x and the z axis are defined, the y axis is chosen in order to form a right handed orthogonal coordinate system. Hence, the y axis must coincide with one of the vectors (1
  0), (1 2 0) and (
 0) given in terms of the hexagonal translation vectors, corresponding to the crystallographic directions [1
  0 0], [0 1
  0] and [
 0 1 0] of the hexagonal lattice. With this definition, the lithium niobate x-cut, y-cut and z-cut investigated in this work are perpendicular to the x, y and z axes, and are labeled by the Miller–Bravais indices (2
 0), (1
  0 0), and (0 0 0 1) of the hexagonal lattice, respectively, as shown in figures 8 and 9.

Figure 8. The translational basis vectors of the hexagonal unit cell  ,
,  and
and  and the x and y directions of the orthorhombic system used to describe the LiNbO3 tensor properties are indicated. The hexagonal unit cell is shown in gray. Both t1 and t2, as well as x and y are threefold degenerate due to the hexagonal symmetry.
Download figure:
Standard image High-resolution image
Figure 9. Ferroelectric LiNbO3 can be viewed as an intrinsic polar stacking of →Nb−O Li → trilayers along the z or [0 0 0 1] crystallographic axis (a), or as a stacking of →Li−O
 Nb → trilayers along the
  or [0 0 0
  ] crystallographic axis (b). This results into two differently polarized (0 0 0 1) surfaces, currently referred to as
  face (0 0 0 1) and
  face (0 0 0
  ). Along the y or crystallographic [1
  0 0] axis, LiNbO3 can be thought of as a non-polar stacking of Li2Nb2O6 atomic layers. This results in two non-polar surfaces, which might however become charged upon compression. Along the x axis, lithium niobate can be interpreted as a non-polar sequence of −O
 Li6Nb
Li6Nb O
O atomic layers.
Download figure:
Standard image High-resolution imageThe above defined LiNbO3 cuts are characterized by very different physical properties. The unusually high spontaneous polarization of 0.7 C  points alongside the positive z axis (Volk and Wöhlecke 2009). This is due to the particular stacking of the atomic layers, which is, in the
  direction, Nb
 Li
Li , Nb
, Nb
 Li
Li , ..., as shown in figure 9. The materials cuts perpendicular to this direction are two (0 0 0 ± 1) surfaces with opposite polarization, showing the peculiar properties discussed in section 1. Interestingly, a surface charge
  of only 140 μC
  , i.e. three order of magnitude lower than the nominal surface charge of
  C
C  is measured on congruently melt, undoped z-faced LiNbO3 crystals (Jungk et al 2006, Johann and Soergel 2009), suggesting that a very efficient form of charge compensation takes place at the z-cut.
Along the y or crystallographic [1  0 0] axis, LiNbO3 can be thought of as a non-polar stacking of Li2Nb2O6 atomic layers, as shown in figure 9(c). Thus, y-cuts are nominally non-polar. However, the y-cut is characterized by a non vanishing surface charge
  as large as about
  (Johann 2009). As the y axis lies in a plane of mirror symmetry,
  can be modified by compression along the y direction. The y axis is therefore indicated as non ferroelectric but piezoelectric. This property can be exploited to determine the orientation of the y axis similarly to the procedure described for the z axis. By definition a negative excess charge is measured at the
  face upon compression (Weis and Gaylord 1985).
The situation at the x-cut is completely different. Alongside the x axis, LiNbO3 can be interpreted as a non-polar sequence of −O Li6Nb
Li6Nb O
O atomic layers, as shown in figure 9(d). The x axis lies perpendicularly to a mirror symmetry plane, hence each charge displacement at one side of this symmetry plane is mirrored by the same charge displacement at the other side, resulting in no net surface charge.
3. Methods
3.1. Atomistic modeling and ferroelectrics
One of the characteristic peculiarities of ferroelectric crystals is the temperature driven ferroelectric to paraelectric phase transition. In order to model the effects of the temperature, theoretical investigations of ferroelectric materials are traditionally performed within phenomenological approaches. Typical investigations start building up an effective Hamiltonian, with a simple form and a reduced number of parameters. The effective Hamiltonian is then employed to model the temperature behavior of ferroelectrics by means of classical Monte-Carlo (Waghmare and Rabe 1997), molecular dynamics (Krakauer et al 1999) or quantum Monte-Carlo simulations (Zhong and Vanderbilt 1996, Akbarzadeh et al 2004).
However, methods directly based on the fundamental laws of quantum mechanics and electrostatics (i.e. from first principles or ab initio), which are free of empirical parameters, have experienced a rapid evolution in the last 25 years. Due to steadily increasing computational power and to the development of efficient calculation algorithms, a multitude of materials properties has been determined from first principles, ranging from the microscopic structure to the macroscopic spontaneous polarization.
The density functional theory (DFT) (Hohenberg and Kohn 1964, Kohn and Sham 1965) is one of the most successful first-principles approaches, and has become the most widely used atomistic method in the field of ferroelectrics. It led to many breakthroughs in the understanding of the behavior of bulk crystals (Vanderbilt 1997, Veithen and Ghosez 2002, Veithen et al 2004, Rabe and Ghosez 2007, Sanna et al 2011c, Friedrich et al 2015, Riefer et al 2016), thin films, surfaces and nanostructures (Sai et al 2000, Ghosez and Rabe 2000, Meyer and Vanderbilt 2001, Neaton and Rabe 2003)
Of particular value for the simulation of ferroelectrics is the implementation of the modern theory of polarization (Vanderbilt and King-Smith 1993, King-Smith and Vanderbilt 1993, Resta 1994), nowadays available in all major DFT software packages. This theory represents the only proper quantum mechanical approach for the calculation of the electronic polarization in periodic solids, and allows for the calculation of key quantities such as such as the spontaneous polarization, the Born effective charges or the piezoelectric tensors.
The DFT has also limitations. The number of atoms that can be handled in a first-principles calculation, is currently limited to a few hundred atoms, which imposes serious restrictions to the applicability of pure DFT calculations for the study of, e.g. ferroelectric domain walls. Furthermore, crystal structures and ferroelectric properties of many materials strongly depend on temperature. Quantitatively correct predictions that allow for a direct comparison with the experiment require therefore the estimation of the material properties at finite temperatures, which is in practice unaffordable within DFT. Indeed random thermal vibrations are not accurately described within the small simulation boxes which can be handled in today's calculations.
Despite these limitations, DFT is and remains the most successful tool for the investigation of ferroelectric surfaces, including the surfaces described in this review. Density functional theory is illustrated in detail in many dedicated reviews and will not be discussed in this work (for reviews see Payne et al (1992)). We limit ourselves to discuss some of the technical aspects concerning surface simulation of surfaces within the DFT. These concern the choice of appropriate structural approach and the development of a consistent thermodynamic framework for the evaluation of the surface stability.
Several structural approaches have been employed for the atomistic simulation of surfaces, including cluster methods (Seel and Bagus 1981, Batra and Ciraci 1976), transfer matrix methods (Pollmann and Krüger 2000, Bechstedt and Enderlein 1988), scattering theoretical (Koster and Slater 1954, Kouteck 2007) and slab approaches. Only the last method will be shortly outlined, as the vast majority of the investigations dedicated to LiNbO3 surfaces were performed within the slab method.
3.2. Simulation of surfaces: the slab method
The Kohn–Sham equations for an infinite and periodic system are usually solved within the supercell approach. Within this approach, a limited number of primitive cells is employed to model the investigated material, and periodic boundary conditions are applied to mimic the continuum properties of the system (Cohen et al 1975). This method is very favorable, e.g. for periodic crystals, where Bloch's theorem is applied to the wavefunctions.
Unfortunately, surfaces represent a break in the crystal periodicity and are semi-infinite, no 3D-periodic anymore. Yet, it is possible to profit from periodic modeling by separating surfaces within the supercell by a vacuum region (supercell slab). The new crystal hence describes a superlattice with an extended unit cell consisting of a slab and a more or less large vacuum region, which can be treated assuming periodic boundary conditions by electronic structure methods. This approach accounts naturally for the lateral periodicity of surfaces. However, a sufficiently broad vacuum region has to be introduced to decouple the slabs, and a sufficient slab thickness has to be considered to mimic semi-infinite crystals. Most, but by no means all phenomena in surface science are relatively short-ranged normal to the surface, and the surface region can be usually restricted to a few atomic layers. The number of atomic layers must be carefully tested, depending on the surface property that has to be modeled. Typically 5–20 atomic layers embedded in a vacuum region of 10–20 Å are sufficient to approach bulk behavior in the center of the film and avoid interactions between the surfaces through the vacuum layer (Bechstedt 2003). Due to particular issues arising with ferroelectric surfaces, somewhat larger values are necessary for the simulation of polar LiNbO3 surfaces. These will be discussed in the next section, though.
It is worth to be noticed that Eglitis and co-workers have performed ab initio calculations for polar BaTiO3, PbTiO3 (Eglitis and Vanderbilt 2007), as well as SrZrO3 PbZrO3 (0 1 1) and (1 1 1) surfaces (Eglitis and Rohlfing 2010, Eglitis 2015) without an artificial periodicity along the z direction. Using the CRYSTAL code (Dovesi et al 2014) they were able to model stand-alone 2D slabs consisting of several planes perpendicular to the [0 1 1] or [1 1 1] crystal directions.
In the slab method, two surfaces per unit cell on opposite sides are created (see e.g. figure 10(a) in which a symmetric supercell used to model a DySi2 monolayer at the Si(1 1 1) surface is illustrated). For centrosymmetric slabs, the two faces can be made equal. This is not possible, e.g. in the case of the polar LiNbO3 z-cut. However, even in the case of equal, non-polar surface this method introduces some problems, as discussed, e.g. in Bechstedt (2003). In most cases it is preferable to consider the front end of a slab containing the (polar) surface of interest, and suitably passivate the back surface (Shiraishi 1990). The passivation is carried out with hydrogen or pseudo-hydrogen atoms with appropriate valence charge. While for group-IV atoms the dangling bonds can be saturated with hydrogen atoms with  , pseudo-hydrogen with
  or
or  have to be used for (1 1 1) and (1 0 0) III–V surfaces, respectively (Bechstedt 2003). This is exemplarily shown for the DySi2 monolayer at the Si(1 1 1) surface in figure 10(b).

Figure 10. Symmetric (a) and asymmetric (b) supercells modelling a DySi2 monolayer at the Si(1 1 1) surface. From Sanna et al (2016).
Download figure:
Standard image High-resolution imageAfter passivation, the back of the slab is a perfect, neutral semiconducting surface with corresponding electronic states well below the fundamental band gap. However, two problems remain. At first, it is not possible to directly calculate the surface formation energy, as one calculates the formation energy of two different surfaces. This issue can be tackled by the energy density formalism (Chetty and Martin 1991). A second problem is due to the fact that the two slab surfaces are not equivalent and electric fields remain both in the slab and in the vacuum region. While this problem is a minor issue for non-polar surfaces modelled by thick slabs with large vacuum layers, it becomes crucial in the case of strongly polar surfaces. Possible solutions are discussed in the next section.
In the particular case of LiNbO3, in which the chemical bonds are partially ionic and partially covalent, it is not easy to determine a proper passivation for the slab's back face. To circumvent this problem Levchenko and Rappe (2008) and Sanna and Schmidt (2010c) have employed lithium niobate slabs with two terminations and no passivation. The drawback of this approach is that the two slab surfaces cannot be made equivalent because of lack of centrosymmetry. Thus, no surface free energy can be calculated. However, this approach allows an estimate of relative surface energies, i.e. the free energies for different terminations can be instructively compared if the other surface is not modified.
3.3. Issues within periodic boundary conditions
The supercell slab is one of the most successful structural models employed in atomistic simulations to model atomic and electronic structures as well as thermodynamic and kinetic behavior of surfaces and interfaces. Though, in presence of an electric polarization orthogonal to the surface, theoretical models have to deal with an additional problem, the problem of setting the correct electrical boundary conditions (Fu et al 1999, Meyer and Vanderbilt 2001). The polarization might be either due to an intrinsic bulk spontaneous polarization (ferroelectrics) or to the formation of a surface reconstruction with a strong dipole moment on a paraelectric bulk.
Periodic boundary conditions are usually applied both to geometries and to the electrostatic (or Hartree) potential VH to model bulk systems within the supercell approach. This results in a zero macroscopic internal field E, independently from the presence (or from the exact value) of a spontaneous bulk polarization PS of the modeled material. This situation is illustrated in figure 11(a).

Figure 11. Planar averaged electrostatic (Hartree) potential of ferroelectric LiNbO3. (a) Bulk supercell, (b) slab of truncated bulk, (c) with vanishing external field, and with vanishing internal electric field (d). Internal (or depolarization) field ED, external field EEXT and slab/supercell boundaries are indicated (Sanna et al 2014a).
Download figure:
Standard image High-resolution imageAny supercell modelling a termination with a non vanishing electrical dipole orthogonal to the surface will originate an electrostatic potential, as sketched in figure 11(b). As previously discussed, the net dipole moment will be in general the sum of a share due to the bulk polarization and a share due to the surface: a non polar crystal with two non-equivalent surface terminations will result in a net dipole moment as well. This situation corresponds to a surface in the artificial field originating from its neighboring periodic images. Due to the periodic boundary conditions, the electrostatic potential has thereby to be a continuous function, with a slope determined by the magnitude of the supercell. Hence, neither the internal nor the external field have a direct physical meaning. Indeed, increasing the thickness of the slab or of the vacuum region the artificial fields become smaller, vanishing in the limit of infinitely large supercells (with the bulk behavior as in figure 11(a) as limiting case of infinite slabs).
The error introduced by the artificial field in finite slabs can be accounted for by specifically developed dipole corrections (Bengtsson 1999, Neugebauer and Scheffler 1992). The correction consists in the application of an external electric dipole in the vacuum region of the supercell, and yields to the scenario sketched in figure 11(c), in which the external electric field EEXT vanishes. The electrostatic potential is no more a continuous function. However, the discontinuity occurs far from the surface, in the vacuum region, where it is not expected to affect the model.
The total macroscopic polarization  gives rise to surface polarization charges

where  is the unit vector directed along the surface normal. Meyer and Vanderbilt (2001) argued that the depolarization field ED originating from the surface charges
  might be large enough to render the ferroelectric configuration instable. This means that the structural relaxation of a ferroelectric slab within the periodic boundary conditions corresponding to zero external field will ineluctably lead to a paraelectric configuration. In order to tackle this issue, they suggested employing periodic boundary conditions illustrated in figure 11(d), which mimic zero internal field. This boundary condition is equivalent to placing the slabs between the grounded plates of a capacitor (short-circuit boundary conditions), and is adequate to model thin film structures, where ferroelectric and dielectric properties are largely dominated by surface effects (Meyer and Vanderbilt 2001).
It should be mentioned that none of the above illustrated periodic boundary conditions for the electrostatic potential is inherently correct and universally applicable. Vanishing internal field boundaries represent the correct conditions far from the surface and are hence appropriate to model the 'bulk' of thin films. Vanishing external field conditions are the proper boundaries to model the surface itself, instead. Thus, the proper choice of the suitable boundary conditions as discussed above is related the system properties that have to be simulated.
Different approaches have been used to model different properties presented in this work. Surfaces geometries and surfaces charges are modelled within vanishing external field boundaries (Sanna et al 2014a). In this case, to prevent the slab to relax into the paraelectric configuration, the central region of the slabs (corresponding to 18 atomic layers) can be kept frozen into their ferroelectric positions, while the remaining 18 layers as well as the surface terminations are let free to relax (see figure 23 and the discussion in section 6). This choice is legitimated a posteriori by the results of, among others, Levchenko and Rappe (2008), who showed that the atomic relaxation in the surface terminations of ferroelectric LiNbO3(0 0 0 1) is restricted to the outer atomic layers.
The surface charge as introduced by equation (1) can be evaluated for the (positive and negative) z-cut by integrating the planar averaged polarization charge, defined as

from the center of the vacuum region to the slab center (zcut) in both directions:

In this equation A is the surface unit cell area, and  is the charge redistribution upon surface formation, which is calculated as the deviation from the bulk distribution. Hence, the slab is charge neutral and the integral over the whole supercell vanishes. The definition of Bader atomic volumes and Bader charges (Bader 1994) is employed to determine zcut as described in Sanna et al (2014a).
In order to model molecular adsorption in the (physical) external field created by the surface polarization charges, dipole corrections are switched off.
3.4. Surface formation energies
The equilibrium configuration of a surface can be calculated minimizing the surface excess free energy γ

where A is the surface unit and  the grand (or Landau) potential (Bechstedt 2003). The latter can be approximated as

Here  is the DFT total energy of slab built up of NLi Li atoms, NNb Nb atoms and NO O atoms.
  ,
,  and
and  are the chemical potentials of Li, Nb and O, respectively, and represent the growth conditions. The grand potential is given by equation (5) only in approximate form. Indeed, the surface free energy (
 , where Us is the temperature dependent internal energy) should be used instead of the total energy as calculated by DFT. Yet, considering (1) that as for most solids, the direct influence of the pressure variation on the surface free energy is negligible, (2) that the surface formation entropy Ss contributes to the surface energy at a certain temperature in similar magnitude for the terminations considered in equation (5), and (3) that a large compensation of the lattice-dynamical contributions to Fs can be assumed. Accordingly, the free energy can be replaced in first approximation by the internal energy Us. Moreover, as a large compensation of the effects of the zero point vibrations on the internal energy and on the chemical potentials can be assumed, the internal energy Us is commonly substituted by its leading term, the DFT total energy
  , in actual calculations (Bechstedt 2003).
For the sake of simplicity, we employ as variables in our description of the thermodynamic framework the chemical potential variations

The thermodynamically allowed range of these variables is limited by certain conditions, which will be discussed in the following.
3.5. Thermodynamic framework
In order to determine the termination with the lowest restricted energy for certain preparation conditions (represented by the chemical potentials  , one has to compare the Landau potential
  of different surface models with varying morphology and stoichiometry. Using equation (4), surface phase diagrams can be calculated, which show the most stable surface (i.e. with minimum
  for a given value of the chemical potentials (or their variations from the bulk values). Due to the approximations in equation (5), phase diagrams are affected by not negligible errors. Furthermore, the stability of a given phase
  with a certain geometry and stoichiometry is not absolute. At finite temperatures, the surface phase with energy
  per
per  unit cell is formed with a finite probability
  proportional to

where  is the periodicity of the reconstructed surface. This probability is furthermore influenced by entropic effects, which affect the relative stability of a the different structures for a given temperature.
3.6. Stability of adsorbates
The same theory that we have introduced to estimate the stability of surface terminations with different stoichiometry and geometry can be employed to estimate the stability of adsorbate structures depending on the preparation conditions. We illustrate the corresponding formalism using water adsorption as an example. Water molecules are adsorbed at a LiNbO3 surface in configurations which depend on the water availability. Hence, the thermodynamic Landau potential (equation (8)) has be used again to compare the relative stability of different surface water structures.

Here, N is the number of adsorbed water molecules and  is the total energy as calculated by DFT. This is a reasonable approximation of the free energy F, as different adsorption configurations are supposed to yield similar entropy contributions to the free energy. The surface excess free energy of different water configurations as a function of the water chemical potential
  can be plotted in phase diagrams, in which the chemical potential
  represents the experimental conditions. This is exemplarily shown in figure 12 for the water adsorption at the positive (upper part) and negative (lower part) LiNbO3(0 0 0 1) surface.

Figure 12. Phase diagrams of the water adsorbed positive (upper part) and negative (lower part) LiNbO3(0 0 0 1) surface calculated within DFT as a function of the water chemical potential  (Sanna et al 2012). Two representative values of
  , labeling water in the gas phase (ideal gas, i.e. non-interacting molecules) and solid state (ice-Ih), are shown. The
  availability grows continuously from
  to
to  , while at each point
  is in equilibrium with the lithium niobate surface.
Download figure:
Standard image High-resolution imageThe chemical potentials can be then directly transformed in temperature and pressure. Considering  , the difference between the water chemical potential
  and its value in the ice phase
 ![$\mu_{\rm H_2O}^{\rm [ice]}$](https://content.cld.iop.org/journals/0953-8984/29/41/413001/revision2/cmaa818dieqn118.gif) , the dependence of
, the dependence of  on temperature and pressure can be calculated in the approximation of a polyatomic ideal gas (Landau and Lifshitz 1959) as:

In this equation T and p are the state variables temperature and pressure, respectively, while kB is the Boltzmann constant. VQ labels the so called quantum volume and is equivalent to  , whereby λ is the de Broglie thermal wavelength of the water molecule:

Here, m is the mass of the water molecule, and


are the rotational and vibrational partition functions, respectively. In order to obtain the results presented in this work, the experimental values of the momenta of inertia Ii and of the vibrational frequencies  of the water molecule (Laurie and Herschbach 1962) have been used. σ is a geometrical parameters, which is related to the symmetry of the molecule. H2O has the form of an equal-sided triangle, and
  .
.
3.7. Chemical potentials
The chemical potentials in equation (5) are subject to different thermodynamic conditions, which we summarize here. The LiNbO3 heat of formation is defined as

For each of the involved atomic species, the upper limits are given by the respective bulk phase and the variables are hence bound within

The variation of  ,
,  , and
, and  is constrained in a range as large as
  below its bulk value. Within this formalism,
  denotes i-rich preparation conditions.
The number of independent variables in equation (5) can be reduced considering that the chemical potentials are not linearly independent:

For convenience  is generally expressed in terms of
  and
and  , since the latter can be better controlled experimentally. Moreover, this common choice allows for a direct comparison of available theoretical investigations with earlier simulations for the z-cut (Levchenko and Rappe 2008). It follows

Following the well established approach, the bulk chemical potentials are calculated in atomistic simulations as the DFT total energy per formula unit. In all available investigations the total energies of the bulk phases of the relevant compounds, (e.g. the metallic phases of Li and Nb, oxygen in gas phase, as well the oxides of Li and Nb, Li2O, Nb2O5, and LiNbO3) are calculated employing the corresponding primitive cells after structural optimization (atomic positions as well as lattice parameters). Oxygen in the gas phase is modeled by a O2 molecule in a orthorhombic vacuum box with edges of 10 × 1 2 Å. The known GGA overbinding problem is not corrected for Furche (2001), as the correction would not qualitatively affect any of the results of available investigations.
Elemental Nb and Li crystallize at high temperatures (i.e. above room temperature) in a metallic BCC crystal structure with space group  (Wyckoff 1963). Lithium monoxide (LO) shares the anti-fluorite arrangement (space group
  ) shown in Wyckoff (1963) with many oxides of first-group atoms. The situation is more complex in the case of niobium oxide, as Nb and O form many stoichiometrically different compounds. The most stable of these compounds above room temperature is niobium pentoxide (Nb2O5, NO) (Gatehouse and Wadsley 1964). To make matters worse, many different polymorphs of Nb2O5 itself are known and others are actually under investigation. The largest part of the known Nb2O5 modifications have a complex crystallographic structure, with a long range atomic ordering and correspondingly large unit cells. The usual way to deal with this is to estimate the formation enthalpy of NO employing the so called R−Nb2O5 phase to model the crystal. Unfortunately, R−Nb2O5 does not correspond to thermodynamically favored phase at room temperature, however it is the only Nb2O5 polymorph for which a precise and commonly accepted structural description is available (Xu et al 2008).
This choice will introduce a certain error in the position of the line CE of figure 13, affecting the stability range of the LiNbO3 surfaces increasing or decreasing it by a quantity that is not easily quantified. Fortunately, it is known that the cohesive energy variations between different polymorphs of the same compound is hardly larger than of a few eV tenths, if only solid phases are considered (Bechstedt 2003).

Figure 13. Stability range of the Li, Nb, and O chemical potentials (in eV) in LiNbO3. The area contained within the points B, D, and F satisfies equation (18), while the area within points A, C, E, and G satisfies equation (19) (Sanna et al 2010). The region highlighted in red satisfies all the thermodynamic conditions and marks the allowed range of the chemical potentials.
Download figure:
Standard image High-resolution imageIn order to calculate the heat of formation of a compound (in our case LiNbO3, LO and NO) the difference of the total energy of the compound and the weighted sum of the bulk phases of its components has to be estimated:

As a general trend, DFT calculations within the GGA approximation overestimate the measured heat of formation. The magnitude of this error is typically a few percent. The results from Sanna and Schmidt (2010c) are displayed in table 1 and compared with experimental values previous calculations. The largest deviation from the experimental value is given in case of LiNbO3, for which the measurements are overestimated by about 3%. The theoretical values are also in good agreement, with the exception of Nb2O5, which is most probably due to differing computational parameters.
Table 1. DFT calculated total energy per formula unit (upper part) and heat of formation  (lower part) of material compounds investigated in the framework of the LiNbO3 surface study. All values are in eV. Measured values (Exp.) as well as available results of similar calculations (Xu et al 2008) (b) are compiled for comparison.
| System | Theory (a) | Theory (b) | Exp. |
|---|---|---|---|
| LiNbO3 |  |
 |
|
| Li2O |  |
 |
|
| Nb2O5 |  |
−60.319 | |
| Li | −1.893 | −1.895 | |
| Nb | −10.064 | −10.049 | |
| O2 | −4.411 | −4.392 | |
 [LiNbO3] [LiNbO3] |
−14.624 | −14.433 |  (Knacke et al 1991) (Knacke et al 1991) |
 [Li2O] [Li2O] |
 |
 |
 (Chase 1998) (Chase 1998) |
 [Nb2O5] [Nb2O5] |
 |
 |
 (Chase 1998) (Chase 1998) |
When the lithium niobate surfaces and the underlying substrate are in thermodynamic equilibrium, oxygen, lithium and niobium can be swapped, and the thermodynamic condition

is satisfied at any point within the triangle ADG in figure 13, which represents a chemical potential map illustrating the stability criteria. Still, further thermodynamic conditions must be taken in account. As lithium niobate and not niobium (NO) or lithium oxide (LO) are formed, it must hold

and

The thermodynamically stable region corresponds to the chemical potentials of Li, Nb and O being between the two limiting cases of LiNbO3 in equilibrium with niobium oxide and with lithium oxide, respectively. Equation (18) defines the region within the triangle BDF, while the region enclosed between points A, C, E, and G satisfies equation (19). The shaded overlap region indicates the lithium niobate stability range. This region will be indicated in the phase diagrams discussed below. Values of the chemical potentials outside this region do not lead to formation of LiNbO3 surface, but to the precipitation of other phases on the LiNbO3 substrate.
An alternative way to represent the stability region is described in Sanna and Schmidt (2010c) and shown in figure 14. In this work, the thermodynamic conditions given by equations (17)–(19) are represented by planes in a three-dimensional space, whose axes represent the chemical potential variations of Li, Nb and O. Only within the trapezoid ABCD all the conditions are satisfied at the same time and lithium niobate surfaces are formed.

Figure 14. Stability range of the Li, Nb, and O chemical potentials (in eV) in LiNbO3. The planes α, β and γ represent the conditions given in equations (17)–(19), respectively (Sanna and Schmidt 2010c). Only within the region ABCD, corresponding to the BCEF region in figure 13 LiNbO3 surfaces are formed.
Download figure:
Standard image High-resolution imageIn all available theoretical investigations the slabs modelling the different lithium niobate surfaces are treated within customary DFT and local or semi-local exchange and correlation functionals. This is in contrast with the simulation of point defects in lithium niobate (Nahm and Park 2008, Li et al 2014a, Sanson et al 2015), for which it is crucial to adopt a calculation scheme beyond the mean field approach, such as the LDA method (Anisimov et al 1997, Dudarev et al 1998, Hourahine et al 2006, 2007, Sanna et al 2007, 2008) or hybrid-DFT (Heyd et al 2003, Krukau et al 2006, Li et al 2014b, 2015). However, while for point defects an accurate description of the electronic structure is essential, available theoretical investigations have principally focused on morphology and energetics of the surfaces, which are reliably described within local or semi-local potentials.
4. The x-cut
The x-cut is the only technological relevant surface in LiNbO3, which is neither polar nor piezoelectric. As the crystal x axis is perpendicular to a crystal mirror plane, any charge displacement due to a compression along this axis is mirrored on the other side of the plane, and does not give rise to piezoelectric effects. This does not mean that truncated bulk terminations are stable in any circumstance. Indeed, atomically resolved atomic force microscopy images show geometrical patterns not compatible with truncated bulk terminations (Sanna et al 2014b). Fast Fourier transformation of the real-space AFM images shows an oblique surface unit cell with lattice parameters of  nm,
nm,  nm, and
  . Surprisingly, the measured pattern shows some deviation in the oxygen sublattice from the ideal template that gives rise to the quasi lattice matched GaN growth on the LiNbO3 x face demonstrated in Ougazzaden et al (2008).
This notwithstanding, as no evidence of long ranging reconstructions at the x-cut has been found experimentally, available computational investigations are restricted to  surface unit cell (Sanna and Schmidt 2010c, Sanna et al 2014b). Along the x direction, lithium niobate can be thought of as a non-polar succession of −O
 Li6Nb
Li6Nb O
O atomic layers. To model the stoichiometric and non-stoichiometric terminations perpendicular to the [2
 0] direction, a bulk region consisting of 9 atomic layers has been considered (see figure 15). As surface terminations, −Li6Nb
 , with
  and −
and − and -
and - , with
  ,
,  , have been modeled. This gives rise to the surface layers reported in table 2. Each stoichiometry has been investigated within different starting geometries. We want to remark that the choice of candidate surface terminations does not include all the conceivable surface stoichiometry, but is rather a rough sampling that allows to scan systematically over different compositions. Other stable surface terminations might enter the phase diagram. However, this will not fundamentally change the main conclusions of the theoretical models, such as the outlined chemical trends and the surface structure.

Figure 15. Slab used to model the thermodynamically stable  periodic LiNbO3(2
  0) surfaces, commonly known as LiNbO3 x-cut. The surface termination and the underlying surface region are free to relax, while the remaining atoms are kept frozen at their bulk positions (bulk region). Atomic color coding as previously defined.
Download figure:
Standard image High-resolution imageTable 2. Ionization energy W and surface-induced electric dipole modification  calculated for the investigated terminations of the LiNbO3 x-cut (left hand side) and y-cut (right hand side). All values are expressed in eV.
| Term. |  |
 |
Term. |  |
 |
|---|---|---|---|---|---|
| −Li3 | 7.5 |  |
−Li | 6.6 | 0.7 |
| −Li6 | 6.5 |  |
−LiNb | 5.8 | 0.0 |
| −Li9 | 6.4 |  |
−LiNb2 | 6.0 | 0.1 |
− |
6.6 |  |
−Li2 | 5.7 |  |
| −Li6Nb6 | 6.3 |  |
−Li2Nb | 5.8 | 0.0 |
| −Nb3 | 7.5 | 0.4 | −Li2Nb2 | 6.2 | 0.4 |
| −Nb6 | 6.7 |  |
−Nb | 6.4 | 0.6 |
| −Nb9 | 6.9 |  |
−Nb2 | 6.1 | 0.3 |
− |
7.5 | 0.3 | −O1 | 7.5 | 1.6 |
| −O3 | 6.2 |  |
−O2 | 7.4 | 1.5 |
| −O6 | 6.2 |  |
−O3 | 7.8 | 1.9 |
| −O9 | 7.7 | 0.5 | −O4 | 7.7 | 2.0 |
− |
8.5 | 1.4 | −O5 | 6.8 | 1.0 |
− |
8.6 | 1.5 | −O6 | 6.8 | 1.0 |
− |
8.2 | 0.9 | −Li2Nb2O6 | 7.9 | 2.0 |
4.1. Phase diagram
Using the formalism described in section 3, the different terminations can be compared at different thermodynamic conditions, i.e. for different values of the chemical potentials. The calculated surface phase diagram is shown in figure 16, whereby the thermodynamically allowed range is highlighted. In general, Li enriched terminations are favored. The − termination dominates the diagram as it occurs under most growth conditions. Yet, other terminations such as the stoichiometric layer −Li6Nb
 and −Li9 (under very O-rich conditions) can be formed.

Figure 16. Phase diagram of the LiNbO3(2  1 0) surface (or x-cut) at different growth conditions and in absence of foreign adsorbates. The highlighted region indicates the thermodynamically allowed range of the chemical potentials. Beyond these boundaries new bulk phases such as O2, metallic Li, Nb and their oxides start to precipitate on the LiNbO3 surfaces (Sanna and Schmidt 2010c).
Download figure:
Standard image High-resolution image4.2. Simulation of FM-AFM images
The information contained in the calculated phase diagram can not be directly compared to the available AFM images. In order to determine which of the stable termination has been imaged in AFM studies, simulated AFM images are necessary. However, the simulation of AFM records is not trivial, as different aspects of the experimental setup must be considered (Sanna et al 2015).
The first issue consist in the correct evaluation of the forces acting on the AFM tip. AFM experiments are crucially influenced by van der Waals interactions between tip and substrate. These arise from the dynamical and mutual reaction of fluctuating charge distributions. Semilocal exchange and correlation functionals such as the GGA employed for the simulations shown in this review do not model dispersion forces, have to be included separately in the calculations. A popular resort to deal with this issue is the addition to the energy functional of a correction that is derived from the London dispersion formula. In particular the approach proposed by Grimme (2006) has been used to obtain the images shown in the following.
The second issue concerns the modelling of the AFM tip. The typical length of commercial tips is about one l μm, and their curvature radii is on the order of nanometers, meaning that the system size is well beyond the capability of actual DFT simulations. However, a model tip can be efficiently restricted to a few Si atoms, as the interaction of the lowest Si atomic layers with the surface is the dominant contribution. Ideal and pure Si tips are not realistic, as real tips are expected to oxidize as soon as they are not operated in UHV conditions. Commercial tips are furthermore chemically inert as a result of by different treatments. Thus, the dangling bonds of usually fourfold coordinated Si are possibly saturated by H atoms. In the configuration illustrated in figure 17(a), which has been employed for the calculations, a oxidized Si tip with saturated dangling bonds is reproduced, in which the Si atom retains the tetrahedral coordination as in Si bulk. Using the depicted model tip, AFM images are modeled calculating the magnitude of the force acting on the O atom of the tip, evaluated for a mesh of equidistant points at the surface. The number of 126 raster points per surface unit cell corresponds to a sampling point each 1 Å. The forces between two calculated points are interpolated with a bicubic algorithm (Preusser 1989).

Figure 17. Simplified model representing the oxidized Si tip for AFM simulations (a) and theoretically modeled AFM records for the stable, − terminated LiNbO3 x surface (Sanna et al 2015). The oblique pattern compatible with AFM experiments (Sanna et al 2014b) is highlighted and corresponds to the uppermost oxygen layer (See figure 18).
Download figure:
Standard image High-resolution imageThe AFM simulations reveal qualitatively different patterns for each of the stable surface terminations. While the − terminated (
 0) surface yields to an AFM map, which is compatible with the experimental data, this does not hold true for the −Li6Nb
 and −Li9 x-cut terminations. The AFM pattern calculated for the −
 termination is shown in figure 17(b), and perfectly matches corresponding measurements reported in Sanna et al (2014b). The extrapolated oblique pattern has dimensions of 0.76 nm × 0.55 nm, and
  , which perfectly matches the experimental data. It has to be mentioned, however, that this pattern mirrors periodicity of the oxygen sublattice and does not correspond to the surface unit cell. In fact the surface unit cell is orthogonal and much larger with dimensions of 1.390 nm and 1.788 nm, as thoroughly described in Sanna and Schmidt (2010c). The bright spots in the simulated AFM images occur in correspondence of the O atoms, while the cations below the oxygen layer (Li, Nb) are not detectable, neither in the measured nor in the simulated AFM images. It can be supposed that the highly electronegative O atoms tend to collect electronic charge in their close neighborhood, increasing the interaction with the AFM tip. This is also compatible with the interpretation of the AFM records on the basis of the electronic charge distribution proposed in Sanna et al (2014b).
4.3. Properties and morphology of stable surfaces
The stable − surface termination identified by DFT and AFM comparison is shown in figure 18. The rectangular surface unit cell as well as the oblique pattern compatible with atomic force microscopy experiments of Sanna et al (2014b) are highlighted. The hallmark of this termination is the relaxation of a single −O3 layer above the topmost −
 layer. These upmost oxygen atoms govern the AFM contrast mechanism acting as charge accumulation centers. Otherwise, only a minor surface relaxation is observed, which can be well described as an inward motion of the outmost cationic layer. Indeed, the separation between the two outmost atomic layers in the −
 surface termination amounts to 0.23 nm, while the distance consecutive cationic planes in bulk LiNbO3 is calculated in 0.26 nm. The calculated value of 0.23 nm is excellent agreement with available measurements (0.24 nm ± 0.02 (Sanna et al 2014b), 0.24 nm (Kalabin et al 2003) and 0.28 nm (Wong 2002)).

Figure 18. Calculated atomic model of the thermodynamically stable, − terminated LiNbO3 x surface (space-fill model). White atoms are Nb, gray atoms Li, and small red atoms O. The rectangular surface unit cell as well as the oblique pattern compatible with atomic force microscopy experiments from Sanna et al (2014b) are highlighted.
Download figure:
Standard image High-resolution imageA common feature of the stable terminations of polar oxide is that they tend to minimize both the surface induced electric dipole as well as the surface work function. In the particular case of the lithium niobate x-cut there is no single termination characterized by both the smallest work function and surface dipole at the same time. Yet a glance at table 2 reveals that the stable − is among the terminations with the lowest work functions (6.6 eV) and induces at the same time one of the smallest surface-induced electric dipole moments (
 eV). In this respect, negative dipole values in the table mean that the dipole points against the positive x direction.
The dominance of the − surface termination confirms the accepted fact that the stability of non-stoichiometric phases is a phenomenon common to most of the transition metals oxide surfaces (Reuter and Scheffler 2001). Similarly to other oxides with the corundum structure (M2O3), the metallic termination is the most stable one, at least as long as the environment in contact with the surface is free from H atoms (Reuter and Scheffler 2001). Indeed, corundum structured oxides have an atomic structure, which is very similar to LiNbO3, in which both cationic sites within the distorted oxygen octahedra are occupied by the same atom type.
5. The y-cut
The y-cut of lithium niobate is exploited in many applications, e.g. for the fabrication of SAW devices (Tseng et al 2006). Moreover, ferroelectric microdomain reversal has been achieved on y-cut LiNbO3 surfaces (Seibert and Sohler 1991). The LiNbO3 y-cut has also gained the interest of the scientific community for reasons beyond its technological relevance, as in 2009 a surprising surface charge, which is not expected for a non-polar material cut, was measured by piezoresponse force microscopy (Johann 2009).
LiNbO3 can be thought of as a stacking of Li2Nb2O6 atomic layers along the y direction, as shown in figure 19. As discussed in section 2.2, the y axis, corresponding to the [1  0 0] or the equivalent [0 1
  0] and [
 0 1 0] crystallographic directions, lays in a mirror symmetry plane. Hence, every charge displacement resulting from a compression in this direction is not compensated for and induces an electric polarization (piezoelectricity). The y axis is therefore non-polar but piezoelectric, and has a well defined orientation, as the positive and negative orientation are not equivalent. This is in contrast with the x direction, which is perpendicular to a mirror plane and is therefore identic along the positive and negative direction. The sense of the y axis is determined similarly to the orientation of the z axis. Upon compression the
  face becomes negatively charged and the
  face positively charged (Weis and Gaylord 1985).

Figure 19. Slab used to model the thermodynamically stable  periodic LiNbO3(1
  0 0) surfaces. The surface termination and the underlying surface region are free to relax, while the remaining atoms are kept frozen at their bulk positions (bulk region). Atomic color coding as previously defined.
Download figure:
Standard image High-resolution imageA further peculiarity of the y-cut is that although ferroelectric LiNbO3 can be thought of as a stacking non-polar Li2Nb2O6 atomic layers along this direction, stoichiometrically equivalent positive and negative surfaces are morphologically not equivalent. This fact, pointed out by Sones et al (2002), is illustrated in figure 20. In the case illustrated in the picture, Nb atoms are located above a cationic vacancy at the left hand side termination and above a Li atom at the right hand side termination. Thus, each surface termination is characterized by its own morphology and formation energy at the positive or at the negative y side. Though, DFT models have revealed that the differences between positive and negative y termination are minor and do not qualitatively influence the surface morphology and the calculated phase diagram. For this reason, we provide in this work a single phase diagram, which is in first approximation valid for both the  and the
  -cut, and limit our discussion of the stable surfaces to the positive y side.

Figure 20. Although ferroelectric LiNbO3 can be thought of as a stacking non-polar Li2Nb2O6 atomic layers, stoichiometrically equivalent positive and negative surfaces are morphologically not equivalent. In the case illustrated in the picture, Nb atoms are located above by a cationic vacancy at the left hand side termination and above a Li atom at the right hand side termination.
Download figure:
Standard image High-resolution imageThe slab used to model the  periodic LiNbO3(1
  0 0) surfaces is shown in figure 19. Thereby 13 atomic layer model the bulk and 5 atomic layer plus surface termination model the surface region. The bulk region comprehends atoms that are kept frozen at their bulk position to model the crystal bulk, while the atoms of the surface termination and of the surface region may relax freely.
The stoichiometry of the terminations that have been considered to model the y-cut includes −Ox, with  and −Li
 Nbj, with
  as well as all possible combinations, which are compiled in table 2. Each stoichiometry is realized by many different starting geometries. In this way, both stoichiometric and non-stoichiometric terminations are modeled, however the calculations are restricted to slabs with the
  surface periodicity. Similarly to the case of the x-cut, it is not possible to model all imaginable terminations. Hence, larger supercells with finer composition variations might be required to pinpoint the exact stoichiometry of real surfaces.
5.1. Phase diagrams
The calculated phase diagrams of the positive lithium niobate y-cut in dependence on the chemical potentials  and
and  is shown in figure 21. Again,
  is expressed in terms of
  and
and  , as the latter are more easily controlled during the crystal growth. The highlighted region in the diagram shows the thermodynamically allowed conditions.

Figure 21. Phase diagram of the LiNbO3 y-cut at different growth conditions and in the absence of foreign adsorbates (Sanna and Schmidt 2010c). The highlighted region indicates the thermodynamically allowed range of the chemical potentials. Beyond these boundaries new bulk phases start to precipitate on the LiNbO3 surfaces.
Download figure:
Standard image High-resolution imageThe dominant termination in the phase diagram of the y-cut is the truncated bulk −Li2Nb2O6, which is formed for most growth conditions. Though, the y-cut can become Li-terminated or O-terminated at strongly Li-rich or O-rich growth conditions, as shown in figure 21. Similarly to the situation occurring at the x-cut, and as we shall see also in the case of the z-cut, the y surfaces are generally Li and O enriched, while Nb terminated surfaces are energetically disadvantaged and are not formed in thermodynamic equilibrium conditions. This seems to be a general feature of all lithium niobate surfaces.
5.2. Properties and morphology of stable surfaces
The dominant −Li2Nb2O6 termination is represented in figure 22. The formation energy of this termination at the positive and at the negative side differs by about 0.15 eV and shows no major difference in the atomic structure. Noteworthy, it is the only lithium niobate surface, among the investigated directions, which retains stoichiometric composition.

Figure 22. Calculated atomic model of the thermodynamically stable, −Li2Nb2O6 terminated LiNbO3 y-cut (space-fill model). White atoms are Nb, gray atoms Li, and small red atoms O (Sanna and Schmidt 2010c). The rectangular surface unit cell is highlighted.
Download figure:
Standard image High-resolution imageAssuming the dominant bulk termination to be formed in the samples measured by piezoresponse force microscopy experiments by Johann (2009), it can, at first sight, hardly be the origin of the observed surface charge. However, the stoichiometric termination cannot be regarded to as a simple truncated bulk. Although limited to the outer four atomic layers, the surface relaxation introduces important changes in the surface morphology. Indeed, it is characterized by an outward relaxation of two oxygen atoms above the cation layer, which experiences some rearrangement.
This surface relaxation results, in turn, in a large surface dipole of 2.0 eV, one of the largest values of all the investigated terminations (see table 2). In order to compensate the surface dipole, a depolarizing field is produced by the surface charge layer. The surface charge can thus be interpreted as the crystal response to the large surface dipole. The pronounced relaxation of the surface atoms with the formation of a strong surface dipole (the LiNbO3 y-cut is piezoelectric) may explain the surface charge observed in these nominally non-polar cuts (Johann 2009). The presence of surface charge may also explain the strong affinity of the y-cut for polar molecules such as water, as pointed out by adsorption measurements. For the same reason, XPS spectra indicate the presence of OH groups at the surfaces for all the measured conditions (Cordero-Edwards et al 2016). In addition, a direct relation was found between the capacity of the surface to discharge and/or to screen surface charges and the affinity for water.
Unfortunately, no experimental information about the morphology of the LiNbO3 y-cut at the microscopic scale, nor information concerning other fundamental properties is currently available. More experimental and theoretical investigations are required to improve our knowledge of this surface.
6. The z-cut: surfaces in vacuum
The largest part of investigations dedicated to the lithium niobate surfaces deal with the z-cut. This surface has aroused the interest of the scientific community due to its strongly polar nature, which potentially allows for many and novel applications. Correspondingly, several theoretical studies have been dedicated to the investigation of this surface in the last decade. Following the publication of the pioneer works providing structural models (Levchenko and Rappe 2008, Sanna et al 2010) for oppositely polarized surfaces, the knowledge of the surface morphology and stoichiometry has been employed to predict many fundamental properties of the surface and explain several experiments. We start our résumé of the theoretical studies dedicated to this LiNbO3 cut with the structural determination, and show thereafter how the surface models have been employed to interpret available experiments.
The relative stability of many distinct surface structure candidates, representing stoichiometric and non-stoichiometric surface terminations with different morphology has been tested in the last decade. The termination −Nb−O Liy has been considered at the positive z-cut, and the termination −Li
 Oi has been considered at the negative z-cut, whereby
  , 2, 3, 4,
  , 1, 2,
  , 1, 2, 3, and
  . Each combination of x and y can be realized in many geometries, so that more than 80 different slabs have been modeled. In this way all the possible bulk cuts as well a large variety non-stoichiometric surfaces within the
  periodicity have been modeled. Although terminations with an higher content of Li, Nb or O are theoretically possible, a posteriori inspection of the results shows that the chosen maximum content of Li, Nb and O atoms at the surfaces is sufficient. We remark that for structural determination only the
  surface unit cell has been considered. Larger surface unit cells are required to exactly determine the stoichiometry of real surfaces. Though, the physical picture derived from the chosen approach will not be altered by this limitation.
The slab employed to model the dominant  periodic LiNbO3(0 0 0 1) surface terminations is shown in figure 23. The surface regions (built up by the termination and the underlying three trilayer) can freely relax, while the bulk region, composed by the six central trilayers, is kept frozen at the bulk structure. The positive z-cut—LiNbO3(0 0 0 1)—is displayed at the right hand side, the negative z-cut—LiNbO3(0 0 0
  )—is displayed at the left hand side.

Figure 23. Slab used to model the dominant  periodic LiNbO3(0 0 0 1) surface terminations. The surface region is built up from the surface termination (different at the positive and at the negative side) and the underlying three trilayer. The positive surface LiNbO3(0 0 0 1) is represented at the right hand side, the negative surface LiNbO3(0 0 0
  ) is represented at the left hand side. The surface regions are free to relax, while the bulk region, comprehending six central trilayers, is kept frozen in the bulk structure. Atomic color coding as previously defined (Sanna et al 2014a).
Download figure:
Standard image High-resolution image6.1. Phase diagrams
The phase diagrams of the positive and negative LiNbO3 (0 0 0 1) surfaces as shown in figure 24 can be plotted calculating the formation energy as given by equation (15) of the considered surface geometries at each point  . It is evident from figure 24 that the stoichiometry of the positive and negative z-cut is very different. This suggests that distinct stoichiometry modifications occur to stabilize oppositely polarized surfaces. It can be furthermore observed that as a general trend the terminations of the positive z-cut are more oxygen rich than the terminations of the negative z-cut under identic thermodynamic conditions. In the highlighted area marking thermodynamically stable conditions the only stable stoichiometry at the positive z-cut is −Nb−O
 Li2, while at the negative z-cut the O−Li−termination occurs under most conditions. Under strong O-rich conditions, the surface may become O
 or O
or O terminated, though. A side view of the stable terminations is shown in figure 23. All the thermodynamically stable terminations are non-stoichiometric, i.e. the lithium niobate z-cut modifies its atomic composition to decrease the surface excess free energy. All available theoretical investigations came to the same conclusions concerning the energetics, stoichiometry and the morphology of the LiNbO3 z-cut terminations (Levchenko and Rappe 2008, Sanna and Schmidt 2010c, Sanna et al 2010).

Figure 24. Phase diagrams of the clean LiNbO3 z-cut at different growth conditions. (a) is the positive face and (b) the negative face. The unlabeled region is in both cases the Nb-terminated LiNbO3 truncated bulk. The highlighted region marks the thermodynamically allowed range of the chemical potentials. Beyond these boundaries new bulk phases start to precipitate at the LiNbO3 surfaces (Sanna and Schmidt 2010c).
Download figure:
Standard image High-resolution image6.2. Properties and morphology of stable surfaces
The equilibrium atomic structure of the dominating phases at the positive and negative LiNbO3(0 0 0 1) surfaces is illustrated in figure 25. The negative z-cut displays the same succession of the atomic layers along the [0 0 0 1] axis as in the LiNbO3 bulk, while at the positive z-cut one Li layer relaxes down into the lower laying oxygen plane, as shown in figure 23. Apart from this rearrangement, the atomic relaxation is minor and limited to the two outer trilayers for both the positive and negative z-cut. The atomic relaxation results mainly in an outward displacement of the cationic layers.

Figure 25. Space-fill models of (a) the thermodynamically stable, −Nb−O Li2 terminated LiNbO3(0 0 0 1) surface (
 cut) and (b) of the stable −Li−O terminated LiNbO3(0 0 0
  ) surface (
 cut). White atoms are Nb, gray atoms Li, and small red atoms O. The
  hexagonal surface unit cells are highlighted (Sanna and Schmidt 2010c).
Download figure:
Standard image High-resolution imageIn order to find out which stabilization mechanisms play a prominent role, the surface dipole moment variations  have been estimated for each considered termination. Thereby an unrelaxed bulk termination (i.e. the truncated bulk cut) has been used as a reference. More precisely,
  has been quantified for each termination as the difference of the total electrostatic potential between the vacuum region and the bulk. The results are shown in table 3. A positive dipole moment indicates that the dipole is directed alongside the bulk spontaneous polarization. Due to the choice of the truncated bulk as a reference, the terminations with stoichiometric composition, i.e. −Nb−O
 Li at the positive z-cut and Nb− at the negative z-cut display rather small electric dipole variations, which are only caused by the structural relaxation. The thermodynamically stable terminations, i.e. −Nb−O
 Li2 at the positive z-cut and O−Li− at the negative z-cut, give rise to a dipole moment directed contrary to the spontaneous polarization. They are indeed expected to reduce the total polarization and hence the surface charge, thus stabilizing the LiNbO3(0 0 0 1) surface. Yet, non-stable terminations such as the −Nb−O− Li at the positive face or O− at the negative face can reduce to a larger extent the total polarization and hence the polarization charge, as they carry an even larger surface dipole directed against the ferroelectric polarization. So, it has been concluded that the occurring surface terminations are not determined by a single, dominant stabilization mechanism, but rather by the interplay of different stabilization mechanisms. In a recent publication Levchenko and Rappe have explained the stability of the stable structures at the positive and at the negative z-cut in terms of surface charge passivation by ions (Levchenko and Rappe 2008).
Table 3. Ionization energy ( and
and  ) as well as surface-induced electric dipole moment
  of all the considered terminations of the positive (left hand side) and negative (right hand side) z-cut. A positive dipole sign indicates that the dipole is directed alongside the ferroelectric polarization. All values are expressed in eV.
| Term. |  |
 |
Term. |  |
 |
|---|---|---|---|---|---|
| −Nb−O | 9.7 | +1.8 | — | 6.3 |  |
| −Nb−O2 | 9.9 | +2.3 | O− | 9.9 |  |
| −Nb−O3 | 10.3 | +2.5 | O |
8.7 |  |
| −Nb−O4 | 8.8 | +1.2 | O |
8.6 |  |
| −Nb−O−Li | 5.6 |  |
Li− | 5.6 |  |
−Nb−O Li Li |
5.7 |  |
O−Li− | 4.9 |  |
−Nb−O Li Li |
7.5 |  |
O Li− Li− |
5.8 |  |
−Nb−O Li Li |
7.6 |  |
O Li− Li− |
7.3 |  |
| −Nb−O−Li2 | 5.9 |  |
|||
−Nb−O Li2 Li2 |
5.5 |  |
|||
−Nb−O Li2 Li2 |
6.5 |  |
|||
−Nb−O Li2 Li2 |
10.4 | +2.1 |
In their model, they estimate the surface charge of a ferroelectric lithium niobate truncated bulk cut by means of Berry phase calculations (King-Smith and Vanderbilt 1993, Resta 1994). A net, bound surface charge of  is calculated for the positive stoichiometric surface, and a net bound surface charge of
  is calculated for the negative stoichiometric surface. The addition of an additional Li atom at the positive surface by the −Nb−O
 Li2 termination stabilizes a hole and reduces the charge to
  . On the negative surface, the calculated bound charge of
  is stabilized by the addition of a
  charge coming from the −O− Li termination, which thus reduces the net surface charge to
  . This last
  can be then passivated with mobile charges or with submonolayer coverage of additional ions. Thus, even if the potential created by the surface polarization charges is larger than the band gap, the passivation by ions is favored over the passivation by charge carriers such as electrons or holes.
DFT calculations predict both occurring terminations, −Nb−O Li2 at the positive z-cut and O−Li− at the negative z-cut to be insulating.
The density of states (DOS) calculated for the bulk structure of LiNbO3, and the partial DOS calculated for the z-cut surface region, including the last three trilayers plus the surface terminations of the slabs used to model the two surfaces, are shown in figure 26. The surface partial DOS has been calculated correcting for the potential variation within the slabs. The DOS calculated for a bulk and that calculated for the surface slabs are very similar. This suggests that the formation of the surface terminations does not significantly modify the lithium niobate fundamental band gap. It also reveals that the surface remain insulating, hindering scanning tunneling microscopy investigations.

Figure 26. Partial density of states (PDOS) calculated for the positive (upper part) and negative (lower part) LiNbO3 z-cut (Sanna and Schmidt 2010c). The surface is defined as built of the outmost three LiNbO3 trilayers plus termination of the slab used to simulate the stable surfaces (see figure 23). The bulk DOS is displayed for comparison. The surface terminations, irrespective of their polarity, do not appreciably affect the fundamental band gap. The zero of the energy scale is set at the bulk valence-band maximum.
Download figure:
Standard image High-resolution image6.3. Interpretation of available experiments
6.3.1. Photoelectron emission microscopy.
A puzzling difference of about 2 eV in the electron affinity of differently polarized surfaces was demonstrated by photoemission experiments (Yang et al 2004). The knowledge of the z-cut morphology and stoichiometry allows for the interpretation of these measurements. The surface ionization energy of the two z surfaces ( ,
,  ) has been estimated for all the considered terminations according to the procedure described in Qian et al (1988) and listed in table 3. The ionization energy W of a semiconductor is the sum of two contributions, the (constant) bulk band gap energy Eg, and the electron affinity χ, as illustrated in figure 27. The latter is a surface specific quantity, and is determined by the surface-induced electric dipole and by further surface effects such as reconstructions, atomic steps and adsorbates.

Figure 27. Schematic energy-band diagram of (a) a non-polar LiNbO3 surface, (b) the positive and (c) the negative LiNbO3 z-cut.  and
and  are the electronic affinity and its variation, Eg is the fundamental electronic band gap, Ec, Ev and Evac are conduction band, valence band and vacuum energies, W is the ionization energy. Superscripts
  and − represent the quantities of positive and negative domains, respectively (Sanna and Schmidt 2010c).
Download figure:
Standard image High-resolution imageDFT predicts ionization energies  eV for the positive z-cut and of
  eV for the negative z-cut, in very good agreement with the corresponding quantities measured by UV-photoelectron emission microscopy (PEEM) at ≈10
 torr of
  eV for the positive z-cut and
  eV for the negative z-cut (Yang et al 2004). The ionization energy differences shown by the experimental results were interpreted as the consequence of different adsorbates present at differently polarized surfaces, which contribute in different manner to the surface electric dipole and thus to the surface electron affinities. Yet, DFT calculations suggest that substantial differences in the ionization energy of the differently polarized z surfaces are already present in clean surfaces, and is largely determined by the different surface terminations. The remaining discrepancy between theory and experiment (of the order of magnitude of 0.1 eV) can be traced to the adsorption of distinct species on oppositely polarized surfaces.
It can be observed that the occurring surface terminations present modifications of the stoichiometry and morphology with respect to an ideal bulk cut that lead to a substantial reduction of more than 1 eV of the work function (precisely, from 7.5 eV of the bulk termination to 6.5 eV for the positive and from 6.3 to 4.6 eV in the case of the negative z-cut). This indicates that the work function reduction stabilizes LiNbO3 polar surfaces. Yet, in the case of the positive z-cut, other non-stable terminations would yield to much lower surface ionization energies, suggesting that lowering the ionization energy is not the only stabilization mechanism determining the occurrence of a given termination.
6.3.2. Mass spectrometry.
It is known from temperature programmed desorption and mass-spectrometric experiments that distinct and well defined evaporation regimes take place by annealing LiNbO3 z-cut samples at determined temperatures. More in detail the evaporation rate of LiO gas from  faced lithium niobate is one order of magnitude larger than from
  faced LiNbO3. In addition the evaporation of lithium and oxygen gases (i.e. monoatomic Li and molecular O2) from the negative z-cut is almost negligible (Lushkin et al 1999). The evaporation of different gases from the LiNbO3 z-cut was interpreted as a reduction process balancing the oxygen content within the sample and the surrounding environment. This process should lead to the transport of O atoms from the crystal bulk to the surface to replace the atoms evaporating from the crystal termination.
The calculated surface terminations show a non stoichiometric composition for both polarization directions. However, the positive surface is richer in O than its negative counterpart, as a result of the surface stabilization mechanisms. It is also richer in Li, which provides low-energy surface states to accommodate the screening holes. Due to the enrichment in Li and O exclusive to the positive z-cut with respect to the bulk, it seems obvious that the evaporation from the LiNbO3(0 0 0 1) occurs more readily than from the LiNbO3(0 0 0  ).
).
The evaporation of different species at distinct temperatures and, more important, the characteristic behavior of differently polarized surfaces can be understood from the calculated surfaces phase diagrams shown in figure 24. Indeed, the phase diagram does not yield only information concerning the stable surface terminations, it can be also employed to interpret the phase transitions, i.e. the stoichiometry changes revealed by the experiments.
With decreasing chemical potentials  and
and  the dominating termination of the
  -cut −Nb−O
 Li2 is subject to the evaporation of Li and O gases and results −Nb−O terminated. Similarly, Li and O gases evaporate from the O−Li− terminated
  -cut, which results Nb − terminated. These transitions occurring for decreasing chemical potentials are indicated by the arrows in figure 28. A closer look at the DFT calculated phase diagrams shows that the transformation from O−Li−to the Nb−termination at the LiNbO3
  -cut takes place at lower values of the chemical potentials than the transformation from −Nb−O
 Li2 to the −Nb−O termination at LiNbO3
  -cut. As lower values of the chemical potentials correspond to higher temperatures, the calculated phase diagrams show why the measured desorption of LiO gases from the positive z-cut at a given temperature is an order of magnitude larger than the desorption from the negative z-cut (Lushkin et al 1999). No Nb loss is predicted by DFT calculations, nor has it been observed, if not at very high temperatures, rather close to the Curie temperature (approximately 1483 K). Thus the calculated phase diagrams explain why evaporation of several gases including Li, LiO and O2 but not of Nb was reported from the positive and from the negative z-cut (Lushkin et al 1999).

Figure 28. Phase diagram of the positive (a) and negative (b) LiNbO3 z-cut. The arrows represent transitions from the thermodynamically stable terminations due to the evaporation of Li and O (Sanna and Schmidt 2010c).
Download figure:
Standard image High-resolution image6.3.3. Ion scattering spectroscopy.
Ion scattering spectroscopy (ISS) measurements by Yun et al have demonstrated that both the positive and the negatively polarized surfaces are predominantly terminated by O atoms (Yun et al 2007b). Co-axial impact collision ion scattering spectroscopy (CAICISS) performed by different research groups shows that the z-cut after thermal treatment are terminated by a Nb atomic layer, in which the Nb atoms are not displaced from the bulk positions (Tabata et al 1998, Saito et al 2004), irrespective of the polarization directions. Both experiments can be interpreted on the light of the calculated structure models and phase diagrams.
The calculated surface terminations −Nb−O Li2 and −Li−O of not tempered samples will appear in ISS predominantly terminated by O atoms, considering that Li atoms have a small atomic number and mass, and result almost undetectable by ISS, thus confirming the experimental observations of Yun et al The phase diagrams also explain the measurements on annealed samples. As shown in the previous paragraph, Li and O gases evaporate upon annealing from the stable positive and the stable negative z-cut, which thus become −Nb−O and Nb − terminated respectively, appearing predominantly Nb-terminated in CAICISS. This is an important finding, as a temperature treatment is usually performed to purge the lithium niobate samples from adsorbed molecules and other impurities, as well as to achieve homogeneous surfaces flat up to the atomic scale as required by several applications (Lee 2002).
Thus, the evaporation of different species at different temperatures predicted by the phase diagrams explains the apparent contrast resulting from experiments in which the LiNbO3 z-cut surface appears to be predominantly oxygen-terminated (Yun et al 2007b), while in other it seems to be terminated with an Nb atomic layer (Saito et al 2004).
6.3.4. Raman spectroscopy.
Raman spectroscopy is a technique that has been applied to probe microstructures and defects both in lithium niobate crystals and devices (Berth et al 2009, Fontana and Bourson 2015). Stone et al have employed Raman spectroscopy to investigate domain inverted and pristine congruent and stoichiometric lithium niobate. They have measured a frequency shift of the phonon modes from the inverted domains in congruent samples, demonstrating that the Raman signal is sensitive to the internal electrical fields (Stone et al 2011) and to the presence of domain walls (Stone and Dierolf 2012). The latter holds for nearly stoichiometric samples, too. These studies suggested the possibility to employ Raman measurements for the determination of the polarization direction. Berth et al have performed confocal μ-Raman spectroscopy analyses to investigate the LiNbO3 z-cut (Sanna et al 2011b) and the domain structure in periodically poled lithium niobate (Berth et al 2011). Due to the combination of spatial resolution and spectral information, sample imaging via specific phonon mode modulation was achieved. Moreover, surface localized phonon modes have been demonstrated carrying out the excitation under grazing incidence, at both the positive and negative z-cut.
The occurrence of surface localized phonon modes both at the positive and at the negative z-cut has also been demonstrated by means of atomistic calculations (Sanna et al 2011a). Collective vibrations whose eigenvectors are localized by more than 50% in the surface termination or in the adjacent atomic trilayer were thereby considered as surface-localized phonons. Following this definition, the phonon modes localized at the two surfaces were predicted in a wide frequency range between 100 and 950  . The calculated modes are substantially different for the positive and for the negative face, and are also different from the bulk modes. This is not surprising, because of the different stoichiometry and morphology of the two terminations. Several modes with similar eigenvectors could be identified at the two surfaces, e.g. involving an antiphase movement of the Li sublattice along the z direction. These modes are typically softer at the LiNbO3(0 0 0
  ), suggesting weaker atomic bonds at the negative z-cut termination.
Even if these pioneering studies have shown that Raman spectroscopy is sensitive to differences between the crystal bulk and the surface as well as between positively and negatively polarized z cut, more studies are necessary to thoroughly understand the vibrational properties of lithium niobate surfaces. Only few calculated modes with vertical displacement could be assigned to the measured Raman peaks. An exhaustive phonon classification according to the eigenvector's symmetry properties, as well as the assignment of the calculated phonon eigenvectors and frequencies to the measured peaks are still pending. No information is available concerning the vibrational properties of the x or y-cut. Furthermore the origin of the Raman signal modulation at the domain walls is still not completely understood.
Summarizing, DFT calculations have shown that the vibrational properties represent a fingerprint of the positive and negative lithium niobate z-cut, and therefore Raman spectroscopy may represent an alternative, non-destructive method to identify the polarization orientation, which does not exploit neither the pyroelectric nor the piezoelectric properties of the material.
6.4. Simulation of FM-AFM images
Atomic force microscopy has become one of the foremost tools for the surface analysis. In particular, it is one of the few experimental techniques that allow to investigate insulating substrates in real space with atomic resolution. Moreover, the AFM technique has been recently improved in order to be operated at the solid-liquid interface (Fukuma et al 2005a, Rode et al 2011). Fukuma and co-workers have provided the experimental evidence of atomic-resolution imaging capability of AFM in aqueous solutions, thus allowing for imaging of polar surfaces (Fukuma et al 2005b, Rode et al 2009). AFM experiments showing the morphology of  periodic (i.e. non-reconstructed) lithium niobate z-cut samples (Rode et al 2012), as well as AFM investigations suggesting the formation of long ranging surface reconstructions at sampleas annealed at higher temperatures (Sanna et al 2013) are available. These experiments have also provided the evidence of a direct correlation between temperature, surface reconstruction and surface polarization charge (Sanna et al 2014a). All the mentioned studies are performed in aqueous solutions, as the unscreened surface charges present at the ferroelectric LiNbO3 z-cut, and more in general on polar surfaces, drastically hinder high-resolution imaging in UHV.
Quite surprisingly, really atomic resolved AFM maps have been achieved only at the negative z-cut, i.e. at the LiNbO3(0 0 0  ). This unusual feature can be explained by the different spatial modulation of the wave functions of tip and sample at the positive and negative z-cut. The form of the wave functions governs indeed the AFM mechanisms and determines the resolution limit. Therefore, the different resolution achieved at differently polarized LiNbO3(0 0 0 1) surfaces has been described in Rode et al (2012) as an intrinsic surface property, and interpreted in terms of distinct surface roughness and interatomic bonds at oppositely polarized z-cut surfaces. AFM images simulated within DFT clearly support this interpretation.
Figure 29 shows simulated AFM images of the LiNbO (a) and of the LiNbO
 (b) surfaces, respectively. The DFT simulations were performed with the approach described in section 4.2 and with the tip shown in figure 17(a). The AFM images display a
  surface periodicity irrespective of the surface polarity. This periodicity represents the non-reconstructed hexagonal surface unit cell of z-cut lithium niobate with
  Å and
Å and  . The form and size of the extrapolated unit cell are in very good agreement with corresponding experimental data. The AFM image of the negative z-cut is strongly corrugated and characterized by a strong contrast, while the AFM simulation of the positive z-cut seems on contrary smooth and flat, and characterized by a much weaker force contrast. The force contrast difference is easily quantified by the DFT calculations assuming a similar tip-surface distance of about 2 Å for differently polarized surfaces. The forces experienced by the model tip at the
  -cut vary within interval between 0.05 and 0.28 eV
  , while the forces experienced by the tip at the
  -cut are within the much smaller range between 0.05 and 0.10 eV
  .
.

Figure 29. Theoretically modeled AFM records for the (a) negative, −Li−O terminated and (b) for the positive, −Nb−O Li2 terminated LiNbO3(0 0 0 1) surfaces (Sanna et al 2015). The force differences at the positive surfaces are much lower than at the negative surface, resulting in a low force contrast. The forces are given in eV
  .
.
Download figure:
Standard image High-resolution imageThis difference is determined by two main factors. At the one hand, the positive and negative z-cut have terminations with a rather different intrinsic roughness. This has been estimated to amount to  and 2.216 at the positive and negative face, respectively (Sanna et al 2012). At the other hand, the topmost atomic layer of the negative surface is an oxygen layer, whose atoms act as effective charge accumulation centers due to their pronounced electronegativity. Indeed, the bright spots in the AFM images of the negative z-cut can be clearly assigned to the topmost O atoms. A similar topmost oxygen layer is missing at the positive surface, and the bright spots in the AFM images of the positive z-cut appear in correspondence of the topmost Li atoms. These are not charge accumulation centers as the O atoms at the opposite side. Hence, the AFM contrast difference at the positive and negative z side is compatible with the different resolution achievable by AFM at the positive and negative z-cut. This is however a difference with the x-cut, in which the AFM contrast mechanism is exclusively ruled by O atoms.
The spatial resolution achievable by AFM might be enhanced pushing the scanning tip closer to the surface. Closer to the sample, the tip experiences a steep repulsive potential (repulsive regime or repulsive region). Thus, if the AFM scans are performed in the repulsive regime, larger force differences act on the tip at neighboring surface points, increasing the spatial resolution.
7. The z-cut: interaction with foreign species
7.1. Surfaces at ambient conditions
The surfaces of the LiNbO3-based devices described in section 1.2 will be different from the ideal surfaces modelled by theory, unless the devices are operated in ultrahigh vacuum (UHV). Under ambient conditions, polar surfaces adsorb molecules, radicals, or foreign atoms and to passivate the polarization charge (Noguera 2000, Goniakowski et al 2008). The adsorption of many different molecules on lithium niobate polar surfaces has been the subject of several investigations. These focus mainly on polarization-dependent interaction between molecules and LiNbO3 z-cut. Prominent examples are the photochemical deposition of metal nanoparticles (Liu et al 2007, Dunn and Tiwari 2008), deposition of charged particles (Habicht et al 2008) and the adsorption and chemical reactions of (mainly polar) molecules on different ferroelectric substrates (Yun et al 2007a, Li et al 2008, Bharath et al 2008).
These investigations lead to a quite complex scenario, in which many mechanisms such as internal and external charge compensation at the surfaces, electrostatic forces induced by charge layers, pyroelectric and piezoelectric effects, as well as charge transfer processes play a crucial role. Moreover, as all the contributing factors are polarization dependent, the atomic/molecular adsorption will be polarization dependent too. The relative magnitude of the mentioned contribution varies strongly from ferroelectric to ferroelectric (due to different charge carrier density, fundamental band gap, defects and domain boundaries concentration) and obviously depends on its preparation (sample thickness, eventually polishing and annealing temperature) and on the laboratory conditions (substrate temperature, environment composition and pressure, light source used for the carrier excitation, etc).
A few theoretical investigations have modeled LiNbO3 polar surfaces under ambient conditions. The adsorption of common foreign adsorbates such as the air components N2, O2, CO2, CH4, H2, N2O, CO and H2O (Hölscher et al 2014) or radicals such as H and OH (Hölscher et al 2012) has been modeled in the framework of the density functional theory.
The adsorption energies calculated for the investigated adsorbates are shown in table 4. Strongly polarization dependent energies are predicted, ranging from low energies typical for physisorbed molecules (typically 0.1–1 eV) to higher energies (⩾1 eV) suggesting chemisorption. The presence of different bond types at the lithium niobate z-cut is verified by an analysis of the electronic charge redistribution upon molecular adsorption (shown in figure 30), calculated as the difference of the electronic charge density of the adsorbed system (molecule and substrate) and that of isolated surface and molecule in the geometry of the adsorbed system. While in some case (e.g. N2 at the positive surface) merely a polarization of the molecular orbitals is predicted, in other cases (e.g. O2 at the negative surface), a sizeable charge accumulation between molecule and substrate indicates a chemisorbed molecule forming a covalent bond with the oxygen atoms at the surface.

Figure 30. DFT calculated charge redistribution upon adsorption of molecular N2, O2, CO2, CH4, H2, N2O, and CO at the positive (left hand side) and negative (right hand side) LiNbO3(0 0 0 1) surface (Hölscher et al 2014). Atomic color coding as previously defined. Red regions indicate charge depletion and blue regions indicate charge accumulation, the arrows indicate the position of the molecule.
Download figure:
Standard image High-resolution imageTable 4. Adsorption energies of common air components and typical atoms contaminating clean surfaces. Ep and En label the adsorption energies at the positive and negative LiNbO3(0 0 0 1) surface, respectively. Eb is the molecular binding energy in the gas phase and  and
and  are the work function modifications upon adsorption at the positive and negative surface, respectively. All values are in eV.
| Adsorbate | Ep | En | Eb |  |
 |
|---|---|---|---|---|---|
| N2 | 0.12 | 0.75 | 16.33 | +0.33 |  |
| O2 | 1.04 | 3.76 | 8.52 | +1.04 | +0.60 |
| CO2 | 0.66 | 1.44 | 22.53 | +1.60 |  |
| CH4 | 0.08 | 0.31 | 17.83 | +0.33 |  |
| H2 | 0.06 | 0.16 | 6.68 | +0.42 | +0.93 |
| N2O | 0.19 | 3.02 | 20.92 | +0.36 | +1.09 |
| CO | 3.84 | 0.80 | 14.50 |  |
 |
| H2O | 0.61 | 1.28 | 14.01 | +0.49 |  |
| OH | 2.94 | 5.71 | 6.98 | ||
| H | 6.01 | 3.77 | |||
| C | 9.35 | 6.06 | |||
| N | 6.67 | 6.93 | |||
| O | 4.56 | 7.57 |
Both adsorption site and configuration vary from adsorbate to adsorbate and among the two polarization directions. More details can be found in Hölscher et al (2014). It is noticeable that all the investigated molecules have a rather different impact at the two z-cut surfaces. While the  surface is almost unaffected by adsorption (with the exception of a minor displacement of the oxygen atoms close to the adsorption site), the z-cut is strongly modified by all investigated adsorbates, which deeply modify its morphology. An exception in this respect is the H2 dimer, which is found to be almost completely inert. As a general trend, it is found that Li atoms are extracted from the negative z-cut and tend to form bridge structures with neighboring O atoms. These structures enhance the surface relaxation and reduce the surface excess free energy. This behavior is by no means unusual, in particular as the negative lithium niobate z-cut is known to be much more reactive than the positive one. A further manifestation of this characteristic is represented by the etching rate, which is one order of magnitude larger at the negative surface than at the positive surface (Argiolas et al 2005). In this sense, the extraction of Li atoms from the negative z-cut upon molecular adsorption can be understood as the onset of etching phenomena.
It must be mentioned that available DFT calculations simulate the molecular adsorption of single and isolated adsorbates at an otherwise ideal surface. The calculated adsorption energies and configurations might hence differ from these occurring on real surfaces. In particular, the adsorption on surfaces distorted by thermal effects or by the presence of other adsorbates or surface defects such as surface dislocations or ferroelectric domain boundaries may lead to substantially different adsorption configurations and energies.
The role of the adsorbates in stabilizing the polar surfaces can be understood by estimating the charge transfer between molecules and substrate. The latter is related to the surface work function modification upon adsorption. As a general feature, a molecule-to-substrate electron transfer tends to reduce the substrate work function. Vice versa, an increased work function suggests a substrate-to-molecule electron transfer. This picture is valid in the case of physisorbed adsorbates and does not necessarily hold true for chemisorbed systems. In this case, indeed, the bond formation might lead to a substantial rearrangement of the surface charge and thus complicate the situation.
The depolarization field LiNbO3 z-cut is generated by an electronic charge accumulation the positive side and a corresponding electronic charge depletion at the negative side (Weis and Gaylord 1985). As a consequence, molecules acting as electronic charge acceptors are expected to stabilize the positive z-cut by charge compensation, while adsorbates acting as electron donors are expected to stabilize the negative surface in the same way. The outlined trend is clearly mirrored in DFT calculations. In fact, all the investigated adsorbates increase the substrate work function at the positive z-cut, with the exception of CO, which is evidently chemisorbed. Accordingly, all the investigated physisorbed adsorbates lower the substrate work function at the negative z-cut. This indicates that charge compensation via molecular adsorption is a major surface stabilization mechanism at the polar LiNbO3(0 0 0 1).
Adsorption phase diagrams can be extracted from the DFT models to reveal the desorption temperature of the different adsorbates as a function of the environmental conditions. With the help of equation (8) the surface excess free energy of clean and adsorbed surfaces can be calculated as a function of the chemical potential of the specific molecules. The crossing point of the calculated formation energies of clean and adsorbed surface thus marks the desorption conditions, which are given by the corresponding values of the chemical potentials of the addressed molecules. In a second step, the chemical potential can be easily converted in temperature and molecular partial pressure (Hölscher et al 2014) using equation (9).
In order to allow for a direct comparison of the phase diagrams of the investigated molecules, the molecular partial pressure resulting from equation (9) has to be transformed in total pressure. This is typically achieved within the ideal gas approximation, for which the partial pressure of a single gas in a compound is proportional to the volume percentage of that gas in that compound. While the volume percentage of most of the considered adsorbates in air can be safely assumed to be constant, this is unfortunately not the case for H2O. Indeed, the volume percentage of water vapor varies substantially between a dry and wet environment. The diagrams shown in this review for H2O molecules are obtained employing the H2O volume percentage in air by 50% humidity and room temperature.
The diagrams displayed in figure 31 indicate the experimental conditions at which a given molecule will desorb (or adsorb) from (or at) the lithium niobate z-cut. All the couples of pressure and temperature values corresponding to points below the curve indicate the thermodynamic conditions at which clean surfaces are favored, while for a combination of pressure and temperature above the curve, the molecule will be adsorbed at the surface. The calculated phase diagrams indicate that at ambient conditions, O2, CO, and H2O are adsorbed at the positive z-cut, and their desorption temperatures are approximately 1075, 450, and 325 K. A glance at table 4 reveals that these molecules have the highest adsorption energies, and rather high temperatures are needed to drive them off from the substrate. Decreasing the temperature CO2 can also adsorb at the positive z-cut. The remaining molecules desorb/adsorb at temperatures well below 100 K, hence they play no role on the LiNbO3 z-cut at ambient conditions.

Figure 31. Phase diagrams for the adsorption of selected molecules at the positive and negative lithium niobate z-cut are shown in the upper and lower part of the picture, respectively (Hölscher et al 2014). The solid gray lines mark the laboratory conditions, i.e. room temperature and standard atmospheric pressure. The numbers reported near the solid black lines show the adsorption/desorption temperature at atmospheric pressure.
Download figure:
Standard image High-resolution imageAt the negative z-cut different molecules can adsorb under ambient conditions. O2 is strongly bound with the substrate and hence present under nearly all circumstances. The calculated desorption temperature of 1450 K indicates that O2 will desorb roughly at the Curie temperature. CO2, H2O, and N2 are expected to desorb at temperatures of 500, 450, and 400 K, respectively. CO desorbs at about 260 K, CH4 at approximately 120 K, and H2 at 70 K. As in the case of the positive surface, the order of the desorption temperature of the different adsorbates at the negative surface corresponds to the order of their adsorption energy magnitude.
Among the investigated molecules, N2O does not appear in the negative z-cut diagram, as it spontaneously dissociates upon adsorption. The most striking result implied by the surface diagrams is that the investigated molecules adsorb at different temperatures on surface of opposite polarization. This is in good agreement with available TPD measurements (Garra et al 2009) and with the x-ray diffraction measurements by Ehre et al (2010), who firstly noticed that H2O freezes at different temperatures at oppositely polarized LiTaO3(0 0 0 1) surfaces. One further outcome of the surface diagrams is that higher temperatures are necessary to drive off the adsorbed molecules from the positive LiNbO3 z-cut than from the negative z-cut, corresponding to a generally higher binding energy (Hölscher et al 2012). The only exception is represented by CO, which is strongly bound to the topmost O atoms of the negative termination that are missing at the positive termination.
Further aspects of the interactions between surfaces and molecules, such as adsorption at higher coverage, dissociation and reaction paths at the surface, have not been modeled yet. They are related to the catalytic properties of lithium niobate surfaces and will be a hot topic for future investigations.
7.2. Temperature programmed desorption
While the interaction of small molecules with polar lithium niobate surfaces is interesting to understand the surface physics and chemistry at ambient conditions, the interaction of the ferroelectric surfaces with larger molecules such as alcohols and polymers is interesting for different applications. These exploit the possibility to switch the dipole orientation, and bear a huge potential for domain-specific surface chemistry as a pathway toward the fabrication of devices at the nanoscale (Hanson et al 2006, Li et al 2008). In this context, promising successes have already been achieved: electro-optic polymers were found to be effectively poled by high surface electric fields due to pyroelectricity (Huang et al 2012). The very same fields have been moreover exploited to drive to the reversible fragmentation and the self-assembling of nematic liquid crystals (Merola et al 2012).
Liquid crystals are highly interesting adsorbates in this context as their optical properties are easily manipulated by electrical or magnetic fields. For many years, liquid crystals have been employed for various applications in optics and optoelectronics (Jägemalm et al 1998) such as displays (Kim et al 2000), adaptive lenses (Ren and Wu 2006), or sub-terahertz switches (Ghattan et al 2008). The detailed understanding of their interaction with strongly polar and switchable substrates is thus of obvious interest. First experimental results indicate a strong polarization dependence for the liquid crystals adsorption on the lithium niobate z-cut (Merola et al 2012), but do not give any detailed information on the structure of the molecular film at the lithium niobate-liquid crystal interface.
To shed some light into the interaction of extended adsorbates with polar LiNbO3 surfaces and explore the interface microscopically, several researchers have modelled the adsorption of different molecules. Methanol (CH3OH) and 4'-n-octyl-4-cyanobiphenyl (8CB) have been chosen as prototypical alcohols (Riefer et al 2012) and polymers (Braun et al 2015), due to the relatively large dipole moments of 1.7 and about 5 D, respectively (Gueu et al 1986), their comparatively simple and compact structure and, most of all, to the availability of experimental data. The DFT simulations were performed within the supercell approach including dipole corrections (Bengtsson 1999) and semi-empiric van der Waals corrections (Grimme 2006).
Concerning methanol, different but rather similar adsorption configurations have found on the positive z-cut. The binding energy of methanol with the substrate for these configurations amounts to about 0.5 eV. The leading contribution to this energy is due to the chemical interaction between O and Li atoms from the substrate with the molecular H and O atoms, respectively. In contrast, the electrostatic interactions between the methanol dipole moment and the LiNbO3 polarization charge has been found not to substantially contribute to the interface energetics. In contrast to the small molecules introduced in the previous paragraph, different chemical bonds between adsorbate and surface are formed. The adsorption configuration predicted by DFT is depicted in figure 32. In this configuration a weak hydrogen bond is formed between the methanol hydroxyl group and the O atoms of the substrate, as well as a covalent bond between the molecular oxygen and the surface Li atoms. The stable adsorption configurations do not introduce a significant strain in either the molecule or the substrate.

Figure 32. Atomic structure of molecular methanol (a) and calculated charge-density difference (in e  ) of the methanol bonding configuration on the positive (b) and negative (c) LiNbO3 surface (Riefer et al 2012).
Download figure:
Standard image High-resolution imageNon-dissociative adsorption is found to be clearly energetically favorable at the  -cut, instead. Here, different bonding geometries are possible, all of them with binding energies larger than 1 eV. The distinct bonding configurations strongly resemble the molecular adsorption at the
  -cut, though. In all favorable geometries the hydroxyl-group forms a hydrogen bond with a O atom of the surface, while the O atom of the methanol molecule forms a covalent bond with a Li atom of the surface (see figure 32(c)). Exactly as in the case of the adsorption at the positive z surface, the electrostatic contribution to the binding energy is rather limited, and the adsorbate-induced surface distortion is almost negligible. Though, in a particular adsorption configuration, the surface is partially modified by the extraction of a Li atom. Despite many similarities in the molecular adsorption of methanol at the positive and at the negative LiNbO3 z-cut the adsorption energy at the negative face is higher, due to the formation of stronger bonds (Riefer et al 2012).
The dissociative adsorption of methanol molecules has been modeled as well. As a general trend, it was found that methanol is divided into a hydroxyl group and a methyl group, which adsorb at distinct sites of the lithium niobate z-cut (Riefer et al 2012). Yet, a pronounced polarization-dependence of the dissociation emerged from the simulations. At the negative z-cut, the separation of methanol into CH3 and OH always leads to the energetically stable configuration. In this case, the hydroxyl group is predicted to adsorb between the cations of the surface (Nb and Li), while the methyl group attaches to the topmost oxygen layer of the surface. The predicted configurations are in agreement with calculations by Hölscher et al, who modeled the adsorption of isolated OH (Hölscher et al 2012).
However, at the positive z-cut different dissociation may occur. In particular, the separation of methanol either into hydroxymethyl (−CH OH) and hydrogen or into methylene (CH2) and water (H2O) is energetically favored by about 2 eV. In the first configuration, C and O atoms of the hydroxymethyl group form bonds with O and Li atoms of the substrate, respectively, while the H atom is bound to a O atom of the surface. In the second configuration, the methylene group attaches inbetween two O atoms of the surface, while H2O adsorbs close to the topmost Li atom of the surface. All dissociation processes lead to a noticeable rearrangement of the surface, as revealed by the large relaxation energies of ca. 1.3–2.0 eV calculated within DFT. Further details can be found in Riefer et al (2012).
The stability of different configurations with separated methanol parts is not sufficient to assert that the dissociative adsorption will be observed, as an energy barrier must be overcome to dissociate the methanol molecule. To evaluate of the probability for dissociative adsorption, a rough estimate for the activation energies was given in Riefer et al (2012).
In particular, constrained dynamics simulations were performed, which start from the different dissociative adsorption configurations. Various intermediate states were generated by simple interpolation between the initial and final atomic structures. Activation energies of 4.5 and 6.4 eV are calculated for the dissociation in CH2OH + H and H2O + CH2 at the positive z-cut, respectively. The activation energy for dissociation in CH3 + OH amounts to 2.4 eV. Thus, the activation energies calculated for the positive z-cut are substantially larger than those calculated for the negative z-cut. The interpretation of these results requires some attention, though. On the one hand, it is not possible to model by DFT the huge number of different supposable configurations, hence adsorption geometries that are even more favorable than the ones described in this review cannot be completely excluded. On the other hand, the approximate energy barriers estimated in Riefer et al (2012) must be considered upper limits for the real activation energies, as e.g. proton quantum effects are expected to flatten the energy barriers to some extent Morrone and Car (2008). Yet, in view of the large energy barriers predicted by DFT, their influence is not expected to be of crucial relevance.
The illustrated results suggest that the dissociative methanol adsorption is an activated process, in which a considerable energy barrier must be overcome. This is compatible with the TPD experiments by Garra et al (2009), which observed the temperature driven molecular desorption of methanol from the lithium niobate surface. In agreement with the atomistic calculations, they pointed out that the adsorption/desorption temperature of methanol is a function of both the polarization orientation and of the molecular coverage. The binding energies measured by TPD in the zero-coverage limit are 0.58/0.61 eV and 0.88/0.93 eV for the positive/negative z-cut (using a different convention for positive and negative face, though). Hence, the calculated and measured binding energies are in qualitative agreement. In further agreement with atomistic calculations, TPD experiments pointed out a sizeable increment of binding energy switching from the positive to the negative z-cut. However, while an increment of about 30–50 meV has been measured experimentally, the calculations predict a larger enhancement of about 0.5 eV. This discrepancy can be explained assuming that the surface termination of the real substrate differs from the one modeled by DFT, in particular due to the presence of additional adsorbates.
Liquid crystals are typically composed of larger molecules than methanol or air components. Concerning the prototypical liquid crystal that has been exemplarily studied by DFT, i.e. 8CB, the investigation is complicated by the structural degrees of freedom of the polymer, consisting in different twist angles between the two phenyl groups and the cyano group, indicated by  ,
,  , and
, and  in figure 33. The adsorption on (polar) surfaces can thus occur with the molecule in different structural configurations and with different angles between the molecular axis and the surfaces. Taking in account all these variables, DFT calculations predict different bonding types for the adsorption at the positive and at the negative lithium niobate z-cut. In both cases 8CB lies rather flat on the surface, however, polarization-specific contributions to the substrate-molecule bonding are predicted.

Figure 33. 8CB molecule with H, C, and N atoms indicated by white, black, and blue balls, respectively. The angular degrees of freedom  ,
,  , and
, and  mentioned in the text are shown.
Download figure:
Standard image High-resolution imageOn the negative surface, a covalent bond forms between the molecular cyano as well as, to a much weaker extent, the phenyl group and the substrate. Thereby molecular deformations is evident. The molecular charge redistribution upon attachment to the positive z-cut is smaller than that for the negative face, however involving again mainly the molecular cyano group. In both cases, the molecule-surface interaction is dominated by dispersion forces that account for more than two-thirds of the total interaction energy. The van der Waals interaction masks the polarization-specific bonding characteristics and leads finally to rather similar adsorption energies of 2.9 and 2.8 eV for flat molecules on the positive and negative z-cut, respectively.
The picture becomes very interesting at higher molecular coverage. The first step in order to understand the magnitude of the calculated adsorption energies, is to compare them with the bulk cohesive energy of 8CB. Accordingly, calculations for 8CB in its crystalline bulk form, using a monoclinic four-molecule unit cell (Kuribayashi and Hori 1998) were performed, and a cohesive energy of 1.45 eV per 8CB molecule was obtained. Comparing this with the molecular adsorption energies of nearly 3 eV for flat-lying molecules on the LiNbO3 z-cut, one sees that the LiNbO3–8CB interaction is stronger than the 8CB-8CB interaction. Thus, in the low-coverage case, both on the positive and on the negative surface, a molecular thin film of flat molecules corresponds to the ground state. Also, for increasing coverage, molecules oriented parallel to the surface still correspond to the lowest-energy configuration on the positive z-cut because the surface energy gained from parallel packing (about 3 eV) is nearly twice as large as that due to molecular condensation (about 1.45 eV). The surface should thus act as a condensation nucleus that favors molecular ordering parallel to the crystal z-cut. The situation is different for the negative z-cut, though. Here, a comparatively large binding energy of more than 1 eV is released when 8CB bonds upright. Together with the higher packing density that can be realized for the upright adsorption configuration, the total interface energy gain for perpendicular stacking is larger than that for parallel attachment. In case of the negative z-cut, an increase of coverage is therefore expected to be accompanied by a molecular reordering, at least if the interface reaches the thermodynamic ground state. This expectation is corroborated by additional calculations for the adsorption of one complete bilayer 8CB in a bonding configuration parallel to the surface. The calculated average molecular adsorption energies are of about 1.5 and 1.2 eV on the positive and negative z-cut, respectively. In the case of the positive surface, the adsorption energy is thus considerably larger than that for single upright-standing molecules, and molecular ordering parallel to the surface is favorable. At the negative surface, instead, similar adsorption energies are obtained for a closed bilayer of flat-lying 8CB and single upright-bonded molecules. Due to the higher packing density that can be achieved for the latter configuration, a molecular reordering may thus occur (see figure (34)).

Figure 34. Dispersion forces dominate the molecular adsorption of 8CB at the positive LiNbO3 z-cut, and lead to the favoring of a flat-bonding configuration for single, isolated molecules (a). In the case of the negative z-cut, however, the interface energy can be lowered for increasing coverage by a molecular reordering toward an upright-bonding configuration (b).
Download figure:
Standard image High-resolution imageThere are experimental data available for the interaction of liquid crystal 4-(trans-4'-hexylcyclohexyl)-isothiocyanatobenzene (6CHBT) with differently poled LiNbO3 z-cuts (Merola et al 2012, 2013). In these (mesoscopic) studies, phenomena were observed that are compatible with the pronounced polarization as well as configuration-dependent adsorption energies predicted by DFT calculations. Fragmentation and coalescence of liquid crystal drops and migration to different sample regions in response to the surface electric field were reported. However, these findings cannot directly be compared with available calculations because (i) isothiocyanate bonded to the phenyl ring serves as the terminal group for 6CHBT rather than a cyano group, and (ii) the substrates in Merola et al (2012) and Merola et al (2013) were functionalized with polydimethylsiloxane polymer rather than being atomically clean, as assumed in the DFT studies. Still, the available calculations are useful in the context of the experiments discussed above. While the authors of Merola et al (2012) and Merola et al (2013) interpret their findings exclusively in terms of the surface electric fields due to the pyroelectric effect, the theoretical studies show that the chemical bond formation between the adsorbates and ferroelectrics depends strongly on the surface polarization and certainly needs to be taken into account for a complete understanding of the liquid crystal-ferroelectric interface.
7.3. Surfaces under water
In section 7.1 lithium niobate surfaces under ambient conditions have been discussed. Liquid solutions are another environment of great relevance for the LiNbO3 surfaces. Indeed, highly resolved atomic force images of the lithium niobate z-cut could only be obtained in a liquid environment up to now (Rode et al 2012). A further motivation to study the water-LiNbO3 interface is provided by the fact that thin water films will occur at the lithium niobate z-cut and hence affect the performance of any LiNbO3-based device, unless it is operated in ultrahigh vacuum (UHV). This assumption is corroborated by the mentioned water temperature programed desorption measurements at the LiNbO3 z-cut, showing that the H2O–LiNbO3 interaction is a function of both the polarization orientation and of the temperature (Garra et al 2009, Cordero-Edwards et al 2016). In addition, H2O is of overriding importance among all other molecules, at the one hand due to its crucial role in a multitude of applications such as biological sensors, fuel cells and hydrogen production, and at the other hand due to its relevance in natural processes such as corrosion, electrochemistry, and catalysis. It must be thus expected that the functionality of devices operated in peculiar environments might crucially depend on the relative humidity (Maeda et al 1992). Therefore it is essential to understand the H2O–LiNbO3 interaction at the microscopic level.
The H2O adsorption at the positive and negative LiNbO3 z-cut as a function of the water coverage has been modeled from first principles in the framework of the density functional theory (Sanna et al 2012). These studies have revealed adsorption energies, sites, and configurations. The bonds between water molecule and surfaces have been analyzed and discussed. Surface thermodynamics has been used to model the ground state of water-covered z-cut surfaces as a function of temperature and pressure, as we will summarize in the following.
The adsorption position and configuration of the water molecules at both (0 0 0 1) sides is determined starting from favorable adsorption sites previously found via PES calculation. Among the relaxed structures at the positive z-cut, the most stable configuration is given when the H2O molecule adsorbs quite tilted forming a bond with one Li atom of the surface at a distance  and a second bond with one O atom of the surface at a distance d(O–H) = 1.76 Å. In this configuration, which is represented in figure 35(a), the Li−O and O−H−O directions lie both in the (1
  0 0) crystallographic plane. The impact of the water adsorption on the positive z-cut is only minor: the substrate geometry is not noticeabily modified upon H2O adsorption. In order to investigate the chemical bond between water and substrate, the analysis of the charge density distribution is necessary. It is shown in figure 35(a). A polarization cloud can be observed between a water hydrogen and the closest surface oxygen. Moreover, electronic charge accumulation can be observed between the molecular oxygen and surface Litium. This suggests that two chemically different bonds are formed between H2O molecules and the positive z-cut. Bond lengths and geometry as well as the peculiar charge distribution are compatible with the formation of a ionic bond between the O atom of the H2O molecule and the Li atom of the surface, and of a hydrogen bond between the H atom of the H2O molecule and the O atom of the surface.

Figure 35. Charge redistribution upon H2O adsorption at the positive (a) and negative (b) LiNbO3(0 0 0 1) z-cut (Sanna et al 2012). The charge isolines are plotted as solid lines in the y plane. This plane contains two distinct bonds formed by the H2O molecule with the surface. Charge accumulation is represented in red, charge depletion in blue.
Download figure:
Standard image High-resolution imageAkin to the adsorption of the previously investigated adsorbates, the H2O bonding scenario at the negative z-cut shows some difference with respect to its counterpart at the positive z-cut. The H2O molecule sits at the negative z-cut closer to the surface, in correspondence of a Li atom of the surface and at a distance d(O–Li) = 1.83 Å. More in detail, the water molecule is tilted in such a way that one H atom is directed towards an O atom from the surface and the other H atom points out from the surface. The described configuration is displayed in in figure 35(b), where the electronic charge redistribution is also shown. The latter, together with the molecule geometry and the bond lengths suggest again the formation of two distinct bond types, namely Li − O bond of ionic nature and a O − H hydrogen bond. Dissimilar to the situation at the positive z-cut, the H2O adsorption causes a rearrangement of the substrate structure. In particular, one Li atom is pulled out from the surface upon water adsorption. This is not only very similar to the surface response to the adsorption of other molecules (see sections 7.1 and 7.2), but closely resembles the behavior of the non-polar Al2O3(0 0 0 1) surfaces upon H2O adsorption (Thissen et al 2009). In further dissimilarity with the positive z-cut, in which the described adsorption configuration is by far the most stable, a second adsorption configuration of very similar energy can occur at the negative LiNbO3 z-cut. Within this configuration, the O atom of the H2O sits again close to a Li atom from the surface, at a distance d(O–Li) = 1.89 Å. Though, in this configuration the water molecule is so tilted, that both H atoms roughly point to a O atom from the surface, separated by the distinct distances d(O1–H) = 1.88 Å and d(O2–H) = 2.16 Å. Hence, all atoms of the water molecule are forming a bond with the substrate, a ionic Li − O bond similar to the previously described configuration and two distinct O − H hydrogen bonds of different length and strength. A common feature of all the stable adsorption configurations, both at the positive and at the negative z-cut is that the z component of the molecular electric dipole has the opposite direction of the ferroelectric polarization of the substrate. This reduces the total polarization of the water adsorbed surfaces.
The adsorption energy calculated as a function of the molecule-surface distance is shown exemplarily for the positive z-cut in figure 36. It shows that H2O can reach the equilibrium distance to the LiNbO3(0 0 0 1) surface without overcoming any energy barrier. The adsorption energy at the equilibrium position is calculated within DFT-GGA to be 0.61 and 1.28 eV for the  -cut and at the
  -cut, respectively. A larger adsorption energy at the negative z-cut is compatible with the TPD experiments by Garra et al (2009). Yet, the difference in the adsorption energy of water at oppositely polarized surfaces extrapolated from the TPD measurements amounts to 2.8–4.0 kJ/mol, corresponding to the interval 0.029–0.041 eV. This is an order of magnitude smaller than the theoretical estimate, which amounts to 0.67 eV. Such deviation is similar to the discrepancy encountered for the methanol adsorption (Riefer et al 2012), and can be traced to the rather large uncertainty in the values of both theory and experiment. On the one hand, the measured value was extrapolated from the TPD spectra modelling the measured data with the Polany-Wigner relations. These include preexponential factors with no commonly accepted magnitude, and for which values spread over many orders of magnitude are available in the literature (Garra et al 2009). On the other hand, calculated adsorption energies depend to a certain extent on the computational details, such as the employed formulation of the XC-functional or the application of dipole correction schemes (Neugebauer and Scheffler 1992, Bengtsson 1999). On the view of the larger error bars affecting both TPD data and DFT models, a qualitative agreement of theory and experiment has to be considered satisfactory.

Figure 36. Adsorption energy (in eV) of a single H2O molecule at the positive LiNbO3 z-cut as a function of the molecule-surface distance. The origin of the x axis is the equilibrium distance from the surface (Sanna et al 2012). The adsorption energy at the negative z-cut shows the same trend.
Download figure:
Standard image High-resolution imageFrom a microscopic point of view, the sizable adsorption energy difference at the two z-cut faces is due to the different adsorption configurations. These have their origin the different geometry an stoichiometry of the two sides. From a macroscopic point of view, it has been observed that the  -cut work function outreaches the
  -cut work function by ca. 2 eV (Yang et al 2004, Sanna and Schmidt 2010c). This cricumstance may influence the charge transfer from the molecule to the substrate and vice versa, hindering to same extent the formation of a strong bond at the positive (0 0 0 1) surface, and resulting in an higher adsorption energy at the negative side than at the positive side. Garra and co-workers explain the measured adsorption energy difference at the two z-cut faces by electrostatics (Garra et al 2009). They trace the adsorption/desorption temperature shift measured at oppositely polarized faces by a spread of few kJ/mol in the zero-coverage desorption energy. This difference is traced, in turn, to the electrostatic interaction of the H atoms of H2O molecule with the excess screening charge carriers generated by the pyroelectric effect.
It is known from several substrates that adsorbed H2O molecules can form a variety of regular, low-dimensional structures (Meng et al 2004). According to the water availability, small water clusters or monomers (0D), straight or wriggled chains (1D), as well as differently patterned overlayers have been observed. At even higher water coverage, networks of hydrogen-bonded H2O molecules, H2O multilayers, and bulk ice-like structures are formed.
These structures have been simulated at the LiNbO3 z-cut within DFT by increasing systematically the number of H2O molecules per surface unit cell. In the case of periodic structures, only substrate-commensurate geometries have been investigated, and no long-range water reconstructions (i.e. larger than a 2 × 2 repetition of the unit cell) have been modeled, though. A surprisingly large quantity of distinct phases has been found to be (meta)stable within DFT. A selection of the most relevant geometries is shown in figure 37. The dotted lines between the H2O molecules do not represent a chemical bond and must be considered as arbitrarily drawn guides for the eyes. The adsorption of two H2O molecules per unit cell at the positive z-cut lead to the formation of water structure known from other substrate. As an example highly regular honeycomb patterns can occur, similarly to the hexagonal geometries formed on different metal oxides or metal surfaces (Michaelides and Morgenstern 2007, Thissen et al 2009). In a further configuration, regular chains of molecular water are formed, reminiscent of the water chains occurring on rutile or ZnO (Dulub et al 2005). A common feature of these configurations is that the molecular hydrogen atoms point alternatingly to a O atom of the surface and to a O atom of the neighboring water molecule, guaranteeing a intramolecular bond as well as a bond with the substrate. With three H2O molecules per surface unit cell, slightly distorted hexagonal structures as well as water chains accompanied by an isolated water monomer might be formed. Four or more molecules per surface unit cell represent more than a H2O monolayer and are arranged in different three-dimensional ice-like configurations. The most stable of these structures is reminiscent of regular water ice, commonly addressed to as ice-Ih.

Figure 37. Selected H2O structures formed at the positive LiNbO3(0 0 0 1) surface. The rhombohedral surface unit cell is shown. The dotted lines between the H2O molecules do not represent a chemical bond and must be considered as arbitrarily drawn guides for the eyes (Sanna et al 2012).
Download figure:
Standard image High-resolution imageThe negative (0 0 0 1) surface is morphologically different from its positive counterpart. In particular, the much stronger surface corrugation hinders the adsorption of planar H2O films in the regular patterns observed at the positive surface. Indeed, no more than two H2O molecules per surface unit cell can be adsorbed in planar form. More than two H2O molecules per surface unit cells are arranged in ice clusters or ice layers separated from the substrate (negative adsorption energy). With two or less H2O molecules per surface unit cell, water films with more or less regular hexagonal patterns as well as different kinds of distorted hexamers can be observed.
It is water availability which eventually determines the H2O configuration occurring at the LiNbO3 substrate. In order to compare the relative stability of the different surface water structures, phase diagrams depending on temperature and partial pressure have been modeled with the formalism presented in section 3.6. The calculated phase diagrams of H2O at the LiNbO3(0 0 0 1) surfaces as a function of the H2O partial pressure and temperature are shown in figure 38.

Figure 38. Phase diagrams for the of the positive (upper part) and negative (lower part) LiNbO3 z-cut calculated by DFT as a function of temperature and water partial pressure (Sanna et al 2012). The dotted lines mark the ambient conditions. The solid lines mark the conditions at which a particular water phase is formed, indicated by the value of the chemical potential variations  (given with respect to ice-Ih).
Download figure:
Standard image High-resolution imageFor an absolutely dry environment (low water partial pressure), the clean LiNbO3 z-cut obviously represents the stable configuration. With increasing water availability (i.e. for more humid environment) a multitude of adsorption geometries for the H2O molecules may occur. It is a peculiar feature of the positive z-cut that the planar structure consisting of a regular honeycomb film is favored with respect to the adsorption of isolated H2O molecules. This suggests that both the intramolecular hydrogen bond as well as the water-surface interaction play a similarly relevant role by the formation of the H2O phases occurring at the LiNbO3 surfaces. The same intermediate experimental conditions that lead to the formation of the hexagonal films at the positive side, lead to the adsorption of isolated H2O monomers at the negative surface, instead. This difference can be traced back to the rugged atomic structure of the negative termination, which prevents the adsorption of water films in regular patterns. Eventually, at very water-rich conditions, regular three-dimensional water phases (i.e. bulk ice) are formed both at the positive and at the negative z-cut. Independently from the polarization direction, the regular ice Ih phase is formed upon adsorption of more than four water molecules per LiNbO3(0 0 0 1) surface unit cell. Irrespective of the polarization direction, the ferroelectric-ice interface is characterized by a first water layer with a relatively regular honeycomb pattern.
As discussed in section 1, polar surfaces tend to adsorb foreign species to reduce the surface energy, and the adsorption of radicals and polar molecules is major external charge-compensation mechanism (Noguera 2000, Goniakowski et al 2008). The film with hexagonal structure formed at the LiNbO3(0 0 0 1) surface at ambient conditions, when the relative humidity is of about 50% confirms this trend. Clean z-cut surfaces free from H2O adsorbates are recovered with a temperature treatment above 100 °C. On the contrary, if the water partial pressure is increased beyond room pressure, water bilayers and three-dimensional structures grow on the positive z-cut.
Concerning the negative z-cut, H2O monomers or ice seeds are present at ambient conditions, which grow to water ice at lower temperatures. The DFT calculations reveal a very peculiar characteristic of the LiNbO3/H2O interface: the phase diagrams show that water freezes at different temperatures on oppositely polarized surfaces. This interesting phenomenon has been experimentally observed, indeed, at the z-cut of the isomorph ferroelectric LiTaO3 (Ehre et al 2010).
Garra et al have described the adsorption of water at the lithium niobate surfaces by a model in which a bonding interaction between molecule's O atom and a surface cation (Li,Nb), as well as the electrostatic interaction between the molecule's H atoms and O atoms of the surface can be discriminated (Garra et al 2009). Available atomistic calculations clearly confirm and validate this scenario. In further agreement with the TPD experiments, the adsorption energy per water molecule is predicted by DFT to be a decreasing function of the water coverage. The different water phases at the LiNbO3 z-cut have similar formation energies, with differences smaller than 15%. This suggests that the water-substrate interaction is dominant over the intramolecular interaction.
According to the atomistic calculations, the water adsorption occurs mainly non-dissociatively, exactly as observed by Garra et al (2009). In order to compare the dissociative and molecular adsorption of water on lithium niobate, 30 different configurations of dissociated water at the z-cut have been modeled. In particular, H2O fragments have been placed at the favorable adsorption sites for O and OH radicals described in Hölscher et al (2012). The molecular adsorption was found to be energetically favored over the dissociated adsorption by some ten meV, irrespective of the surface polarity. This energy difference is close to the method accuracy, hence dissociative adsorption cannot be completely excluded. As a general rule, presence of different adsorbates in the atmosphere and at the z-cut can affect the thermodynamic stability of the polar surfaces and favor dissociative adsorption. Moreover, different systems are known, such as MgO(1 0 0) and other metal oxide surfaces, in which dissociative adsorption occurs close to a surface defect or in the vicinity of a step (Stirniman et al 1996, Meng et al 2004). A similar behavior might be expected for the LiNbO3 z-cut.
The stabilizing influence of the water adsorption at both z-surfaces via charge transfer and consequent reduction of the surface charge has been discussed in section 7.1. Though this is not the only impact of water adsorption on lithium niobate surfaces. The impact on the surface morphology has been estimated by the adsorption-induced modification of the surface roughness, calculated using the common Ra (arithmetic average of the absolute values) and Rq (root mean squared) as roughness magnitude parameters:


Clean lithium niobate z-cut surfaces are characterized by a microscopic roughness as estimated by these parameters as large as  Å,
Å,  Å at the
  -cut and
  Å,
Å,  Å at the
  -cut, respectively. As a consequence of this mismatch in the surface corrugation, the electronic charge density modulation at the two sides is also very different, as displayed in figure 39. Independently from the surface polarity, H2O adsorption enhances the surface relaxation, to an extent which grows with the number of molecules adsorbed per surface unit. As an example, the surface roughness grows to
  Å,
Å,  Å at the
  -cut and to
  Å,
Å,  Å at the
  -cut if a single water monolayer (H2O thin film) is adsorbed. The water induced surface relaxation is hence more pronounced at the negative LiNbO3(0 0 0 1) surface. In this case, it also modifies the order of the atomic layers in the surface terminations. Clean
  -cut LiNbO3 surfaces in UHV present an outermost O layer and an underlying Li layer. By the adsorption of a thin H2O film, the Li atomic layer is drawn outwards by about 1 Å, overcoming the O layer by 0.06 Å at the H2O–LiNbO3 interface. The fact that the negative z-cut is much prone than the positive z-cut to surface relaxation, structural modifications, Li extraction and eventually surface etching is a consequence of softer atomic bonds at the negative termination. Recent Raman studies have indeed documented that phonon modes at the negative surface are generally softer than their counterpart at the positive surface (Sanna et al 2011b).

Figure 39. Isosurfaces of the electronic charge density (0.01 e  ) calculated (a) for the clean, dry LiNbO3(0 0 0 1) surfaces, (b) for the LiNbO3(0 0 0 1) surfaces in the presence of water, and (c) including water molecules (Sanna et al 2012).
Download figure:
Standard image High-resolution imageThe effect of the water adsorption on the lithium niobate surfaces is also useful to understand the different resolution achieved with AFM experiments in water solution at these surfaces (Rode et al 2012). The charge-density isovalues of the two clean and water adsorbed surfaces shown in figure 39 demonstrate that the presence of water accentuates the surface relaxation (and corrugations) at the negative face more than at the positive face. This is very likely to result in a better AFM resolution at the negative z-cut.
The charge density isosurfaces in figure 39 shows that the electronic charge density related to the adsorbed water molecules is rather different from that of the lithium niobate surfaces. Moreover, the mismatch in the corrugation of the differently polarized surfaces is drastically smoothed out. The charge density at the positive and negative z-cut is almost indistinguishable, in contrast to available AFM images (Rode et al 2012). This is a strong evidence that the LiNbO3 surface and not the above adsorbed water layer is imaged in atomic resolved AFM experiments.
7.4. Growth of GaN at the LiNbO3(0 0 0 1)
Motivated by the technological interest mentioned in section 1.1, the growth of GaN on the LiNbO3(0 0 0 1) has been investigated by density functional theory. In particular, the deposition of a single GaN monolayer (Sanna and Schmidt 2010b) and then the step by step GaN growth on LiNbO3(0 0 0 1) (Sanna and Schmidt 2010a) have been simulated to model the LiNbO3/GaN (0 0 0 1) interface formation. A theoretical investigation of the GaN growth on the LiNbO3(0 0 0  ) or other surfaces is currently missing.
Several crude approximations have been applied in the mentioned theoretical studies. The first one concerns neglecting temperature effects on the crystal structure. Thermal expansion effects (GaN is usually grown on lithium niobate at temperatures above 850 K (Ougazzaden et al 2008)) were disregarded. The second approximation, concerns the lithium niobate surface. Ideal, atomically flat interfaces were assumed, where the LiNbO3 termination is the thermodynamically stable −Nb−O Li2. Further calculations assuming truncated bulk terminations have shown no qualitative difference. This approximation is motivated by the temperature stability of the LiNbO3 substrate, in particular stoichiometric lithium niobate, which makes compositional changes at the surface unlikely. Indeed, the phase transition to the paraelectric structure takes place at 1480 K. Still, future studies are required in order to address the issue more in detail. As well, further studies are needed to model the effect of a buffer layer such as AlN, which is occasionally employed in growth experiments to improve the quality of the grown material (Doolittle et al 2003, Tsuchiya et al 2005).
Figure 40 shows a top view of the LiNbO3 (0 0 0 1) plane. Both the oxygen and the cationic sublattice display hexagonal symmetry, a prerequisite for the quasi lattice-matched and coaxial growth of GaN. The oxygen sublattice in particular seems very well suited as a template for the GaN upgrowth, as the calculated average interatomic O–O distance of 3.04 Å is very close to the Ga–Ga or N–N interatomic distance in GaN, which amounts to be 3.25 Å within DFT-GGA. This represents a DFT calculated lattice mismatch of 6.9%, which is very close to the nominal mismatch of 6.8% reported in the literature. As a first step of the investigation of the GaN growth on lithium niobate, the potential energy surface (PES) for the adsorption of Ga and N adatoms on LiNbO3 z-cut has been performed. The calculation of the PES, which are shown in figure 40, allows for the determination of the stable adsorption sites of the GaN constituents. While the blue regions are favorable adsorption sites, red regions represent non-stable positions, for the atomic adsorption. The PES for the N adsorption (figure 40, upper part) shows three nearly equivalent adsorption locations around the oxygen atoms of the topmost layer. N atoms adsorb preferably above the O atoms of the substrate, while Ga atoms adsorb preferably above the substrate cations (Li, Nb as shown in figure 40, lower part). This behavior can be interpreted as the continuation of the substrate growth with foreign atoms, in which gallium occupies the cationic site and nitrogen occupies the anionic site of the lithium niobate crystal structure. The isolated N atoms adsorb 1.36 Å above the underlying oxygen of the substrate, and isolated Ga atoms adsorb 2.8 Å on top of the underlying Nb, which means 1. Å above the outmost Li-layer.

Figure 40. Potential energy surface for the adsorption of isolated N atoms (upper part) and Ga atoms (lower part) on the positive, relaxed LiNbO3 z-cut (Sanna and Schmidt 2010b). Color coding as in all previous illustrations, with Li in gray, Nb in white and O in red. The  unit cell of LiNbO3(0 0 0 1) surface is highlighted.
Download figure:
Standard image High-resolution imageThe adsorption energy, defined as the energy necessary to pick one adatom from the surface and bring it infinitely far apart from it, is rather different for N and Ga adsorbates. Indeed, nitrogen bounds more strongly to the substrate than gallium, the energy difference being about 1.5 eV. As a result a N monolayer (formed by three N atoms in the  surface unit cell) is more strongly bound than a Ga monolayer (three Ga atoms in the
  surface unit cell, as well) on the LiNbO3(0 0 0 1) surface. The considerable depth of the calculated PES minima also suggests that lithium niobate provides a robust template for the GaN growth.
Starting with a nitrogen monolayer and following the approach of Fujiwara et al (2006) the layer by layer GaN growth has been modeled. The simulations have shown that the c axis of the emerging GaN layer is parallel to the substrate z axis. Furthermore, the GaN layer grows with its [1 0  0] axis parallel to the LiNbO3 y axis i.e. [1 1
  0]. Thus, the two surface unit cells are rotated by 30°.
Summarizing, the lithium niobate z-cut is structurally similar to the sapphire c-plane and therefore well suited for the growth of wurtzite GaN. The main difference with the standard substrate, α-Al2O3 is, apart from the obviously different lattice constant, the arrangement of the oxygen atoms. In lithium niobate, they wind around the crystal [0 0 0 1] axis forming spiral staircase-like structures. This arrangement results in a larger dispersion of the oxygen atoms with respect to the position they would occupy in sapphire. More importantly, this arrangement causes a small rotation of the oxygen sublattice with respect to the cation sublattice. Hence the (0 0 0 1) planes (or c planes) of LiNbO3 and GaN are rotated by an angle that is slightly larger than exactly 30°. The [1 1  0]LiNbO_3
  [1 0
[1 0  0]GaN in-plane lattice relationship minimizes the lattice mismatch between GaN and LiNbO3 and is energetically favored. Moreover, the relationship modeled within DFT confirms the RHEED measurements by Tsuchiya et al (2006). The in-plane lattice mismatch between LiNbO3 and GaN as predicted by DFT (6.9%) is in good agreement of the nominal value of 6.8%. The threefold symmetry of the substrate suggests the formation of three energetically degenerate GaN domains at the LiNbO3(0 0 0 1) surface.
7.5. Temperature induced long ranging reconstructions
The surface stabilization mechanisms discussed in section 1.1 are usually divided in external mechanisms, e.g. the adsorption of charged adatoms and foreign adsorbates, and internal mechanisms, such as surface reconstructions and stoichiometry modifications. Both types of mechanisms have been identified in lithium niobate and separately discussed in this review. However, both stabilization mechanisms are temperature dependent, and the balance between them may change at different temperatures. It must be kept in mind that LiNbO3 is strongly ferro-, pyro-, and piezoelectric, hence even small modifications of pressure, temperature, and atmospheric composition will lead to a modification in the relative magnitude of the effect of internal and external stabilization mechanisms, eventually resulting in an under- or overcompensation of the polarization charge (Johann 2009). Due to these effects, the net surface charge at ferroelectric surfaces has been observed to change sign or oscillate around the neutral state as a consequence of environmental changes.
The situation is well illustrated by an AFM investigation recently performed on samples annealed at different temperatures (Sanna et al 2013). Micrometer-scale AFM images (figure 41) of the (0 0 0  ) and (0 0 0 1) surfaces taken in air illustrate the surface morphology for a series of different annealing temperatures. In images taken without thermal treatment (a) and (b), the surfaces looks grainy, rough and adsorbed with a large number of adatoms or foreign species. Moreover, no regular patterns as well as surface step edges are present.

Figure 41. Tapping mode AFM images of the (0 0 0  ) (left hand side) and (0 0 0 1) (right hand side) lithium niobate surface taken in air after cleaning in an ultrasound bath without further annealing ((a), (b)), after subsequent annealing at 870 K ((c), (d)) at 1070 K ((e), (f)) and at 1270 K ((g), (h)). Panels (i) and (j) show atomically resolved AFM images of the LiNbO3(0 0 0
  ) surface after high-temperature annealing and moderate annealing, respectively. Reprinted figure with permission from Sanna et al (2013), Copyright 2013 by the American Physical Society.
Download figure:
Standard image High-resolution imageAnnealing the samples completely modify the situation. No drastic change is observed till annealing temperatures of 870 K, as shown in panel (c) and (d). On the contrary, a striking morphology modification is observed after annealing to 1070 K. At this temperature, the LiNbO3 z-cut evolves to a highly structured surface with regular, atomically flat hexagonal terraces free from adsorbates ((e) and (f)). The straight lines observed in AFM images in this temperature regime have been identified as step edges, as high as an integer multiple of a monatomic step. This temperature regime was referred to as moderate annealing step. A further drastic change is observed increasing the annealing temperature beyond 1270 K (panels (g) and (h)). Atomically flat terraces are formed at this temperature, too. Yet, the hexagonal terraces are replaced by relatively straight step structures without a particular apparent orientation. High resolution AFM images of the same samples performed at the solid-water interface reveal an interesting development of the surface (panels (i) and (j)). For samples annealed at temperature below 870 K, a hexagonal surface pattern is detected in real space and confirmed by the fast Fourier transform analysis. It corresponds to a real-space unit cell with a lattice constant of 0.515 ± 0.020 nm, mirroring a ( ) surface periodicity. Though, the moderate annealing temperature at 1070 K leads to a different surface atomic arrangement. Again, a hexagonal phase is observed, however, the extrapolated lattice constant of 1.362 ± 0.02 nm is substantially. The increase of the surface unit cell corresponds to a (
 )R19.1° surface reconstruction. The orientation of the surface reconstruction is rotated with respect to the step edges by 19.1°. Correspondingly, the step edges in the reconstructed surface termination are aligned alongside the LiNbO3 x bulk lattice direction.
All these circumstances have been explained by recent DFT calculations, which (i) show that ( ) periodic and adsorbate-free lithium niobate z-cut surfaces are unstable against reconstruction, (ii) demonstrate that the surface reconstruction is due to the formation of favorable adatom structures, and (iii) reveal that the long ranging reconstructions stabilize the surface by effectively reducing the surface polarization charge. Thereby, in contrast to the first LiNbO3 surface models (Levchenko and Rappe 2008, Sanna and Schmidt 2010c, Sanna et al 2010), the possibility of surface reconstructions was taken into account, in newer calculations (Sanna et al 2013) and long ranging reconstructions such as (
 ) and (
 ) structures were modeled in order to assign a microscopic structure to the AFM findings.
The electrostatic model based on the formal oxidation states  ,
,  , and
, and  proposed by Levchenko and Rappe (2008) and discussed in section 6.2 can be used as a starting point for building surface morphologies of different periodicity. According to the model, the thermodynamically stable −Li−O/−Nb−O
 Li2 terminated z-cut surfaces are characterized by a remaining net surface charges of
  and
and  , respectively. In the framework of the DFT sudies, stoichiometry that—on the basis of the model of formal oxidation states—reduce the polarization surface charge to a larger extent have been modeled. Terminations increasing the surface charge have been modeled as well. However, they turned out not to be stable.
About 200 configurations modeling about 40 different stoichiometry were probed for the ( ) and the (
 ) reconstructions. The corresponding surface phase diagrams, plotted as usual as a function of the temperature and Li partial pressure, are shown in figure 42. The results displayed in figure 42 closely resemble earlier findings (Levchenko and Rappe 2008, Sanna and Schmidt 2010c) for Li-poor environments. Reconstructed surfaces are predicted for a wide range of the thermodynamically accessible conditions, though. Various stable (
 ) surface reconstructions are formed by addition of Li and O adatoms. While it cannot be excluded that further reconstruction that have not been modeled in Sanna et al (2013) are more favorable than the investigated configurations, the published results clearly show that (
 ) periodic lithium niobate surfaces are only stable for a very limited range of thermodynamic conditions.

Figure 42. Calculated phase diagram of the positive (upper part) and negative (lower part) LiNbO3(0 0 0 1) surface as a function of temperature and Li partial pressure (Sanna et al 2013). Morphology and stoichiometry of the terminations labeled by (a)–(f) are discussed in the text and summarized in table 5.
Download figure:
Standard image High-resolution imagePreparation conditions corresponding to moderate anneal-ing favor a ( )R30° and (
 )R19.1° recon-structions driven by the adsorption of single O and Li,O adatoms, respectively, for the negative z-cut. Corresponding conditions for the positive z-cut favor various Li adatom induced (
 ) structures. Among the stable long ranging reconstruction, the thermodynamically dominant (0 0 0
  )(
)( ) + LiO and (0 0 0 1)(
 ) + Li2 surfaces are displayed in figure 43(a) and (b), respectively. Assuming that the Li partial pressure is below 10
 Pa, ab initio thermodynamics together with the ideal gas approximation reveals that the
  reconstructions is stable between about 750 K and about 1150 K, in substantial agreement with the experiment.

Figure 43. (0 0 0 1)( ) + Li2 (a) and (0 0 0
  )(
)( ) + LiO (b) surfaces predicted by DFT for moderate annealing conditions (see text). The surface unit cell of the reconstructed surface as well as the primitive surface unit cells are indicated. Uppermost Li adatoms are highlighted in yellow (Sanna et al 2013).
Download figure:
Standard image High-resolution imageThe occurrence of determined surface reconstructions at certain temperatures might be understood as a stabilization mechanism. The surface polarization charge plays a central role not only in the physical and chemical properties, but also in the energetics of ferroelectric surfaces. The polarization charge is expected to be passivated to a large extent by modifications of the surface stoichiometry as well as by the presence of adsorbates (Noguera 2000, Martirez et al 2012). Indeed, the surface charge measured at the LiNbO3 z-cut scatters considerably between different experiments (Jungk et al 2006). This notwithstanding, all measured values lie far below the 0.7 C  corresponding to the spontaneous bulk polarization. In a recent piezoresponse force microscopy (PFM) experiment, a value of
  μC
μC  was measured for congruent, nominally undoped z-faced LiNbO3 crystals under ambient conditions, corresponding to only 0.2‰ of the spontaneous polarization (Johann 2009).
Under high vacuum conditions, or when the temperature is too high to allow the adsorption of foreign species, internal mechanisms are expected to reduce the surface polarization charge (Kunat et al 2002, Dulub et al 2003). To estimate the efficiency of the surface reconstructions in this context, one must focus on the sequence of the occurring surface reconstructions for increasing temperatures, as shown in table 5. The nominal additional charge brought by the adatom-induced reconstructions is a decreasing function of the temperature.
Table 5. LiNbO3 z-cut surface charge as calculated for surface terminations of different periodicity. The temperature range is calculated within the ideal gas approximation assuming a Li partial pressure of 10 Pa. All charges are expressed in e/(
 )-surface unit cell. Positive terminations in the upper part, negative terminations in the lower part.
| Period. | Term. | Stable range (K) | Nom. charge |  |
|---|---|---|---|---|
 |
+2Li (a) | 250–450 | 0.66 |  |
 |
+3Li (b) | 450–600 | 0.43 |  |
 |
+Li (c) | 600–620 | 0.33 |  |
 |
+2Li (d) | 620–820 | 0.29 |  |
 |
+Li (e) | 820–1050 | 0.14 |  |
( ) ) |
— (f) | 1050–1150 | 0.00 |  |
 |
+O (i) | 680–1150 | 0.66 |  |
 |
+Li + O (h) | 620–680 | 0.14 |  |
 |
+2Li + O (g) | 250–620 | 0.00 |  |
The effective surface charge  has not necessarily to be directly proportional to the nominal charge brought by the adsorbed species, though. Therefore,
  was explicitly calculated with the method introduced in section 3.3. It was found that the total surface charge is reduced by all modeled stable reconstructions. At the negative z-cut, the (
 ) + LiO and the (
 ) + O terminations are formed, which lower the net surface charge by 9% and 11% with respect to the unreconstructed surface, respectively. At the positive z-cut, the (
 ) + Li3, (
 ) + Li, (
 ) + Li3 and (
 ) + Li terminations are favored, which reduce the net surface charge by 17%, 15%, 12% and 3%, with respect to the unreconstructed surface, respectively.
At these temperatures the LiNbO3 crystal is much closer to the paraelectric phase than at room temperature due to the pyroelectric nature of the material. Pyroelectricity is not included in our model, therefore the calculated  is not the quantitatively correct value. Nonetheless, DFT calculations can be used to compare the relative surface charge of different terminations. The self consistently calculated surface charge reduction upon reconstruction formation was found to be roughly proportional to the nominal charge of the respective adatoms. Thus the calculations prove that LiNbO3 surface reconstructions reduce the net surface polarization charge. Though, the charge compensation by external mechanisms (e.g. the adsorption of charged adatoms and foreign adsorbates) is very efficient, does not require the formation of a bulk defect, and will occur as long as the temperature remains below the desorption temperature. As a quantitative example, the adsorption of Li
 or H at the positive (
 ) reconstructed z-cut reduces the calculated surface charge by around 41% or 31%, a larger value than achieved by adatom induced surface reconstructions.
Surface terminations with a decreasing impact on the surface polarization charge are formed with increasing temperature. This, however, does not lead to a growing surface polarization charge for growing temperatures. Indeed, due to the pyroelectric effect, which reduces the spontaneous ferroelectric polarization and drives the crystal towards the paraelectric phase at high temperatures, the net surface polarization charge for a given termination is a decreasing function of the temperature in real samples. Hence, also reconstructions with a minor impact on the surface charge will be able to passivate the reduced surface polarization charge at elevated temperatures, thus stabilizing the z-cut. At temperatures over 1200 K, the spontaneous polarization is strongly reduced, no surface reconstruction is required to stabilize the surface, and the  periodicity is recovered. The lowered surface charge of all the stable reconstructed surfaces suggests that the surface charge passivation is the leading driving force for the structural transformations as observed by AFM at different temperature regimes.
Summarizing, an explanation of the temperature-dependent stabilization mechanisms occurring at the LiNbO3 z-cut is provided by DFT models. In the low temperature regime, including ambient conditions, the surface polarization charge is largely passivated with foreign adsorbates, which are very efficient in reducing the polarization charge. This explains why no surface reconstruction is observed at ambient conditions or at low annealing temperatures. At higher temperatures, though, the adsorbed molecules and radicals begin to desorb (see also, e.g. Garra et al (2009)), leaving a non compensated polarization charge. At temperatures beyond 1000 K almost all the adsorbates are driven off the LiNbO3 z-cut, and internal stabilization mechanisms such as the formation of surface reconstructions are required in order to avoid polar instabilities due to uncompensated surface polarization charges. A prominent example in this respect is the ( )R19.1° surface reconstruction observed at the LiNbO3(0 0 0
  ) surface upon moderate annealing. After high-temperature annealing, the LiNbO3 z-cut eventually recovers the original (
 ) periodicity. The reason for this is due both to the reduced value of the ferroelectric polarization as the Curie temperature is approached, as well as for entropic effects. Both effects act lowering the driving force for the formation of surface reconstructions.
8. Other relevant surfaces
Our knowledge of lithium niobate surfaces besides the  ,
,  , and z-cut is very limited. Rakova has investigated many surface orientations, including the (
 0 1 2) (Rakova 1994) and (0
  1 4) (Givargizov et al 2012) cuts by reflection high-energy electron diffraction (RHEED) after annealing at high temperatures. Her studies pointed out the formation of surface defects and ordered structures due to the desorption of Li2O gases. Among the investigated LiNbO3 surfaces, the (0 1
  2) surface plays a prominent role. Indeed, lithium niobate cleaves naturally along the (0 1
 2) planes or the equivalent (
 0 1 2) and (1
  0 2) planes (Boyd et al 1964). This is easily understood on the basis of the crystal structure, as shown e.g. in figure 44.

Figure 44. LiNbO3 representation along the xz-plane. The cleavage plane [ ] is indicated by the solid line. The angle between the cleavage plane and the
  axis has been both measured and calculated to be 32.75°. The arrows indicate the empty oxygen octahedra. Color coding as previously defined.
Download figure:
Standard image High-resolution imageAs discussed previously, ferroelectric LiNbO3 can be thought of as a piling of oxygen octahedra along the z axis. The oxygen octahedra either accommodate a cation or are empty. In the direction of the positive z axis, the occupation sequence is → Li − Nb − Vacancy →. The vacant octahedral sites lie exactly in the (0 1  2) plane and act as a template for the cleavage. It is indeed assumed, that the interatomic bonding perpendicular to this plane is weakened by the presence of the cationic vacancies. The angle between the polar z axis and the (0 1
  2) is calculated to be 32.75°, which perfectly matches the value measured by Kaminow et al (1980).
It is noteworthy that the cleavage plane can be used to determine the polarization direction. It is known that leveled surface steps appears on the LiNbO3 cleavage plane, a phenomenon known as 'terracing'. A cleave starting from the positive z-cut exhibits a characteristic double row of terraces upon cleaving. On the contrary, cleaves started with a short, light scribe mark from the negative z-cut only result in a single row of terraces upon cleaving (Kaminow et al 1980, Weis and Gaylord 1985). Thus, the morphology of the cleavage plane represents a fingerprint of the polarization orientation and allows for an unambiguous identification of the positive and negative (0 0 0 1) face.
9. Summary and perspectives
In this review we have summarized the present microscopic understanding of lithium niobate surfaces and interfaces as emerging form theoretical models and experimental investigations. Many important advances concerning the knowledge of morphology and stoichiometry of different surface orientations under ambient conditions, at high temperatures or in liquid environment could be accomplished. Theoretical models were successful in explaining a variety of experiments, ranging from diffraction (LEED, RHEED) to imaging techniques (AFM), and from temperature programmed desorption (TPD) to Raman. For the latter, polarization specific spectral information was demonstrated, allowing for a non destructive determination of the polar axis orientation. Thereby, the surface polarization has turned out to be the key quantity, which governs the surface physics and chemistry by determining the surface stoichiometry. The switchable surface polarization is the peculiar property of ferroelectric LiNbO3 surfaces, which makes this field fascinating for basic research and rich in possible applications.
Yet we are still far from a thorough and exhaustive knowledge of lithium niobate surfaces. The large number of dedicated publications appearing each year in scientific journals attests to both the still vivid interest on these systems as well as the need for a deeper understanding of the exotic phenomena occurring at the surfaces. Our understanding of certain aspects of the lithium niobate surfaces is still very fragmentary. Both theoreticians as well as experimentalists will have to tackle different challenges in order to make further advances in this field.
One of the probably most relevant aspect of LiNbO3 surfaces, which despite its huge potential in technological applications is largely unexplored, concerns the employment of lithium niobate ferroelectric surfaces as catalysts (Zielińska et al 2008, Stock and Dunn 2011, Saito et al 2011, Stock and Dunn 2012, Kakekhani et al 2016).
The great advantage of ferroelectric surfaces with respect to non-ferroelectric surfaces is their high tunability. Ferroelectric surfaces are characterized by an order parameter (the ferroelectric polarization), which determines the surface charge and thus the surface chemistry. Furthermore, the polarization couples to multiple physical degrees of freedom such as temperature and strain, which represent different pathways to modulate the surface reactivity (Garrity et al 2013). Surface acoustic waves may be able to tune the surface electronic properties through the piezoelectric effect (Kalinin et al 2007), temperature may tune the polarization via the pyroelectric effect or, more obviously, external electric fields may be used to directly control the polarization. By doping with specific ions LiNbO3 becomes a multiferroic (Song et al 2009, Liu et al 2014), in which the magnetic properties are coupled to their electrical polarization (Kimura et al 2003, Cheong and Mostovoy 2007), so that, in principle, magnetic fields can be employed to control the order parameter (Hur et al 2004, Yamasaki et al 2006, Zvezdin et al 2006) (see figure 45). Ferromagnetic-ferroelectric multiferroics are particularly interesting, as the interaction between the magnetic and electric polarizations leads to additional functionalities. As an example, the magnetoelectric effect (the induction of a magnetization by an electric field, or of a polarization by a magnetic field) could yield entirely new device paradigms, such as electric field-controlled magnetic data storage (Spaldin and Fiebig 2005).

Figure 45. The electric field E, magnetic field B, and strain field σ control the electric polarization P, the magnetization M, and the deformation ε, respectively. In a ferroic material, P, M, or ε are spontaneously formed to produce ferromagnetism, ferroelectricity, or ferroelasticity, respectively.
Download figure:
Standard image High-resolution imageA further benefit of using ferroelectrics is the potential for dynamic or cyclic behavior. We have previously discussed how the maximum efficiency of a fixed catalytic surface occurs when the interaction between surface and adsorbates is strong enough to drive the reactions forward but weak enough to permit the products' desorption (Vojvodic et al 2014). Such a compromise, which fundamentally limits catalytic activity, can be circumvented in ferroelectric surfaces. Indeed, adsorption and desorption processes can be performed on LiNbO3 surfaces at different phases of a polarization cycle between multiple states providing surfaces with very different interaction strengths. In this way adsorption and desorption are no more competing effects, but can be both periodically enhanced or suppressed (Kakekhani and Ismail-Beigi 2015, Kim et al 2011). SAW experiments performed on metal surfaces provide some evidence that such a mechanism is achievable (Inoue 2007, Kalinin et al 2007). Thus, the cyclic control of LiNbO3 surfaces and their chemistry may allow entirely new ways to create and design catalytic devices. These might be the key to tackle some important reactions that currently have no effective catalysts, such as the oxidation of methane to methanol (Lunsford 2000, Reddy et al 2013, Vojvodic and Nørskov 2015) and the direct decomposition of NOx (Murcia-López et al 2014, Kakekhani and Ismail-Beigi 2016b). The relevance of these investigations is by no means limited to academic interest, but has also an influence in everyday life. As an example, the Haber–Bosch process to efficiently break the strong N2 bond and synthesize ammonia, which is the most important precursor for fertilizers (Erisman et al 2008, Ferrin et al 2009) has revolutionized the agriculture worldwide.
In this respect, theoretical investigations are expected to provide an important contribution. Similarly to the case of transition metal catalysis, where efficient computational tools and a predictive theory (Logadottir et al 2001, Hellman et al 2006, Vojvodic et al 2009, Man et al 2011, Vojvodic et al 2014), have permitted computational scientists to design novel catalysts and computationally screen materials for a specific functionality3, also in the case of LiNbO3 theoretical analysis will be required to identify the most promising processes prior to experimental realization.
Despite some important steps toward the simulation of surfaces at ambient conditions (Hölscher et al 2014) or in liquid environment (Rode et al 2012), all available theoretical investigations model ideal surfaces. Real surfaces will differ from these models due to the presence of point and extended defects such as terraces and step edges. It is known from RHEED investigations that annealed lithium niobate surfaces are characterized by the presence of (ordered) defects (Givargizov et al 2012). These have been interpreted as NbLi point defects arisen on the surface due to selective Li2O evaporation. Point defects at the LiNbO3 surface were investigated by photoelectron spectroscopy, instead (Cháb and Kubátová 1986). Surface lattice defects similar to those of ion implantation or metal ion doping have been created at the lithium niobate surface by plasma processing in an attempt to produce a new kind of surface modification (Turcicová et al 2002). More recently, high resolution AFM images taken in liquid environment have demonstrated the presence of atomic size point defects at the LiNbO3(0 0 0  ), as shown in figure 46. The study of these defects will be one goal of future theoretical works. Indeed, the investigation of surface defects is not only of interest for basic science, as surface terraces play a crucial role in catalytic processes and surface point defects may affect the polarization reversal procedure, either acting a pinning centers for a certain polarization direction or as seed for the growth and propagation of domains with the reversed polarization.

Figure 46. High resolution, drift-corrected AFM image of the LiNbO3(0 0 0  ) face showing atomic sized surface defects. The constant-height image was taken under liquid environment after annealing for 10 h at about 1200 K. Arrows show the position of surface defects. Courtesy of Kühnle, Johannes Gutenberg-Universität Mainz, Germany.
Download figure:
Standard image High-resolution imageMany of the most recent LiNbO3 based applications exploit the peculiar features of thin films, which are becoming popular as they offer a further knob to tune the material properties (Han et al 2015). LiNbO3 thin films can be grown on different substrates in order to modify the LiNbO3 lattice parameters and thus tune the polarization via piezoelectric effect. Epitaxial growth of LiNbO3 thin films by excimer laser ablation method with outstanding surface acoustic wave properties has been recently reported (Shibata et al 1992). Alternatively, they can be sliced from thicker samples with the smart cut technique (Levy et al 1998, Rabiei and Gunter 2004, Lu et al 2012). The obtained thin films are then employed for the fabrication of thin optical waveguides (Cai et al 2015) or photonic devices (Poberaj et al 2009). In addition, thin films are more easily poled than thicker layers, allowing for a more precise control of the domains, especially in periodically poled crystals (Mackwitz et al 2016). Moreover, potentially interesting properties such as enhanced photovoltaic currents have been measured in strained Fe-doped LiNbO3 thin films (Inoue et al 2015). Unfortunately, our knowledge of lithium niobate thin films is fragmentary, especially from the theoretical point of view. Future simulations will have to cope with fundamental questions, such as the influence of the surfaces on the 'bulk' of the thin films and the minimal layer thickness until which ferroelectricity is preserved. Thereby the theoretical modelling of thin films within the supercell approach is challenging and affected by different issues (Meyer and Vanderbilt 2001), so that an approach beyond the supercell model might be necessary.
Besides the aforementioned technologically relevant issues, several aspects concerning very basic properties of the lithium niobate surfaces need further investigation.
- With the exception of the z-cut, only surfaces with the (
 ) periodicity have been investigated, as no experimental evidence for long ranging reconstruction is available. While the physical picture originating from this approach will not change using larger surface unit cells, future studies based on larger unit cells might be performed to determine the exact surface stoichiometry.
 - The origin of the difference in the etching rates of differently polarized surfaces are still not understood from a microscopic point of view. Possible reaction paths have to be simulated by both static and dynamic models to shed light on this puzzling topic. The payoff for these investigations is the improvement of the etching process, which is, on turn, crucial for the domain engineering.
- Another aspect crucial for the development of a precise and efficient domain patterning is the polarization reversal process via coercive fields. The processes and mechanisms associated with the initial nucleation of reverse-polarity domains are poorly understood, though. Even less is known about the effect of the lithium niobate surfaces in the domain nucleation. It is known that the reversed domain nucleation starts at the positive face (Miller 1998, Shur 2006, Mackwitz et al 2016), as shown e.g. in figure 47. The asymmetry in the nucleation site has been traced back to the built-in electric fields formed by Schottky junctions at the ferroelectric/electrode (which is semiconductor/metal) interfaces (Gao et al 2011a). Yet, in MgO-doped samples the UV-assisted polarization reversal may begin at the negative face (Suche 0000), or not (Ishizuki et al 2003), depending on the details of the polarization process. It is not clear whether this is due to different surface charge accumulation layers, and it is not clear which role is played by the surface terminations. Microscopic modelling will be crucial to resolve these issues.
- All available simulations of lithium niobate surfaces and interfaces are static models. For certain systems, such as the LiNbO3/liquid interface or the LiNbO3 interfaces at high temperatures, dynamic simulations, e.g. in the framework of ab initio molecular dynamics, might be necessary. Pioneer works in this field have been performed recently Liu et al (2015), yet much more work will be required to understand e.g. the evolution of surfaces in presence of reagents.


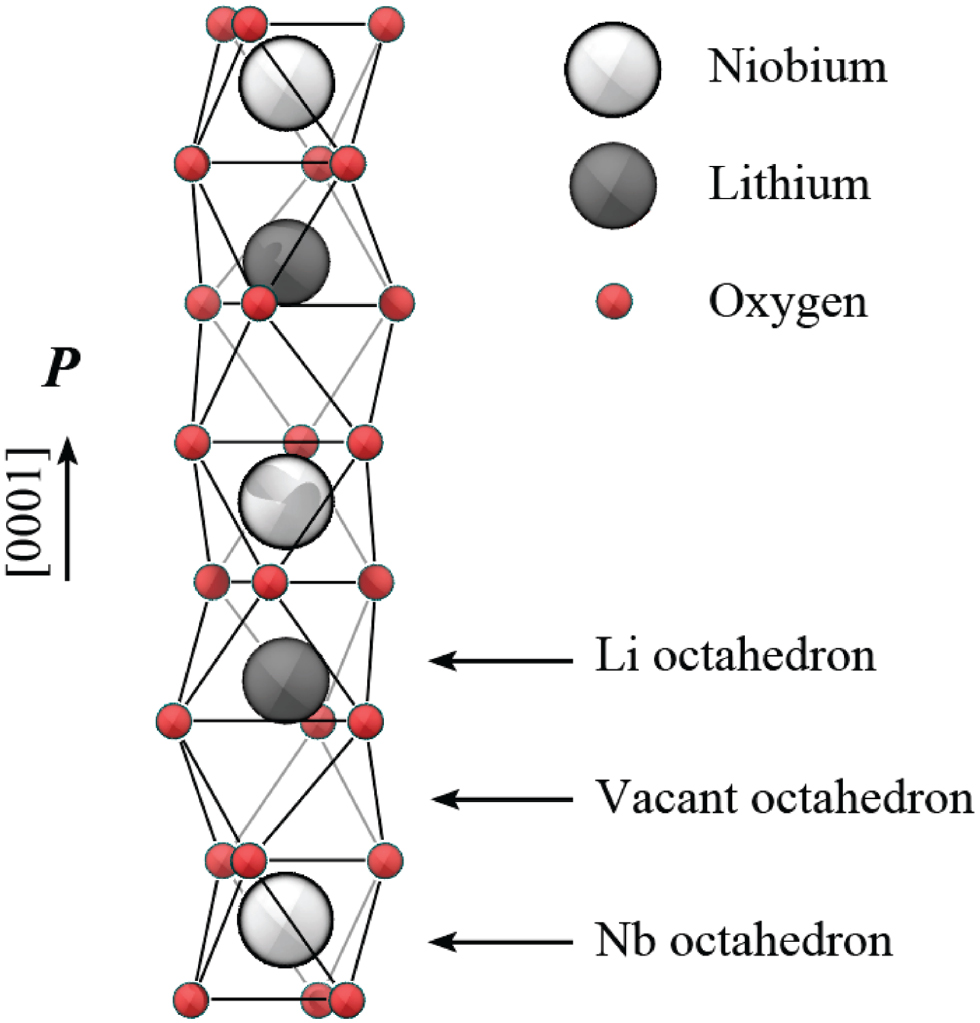
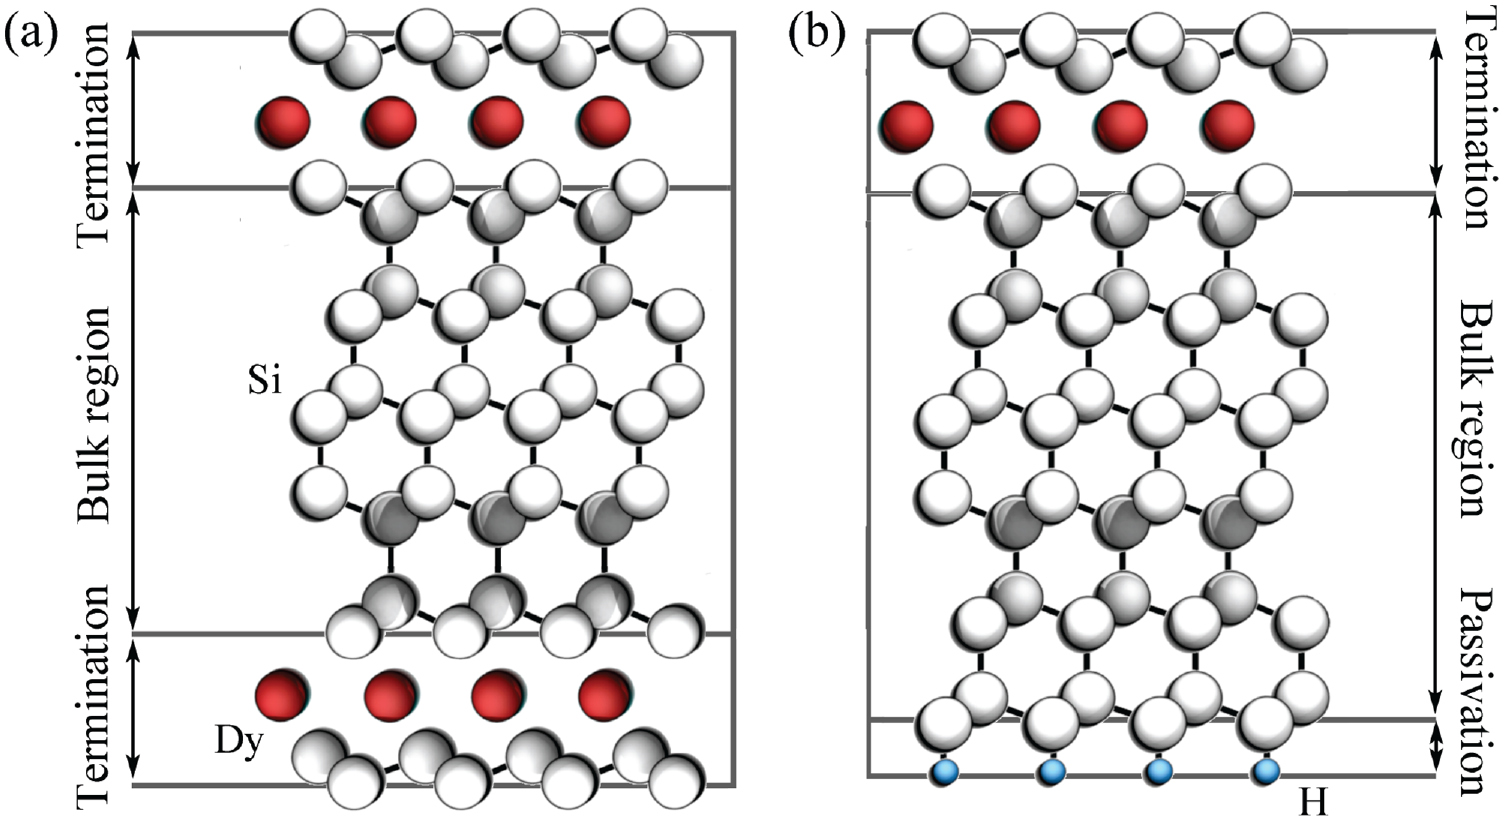
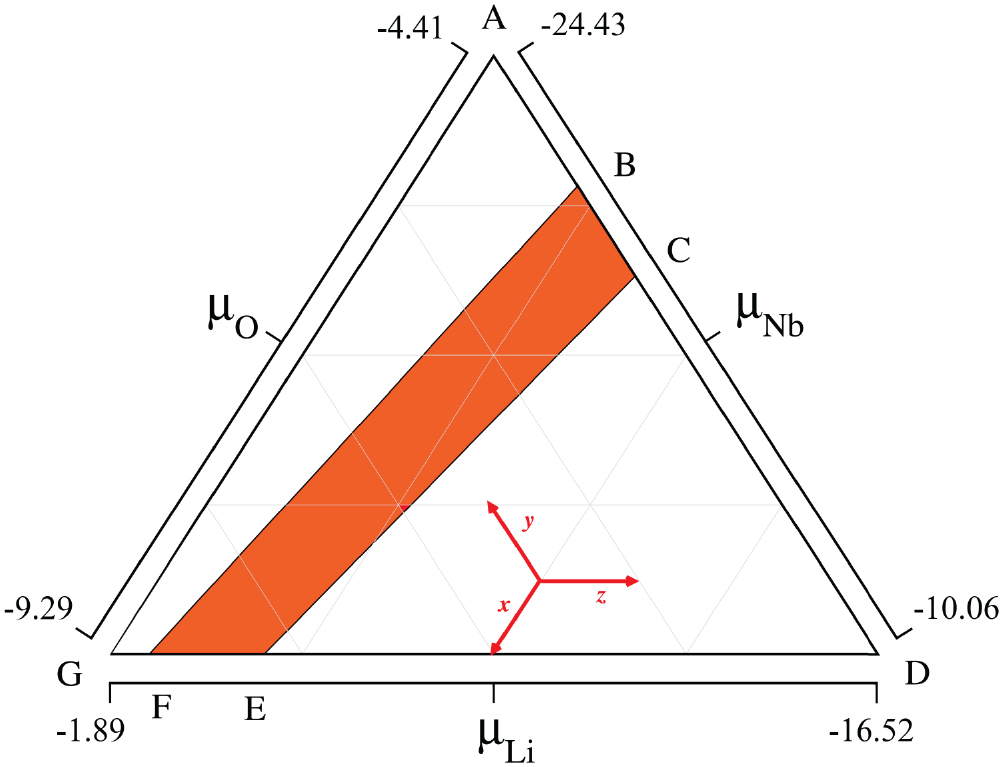
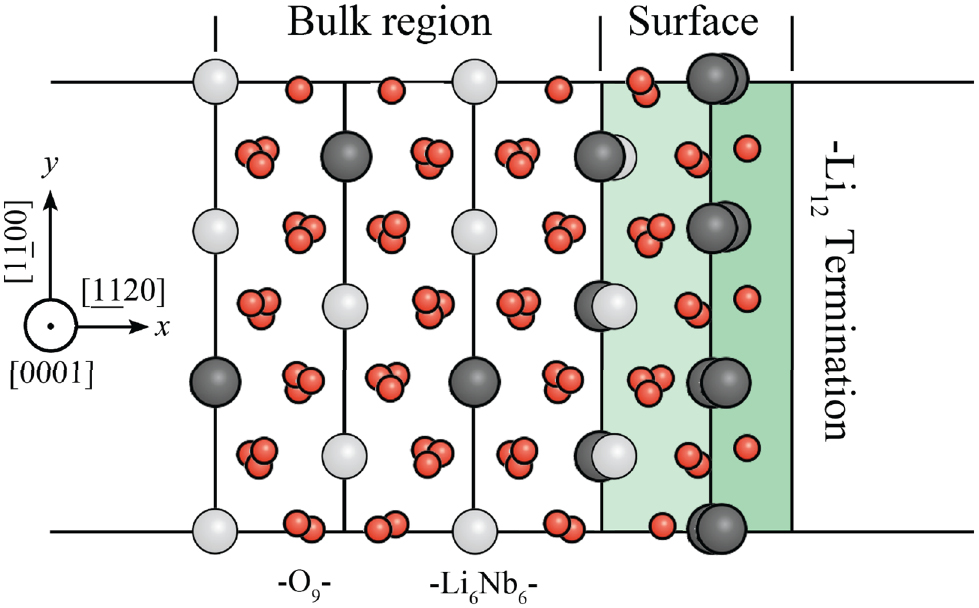
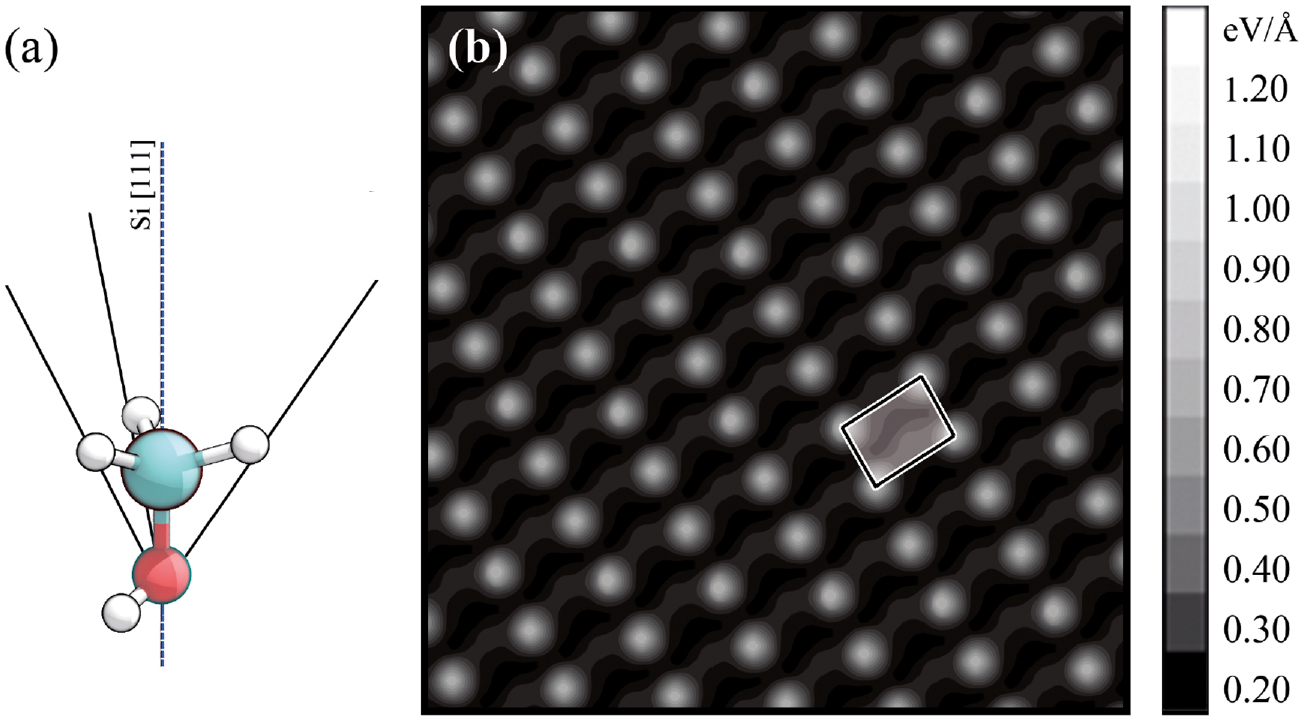
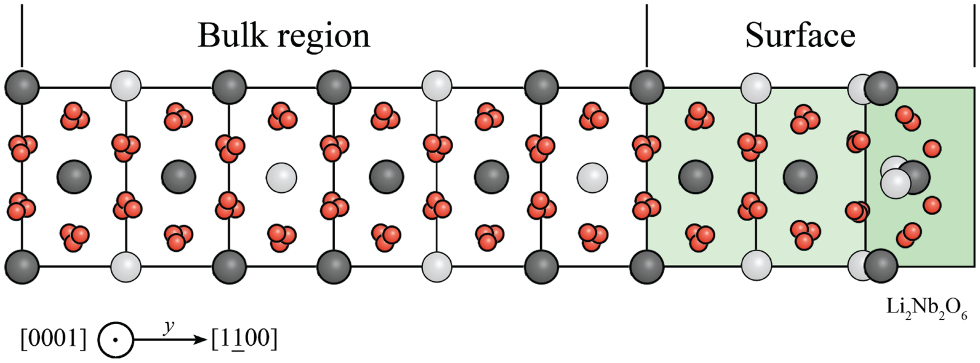
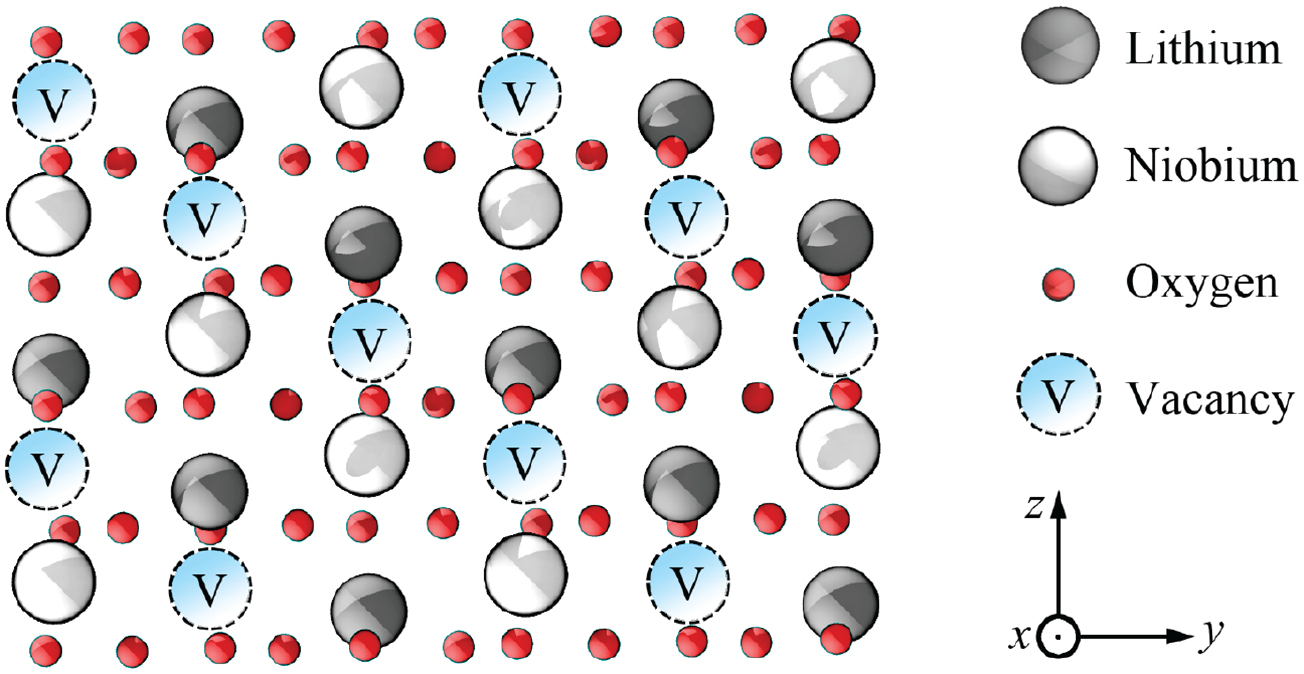
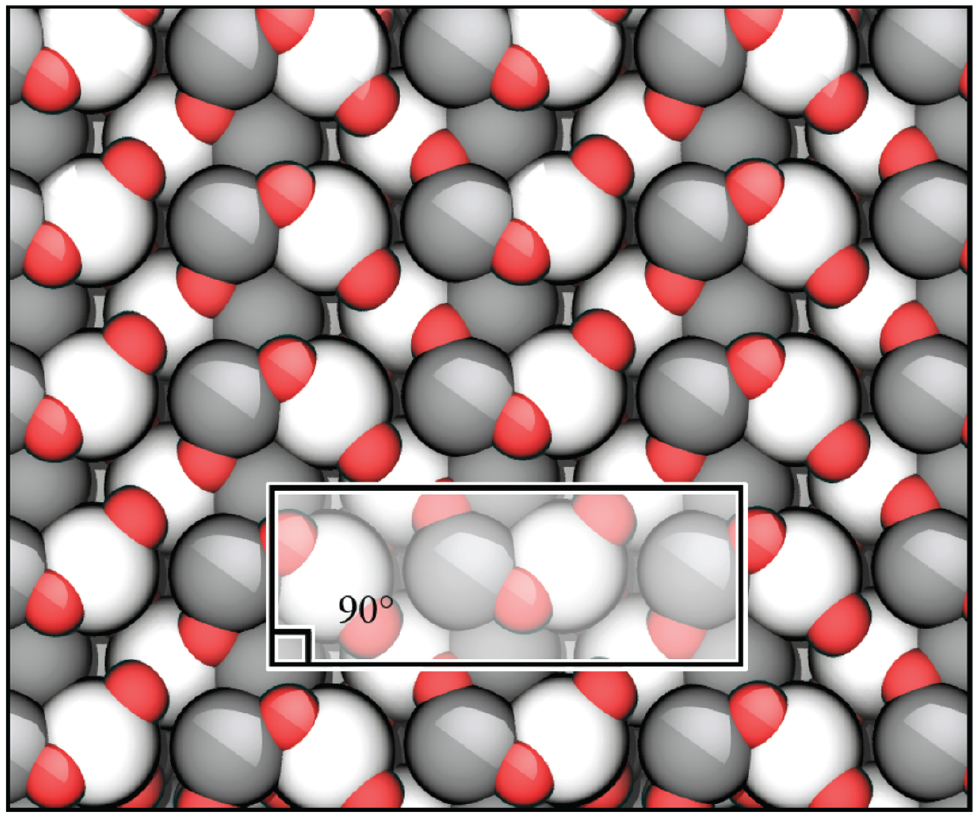
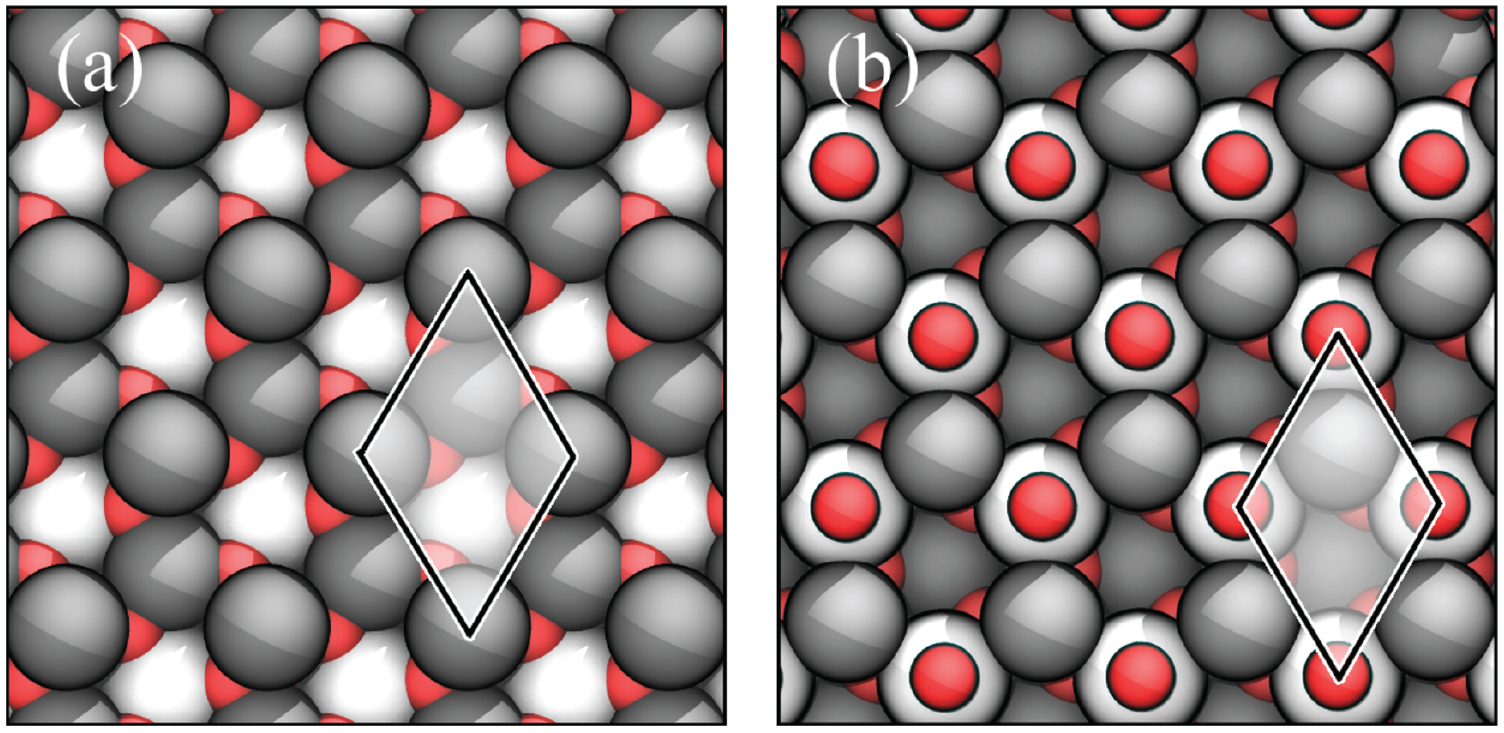
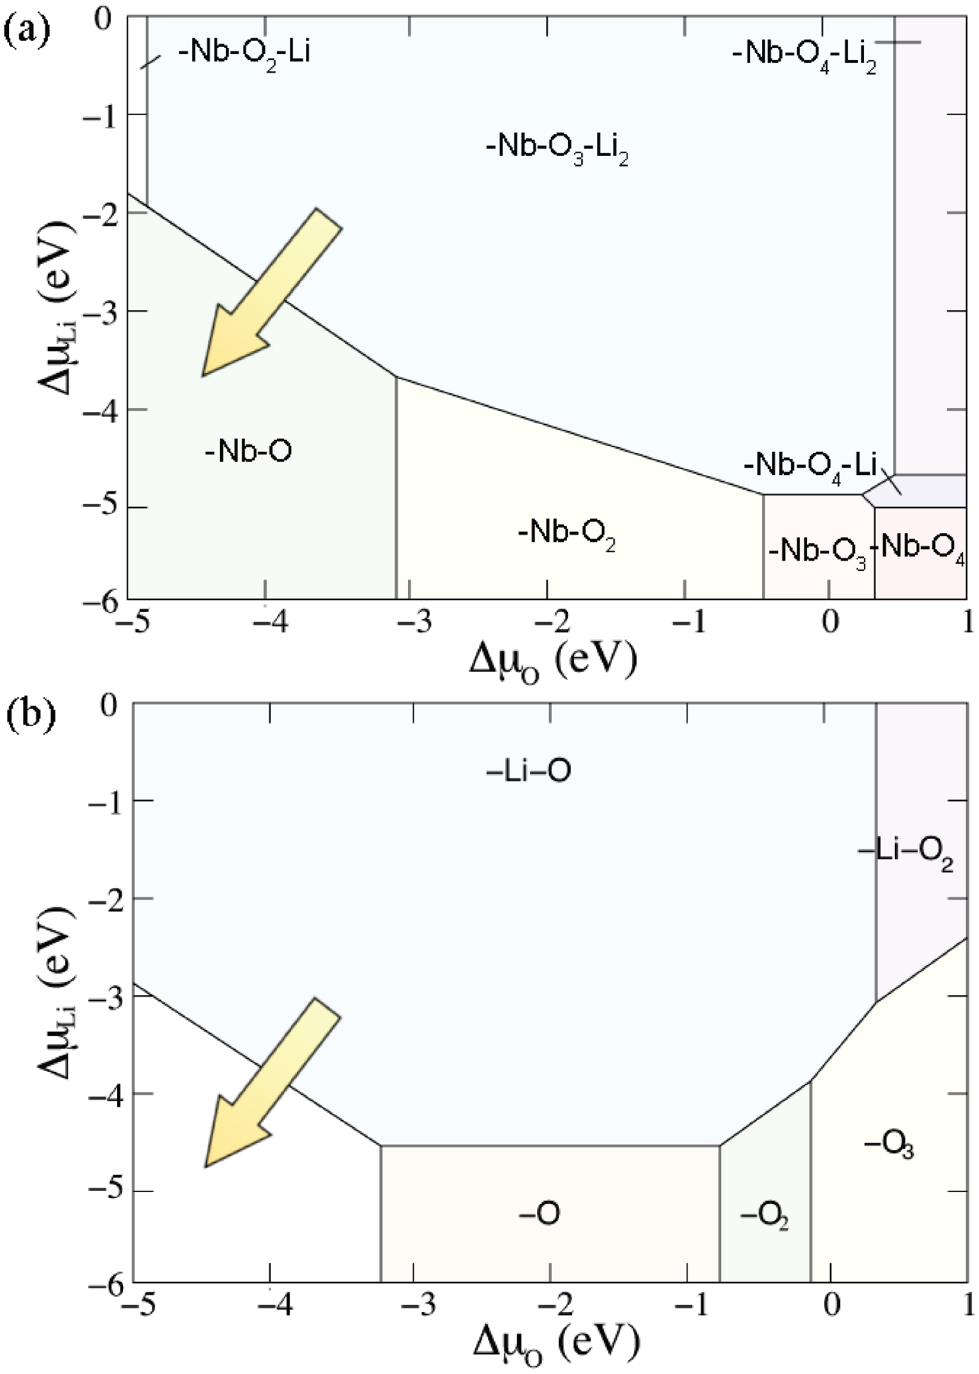
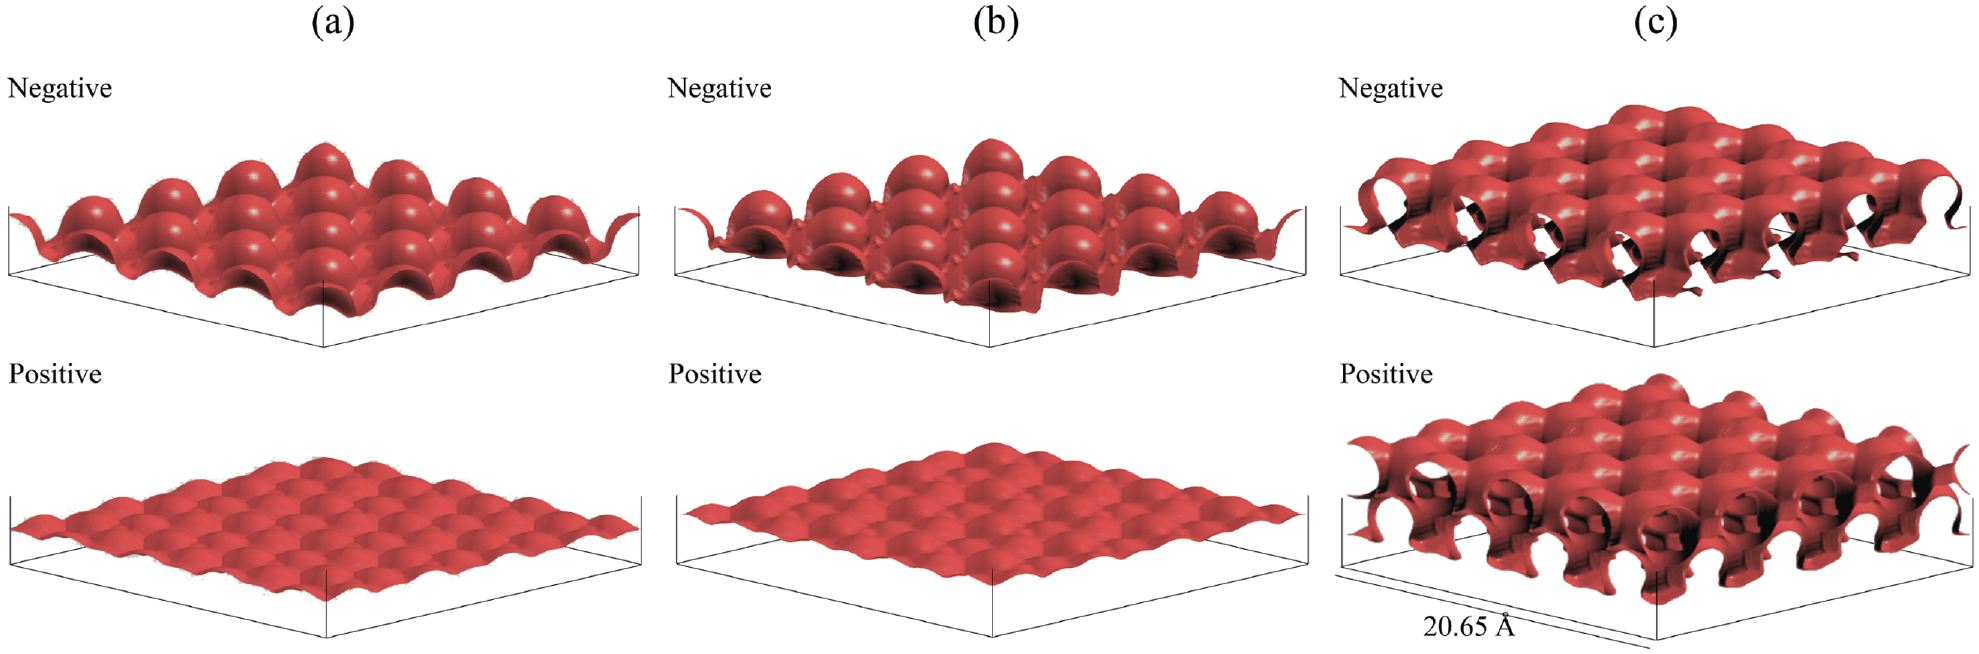
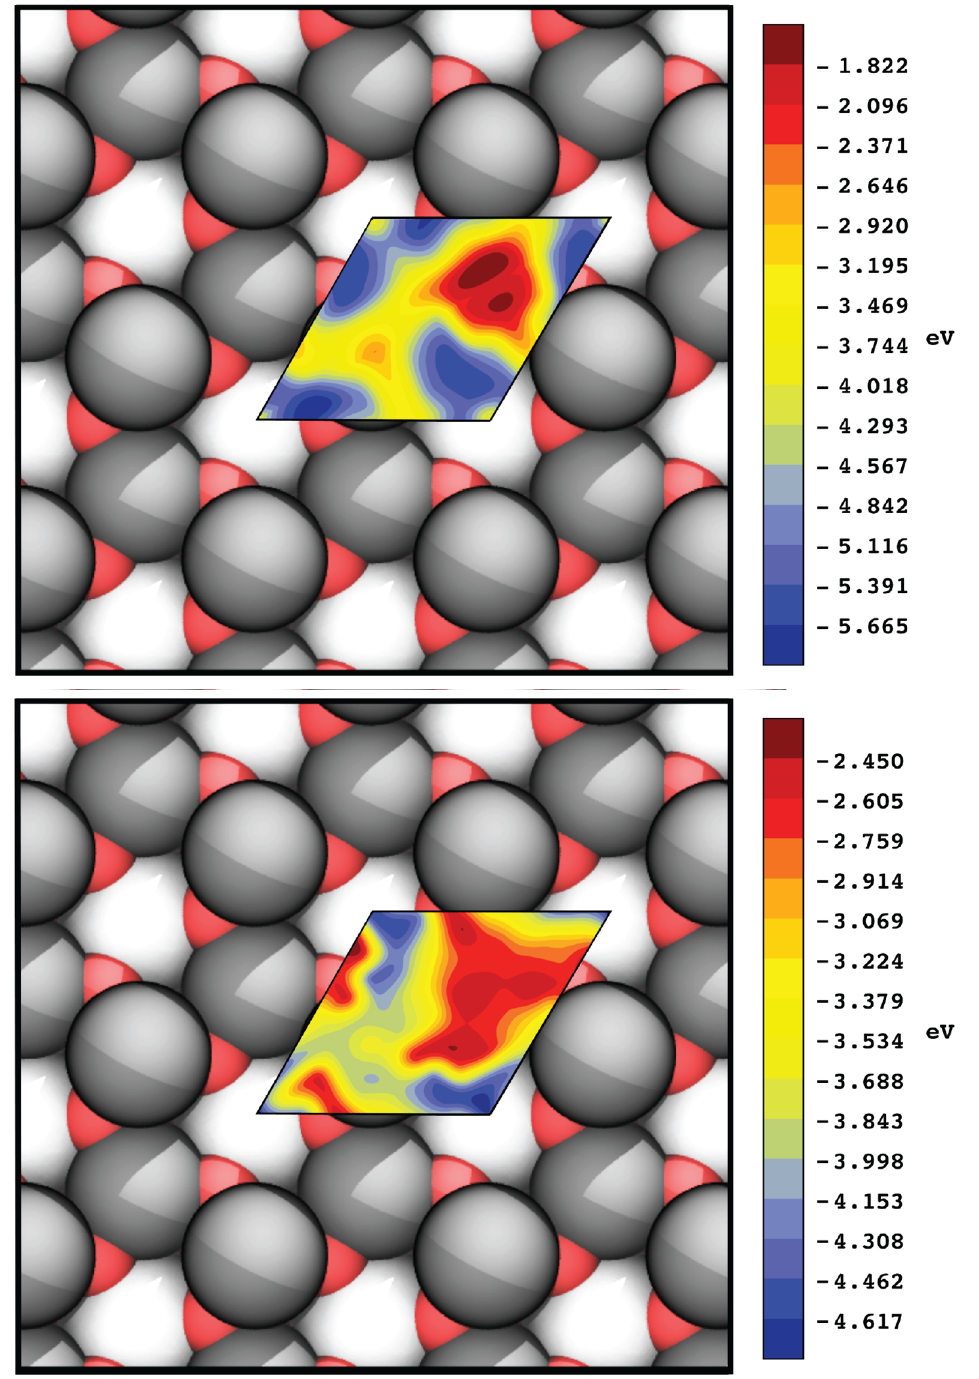
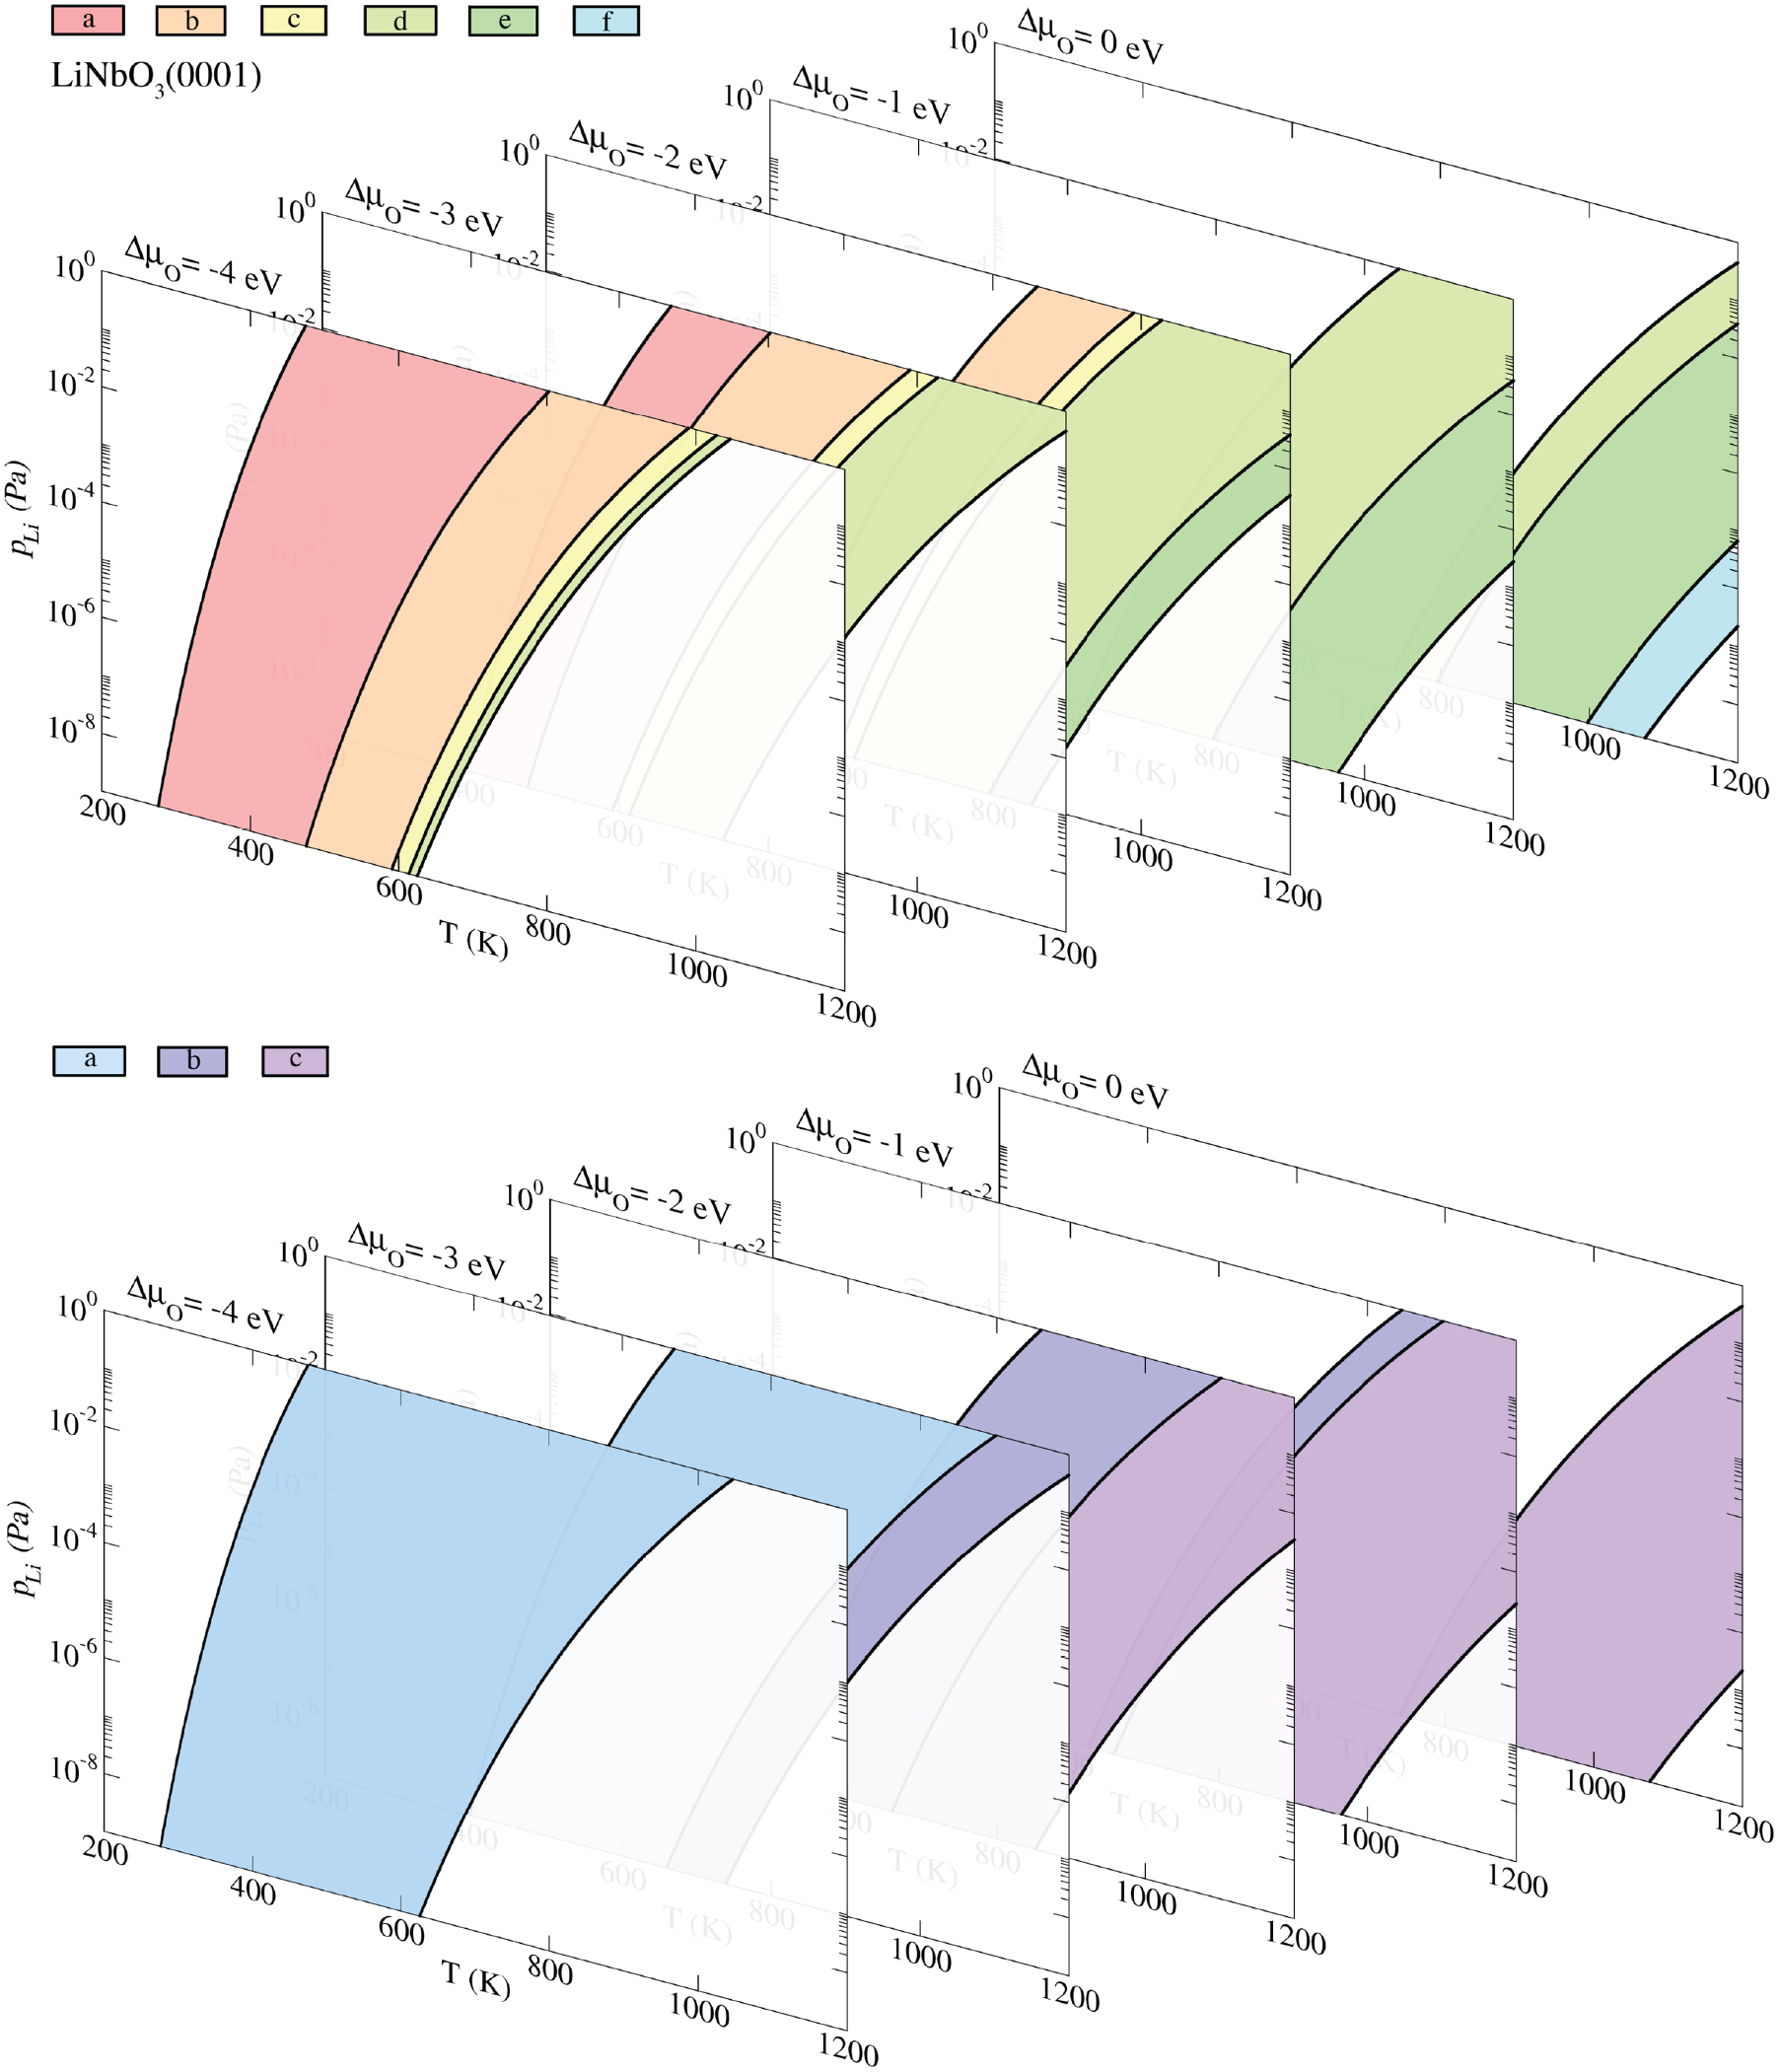
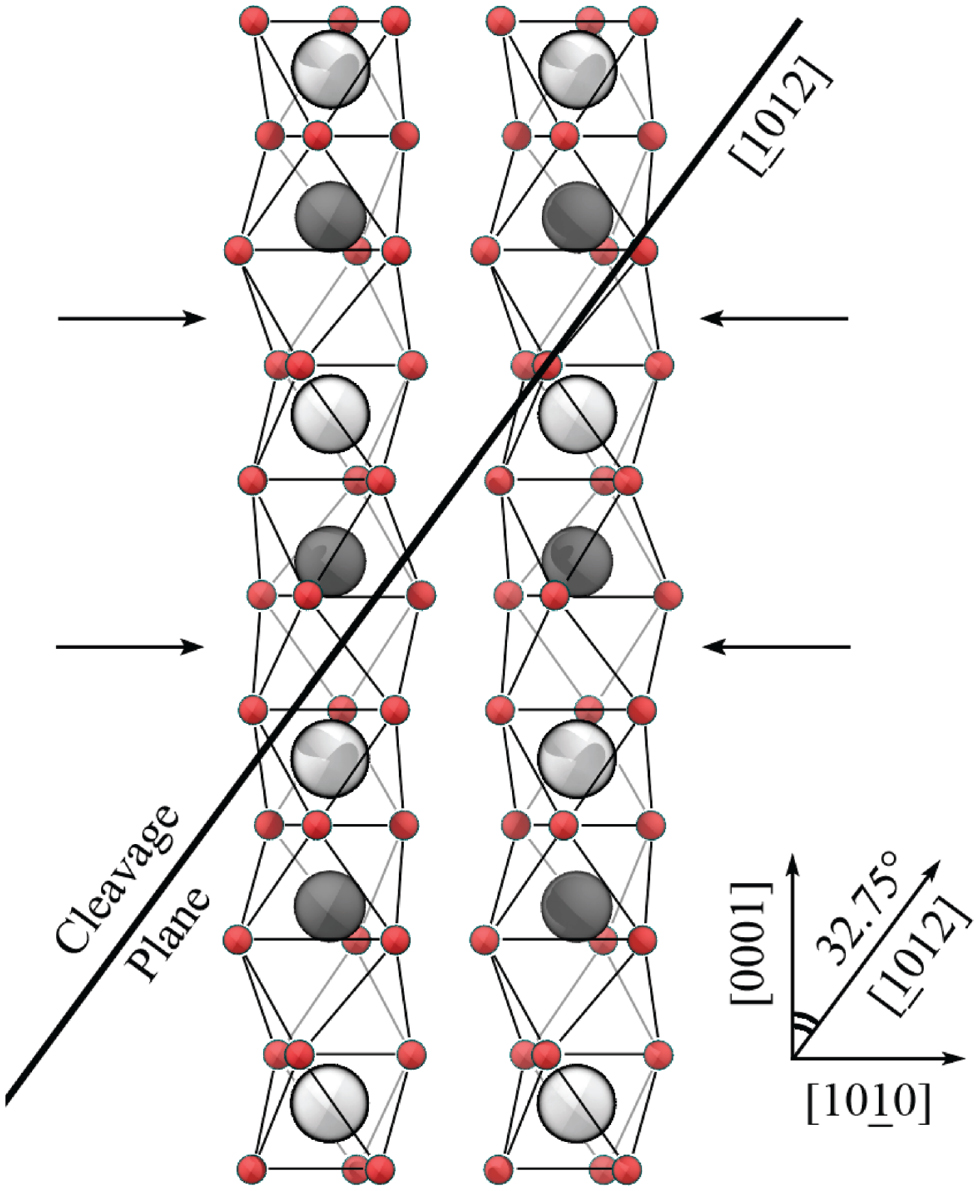
Figure 47. Confocal second-harmonic image of periodic micro-domains on a planar x-cut LiNbO3 sample with finger-like electrodes (Berth et al 2007). Pulsed field assisted poling (20 rectangular pulses with pulse durations of 5 ms). The domains with inverted polarization nucleate at the positive electrodes and propagate toward the negative ones. Berth et al (2009), reprinted by permission of the publisher (Taylor & Francis Ltd, http://www.tandfonline.com.)
Download figure:
Standard image High-resolution image
Thus, despite the substantial advances we owe to atomistic simulations, we are only starting to understand the physics and chemistry of lithium niobate surfaces. Several eminently important fields of research, such as the ones concerning the physics of thin films or the catalytic activity of the surfaces, have not been touched upon, and will be an important topic for future theoretical investigations.
Acknowledgments
We thank Prof R W Eason (University of Southampton, UK), Dr G Berth, (Universität Paderborn, Germany), and Prof A Kühnle (Johannes Gutenberg-Universität Mainz, Germany) for providing the SEM, SHG and AFM images. R Hölscher, C Braun and C Dues (Universität Paderborn, Germany) are acknowledged for providing the atomic coordinates of some of the structures illustrated in this work. We gratefully acknowledge numerous helpful discussions with Christine Silberhorn, Wolfgang Sohler, Hubertus Suche, and Artur Zrenner (Universität Paderborn, Germany), Nicola Argiolas, Marco Bazzan, Cinzia Sada, Andrea Sanson and Annamaria Zaltron (Universitá degli Studi di Padova, Italy), Elisabeth Soergel and Tobias Jungk (Rheinische Friedrich-Wilhelms-Universität Bonn, Germany), Sakellaris Mailis (University of Southampton, UK), Mirco Imlau (Universität Osnabrück), Lászlo Kóvács and Gabor Corradi (Wigner Research Centre, Hungarian Academy of Sciences, Hungary), A Kühnle (Johannes Gutenberg-Universität Mainz, Germany), Yongfa Kong (Nankai University, China), Yanlu Li and Xian Zhao (Shandong University, China), Lucas Eng (Technische Universität Dresden) and Paolo Minzioni (Universitá degli Studi di Pavia).
The Deutsche Forschungsgemeinschaft (DFG) is gratefully acknowledged for financial support via projects TRR142, FOR1700 and SCHM1361/21. All the calculations were performed at the Paderborn Center for Parallel Computing (PC2) and at High Performance Computing Center in Stuttgart (HLRS).
Footnotes
- 3