
Abstract
The authors have recently developed two novel solutions for strain sensing using nanocomposite materials. While they both aim at providing cost-effective solutions for the monitoring of local information on large-scale structures, the technologies are different in their applications and physical principles. One sensor is made of a cementitious material, which could make it suitable for embedding within the core of concrete structures prior to casting, and is a resistor, consisting of a carbon nanotube cement-based transducer. The other sensor can be used to create an external sensing skin and is a capacitor, consisting of a flexible conducting elastomer fabricated from a nanocomposite mix, and deployable in a network setup to cover large structural surfaces. In this paper, we advance the understanding of nanocomposite sensing technologies by investigating the potential of both novel sensors for the dynamic monitoring of civil structures. First, an in-depth dynamic characterization of the sensors using a uniaxial test machine is conducted. Second, their performance at dynamic monitoring of a full-scale concrete beam is assessed, and compared against off-the-shelf accelerometers. Experimental results show that both novel technologies compare well against mature sensors at vibration-based structural health monitoring, showing the promise of nanocomposite technologies for the monitoring of large-scale structural systems.
Export citation and abstract BibTeX RIS
1. Introduction
Structural health monitoring (SHM) of civil structures has the potential of enabling timely inspection and maintenance, resulting in enhanced structural safety and longer life span [1, 2]. However, the SHM task is complicated by the inherent size of the structures to be monitored. Most of the existing sensing solutions are hardly scalable without necessitating substantial costs and complex signal processing algorithms. As a result, monitoring and diagnostic solutions can rapidly become financially unattractive because of their low return on investment.
Recent advances in nanomaterials and synthetic metals have led to new possibilities in sensor development [3, 4], including the use of highly conductive materials and flexible electronics that enable substantial improvements in the cost-effectiveness of SHM solutions for geometrically large systems. Building on these technological advances, the authors have developed two novel strain gauges, with the common objective to provide local information over global surfaces, analogous to biological skin.
The first sensor consists of a carbon nanotube cement-based sensor (CNTCS) [5]. The CNTCS is a self-sensing cement paste that can be applied over large linear segments to enable monitoring of concrete structures. The similarity between the sensor's material and structural concrete also suggests that CNTCS could be embedded in concrete structures prior to casting. Embedded, the CNTCS would have the advantage of easily binding with the monitored structure, with the potential to transform the structures into infinite sets of potential sensors. This would enlarge the sensitive volume to its maximum extent. Cementitious materials, such as the one used for the CNTCS, also have the same durability as the monitored structure, which allows long-term applications with limited maintenance issues. With the CNTCS, local strain is transduced in a change in electrical resistance.
The second sensor proposed by the authors consists of a soft elastomeric capacitor (SEC) that can be deployed over large surfaces, at low cost, to enable meso-sensing [6, 7]. Arranged in a network configuration, the sensing strategy could provide discrete measurements at numerous locations. The SEC is fabricated from a poly-styrene-co-ethylene-butadiene-co-styrene (SEBS) matrix mixed with titanium dioxide (TiO2) sandwiched between electrode plates composed of SEBS mixed with carbon black (CB). Local strain is transduced in a change in capacitance. As will be detailed in section 2.2 and validated in section 4.2, a particular advantage of the sensor is its bi-directional measurement capability, which provides a means to measure dynamic responses along two major axes.
These two technologies are similar by being novel strain gauges fabricated from nanocomposite mixes, but different in their installations: the CNTCS has been designed as an embeddable cement-based sensor, and the SEC as a surface sensor.
Numerous SHM applications rely on dynamic identification from vibration measurements [8] in operational conditions with excitation typically provided by wind [9] and traffic. Continuous applications of dynamic monitoring are becoming popular, as they enable real time monitoring of differential structural changes and further knowledge on structural behavior [10]. Given the potential of dynamic monitoring techniques, the authors propose to advance the understanding of both novel sensing methods by comparing their performance in the dynamic monitoring of civil structures. By conducting this comparison, the authors aim to demonstrate the promise of novel nanocomposite sensing technologies to address the large-scale monitoring challenge.
The paper is organized as follows. Section 2 presents the background theory on both sensors, including a state-of-the-art summary, the fabrication process and the sensing principle. Section 3 describes the methodology used for the dynamic characterization of the sensors and for their performance assessment on a full-scale concrete beam. Section 4 shows and discusses the experimental results. Section 5 concludes the paper.
2. Background
2.1. Carbon nanotube cement-based sensor
The idea of fabricating self-sensing cementitious materials through the addition of suitable particles into traditional admixtures dates back to the early 1990s [11]. Since then, several studies have been devoted to a cement-based material mixed with carbon fibers [12], nano-carbon black [13] and, more recently, carbon nanotubes [14, 15]. It has been recognized that the particles modify the electrical resistivity of cementitious materials and define the strain sensing functional property due to piezoresistivity caused by the slight pull-out of fibers passing through microcracks [12]. Among the various types of nanoparticles, carbon nanotubes (CNTs) are especially promising because they possess excellent electrical and mechanical properties. For this reason, they are currently employed in the realization of many strain sensing composite materials (e.g. [16, 17]). However, the dispersion of CNTs into a cementitious matrix is a very delicate task because of their low solubility in water-based solutions [18].
Compared to other existing cement-based sensing composites, the novel CNTCS sensor has been designed and manufactured by a procedure specifically tailored for the dynamic sensing of strain. This field of research is almost unexplored, as most works have been focused so far on the response of nanotechnology-modified cement-based materials to slowly varying strain, while their response to dynamically varying strain has been rarely investigated. The CNTCS is calibrated to achieve a good sensitivity, using physical and chemical methods for the dispersion of nanotubes in order to obtain a homogeneous and effective composite material. Compared with traditional strain gauges, the CNTCS is fabricated with a material similar to structural concrete, which could allow embedment within an external cover. This could transform a new or existing structure into a self-sensing system and cost-effectively enlarge the sensing surface. Also, the use of a cement paste provides a significant enhancement in the hardware durability, providing the sensor with a life expectancy similar to that of the monitored structure.
The fabrication process of a CNTCS is shown in figure 1. First, an ammonium polyacrylate-based dispersing additive (BYK 154) is added to deionized water in the amount of 1% by weight of CNTs (figure 1(a)). Then, multi-wall carbon nanotubes (MWCNTs) (type Arkema Graphistrength C100) are added to the solvent in the proper amount (2% by weight content of cement) (figure 1(b)). Dispersion of nanoparticles is the crucial step that most affects the final result, as the suitable electrical properties of the nanomodified cement matrix are achieved only if a homogeneous CNT network is formed in the composite material. In particular, the CNT network should be three-dimensional, free of CNT bundles, and with contacts between the nanotubes. Here, dispersion is achieved by sequentially applying 10 min of magnetic stirring (figure 1(c)), 60 min of sonication (figure 1(d)) and 15 min of mechanical mixing (figure 1(e)). The power of the ultrasound of the sonicator (ultrasound probe series Vibra Cell Bioblock Scientific mod. 75043) is adjusted to 225 W and the speed of rotation of the agitator set to 1500 rev min−1. After being well dispersed, the water suspension is mixed with a plasticizer (BASF SKY 521) and with the cement powder (figure 1(f)). It is then poured in an oiled mold (figure 1(g)), and net electrodes are embedded (figure 1(h)). Finally, after removal from the mold, curing of the sample is carried out.

Figure 1. Fabrication process of a CNTCS.
Download figure:
Standard image High-resolution imageFigure 1(i) shows a picture of the final specimen of dimensions 50 × 40 × 50 mm3. Four bidimensional stainless steel electrodes, composed of 1 mm diameter wires deployed to form 12.5 × 12.5 mm nets, are embedded in approximately 3/4 of the width of the sensors. Inner electrodes are placed at a mutual distance of 20 mm, while the outer two electrodes are placed at a distance of 10 mm from the inner ones. Figure 2 shows SEM images of the CNTs (a) in the water suspension and (b) in the nanomodified cement paste (b), demonstrating the effectiveness of the dispersion of the nanoparticles.
Table 1 summarizes the main properties of the CNTs used in the CNTCS, while the composition of the cement paste is described in table 2. MWCNTs are used because of their higher sensitivity to stress changes with respect to single-wall nanotubes [19].
When the amount of nanoparticles in the composite material reaches a critical fraction and the CNTs are properly dispersed, percolation starts and the material becomes a conductor. In such condition, a compressive strain results in closer interactions between nanoparticles and in a higher electrical conductivity. Conversely, a tension strain provokes the opposite effect with a decrease in conductivity. From these observations, it is clear that the change in axial strain Δε is physically correlated with the change in electrical resistance ΔR between two points in the material.
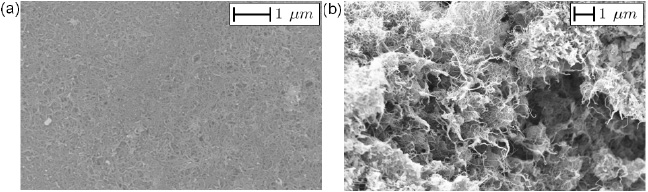
Figure 2. SEM images of the CNTCS: (a) water suspension with CNTs; and (b) hardened composite cement paste.
Download figure:
Standard image High-resolution imageA major issue affecting the relationship between ΔR and Δε is that cement paste possesses dielectric properties and consequently exhibits electrical polarization effects. This occurs when a dielectric is subjected to an electrical field. The applied electrical field polarizes the material by orienting the dipole moments of the molecules that have random orientations under normal conditions. The result of polarization is an electrical field in the direction opposite to the applied electrical field due to the formation of the dipoles. The main consequence of the dielectric properties of the material is that the sensor does not behave as a simple resistor but rather as a resistor and a capacitor in parallel, with some parasitic resistance arising from the contact electrode-sensor. However, this parasitic resistance can be neglected in comparison with internal resistance.
The measurement principle of the CNTCS consists of computing the change in strain by measuring the change in resistance of the sensor. Here, measurements of electrical current between the CNTCS electrodes under application of a stabilized voltage difference are taken and electrical resistance is measured by dividing applied voltage by electrical current.
The measured electrical current of the CNTCS and, consequently, the measured electrical resistance vary with strain and polarization. In particular, in unstrained conditions, the measured electrical resistance asymptotically reaches over time the internal electrical resistance. This slow variation of electrical resistance due to polarization is combined with faster variations when strain occurs. At a first level of approximation, the former effect can be eliminated through a high-pass filter and the correlation between measured resistance and strain can be modeled by means of the same formula as used for conventional strain gauges:
where λCNTCS is the gauge factor of the CNTCS and R0 is the value of the unstrained internal electrical resistance of the sensor. Because of the peculiar electromechanical behavior of the sensors, λCNTCS is rate dependent and also varies with ε, resulting in a nonlinear relationship of strain-to-signal. In this paper the variational strain is obtained by assuming linearity of equation (1).
Table 1. Properties of the MWCNTs used in the experiment.
| Property | Description/value |
|---|---|
| Appearance | Black powder |
| Apparent density | 50–150 kg m−3 |
| Mean agglomerate size | 200–500 μm |
| Weight loss at 105 °C | <1% |
| Carbon content | >90% in weight |
| Free amorphous carbon | Undetectable (SEM) |
| Mean number of walls | 5–15 |
| Outer mean diameter | 10–15 nm |
| Length | 0.1–10 μm |
Table 2. Cement paste mix design.
| Components | Content |
|---|---|
| MWCNTs | 324 kg m−3 |
| DisperByK154 | 3.24 kg m−3 |
| Cement type 42.5 | 16200 kg m−3 |
| Superplasticizer | 32.4 dm3 m−3 |
| Water | 6970 kg m−3 |
| w/c ratio | 0.43 |
2.2. Soft elastomeric capacitor
Flexible sensors have been previously proposed for SHM applications [20–25]. Popular applications include the addition of CNTs within a polymer matrix to create resistance-based strain sensors [26–28]. Capacitance-based strain sensors have also been proposed, with applications to strain [29, 30], pressure [31], tri-axial force [32] and humidity [33, 34] measurements. The SEC developed by the authors differs from those in the literature by combining both a large physical size and relatively high initial capacitance, resulting in a larger surface coverage and higher sensitivity. A network of SECs offers the combined advantages of being cost-effective, operable at low frequencies, mechanically and environmentally robust, low-powered, easy to install onto surfaces, and customizable in shapes and sizes. The proof-of-concept of the SEC technology has been demonstrated by the authors with an off-the-shelf flexible capacitor [35], and with the nanoparticle mix used in this paper [6].
The fabrication process of an SEC is shown in figure 3. First, the SEBS (Mediprene Dryflex) matrix is dissolved in toluene (figure 3(a)). The solution is doped with TiO2 rutile (Sachtleben R 320 D) by dispersing a 15% vol. concentration using an ultrasonic tip (Fisher Scientific D100 Sonic Dismembrator) (figure 3(b)). The addition of these inorganic particles into the SEBS matrix increases the permittivity and durability of the polymer [36]. The SEBS–TiO2 mix is drop cast on an 80 × 80 mm2 glass slide and dried for 48 h to let the toluene evaporate (figure 3(c)). During this drying phase, a 10% vol. concentration of CB (Printex XE 2-B) is added to another SEBS–toluene mix. The CB particles are dispersed in a sonic bath over 24 h (figure 3(d)). The conductive mix is painted onto the top and bottom surfaces of the dried dielectric (SEBS + TiO2) to create the electrodes, and left to dry for 48 h to let the toluene evaporate. Two conductive copper tapes are embedded in the electrode mix to allow a mechanical connection to the sensor. Figure 3(f) is a picture of the resulting SEC. Figure 4 is a SEM image of the resulting SEC showing a good dispersion of the TiO2 particles.

Figure 3. Fabrication process of an SEC.
Download figure:
Standard image High-resolution image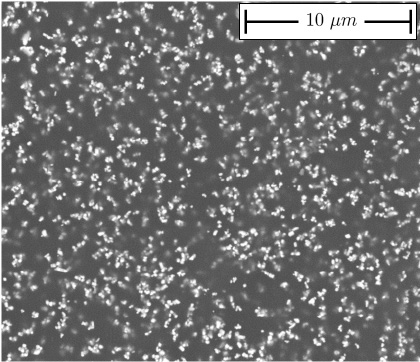
Figure 4. SEM image of the SEC.
Download figure:
Standard image High-resolution imageThe capacitance C of an SEC can be approximated by
where ε0 = 8.854 pF m−1 is the vacuum permittivity, εr the dimensionless polymer relative permittivity, A = wl the sensor area with width w and length l, and h the height of the dielectric. The relative permittivity is assumed to be constant at low frequencies (<100 Hz). A small change in C can be obtained from equation (2) by expressing the differential ΔC as
Specializing equation (3) for unidirectional strain (Δw = 0), and assuming that the polymer is incompressible (the Poisson ratio of pure SEBS materials ≈ 0.49 [37], resulting in a change in volume ΔV ≈ 0), the following geometric property can be derived between Δl and Δh:
where V0 = wlh represents the nominal volume. It follows from equation (2) to (4) that
Equation (5) represents the sensitivity of the sensor, from which a gauge factor of λSEC = 2 can be obtained. While the gauge factor is not a function of the level of dopant, the addition of TiO2 can result in a significant change in sensitivity. Also, the sensor sensitivity can be customized by altering the sensor geometry. For the SEC shown in figure 3(f) (C ≈ 700 pf, w = l = 70 mm, h = 0.45 mm), the resulting sensitivity is ΔC/Δl ≈ 20 pF mm−1, but may vary by ± 20% due to the manual fabrication process.
The measurement principle of an SEC is shown in figure 5. The sensor is adhered onto the monitored surface with an epoxy. A strain in the monitored surface Δl/l is transduced as a change in the SEC geometry, which can be read as a change in capacitance ΔC/C by the data acquisition (DAQ) system.
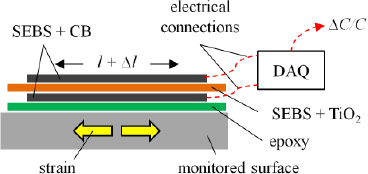
Figure 5. Sensing principle of an SEC.
Download figure:
Standard image High-resolution image3. Methodology used for the comparison
3.1. Dynamic characterization
Prior to conducting the experimental tests on the large-scale concrete beam specimen, the dynamic response of both sensors was studied in a controlled laboratory setup. To provide an accurate comparison, an SEC of dimensions 40 × 40 × 0.45 mm3 was adhered directly onto the surface of the CNCTS of dimensions 50 × 40 × 50 mm3. Figure 6(b) is a picture of the CNTCS specimen and figure 6 (c) shows the SEC adhered onto the surface of the same CNTCS specimen. The testing equipment consists of a servo-controlled pneumatic universal testing machine (IPC Global UTM-14P) with 14 kN load capacity, equipped with an environmental chamber to control for a constant temperature. The sensing specimen is precompressed at 1 kN, and subjected to a harmonic load with frequency increasing in discrete steps from 0.25 to 15 Hz. The upper bound of this investigated frequency range is dictated by the technical characteristics of the testing machine capabilities. Nevertheless, the experiment covers a range in which natural frequencies of civil engineering structures typically lie. Considering the values of the applied axial load, the CNTCS-SEC specimen remains in the linear elastic range of deformation during the experiment.
The output from the CNCTS is measured using a high speed digital multimeter (National Instruments (NI) PXI-4071) installed into a NI PXIe-1073 (figure 6(e)). This also hosts a source measure unit, model NI PXI-4130, providing stabilized potential difference to the CNTCS in a single isolated channel. The measurement is performed by providing a voltage input of 2 V and measuring current intensity output by the CNTCS through the multimeter at a sampling rate of 1000 Hz. The capacitance from the SEC is measured at 390 Hz using an ACAM PCAP01 DAQ system (figure 6(d)). For the dynamic characterization, data are unfiltered in frequency, time drift in the output of the CNTCS is corrected through subtraction of an interpolating polynomial of order 10 and that in the SEC's output through a linear detrend. Figure 6(a) shows the CNTCS-SEC specimen installed in the testing machine.
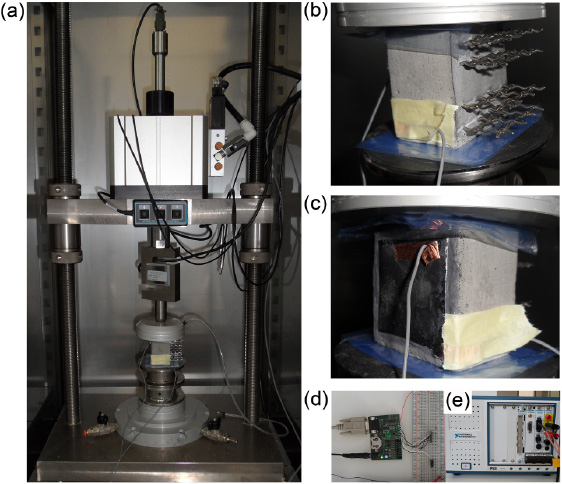
Figure 6. Test setup for the dynamic validation: (a) uniaxial test machine with CNTCS-SEC specimen; (b) detailed view of the tested CNTCS; (c) detailed view of the SEC adhered onto the surface of the CNTCS; (d) detailed view of the DAQ system for the SEC; (e) detailed view of the DAQ system for the CNTCS.
Download figure:
Standard image High-resolution image3.2. Experiment on full-scale concrete beam
The capacity of the sensors to detect natural frequencies is studied on a reinforced concrete beam whose first natural frequencies in both the vertical and lateral axes lie below 40 Hz. This test also provides an extension on the frequency range investigated in the previous experiment. The RC beam has dimensions of 200 × 300 × 4000 mm3, and is equipped with two steel plates partially embedded at its extremities prior to casting serving as vertical supports. The plates are inserted into steel supports to allow end rotation in the vertical plane while fixing rotation in the horizontal plane. Assuming a material density of 2500 kg m−3 and a Young modulus equal to 30000 N mm−2 results in analytical fundamental frequencies of 25.2 Hz along the strong bending axis with simply supported boundary conditions, and 38.1 Hz along the weak axis with fixed boundary conditions. Vertical and horizontal vibration modes of the beam are benchmarked against results obtained using seven equally spaced seismic accelerometers that can be mounted in either vertical or in horizontal directions. The accelerometers (PCB393C, 1 V g−1 sensitivity with ± 2.5 g measurement range) are attached through permanent magnets onto 40 × 40 × 8 mm3 steel plates that are glued onto the beam. The accelerometers are wired to the central unit by means of short coaxial cables.
The beam is excited with an impulse hammer (PCB 086D20C41) equipped with a force sensor (ICP quartz 0.23 mV N−1 sensitivity and ±22240 N measurement range). The outputs of accelerometers and the hammer are acquired through an eight-channel data acquisition module, model PXIe-4492 (24-bit resolution with anti-aliasing filters), also installed in the PXIe-1073 hosting the power and DAQ modules of the CNTCS. All data are acquired over 420 s. Data sampling rates and sampling durations are beyond the Nyquist sampling rate and significantly larger than the first structural periods, respectively, which allows accurate frequency identification.
The output of the CNTCS is sampled at 1000 Hz, and a high-pass filter with a cut-off frequency of 7.5 Hz is applied to eliminate the polarization effects (see section 2.1). The output of the SEC is sampled at 440 Hz and a similar filter is used with a cut-off frequency of 2 Hz. Given the high noise level in the DAQ system allocated to the SEC, other filtering methods could be used for better frequency localization, as shown in [38]. The authors preferred to use the simple high-pass filter to enable a cleaner comparison.
The CNTCS is attached onto the top surface of the RC beam by means of two L-shaped steel elements, each one connected to the RC beam by means of four plugs. These connections are placed at the quarter-span of the beam. A screw permits the application of an initial prestress to the CNTCS that is manually adjusted and controlled through a load cell with a digital display. This initial pressure is to simulate an embedment of the CNTCS while providing a practical means to access the sensor's electrodes at any time for experimental purposes. Electrical isolation of the CNTCS from the RC beam connection devices is achieved using plastic sheets. A SEC of dimensions 70 × 70 × 0.45 mm3 is glued onto the top surface of the RC beam at the same location of the CNTCS.
Figure 7 shows the laboratory setup for the full-scale RC beam.

Figure 7. Test setup for the full-scale RC beam: (a) sensor layout with dimensions in cm; (b) detailed view of the CNTCS mounted on the beam; and (c) detailed view of the SEC glued onto the surface of the beam.
Download figure:
Standard image High-resolution image4. Experimental results
4.1. Dynamic characterization
The experimental study is initiated with the dynamic characterization of both sensors. Both specimens are subjected to a harmonic load varying between 0.25 and 15 Hz with discrete increments. Figure 8 shows the sensors' responses over the range 0.25–4 Hz. Both sensors exhibit a drift in the time domain that can be due to electrical charges in the sensor (see section 2.1). Figure 9 is a plot of the variation in the sensors' signals in the function of strain, where strain is normalized by its maximum value Δ max, and the sensors' outputs are normalized by their maxima ΔRmax and ΔCmax for the CNTCS and SEC, respectively. Data from figure 9 are taken from the range 0.25–0.5 Hz with a load amplitude from 0.5 to 1.5 kN. Results confirm the nonlinearity of equation (1), with increasing the sensor's sensitivity in compression, and the linearity of the SEC strain–signal model (equation (5)).

Figure 8. Sensors' responses: (a) applied load; (b) CNTCS; (c) SEC.
Download figure:
Standard image High-resolution image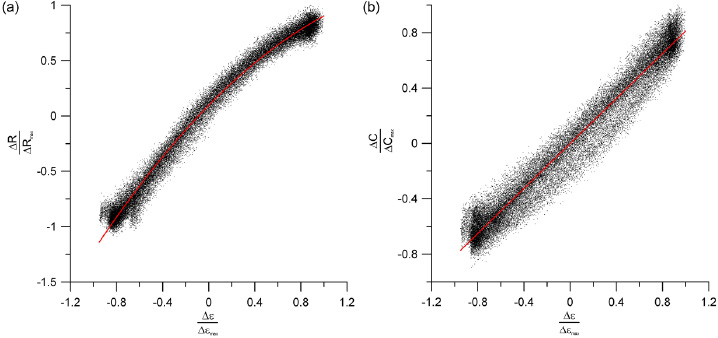
Figure 9. Normalized sensors' signal variations versus normalized strain: (a) CNTCS; (b) SEC.
Download figure:
Standard image High-resolution imageFigure 10 compares the frequency response function (FRF) of both sensors over the full range 0.25–15 Hz. The FRF plots were obtained by taking the ratio of the response over the excitation input in the frequency domain. FRFs are normalized to the values obtained at the higher frequency of investigation, equal to 15 Hz. The monotonically increasing frequency response of the CNTCS shows that the sensor tends to an ideal linear behavior at higher frequencies. This is explained by the strain-rate dependency of the fractional change in resistance observed in cement-based nanocomposites [15]. The monotonically decreasing frequency response of the SEC is explained by the strain-rate dependency of the SEBS [39], as well as an adiabatic heating effect that causes a softening of the bonds [40]. This frequency dependence for both sensors represents a limitation in the sensing solutions, which can be overcome by the incorporation of a strain-rate-dependent model in the electromechanical models. Nevertheless, this limitation is inconsequential in modal identification applications.

Figure 10. Normalized frequency response functions: (a) CNTCS; (b) SEC.
Download figure:
Standard image High-resolution imageFigures 11 and 12 show the wavelet transforms for each of the sensors. The wavelet transform uses Morlet wavelets on three sections of the original signal extracted using a Tukey windowing function to reduce frequency leakage. The wavelet coefficients are normalized over each time bin. The black dotted line in figures 11 and 12 represents the frequency input, ramping from 0.25 to 15 Hz.
Results from the wavelet transform show that both sensors can track the excitation frequency of the 0.25–15 Hz range. However, the SEC has significantly more noise than the CNTCS. This additional noise is due to limitations in the DAQ system. While the CNTCS uses a mature technology to measure resistance, the off-the-shelf DAQ system used to measure capacitance is yet to reach a similar level of precision. An electronic circuitry dedicated to measuring very small changes in capacitance is currently being developed by the authors.

Figure 11. Wavelet transform for the CNTCS signal: (a) 0.25–4 Hz; (b) 5–11 Hz; (c) 12–15 Hz. The black dotted line is the frequency input.
Download figure:
Standard image High-resolution image
Figure 12. Wavelet transform for the SEC signal: (a) 0.25–4 Hz; (b) 5–11 Hz; (c) 12–15 Hz. The black dotted line is the frequency input.
Download figure:
Standard image High-resolution image4.2. Experiment on a full-scale concrete beam
Both sensing methods are compared for dynamic monitoring of a full-scale RC beam. Modal information is extracted by means of the classic frequency domain decomposition (FDD) method. FDD is based on the evaluation of the matrix of cross-spectral densities of the output data G(f), where f denotes the frequency. The diagonal terms in G(f) are the (real valued) auto-spectral densities, while the other terms are the (complex) cross-spectral densities. The matrix is computed by using the modified periodogram method that consists of averaging the spectra by subdividing the recorded signals into windows and overlapping frames containing 2n points. The frequency resolution is thus equal to fs/2n+1, where fs is the sampling frequency. To extract modal parameter estimates, the matrix G(f) is decomposed through singular value decomposition at discrete frequencies. Under the hypothesis that the input is a white noise and that damping is low, natural frequencies are identified as those that correspond to the peaks of the curves representing the singular values of G(f). Mode shapes are approximated by taking the corresponding singular vectors.
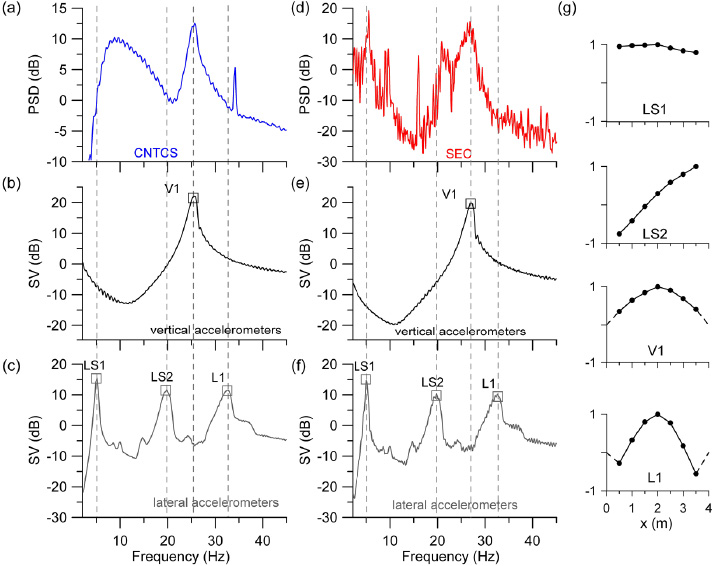
Simultaneous testing of the SEC and accelerometers, as well as simultaneous testing of the CNTCS and accelerometers, were carried out at the beginning of June and at the beginning of July 2013, respectively. Results from the FDD applied to acceleration signals (first singular value lines of the spectral matrices of the measurements) are shown in figure 13. Four natural modes of vibration are identified in the range between 0 and 40 Hz. These modes include the fundamental vertical mode, denoted as mode V1 at 26.0 Hz, and the fundamental lateral mode, denoted as mode L1, at 32.7 Hz. Variation of the frequency of mode V1 from 27.1 Hz to 25.6 was observed over one month, which can be explained by an increase in temperature in the laboratory. The identified natural frequencies of modes V1 and L1 well agree with analytical predictions. Also, their estimated mode shapes, plotted in figure 13, resemble the analytical modes for simply supported (V1) and fixed–fixed (L1) elastic beams. In addition to these two expected modes, two more lateral modes are identified at 5.1 Hz and 19.8 Hz and are denoted as mode LS1 and LS2, respectively. By comparing their shapes, it can be concluded that these modes are originated by the rolling motions of the supports over the base. In mode LS1, the supports move in phase. In mode LS2, the supports move out of phase. These motions were also visually observed during testing on site.
In figure 13, the power spectral densities (PSDs) of the data recorded from the CNTCS and SEC are shown and compared against the results obtained from acceleration data acquired simultaneously. These results show that the leading peak, corresponding to mode V1, is quite evident and precisely identified in the output spectra of both the CNTCS and the SEC. Some peaks related to lateral modes are also visible in both sensors' output spectra, which is explained by their multi-directional sensing capabilities. The peak of mode LS1 is evident in the case of the SEC, and mode LS2 appears to be identified, but with a shift in the frequency. In the case of the CNTCS, while the peak of mode LS1 is not visible, probably because it is hidden by the energy of the signal at low frequencies associated with electrical polarization of the sensor, a second peak is visible which seems to be associated with mode L1, but also with a shift in the frequency. The PSD of the SEC shows additional peaks around 10 and 16 Hz, which can be associated with a local damage, as smaller peaks are observable in the accelerometer's data.
Figure 13. FDD results: (a) PSD of CNTCS's output; (b) first SV line of vertical acceleration data acquired simultaneously to CNTCS's output; (c) first SV line of lateral acceleration data acquired simultaneously to CNTCS's output; (d) PSD of SEC's output; (e) first SV line of vertical acceleration data acquired simultaneously to SEC's output; (f) first SV line of lateral acceleration data acquired simultaneously to SEC's output; (g) mode shapes identified form acceleration data.
Download figure:
Standard image High-resolution image
5. Conclusions
Two novel solutions for strain sensing using nanocomposite materials recently proposed by the authors have been further studied by investigating their potential at dynamic monitoring of civil structures. Both technologies are aimed at providing affordable solutions for monitoring local strain in large-scale structures, but are different in terms of applications and physical principles. The CNTCS is embeddable in concrete structures because it is fabricated from a cement-based material and can transduce variations in axial strain in variations of electrical resistance. The SEC has been developed to be a surface sensor, and can be used in a matrix form to create an external sensing skin. It can transduce variations in axial strain in variations in electrical capacitance. The main conclusions of this study are as follows.
- Dynamic characterization of CNTCS and SEC using a uniaxial test machine has shown that both sensors are capable of closely tracking excitation frequencies in the range of 0.25–15 Hz.
- The normalized calibration curves of both sensors have been obtained in the uniaxial test. While the CNTCS behaves as a slightly nonlinear transducer, with a sensitivity that increases in compression, the SEC exhibits a linear signal–strain relationship that agrees well with its theoretical electromechanical model.
- Frequency response curves of CNTCS and SEC have been obtained with dynamic compression tests. The curves show that the outputs of both sensors are rate dependent. In particular, the frequency response curve of the CNTCS is monotonically increasing with the frequency while that of the SEC is monotonically decreasing with the frequency. Both sensors seem to tend to an ideal linear dynamic behavior, with constant frequency response curves, at large frequencies.
- The pioneering application of the two novel sensing technologies in vibration monitoring of a RC beam has demonstrated their ability to clearly detect the frequency of the fundamental vibration mode at about 26 Hz, independently identified using data recorded from off-the-shelf accelerometers. Lower lateral modes have been identified by the SEC, while a higher lateral mode has been identified by the CNTCS.
The results presented in this paper show a promise toward the use of the nanocomposite technologies in vibration-based structural health monitoring systems, providing a solution to the meso-scale challenge in SHM of civil structures, such as tall buildings, bridges, road pavements and more.
Acknowledgments
This work is partly supported by the Iowa State University Council on International Programs, grant 1001062565 from the Iowa Alliance for Wind Innovation and Novel Development (IAWIND), and grant 13-02 from the Iowa Energy Center; their support is gratefully acknowledged.
The authors are also grateful for the support provided to this research by the Materials Science and Technology Group of the University of Perugia, coordinated by Professor José M Kenny, for the sharing of their knowledge and expertise, and for providing materials and equipment for the preparation and analysis of CNTCS. A particular appreciation goes to Marco Monti, Maurizio Natali and Marco Rallini, from the same Research Group, who participated in the development of the CNTCS and in related physical and chemical investigations.