
Abstract
A new parametrization of the widely used Stillinger–Weber potential is proposed for silicon, allowing for an improved modelling of defects and plasticity-related properties. The performance of the new potential is compared to the original version, as well as to another parametrization (Vink et al 2001 J. Non-Cryst. Solids, 282 248), in the case of several situations: point defects and dislocation core stability, threshold displacement energies, bulk shear, generalized stacking fault energy surfaces, fracture, melting temperature, amorphous structure, and crystalline phase stability. A significant improvement is obtained in the case of dislocation cores, bulk behaviour under high shear stress, the amorphous structure, and computation of threshold displacement energies, while most of the features of the original version (elastic constants, point defects) are retained. However, despite a slight improvement, a complex process like fracture remains difficult to model.
Export citation and abstract BibTeX RIS
1. Introduction
Atomistic numerical simulations in materials science can be roughly classified into two categories, depending on whether the interactions between atoms are obtained by taking into account the underlying electronic structure (quantum mechanics methods) or are instead computed from analytical or numerical empirical schemes as with classical potentials. The first option is fundamentally better, since it allows for usually accurate and trustworthy results, but it is also the more demanding in terms of computational resources, which translates into drastic limitations regarding the size of the considered systems. For instance, standard density functional theory calculations are typically restricted to several hundreds of atoms. Also, simulations of system evolution can hardly be performed for durations much longer than a few tens of picoseconds. The second option is then attractive, since the cost of empirical interatomic potential calculations is typically much smaller, which allows for long simulations or systems including millions of atoms. Nevertheless, in order to get high quality results, potentials that are accurate and especially transferable, i.e. able to describe configurations and mechanisms not included in the potential fitting database, are required.
Such a goal is difficult to reach in the case of covalent materials like silicon. In fact, the directional character of covalent bonds as well as their strong dependence on the atomic environment make a simple pair potential modelling a total failure. Several approaches have been proposed to tackle this issue. Here we recall only the resulting potentials which have been intensively used in previous works. In a pioneering study, Keating proposed an interatomic potential built on elasticity considerations, allowing for a correct description of weakly strained silicon crystals [1]. Two decades later, Stillinger and Weber (SW) developed another including two-body and three-body contributions for modelling solid and liquid silicon [2]. A bond-order potential was then proposed by Tersoff, especially aiming at an improved description of crystalline defects [3]. At the same time, the embedded atom model (EAM), highly successful for metals, was modified in order to take into account the strong angular dependence of covalent bonds [4], with different possible parametrizations [5–7]. A decade later, Bazant and co-workers developed the environment-dependent interatomic potential (EDIP) combining strengths of the Tersoff and SW approaches [8]. Due to the importance of silicon in applications and as a model for covalent materials, there are many other available potentials, but the few examples listed above are surely among the most used nowadays. Several investigations have been made for determining the pros and cons of some of these potentials [9–12], from which it can be concluded that none of them is clearly better than the others in all respects. Note that the recent ReaxFF method could possibly be a superior semi-empirical approach for describing silicon [13], but to our knowledge it has not been extensively tested, especially regarding defects and plasticity.
Although it was proposed almost 30 years ago, the SW potential is still in wide use nowadays. This unceasing interest is both the cause and the consequence of its success. In fact, this potential has been employed for investigating many different situations involving silicon, and a large database is available. The SW potential has then become a reference interatomic potential. Another explanation comes from its simple functional form, involving a small number of parameters compared to newer potentials. This has been suggested as a possible cause for its smooth behaviour in the case of highly strained silicon [14], since complicated functionals are more prone to spurious behaviours for configurations far from equilibrium. Also, this leads to very fast force evaluations compared to more complicated potentials. Finally, despite its simplicity and the fact that it has been originally designed for describing the transition between solid and liquid silicon [2], it tends to perform successfully in many situations. Nevertheless, several situations are not well described with the SW potential. In particular, known failures regarding defects and mechanical properties are the modelling of dislocation core structure [15, 16], the brittle-ductile transition in nanowires [17, 18], and the propagation of cracks. Amorphous silicon models generated with the SW potential tend to be too dense, with an incorrect concentration of overcoordinated atoms [19, 20]. There have been few attempts to improve the behaviour of the SW potential in specific situations. For instance, Holland and Marder found that a substantial strengthening of the three-body interactions was required to obtain a crack propagation in qualitative agreement with experiments [21]. The same procedure has also been shown to lead to a much better description of structural properties of amorphous silicon [20, 22]. However, the modification of only one or two parameters also degrades the potential ability to describe other silicon characteristics, as will be shown in the following. Only by a refitting of all parameters could one hope to improve the potential transferability while retaining the good properties of the original parameters set. To our knowledge, this has been done only once by Jian and co-workers [23], however with the introduction of an additional parameter. A better description of phonon dispersion is obtained with this potential, but it is likely that the strong weakening of three-body interactions does not allow for a good description of highly distorted configurations such as those with defects.
In this work, we aimed at improving the ability of the SW potential for describing defects and plastic properties of silicon, while retaining as far as possible the transferability that made the success of the original version. Hence, a new parametrization of the SW potential is proposed that corrects several shortcomings. We tested this new version in several possible situations, together with the one suggested by Vink and co-workers [22] (called VBWM thereafter), which is also an interesting alternative. In the following sections, we discuss the structure of the original SW potential, and describe the new set of parameters. Then the results obtained for point defects, threshold displacement energies, dislocations, behaviour under shear stress, generalized stacking fault energy surfaces, fracture, phase stability, melting temperature, and amorphous structure are successively described.
2. The SW potential
2.1. Analysis
With the SW potential [2], the total energy E is obtained as a combination of two-body and three-body interactions:
The two- and three-body ϕ functions are

The choice of the two-body function is not really justified in the original paper from Stillinger and Weber, only that its derivatives exhibit no discontinuities at the cutoff a [2]. The latter is also true for the three-body function, which is built in such a way that it is positive and vanishes for a perfect cubic diamond crystal when bond angles are equal to the tetrahedral angle defined as cosθ = 1/3. ε and σ are energy and distance scaling parameters, respectively, which set the cohesive energy and lattice constant of the cubic diamond silicon. The other remaining parameters, A,B,p,q,λ and γ, allow us to tune two-body and three-body interactions as a function of interatomic distances and angles.
Since the three-body interactions cancel for the perfect crystal, properties conserving the cubic diamond lattice do not depend on the value of λ and γ. This is the case for the bulk modulus, in addition to the cohesive energy and the lattice constant. This also allows for increasing or decreasing the strength of three-body interactions (typically by changing λ) with respect to two-body interactions, without altering the cubic diamond ground state. This property has been exploited to improve the fracture behaviour [21], and to investigate how the strength of the three-body interactions is related to the plasticity of amorphous silicon [20]. Overall, it seems that increasing λ leads to better results regarding several properties related to fracture [21] and amorphous systems [19, 20]. However, the excess energy of any system with respect to the perfect cubic diamond crystal, such as the formation energy of defects, is linearly proportional to λ. This has obvious consequences, for instance increasing λ from 21 to 42 (all other parameters being kept constant), as in the work of Holland and Marder [21], implies that all excess energies will be twice the original SW potential.
2.2. New set of parameters
The original set of parameters is reported in table 1, along with the parameters set from Vink and co-workers [22] and the one proposed in this work (SWm). The latter has been obtained after a thorough analysis of the influence of λ on many properties such as the stability of point and extended defects, and an analysis of the previous investigations mentioned above [21, 22]. We found that λ should be greater than or equal to 31 in order to obtain the correct energy ordering of dislocation configurations [15, 16, 24]. At the same time, λ should be kept as low as possible to minimize the increase of excess energies. Then we set λ = 31 before optimization. We also kept the dimensionless cutoff parameter a equal to its original value. The remaining parameters for SWm are obtained using a least-square fitting algorithm and a database including elastic constants and the formation energies of silicon interstitials and a monovacancy. We also determined the scaling parameters ε and σ in order to recover the experimental cohesive energy and lattice constant of cubic diamond silicon. We first tried to keep the original exponent values p = 4 and q = 0, which are computationally very convenient. Nevertheless, it was not possible to obtain a good agreement in that case, and this constraint was lifted. Finally, the best results were obtained for the set of parameters SWm reported in table 1.
Table 1. Parameters for the original SW potential [2], the VBWM potential [22], and the new set SWm proposed in this work.
| ε (eV) | σ (Å) | a | λ | γ | A | B | p | q | |
|---|---|---|---|---|---|---|---|---|---|
| SW | 2.1683 | 2.0951 | 1.80 | 21.0 | 1.20 | 7.049 556 277 | 0.602 224 5584 | 4.0 | 0.0 |
| VBWM | 1.64 833 | 2.0951 | 1.80 | 31.5 | 1.20 | 7.049 556 277 | 0.602 224 5584 | 4.0 | 0.0 |
| SWm | 1.041 90 | 2.128 117 | 1.80 | 31.0 | 1.10 | 19.0 | 0.65 | 3.5 | 0.5 |
In table 2, the results of basic properties computed with the original SW, SWm and VBWM potentials are shown. The experimental lattice constant is obtained for all sets. Regarding the cohesive energy for the original SW potential, it is slightly higher than the reference data, since ε has been fitted to reproduce the melting temperature of the crystal in that case [2]. An even higher value is obtained with the VBWM set, due to the low value of ε. Instead, our potential yields the correct cohesive energy by construction. Elastic constants are obtained in fair agreement with experiments for the SW and SWm potentials, although C12 is too high and C44 is too low. In the case of the VBWM potential, the computed elastic constants are all quite low, leading to a silicon crystal softer than expected.
Table 2. Cohesive energy, lattice constant, and elastic constants for the cubic diamond silicon, from experiments [25, 26], DFT-LDA [15], and for the three considered potentials.
| E0 (eV/atom) | a0 (Å) | B (GPa) | C11 (GPa) | C12 (GPa) | C44 (GPa) | |
|---|---|---|---|---|---|---|
| Refs. [25, 26] | −4.63 | 5.43 | 99 | 166 | 64 | 80 |
| DFT-LDA [15] | 5.406 | 99 | 164 | 66 | 78 | |
| SW | −4.337 | 5.431 | 100 | 151 | 75 | 56 |
| VBWM | −3.297 | 5.431 | 77 | 133 | 48 | 57 |
| SWm | −4.630 | 5.431 | 105 | 156 | 80 | 58 |
3. Point defects
3.1. Stability
The three potentials have then been tested for reproducing the formation energies of the following point defects: mono- and di-vacancy, and the most stable configurations of the self-interstitial. For the reference values, we considered experiments or state of the art calculations when the former are nonavailable. The results are reported in table 3. In the case of vacancies, the best agreement is obtained for the SWm and VBWM potentials, while the original SW potential yields too low formation energies. For self-interstitials, I〈110〉 is found as the most stable configuration by all potentials, in agreement with recent quantum Monte Carlo (QMC) calculations [32]. However, in these calculations, all self-interstitial configurations appear almost degenerate, which is not the case here with an energy range of about 2 eV for all potentials. The best result is obtained for the original SW, followed by SWm. The VBWM potential yields the highest formation energies, due to the fast increase of the excess energy as a function of λ.
Table 3. Formation energies (eV) of different point defects: monovacancy V, di-vacancy V2, four-fold coordinated defect or bond defect FFCD/BD, and different interstitial configurations, tetrahedral T, hexagonal H, and I〈110〉 split.
| V | V2 | FFCD/BD | T | H | I〈110〉 | |
|---|---|---|---|---|---|---|
| Ref. | 3.6 [27] | 5.01 [28] | 2.7 ± 0.3 [29–31] | 5.05 [32] | 5.13 [32] | 4.94 [32] |
| SW | 2.66 | 4.60 | 2.94 | 4.95 | 6.55 | 4.43 |
| VBWM | 3.19 | 4.98 | 3.36 | 7.96 | 8.52 | 6.51 |
| SWm | 3.27 | 5.19 | 3.41 | 6.76 | 7.60 | 5.92 |
3.2. Threshold displacement energies
An important quantity in the context of irradiation is the threshold displacement energy (TDE), which is the minimum kinetic energy to be transferred to a lattice atom for displacing it from its original site to a new metastable defect position. It allows us to quantify the lattice resistance to the creation of point defects, and is a required input for large-scale calculations of damage during irradiation. TDE is a highly anisotropic quantity in covalent materials, and a well-constructed average can be used [31]. Although the determination of TDE is computationally intensive, accurate first-principles calculations have been recently achieved [31, 33, 34].
In table 4 are reported computed TDE values, averaged over 1000 uniformly randomly chosen lattice directions or corresponding to high symmetry orientations, determined using the different potentials considered here, and the reference values of Holmström et al [31]. Considering first the averaged data, the new potential proposed here clearly outperforms the original SW potential, yielding too low values, and the VBWM potential, yielding too high values. Regarding now specific directions, the most important one is 〈111〉(B), since it corresponds to the absolute minimum of possible TDE values, i.e. it is the direction of the easiest defect creation in the silicon lattice. It appears that all potentials lead to values greater than the first-principles reference, the best agreement being obtained for SWm and SW.
Table 4.
Threshold displacement energies (eV): average values for the creation of Frenkel pairs ( ), and for the creation of either Frenkel pairs or bond defects (
 ), as well as values along two high symmetry orientations (there are two values for 〈111〉 because the two possible directions are not equivalent in the cubic diamond structure).

|

|
〈100〉 | 〈111〉(A) | 〈111〉(B) | |
|---|---|---|---|---|---|
| Ref. [31] | 36.0 ± 2.0 | 24.0 ± 2.0 | 20.5 ± 1.5 | 14.5 ± 1.5 | 12.5 ± 1.5 |
| SW | 30.3 ± 0.3 | 20.6 ± 0.3 | 23.5 ± 0.5 | 20.5 ± 0.5 | 17.5 ± 0.5 |
| VBWM | 41.0 ± 0.4 | 27.4 ± 0.2 | 23.5 ± 0.5 | 26.5 ± 0.5 | 20.5 ± 0.5 |
| SWm | 37.7 ± 0.4 | 24.5 ± 0.2 | 22.5 ± 0.5 | 22.5 ± 0.5 | 17.5 ± 0.5 |
4. Plasticity
4.1. Dislocation stability
We now focus on the performance of the potentials for reproducing plasticity-related properties. We first determined the relative stability of the possible dislocation core configurations. This is a stringent test since interatomic potentials are usually hardly able to reproduce with accuracy the energies associated with the highly distorted core geometries. Table 5 shows the core energy differences for different dislocation cores for the different potentials and first-principles calculations [15, 35–39]. These have been obtained by relaxing a single dislocation using cylinder-like boundary conditions and a large system including 3360 atoms in order to avoid technical issues associated with small cells [40]. In a few cases, additional calculations using quadrupole dislocations and periodic boundary conditions were performed, with no noticeable changes.
Table 5. Energetics of different dislocations in silicon, in eV per Burgers vector. A/C2 and B/C2 are the energy differences between the screw core configuration A (B) and the most stable one C2 [35]. S1/G and S3/G are the energy differences between the 60° core configuration S1 (S3) and the most stable one G [36]. Erec is the core reconstruction energy of the 30° partial dislocation. Finally, DP/SP is the core energy difference between the double and simple period of the 90° partial dislocation [37].
| Screw | 60° | 30° | 90° | |||
|---|---|---|---|---|---|---|
| A/C2 | B/C2 | S1/G | S3/G | Erec | DP/SP | |
| Ref. | 0.54 [35] | →A [15] | →S3 [36] | 0.6 [36] | 0.9 ± 0.4 [38, 39] | ≃0 [37] |
| SW | 0.20 | 0.06 | −0.20 | −0.39 | 0.82 | 0.33 |
| VBWM | 0.27 | →A | 0.39 | 0.17 | 0.52 | 0.07 |
| SWm | 0.27 | →A | 0.21 | −0.21 | 0.83 | 0.05 |
The geometries of all stable dislocation cores are shown in figure 1. First, we focus on the non-dissociated screw dislocation, which is important for the low temperature plasticity of silicon [16, 41–46]. All potentials found the sessile core C2 (figure 1) as the most stable one, albeit with half energy differences compared to the first-principles reference. This core exhibits a double-period reconstruction along the dislocation line, seemingly close to the double-period DP core of the 90° partial dislocation. A, the second stable core, is slightly higher in energy. A known issue of the original SW potential is that the core B [47], unstable with first-principles calculations, is more stable than the shuffle core A [15, 48, 49]. With the new potential SWm and VBWM, the B core becomes unstable as in first-principles calculations.

Figure 1. Geometries of stable dislocation cores in silicon: A (a) and C2 (b) screw dislocation cores ({111} projection); G (c) and S3 (d) 60° dislocation cores ({110} projection); 30° (e), single-SP (f) and double-period DP (g) 90° partial dislocation cores ({111} projection).
Download figure:
Standard imageAnother important dislocation is at 60°, which is expected to be first nucleated during the relaxation of epitaxied thin films [50–53]. Recent investigations have revealed that the core S1, proposed in the pioneering work of Hornstra [54], was not stable, and that the most stable configuration was a sessile G core [36]. No potentials were able to reproduce the first result. For the second one, only the VBWM potential yields the right behaviour, since with both SW and SWm another sessile configuration, S3, corresponds to the lowest core energy. This last configuration is quite complex, but ensures the complete passivation of dangling bonds in the dislocation core, as for the G core.
Finally, we have investigated the energetics of 30° and 90° partial dislocations, which govern the plasticity of silicon at high temperatures [26]. The 30° is known to be reconstructed along the dislocation line, while it has been shown that two configurations, with either a single- (SP) or a double-period (DP) along the dislocation line, are quasidegenerate in energy for the 90° partial dislocation [40]. The SWm potential appears as the best candidate in that case, since it yields the correct reconstruction energy of the 30° partial dislocation, and the two possible core configurations for the 90° partial dislocation are quasidegenerate in energy, in excellent agreement with first-principles calculations.
4.2. Shear
Another criterion associated with an appropriate modelling of plasticity is the ability to reproduce the behaviour of silicon bulk under high shear stress. This property is, for instance, important for dislocation nucleation [50, 51]. It has been shown in earlier investigations that, despite some limitations, the original SW potential was one of the most efficient ones [14, 55]. In order to check the performance of the new SWm potential, the critical stress associated with the homogeneous shear of {111} planes has been computed for three high symmetry directions, taking into account the relaxation of the volume. The results are reported in table 6 for the three potentials, and compared to first-principles DFT-LDA calculations [56] made with the SIESTA code [57].
Table 6. Critical stresses (in GPa) for homogeneous shearing of {111} planes, along 〈110〉 and 〈112〉 (twinning and anti-twinning) directions, for all potentials and DFT-LDA.
| 〈110〉 | 〈112〉-T | 〈112〉-AT | |
|---|---|---|---|
| LDA | 8.5 | 7.6 | 12.5 |
| SW | 8.5 | 10.0 | 7.3 |
| VBWM | 10.4 | 10.0 | 11.9 |
| SWm | 10.6 | 10.4 | 12.5 |
For the easiest directions, 〈110〉 and 〈112〉-T, all potentials tend to slightly overestimate the critical shear stress, and the best quantitative agreement is obtained for the original SW potential. Unfortunately, it also favours an easy shearing along the 〈112〉-AT direction, which is clearly in discrepancy with DFT-LDA results. The correct behaviour, i.e. the lowest stress value for the 〈112〉-T direction followed by 〈110〉 and 〈112〉-AT, is recovered for the SWm and VBWM potentials. Overall, there is a qualitative improvement using the new parametrization SWm, or the VBWM potential, compared to the original SW.
4.3. Generalized stacking faults energy surfaces
Although they cannot be directly related to a real physical mechanism, generalized stacking faults (GSFs) energy surfaces [59] are often computed because they can be combined with Peierls–Nabarro models [60, 61] to predict dislocation core properties [62–64]. Their correct modelling is then a good criterion to determine the aptitude of a given potential for dislocation-related properties. The original SW potential has been shown to be well suited for calculating GSF energy surfaces in good agreement with more accurate calculations. In particular, the SW potential leads to smooth energy variations as in first-principles simulations, a feature which is not well reproduced by more recent potentials [14, 55].
Figure 2 represents the GSF energy curves along the two most important slip systems. The smooth aspect of the curves for the three potentials confirms that this characteristic is due to the simple analytical formulation of the SW potential [14]. For the shuffle 〈110〉{111}, the original SW potential clearly underestimates the energy variation. A clear improvement is obtained for both the SWm and VBWM potentials, although the computed maxima remain slightly lower than first-principles results. For the second slip system, all potentials overestimate the reference data. The best agreement is obtained with the VBWM potential, followed by the SW and SWm potentials. Overall, there is a bare gain in performance using the new SWm potential compared to the original parametrization, but it worth recalling that the latter is already superior to other potentials [14].
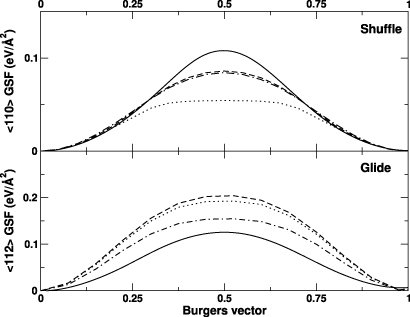
Figure 2. GSF energy curves for the shuffle 〈110〉{111} (top) and glide 〈112〉{111} (bottom) slip systems, computed for the SWm potential (dashed line), the original SW potential (dot-dashed line), and the VBWM potential (dotted line). The first-principles results obtained by Juan and Kaxiras [58] are reported for reference (full line).
Download figure:
Standard image4.4. Fracture
The ability of the different potentials to describe fracture has been studied by computing the propagation of ![$(1 1 1)[\bar {2}1 1]$](https://content.cld.iop.org/journals/0953-8984/25/5/055801/revision1/cm447526ieqn177.gif) cracks.
cracks.  is an easy cleavage system in silicon, for which fracture is stable in a wide range of energy release rates G (2 J m−2 ≤ G ≤ 16 J m−2) [65]. Cleaved surfaces are atomically flat with few defects which are predominantly steps with a specific symmetry [66]. In pure tensile mode and at low crack velocity (<800 m s−1), a systematic deviation from the original fracture plane is observed [67]. These experiments have been successfully reproduced by hybrid quantum/classical calculations [68], allowing for physical explanations of the observed behaviours [69, 70].
We describe here the procedure used since fracture simulations are not standard. Our set up consists in a quasi-2D system of 703 872 atoms with dimensions ≃138 nm along ![$[\bar {2}1 1]\times $](https://content.cld.iop.org/journals/0953-8984/25/5/055801/revision1/cm447526ieqn182.gif) , 132 nm along [111], and 0.7681 nm along
, 132 nm along [111], and 0.7681 nm along ![$[0 1\bar {1}]$](https://content.cld.iop.org/journals/0953-8984/25/5/055801/revision1/cm447526ieqn183.gif) . Periodic boundary conditions are applied along the last dimension. A
. Periodic boundary conditions are applied along the last dimension. A ![$(1 1 1)[\bar {2}1 1]$](https://content.cld.iop.org/journals/0953-8984/25/5/055801/revision1/cm447526ieqn184.gif) notch was introduced in the sample with an initial crack tip position at almost 1/3 of the total length. This system was successively loaded by an homogeneous rescaling of the coordinates in pure tensile mode (mode I), the load being conserved by fixing positions of atoms belonging to top and bottom planes in the [111] direction. Starting from an initial value of 1.8%, the tensile strain was increased in steps of 0.1%, alternating with atomic position relaxation using a damped molecular dynamics algorithm and a maximum force criterion of 3 × 10⁻⁴ eV Å−1. When crack tip instability occurred, a non-damped molecular dynamics was performed to monitor the crack propagation. With this procedure we do not aim to reproduce the experimental minimal energy release rate for fracture since our simulations include periodicity along the crack front, temperature close to 0 K, and short simulation times (≃15 ps). However, it allows for a rigorous comparison of fracture behaviour for the three potentials in the same conditions.
notch was introduced in the sample with an initial crack tip position at almost 1/3 of the total length. This system was successively loaded by an homogeneous rescaling of the coordinates in pure tensile mode (mode I), the load being conserved by fixing positions of atoms belonging to top and bottom planes in the [111] direction. Starting from an initial value of 1.8%, the tensile strain was increased in steps of 0.1%, alternating with atomic position relaxation using a damped molecular dynamics algorithm and a maximum force criterion of 3 × 10⁻⁴ eV Å−1. When crack tip instability occurred, a non-damped molecular dynamics was performed to monitor the crack propagation. With this procedure we do not aim to reproduce the experimental minimal energy release rate for fracture since our simulations include periodicity along the crack front, temperature close to 0 K, and short simulation times (≃15 ps). However, it allows for a rigorous comparison of fracture behaviour for the three potentials in the same conditions.
The SW potential required the largest load (4.10% ± 0.05% strain or energy release rate G = 17.35 J m−2 ± 0.45 J m−2) for crack propagation, due to an efficient spreading of stress at the crack tip following three successive reconstruction stages. The tip structure just before crack opening is characterized by the presence of heptagonal rings, forming elongated atomic chains along the [111] direction (figure 3(a)). The propagating crack quickly becomes highly disordered, with a rather round and amorphous tip structure and the eventual formation of atomic chains along the [111] direction. The cleaved surfaces are also highly disordered and far from being atomically flat (figure 3(d)).
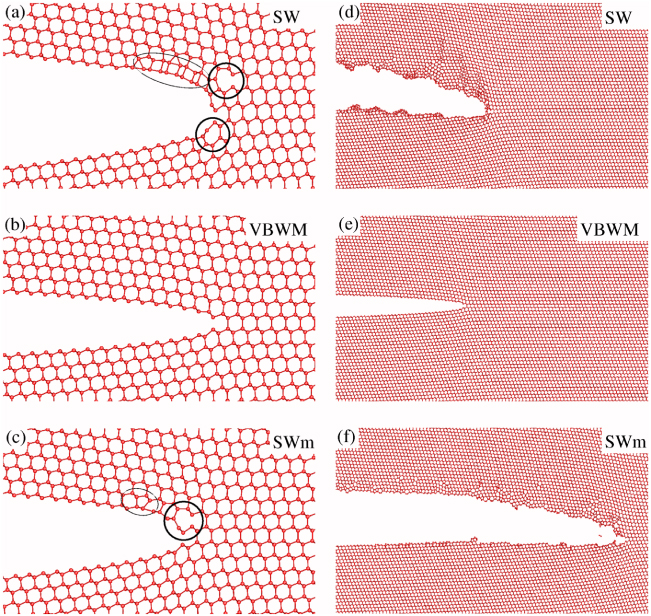
Figure 3. (a, b, c): atomic structures before crack propagation for the SW (G ≃ 17.35 J m−2), VBWM (G ≃ 4.40 J m−2), and SWm (G ≃ 14.40 J m−2) crack calculations respectively (mode I loading). Black curves on the figures highlight crack tip reconstructions with seven-member rings enclosed in bold curves. (d, e, f): dynamic crack tip structures after 12–15 ps of propagation for the SW, VBWM, and SWm potentials, with the same loadings as (a, b, c).
Download figure:
Standard imageA significantly different behaviour is obtained using the VBWM potential (figures 3(b), (e)). In that case, the crack tip starts to propagate when the loading strain is 2.15% ± 0.05% (or G = 4.40 J m−2 ± 0.2 J m−2). For lower values, no tip reconstructions occur, in disagreement with electronic structure calculations [69, 70]. Nonetheless, the crack propagation with this potential is fully brittle, leaving atomically flat surfaces. At higher loads (2.70% strain), one surface remains non-reconstructed whereas the other exhibits the alternating five-atom and seven-atom rings of the Pandey reconstruction [70].
Finally, using the SWm potential, we found that the crack tip reconstructs upon loading (figure 3(c)), but to a lesser extent than the SW potential, and leading to a structure quite similar to electronic structure results [69]. Crack tip propagation then occurs for a strain of 3.65% ± 0.05% (G = 14.40 J m−2 ± 0.45 J m−2). During the very first stages, a seemingly brittle fracture is obtained, with formation of Pandey-like reconstructions on one surface as in electronic calculations, and atomically flat cleaved surfaces. In this initial dynamic stage, some defects or reconstructions occasionally occur on one surface and among them some structures characteristic of the rotated Pandey reconstructions which were also observed with more precise simulation schemes. However, after 6–9 ps, the fracture process becomes increasingly less brittle, with the blunting of the crack tip and the formation of large defected zones including steps of several atomic planes (figure 3(f)).
The comparison of the three potentials reveals that there is a relation between the maximal load attained and the propagation behaviour of cracks. In fact, high strain values are required for the SW and SWm potentials, which results in a large strain energy released during crack propagation and the dynamical formation of many defects at the crack tip after a short time. Conversely, propagation is obtained for a much lower strain value in the case of the VBWM potential, allowing for a fully brittle crack propagation. Compared with experimental observations of cleaved surfaces, it appears that this potential is the more appropriate for describing crack propagation. Concerning the structure of the crack tip, electronic structure calculations revealed a specific crack tip reconstruction before propagation. This feature is best reproduced by the SWm potential, but missed by the VBWM potential. Then none of the tested potentials is completely satisfactory, which is hardly surprising given the complexity of the fracture mechanism.
5. Additional properties
We aim at improving the original SW potential for materials science investigations involving silicon in the solid state, with a specific focus on defects and plasticity. However, in numerical simulations, it is often required to know how a potential will behave in extreme conditions, such as high temperature or high pressure, far from its original fitting database. In the following, we report our investigations of several useful properties: the transition pressure of the cubic diamond →β-tin transformation, the melting temperature of the crystalline phase, as well as how appropriate the description of amorphous silicon with the three potentials is.
5.1. Stability of crystalline phases
It is known that the transition pressure needed to transform the cubic diamond structure to β-tin computed using DFT-LDA/GGA ranges from 7 to 9 GPa, i.e. lower than experimental values of 10–12 GPa [72, 73]. Conversely, transition pressures of 15–16 GPa are predicted by QMC techniques [71, 73]. The computed β-tin volume is about 15 Å3/atom with all approaches, the pressure discrepancy coming from the energy difference between the two phases (about 0.5 eV/atom for QMC and 0.25 eV/atom for DFT-LDA, see table 7) [71, 73].
Table 7. Energy differences (in eV/atom, relative to the cubic diamond phase) and structural parameters (lattice constant a in Å, and c/a ratio when applicable) for the β-tin, FCC, and BCC phases. Reference values correspond to electronic structure calculations [71, 72], either from QMC or density functional theory.
| β-tin | FCC | BCC | |||||
|---|---|---|---|---|---|---|---|
| ΔE | a | c/a | ΔE | a | ΔE | a | |
| Refs. [71, 72] | 0.19–0.45 | 4.81 | 0.552 | 0.57 | 3.89 | 0.53 | 3.42 |
| SW | 0.200 | 4.970 | 0.561 | 0.40 | 4.146 | 0.281 | 3.24 |
| VBWM | 0.642 | 4.937 | 0.61 | 0.976 | 4.257 | 0.871 | 3.332 |
| SWm | 0.539 | 4.950 | 0.589 | 1.155 | 4.226 | 0.935 | 3.313 |
With the original SW potential, the energy difference is comparable to the DFT-LDA result, but the volume is too large (obtained as a2c from values in table 7). The transition pressure (only roughly estimated here as the ratio between energy and volume differences) is likely to be in fair agreement with experiments. For the other potentials, the energy difference is much higher (due to the larger λ), close to the QMC results, but the computed volume is much larger, around 18 Å3/atom. Then the pressure transition will be much higher than in experiments, between 30 and 40 GPa. This is clearly a failure of these potentials which are not able to reproduce the compact metallic character of the high pressure phase. Nevertheless, it can be considered an advantage for plasticity-oriented simulations, where one wants to use high stresses (to speed up MD simulations), without triggering phase transition.
5.2. Melting temperature
The melting temperature was obtained by molecular dynamics calculations. We searched for the temperature at which the cubic diamond and the liquid phases coexist, i.e. the temperature at which the free energies of solid and liquid phases are equal. Our computations were performed at fixed volume, whereas they should ideally be performed at constant pressure. This may lead to a slight overestimation of the melting temperature.
We found a melting temperature of 1720 K for the original SW potential, in excellent agreement with the experimental value of 1687 K. This is not surprising since the ε parameter has been scaled to reproduce this property [2]. For the SWm potential, we found that the crystal was stable until 2610 K. Finally, an even higher value of 2850 K was determined using the VBWM potential. For both potentials, the high value of the λ parameter greatly enhances the stability of the cubic diamond phase compared to the liquid. It is similar to what we obtained for the high pressure phase transition.
Obviously, it is difficult to recommend using the SWm potential for solid–liquid transitions. Nevertheless, a too high melting temperature could be a blessing in disguise. In fact, computational limitations severely restrict the duration of molecular dynamics simulations, which often prevents the occurrence of thermally activated events. A common trick is to use temperatures higher than in experiments to increase occurrence probabilities, assuming that there are no mechanism changes as a function of temperature. A high melting temperature then allows us to do this trick, without the risk of melting the crystalline structure.
5.3. Amorphous structure
The ability of the SWm potential to describe the amorphous state of silicon has also been investigated. We have prepared an a-Si sample by using the following procedure: (1) crystalline silicon is melted at a temperature of 4500 K in the NVE ensemble; (2) after equilibration, the liquid state is quenched to 0 K in the NPT ensemble at a rate of 1011 K s−1, typical of laser experiments [19]; (3) finally a conjugate gradient minimization is performed while keeping the density constant. The radial distribution function (RDF) of the final system is reported in figure 4, and compared to measurements and results for the original SW and VBWM potentials. In the case of the SW potential, the RDF curve is characterized by a non-zero minimum between the first and second neighbour peaks, as well as an additional peak at approximately 3.3 Å. These features are not present in a-Si models obtained with both SWm and VBWM potentials, in agreement with experiments.
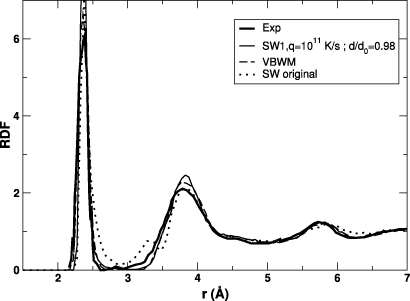
Figure 4. Radial distribution functions for the SWm potential (continuous thin line), the original SW potential (dotted line), the VBWM potential (dashed line, from [22]), as well as the measured line reported by Laaziri et al [74] (continuous thick line).
Download figure:
Standard imageThe a-Si sample obtained with SWm is characterized by an energy of 0.20 eV/atom relative to the crystalline phase. Measurements of enthalpy differences between amorphous and crystal silicon are about half this value [75, 76], but it has been recently shown that first-principles calculations were required to reach a better agreement between simulations and experiments [77]. Nevertheless, our computed energy difference is among the lowest reported in investigations using classical potentials [19, 78, 79].
It is also known that experimentally prepared a-Si samples are about 2% less dense than the crystalline phase [74, 75], a property which is not well reproduced by the original SW potential, which yields an a-Si sample more dense by 3%. Despite being specifically designed for a-Si modelling, the VBWM tends to produce an amorphous model with a density 6% lower than the crystal [22]. Using our modified potential, we found instead that our a-Si sample is 2% less dense, in excellent agreement with experiments.
Although a good description of the amorphous phase of silicon was not a primary goal during our investigations, it clearly appears that the SWm potential is well suited for this task. It corrects the spurious behaviour of the original SW potential, like VBWM, but in addition it also provides an a-Si model that is in excellent agreement with experiments regarding density and energy.
6. Conclusions
Our goal was to enhance the ability of the SW potential to describe extended defects and plastic properties of silicon. Our investigations confirmed that in order to improve the accuracy of the original SW potential in several situations, it is required to strengthen the three-body interactions by increasing λ. Unfortunately, with a higher λ comes an automatic increase of the excess energies for defects relative to the pristine system. This can be partially compensated by simply tuning the energy scale (as in the VBWM potential) or by a full refitting of all parameters (this work).
A qualitative assessment of the pros and cons of each potential is shown in table 8. Although it is obviously subjective, we believe it is a fair reflection of the results obtained in this work. Overall, the new potential SWm shows an improvement for several plasticity-related properties such as dislocation cores and bulk silicon under homogeneous shear stress. In particular, it cures some of the known failures of the original SW potential, such as an incorrect low energy configuration for screw dislocation and the wrong easiest shear mode. Compared to other common potentials like Tersoff or EDIP, the new potential is far superior for describing plasticity. In fact, it allows for a smooth behaviour even in situations far from equilibrium, such as dislocations in motion and highly strained crystals. At the same time, other silicon properties already fairly reproduced by the original SW potential, such as elastic constants and point defects energies, remain correctly described when using the new parametrization. Interestingly enough, the potential proposed here shows a significant improvement in the modelling of threshold displacement energies and of amorphous silicon. On the other side, phase transitions are not well described by the new potential, since very high temperature and pressure values are required for melting and β-tin transitions, respectively. This reduces the transferability of the SWm potential. However, as already discussed in previous sections, this can be beneficial in many situations because it allows us to use higher stress and temperature values in numerical simulations without triggering phase transitions. Thermally or stress-activated events could then be obtained more easily during molecular dynamics simulations.
Table 8. Assessment of the capability of the potentials considered in this work to model different silicon properties. Three stars count as an excellent agreement with experiments, two stars as a good one, one star as a fair one, while no star indicates a poor agreement.
| Property | SW | VBWM | SWm |
|---|---|---|---|
| Cohesive energy | ⋆⋆ | ⋆ | ⋆⋆⋆ |
| Elastic constants | ⋆⋆ | ⋆ | |
| Point defects | ⋆⋆ | ⋆ | ⋆⋆ |
| TDE | ⋆ | ⋆ | ⋆⋆ |
| Dislocations | ⋆ | ⋆⋆ | ⋆⋆ |
| Shear | ⋆⋆ | ⋆⋆⋆ | ⋆⋆⋆ |
| GSF | ⋆⋆ | ⋆⋆ | ⋆⋆ |
| Fracture | ⋆ | ⋆ | |
| Phase transition | ⋆⋆ | ⋆ | ⋆ |
| Melting temperature | ⋆⋆⋆ | ||
| Amorphous phase | ⋆ | ⋆⋆ | ⋆⋆⋆ |
While it shows some improvements compared to the original version, the capability of the new SWm potential to describe fracture still suffers from some caveats. In fact although crack tip reconstructions occurred in agreement with accurate electronic structure calculations, the crack propagation is not brittle enough compared to experiments probably because of the high load required. It is likely that the fracture process, involving dynamical breaking of bonds and surface reconstructions, is too complex to be fully reproduced using the simple analytical formulation of the SW potential.
Finally, we found that the VBWM potential, originally developed for modelling amorphous silicon, is also slightly better than the original SW potential regarding plasticity properties (but not for elastic constants). Also, it is equivalent to the SWm potential for phase transitions, and is less efficient in the case of point defects and threshold displacement energies. The main issue with this potential is probably the low value of the cohesive energy of the cubic diamond phase. This may have consequences in a few situations, such as sputtering simulations or for computing surface energies, for instance.
In conclusion, we propose a new parametrization of the SW potential which allows for an improved description of plasticity-related properties, while retaining most of the qualities of the original version for modelling point defects. In addition, the new potential provides a better modelling of threshold displacement energies and of disordered silicon. Besides, the fracture description is slightly enhanced, but not enough compared to experiments. It is likely that the complexity of the process cannot be captured by the too simple SW potential.