


Substantial increases globally over the last 40 years in the proportion of people who are overweight or obese have been partially attributed to larger portions of food being more readily available and more widely consumed( Reference Nielsen and Popkin 1 – Reference Young and Nestle 3 ). Reducing portion sizes, particularly for unhealthy foods, may thus be an effective way to decrease total energy intake at the population level( Reference Ledikwe, Ello-Martin and Rolls 4 , Reference Steenhuis and Vermeer 5 ). However, little is known about how to achieve this, and much of the research on portion sizes has focused on energy intake when a person is served food by a third party( Reference Rolls, Roe and Kral 6 – Reference Devitt and Mattes 9 ). The limited research on self-serve portions suggests people are poor at judging appropriate portion sizes( Reference Young and Nestle 10 ) and tend to serve larger portions than would be consistent with dietary guidelines( Reference Nielsen and Popkin 1 , Reference Smiciklas-Wright, Mitchell and Mickle 2 , Reference Bryant and Dundes 11 ).
Awareness of the adverse nutritional profiles of foods may prompt consumption of smaller portions. This is particularly important for unhealthy foods because reducing portion size can have a large effect on overall energy intake( Reference Ledikwe, Ello-Martin and Rolls 4 , Reference Livingstone and Pourshahidi 12 ). Front-of-pack (FOP) labels that offer a simplified summary of a food’s nutritional value are one way to provide this information. Consumers generally attend to FOP labels more than other sources of on-pack nutrition information( Reference Grunert, Wills and Fernández-Celemín 13 ) and FOP labels can increase the accuracy of product healthiness judgements( Reference Hersey, Wohlgenant and Arsenault 14 ).
FOP labels that provide nutrient-level information with little interpretation, such as the Daily Intake Guide (DIG), are reportedly difficult for consumers to interpret( Reference Watson, Kelly and Hector 15 – Reference Talati, Pettigrew and Kelly 17 ). Providing an interpretation of nutrient information (e.g. by using colours and/or text to indicate high, medium and low levels of nutrients, as seen in the Multiple Traffic Lights (MTL) system) increases understanding( Reference Antúnez, Giménez and Maiche 18 , Reference Roberto, Bragg and Schwartz 19 ), but can still require consumers to integrate multiple points of information( Reference Talati, Pettigrew and Kelly 17 ). Some FOP labels provide an interpretation of the overall nutritional value of a food via a graded summary system. For example, the Australian and New Zealand Health Star Rating (HSR), introduced in 2014, rates products on a scale from 0·5 to 5 stars and details the amounts of key nutrients per 100 g. FOP labels such as this may be easy for a wide range of consumers to understand since they offer information at a glance( Reference Hersey, Wohlgenant and Arsenault 14 , Reference Talati, Pettigrew and Kelly 17 ).
A recent review reported mixed findings from a number of studies examining whether the MTL, Guideline Daily Amount or labels containing only serving size information reduced, increased or did not affect consumption( Reference Brown, Rollo and Vlieger 20 ). Another recent study of young adults tested the effect of two label types (an energy-only label and the HSR) and found no significant differences in participants’ food selection behaviours( Reference Brown, Vlieger and de, Collins 21 ). More studies testing a wider range of FOP labels in more diverse samples are needed to assess whether FOP labels can influence portion sizes, particularly for unhealthy variants of commonly consumed foods. As such, the aim of the present study was to assess how FOP labels that differ according to interpretive content affect the portion size that is deemed appropriate for consumption of unhealthy foods. Previous research with Australian consumers has found that the HSR and the MTL are easier to understand than the DIG( Reference Talati, Pettigrew and Kelly 17 , Reference Talati, Pettigrew and Ball 22 ). It was hypothesised that, compared with no FOP label, smaller portions would be considered appropriate when more interpretive FOP labels (HSR and MTL) were applied to unhealthy foods while a less interpretive FOP label (the DIG) would not result in smaller portion sizes being considered appropriate.
Methods
The data analysed herein were collected as part of a larger study (n 2058) assessing adults’ and children’s perceptions of packaged foods. Various food packaging attributes for four product categories (pizza, yoghurt, cornflakes and cookies) were manipulated and fully crossed (to ensure no association between any of the independent variables( Reference Talati, Pettigrew and Dixon 23 )) and each participant was randomly presented with eight unique mock packages (from a suite of 576 that included healthy and unhealthy variants) to view and rate individually. The present paper reports on data relating to adults’ portion size judgements for the 192 unhealthy mock packages tested as part of the larger study. The focus on unhealthy products reflects the particular importance of portion size decisions for these types of products( Reference Ledikwe, Ello-Martin and Rolls 4 , Reference Livingstone and Pourshahidi 12 ). Ethics clearance was obtained from a university human research ethics committee.
Sample
An online survey was completed by Australian respondents recruited through an ISO-accredited web panel provider (PureProfile). Recruitment quotas were set relating to age, gender and postcode-based categories of socio-economic status, with respondents further screened to ensure they regularly consumed at least two of the four foods shown in the survey. The present paper reports findings for the 1505 adults who provided portion size estimates for unhealthy mock packages in the main study. These respondents had an equal gender split, a skew towards those from neighbourhoods of low socio-economic status (48 %) to reflect the higher level of diet-related conditions among this group( 24 , Reference Giskes, Avendano and Brug 25 ) and 16–17 % of the sample in each of the following age categories: 18–25 years, 26–35 years, 36–45 years, 46–55 years, 56–65 years, ≥66 years. Across all participants, the 192 mock packages showing unhealthy varieties of foods were rated a total of 4166 times.
Stimuli
The mock packages were created by a graphic designer to feature the DIG, the MTL, the HSR or no FOP label. The specific product categories were chosen because they tend to be frequently purchased( 26 ), exhibit large differences in healthiness( 27 ) and consumers often attend to the nutrition information on these foods( Reference Grunert, Wills and Fernández-Celemín 13 ). The nutritional profiles for the products were based on unhealthy versions available in the Australian marketplace. Figure 1 shows the FOP labels used on the mock packages and their nutrient profiles. The serving sizes listed in the DIG and MTL (the HSR does not specify serving size) were the same across these FOP labels within food type and were based on serving sizes commonly used by manufacturers of these foods.
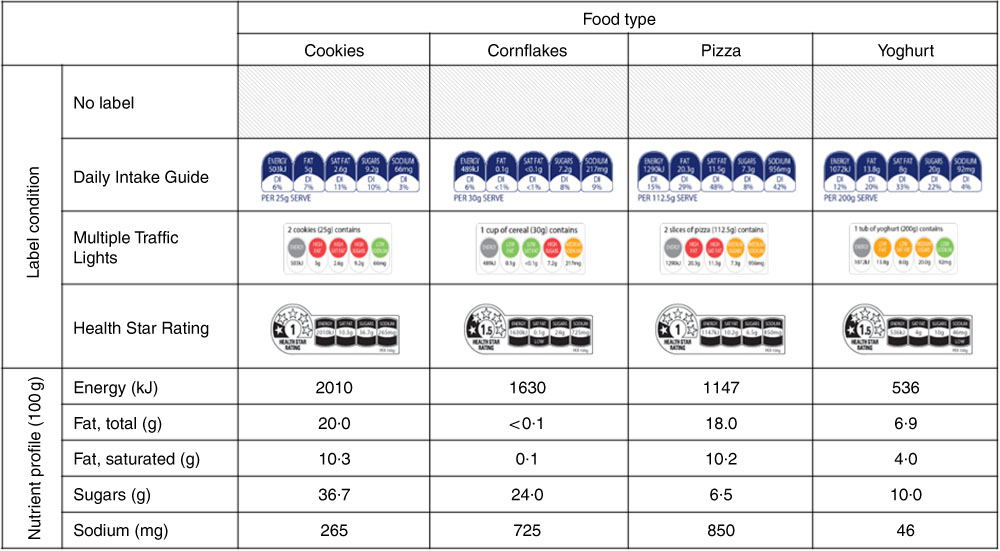
Fig. 1 (colour online) Front-of-pack (FOP) labels used on each food type, by label condition, in an online survey conducted among 1505 Australian adults to determine if FOP labels influence portion size judgements for unhealthy foods; data collected February–April 2016
Procedure
The survey began with demographic questions to assess respondents’ eligibility to participate based on the quotas. Respondents indicated the frequency with which they bought and consumed each food. They then rated the mock packages on various dimensions and could view the Nutrition Information Panel by clicking a link below the pack image. Immediately after viewing each package, respondents were shown a new screen with images of different portion sizes of the product sourced from an online image database( Reference Blechert, Meule and Busch 28 ) and asked ‘If you were going to eat this product, how much should you eat at one time?’. Text appeared below each image describing the portion size in grams accompanied by a graphic illustrating an intuitive measurement. For pizzas and cookies, eight options (depicting 1–8 slices of pizza and 1–8 cookies) were shown and scored from 1 to 8. For yoghurts and cornflakes, four options (depicting 100 g, 200 g, 300 g and 400 g servings and 15 g, 30 g, 45 g and 60 g servings, respectively) were shown and scored from 1 to 4. Fewer options were provided for yoghurt and cornflakes because they are amorphous foods( Reference Subar, Crafts and Zimmerman 29 ) with no defined shape or standard unit of measurement, and thus it is difficult to pictorially convey small graduations in portion size. In all instances, respondents could select a ‘no amount’ option of the serving size images if they thought the food should not be eaten at all.
Analyses
To ensure the results were relevant to those who would consume the product, data from respondents who indicated in the pre-screening that they never ate a particular food were excluded from analyses (7 % of all observations). Two-tailed χ 2 analyses were run comparing the frequency of ‘no amount’ responses in each FOP label condition with the no FOP label condition. The data set was then split according to food type and responses where a serving size greater than ‘no amount’ were chosen were analysed using linear mixed-effects models with FOP label condition as the fixed effect, respondent ID as the random effect, and age, gender, socio-economic status and BMI as covariates. These demographic variables were included as covariates (as per previous research)( Reference Hoefkens and Verbeke 30 – Reference Wong, Mendoza and Henson 34 ) to better understand the effects of FOP labels after demographics were taken into account. This was followed with planned comparisons of the DIG, MTL and HSR conditions with the no FOP label condition.
Results
There was a significantly smaller proportion of respondents indicating that no amount of the product should be eaten in the no FOP label condition (9 %) compared with the DIG (12 %, P=0·04), MTL (13 %, P=0·033) and HSR (15 %, P=0·001). Figure 2 presents the mean portion sizes perceived to be appropriate for each food type depending on the FOP label used. A small but significant main effect of FOP label on portion size was found for pizzas (F (3193·9)=2·80, P=0·041) and cornflakes (F (3336·6)=3·80, P=0·010). Significantly smaller portion sizes were selected when the HSR was present compared with no FOP label on pizzas (meanNoFOPlabel=2·64 slices, se NoFOPlabel=0·09 v. meanHSR=2·44 slices, se HSR=0·09 slices, P=0·013) and cornflakes (meanNoFOPlabel=198 g, se NoFOPlabel=5 g v. meanHSR=180 g, se HSR=5 g, P=0·001). The MTL only led to smaller portion sizes being selected for pizzas (meanNoFOPlabel=2·64 slices, se NoFOPlabel=0·09 slices v. meanMTL=2·36 slices, se MTL=0·10 slices, P=0·043) compared with no FOP label. Given that a 1-point difference in portion size on the scale was represented by 1 slice of pizza (645 kJ) and 15 g of cornflakes (244 kJ), the average differences reported above are equivalent to a decrease of 44–129 kJ per serving with the HSR (for cornflakes and pizzas respectively) and 181 kJ with the MTL (for pizzas). Across all foods, the portion sizes selected with a DIG present were not significantly different from those selected when no FOP label was present. No significant differences were found between the no FOP label and FOP label conditions for cookies or yoghurt.
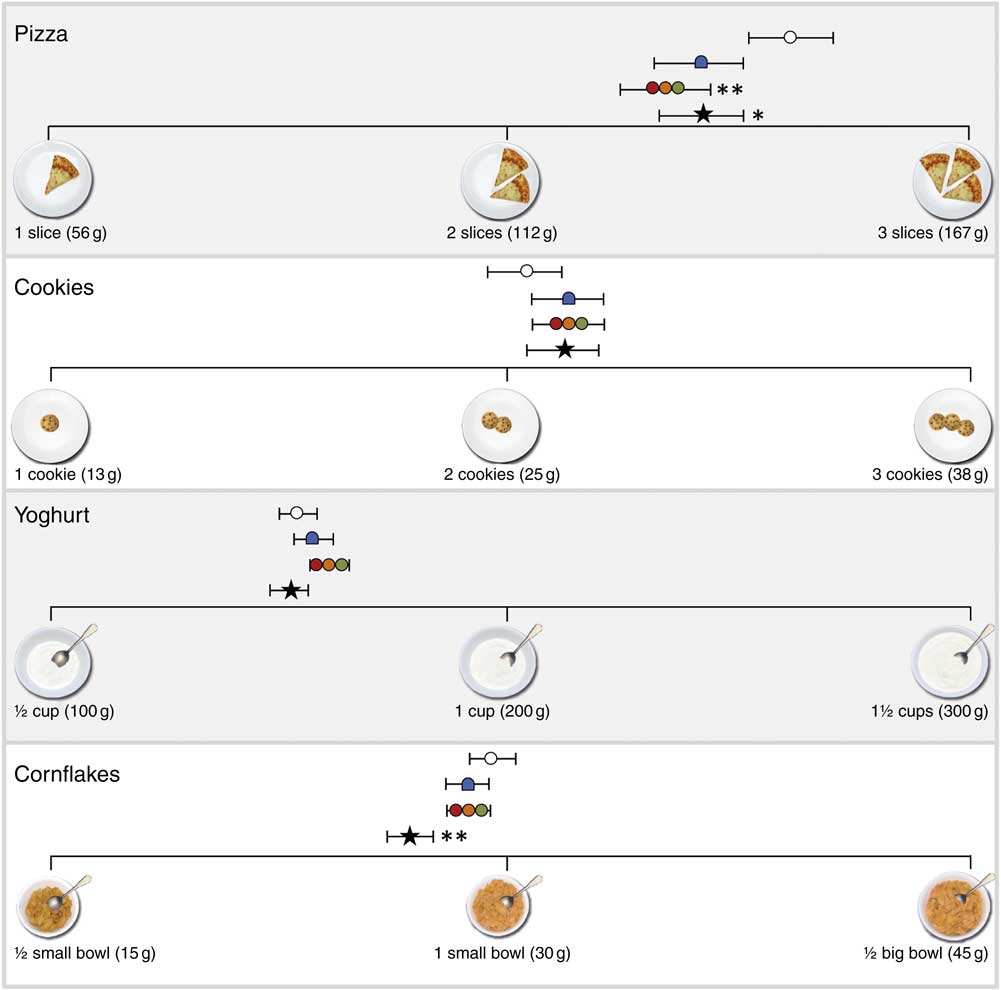
Fig. 2 Mean portion size perceived as appropriate for each individual food type, by front-of-pack (FOP) label condition (![]() , no FOP label;
, no FOP label; ![]() , Daily Intake Guide;
, Daily Intake Guide; ![]() , Multiple Traffic Lights;
, Multiple Traffic Lights; ![]() , Health Star Rating), in the online survey conducted among 1505 Australian adults to determine if FOP labels influence portion size judgements for unhealthy foods; data collected February–April 2016. Values are means with their standard errors represented by horizontal bars (4166 ratings across 192 mock packages). Note: the pizza and cookies data were scored on an 8-point scale while the yoghurt and cornflakes data were scored on a 4-point scale. Significant differences with respect to the no FOP label condition: *P<0·05 and **P<0·01
, Health Star Rating), in the online survey conducted among 1505 Australian adults to determine if FOP labels influence portion size judgements for unhealthy foods; data collected February–April 2016. Values are means with their standard errors represented by horizontal bars (4166 ratings across 192 mock packages). Note: the pizza and cookies data were scored on an 8-point scale while the yoghurt and cornflakes data were scored on a 4-point scale. Significant differences with respect to the no FOP label condition: *P<0·05 and **P<0·01
Discussion
Across all FOP label conditions tested in the present study, significantly more respondents indicated that they should consume no amount of the unhealthy products compared with the no FOP label condition. This suggests that consumers were more aware that the foods were unhealthy when the FOP labels were shown. Among those who did express a desire to consume some amount of the product, self-reported appropriate portion size estimates varied for some products (cornflakes and pizzas) across different FOP label conditions. Respondents may have attended more to the nutrition information when selecting the appropriate portion size for these foods. This outcome is consistent with past research showing that people are less likely to consult FOP labels on yoghurt and confectionery than ready meals and breakfast cereals( Reference Grunert, Wills and Fernández-Celemín 13 ) and can be reluctant to use FOP labels on discretionary products( Reference Talati, Pettigrew and Kelly 17 ).
Although respondents were more likely to report that they should eat no amount of unhealthy food across all FOP labels, this effect was stronger among the interpretive FOP labels (the HSR and MTL) and only these FOP labels resulted in smaller portion sizes being selected for some foods compared with the no FOP label condition. Difficulty interpreting the nutrient-level information in the DIG( Reference Hersey, Wohlgenant and Arsenault 14 , Reference Watson, Kelly and Hector 15 , Reference Talati, Pettigrew and Kelly 17 , Reference Pettigrew, Talati and Miller 35 ) may have hindered some respondents when estimating how much less of the product they should consume. The smaller portion sizes selected for pizzas and cornflakes when the HSR was present support the idea that an easy-to-understand summary of nutrition information is a more effective prompt than less interpretive nutrition information in guiding consumers to lower their perceptions of how much of an unhealthy product they should consume. While the differences were small (i.e. 44–181 kJ), when aggregated across many eating situations and many consumers they may constitute meaningful differences at the population level.
The amount of food considered appropriate to eat will be determined to a large extent by individual-level factors such as age, gender and general appetite. These demographic factors were accounted for as covariates in the model. One limitation of the present study was the focus on self-reported estimates of appropriate portion sizes of foods rather than measuring actual selected portion sizes. Real-life consumption behaviours are complex and can also be influenced by factors such as package size, health claims, perceived healthiness and the type of food being consumed( Reference Ordabayeva and Chandon 36 – Reference Wansink 39 ). Nevertheless, these findings offer a foundation on which future research can build to better assess the effects of FOP labels on consumption patterns.
Conclusion
To conclude, the results of the present study suggest that more interpretive FOP labels may have the potential to favourably influence portion size judgements for unhealthy foods, albeit at modest levels. Efforts to encourage individuals to reduce their servings of unhealthy foods may usefully instruct consumers to use FOP labels as a guide when estimating appropriate portion sizes, as well as utilising other forms of nutrition education to optimise outcomes.
Acknowledgements
Financial support: This work was funded by an ARC Linkage grant (LP130100428) with additional cash and in-kind support provided by the following partner organizations: the South Australian Health and Medical Research Institute, the National Heart Foundation, Cancer Council New South Wales and Cancer Council Victoria. The funders had no role in the design, analysis or writing of this article. Conflict of interest: None. Authorship: S.P., B.K., K.B., B.N., H.D., T.S. and C.M. designed the study. Z.T. and S.P. ran the study. Z.T. analysed the data. Z.T. and S.P. prepared the manuscript and all authors reviewed the manuscript. Ethics of human subject participation: This study was conducted according to the guidelines laid down in the Declaration of Helsinki and all procedures involving human subjects were approved by the Curtin University Ethics Committee. Written informed consent was obtained from all subjects.


