


Overweight and obesity threatens the health of six in ten adults in Australia. This is associated with an estimated cost of $AU 56·6 billion( Reference Buchmueller and Johar 1 ) in health-care bills, government subsidies and lost productivity due to the adverse health outcomes related to overweight and obesity, such as CVD, hypertension and diabetes( Reference Head 2 ). The average weight of males and females has increased substantially since 1995 (by 3·9 and 4·1 kg, respectively)( 3 ). Currently 35·5 % of Australians are considered overweight and 27·9 % considered obese( 4 ), and it is predicted that the number of obese Australians will increase to 35 % by 2025( Reference Hayes, Lung and Bauman 5 ). Overweight and obesity is caused by a positive energy imbalance that is often small, however accumulates over time to result in weight gain( Reference Morgen and Sorensen 6 ). It has been calculated that decreasing energy intake and/or increasing physical activity by 418 kJ/d may be sufficient to prevent weight gain in the population( Reference Hill, Wyatt and Reed 7 ).
The positive effect of decreasing energy intake by reducing consumption of discretionary foods would see more recommendations for a healthy diet being met. Discretionary foods are defined as foods typically containing high levels of saturated fat, refined sugar and/or salt, while providing little nutritional value( 8 ). In Australia, people consume more than half a kilogram of discretionary foods per day, making up on average 35 % of daily energy intake( 8 ). Among these discretionary foods are unhealthy snack foods such as chips/crisps, other salty snacks, cakes, sweet biscuits, ice cream and chocolate( Reference Niven, Scully and Morley 9 , Reference Savige, Ball and Worsley 10 ). Consumption surveys suggest that on average 10·5 % of Australian adults’ daily energy intake (approximately 914 kJ) comes specifically from these discretionary snack foods( 11 ).
There are various factors that drive individuals’ consumption of snack foods. A study assessing individuals’ motives to consume unhealthy snacks found that in 55 % of snacking occasions, participants cited the snack ‘looked or smelt tempting’, hunger (49 %), to avoid being hungry later (22 %) and the need for energy (23 %)( Reference Cleobury and Tapper 12 ). Furthermore, consumption of unhealthy snacks that contain fat, sugar and high levels of sodium is often seen in the absence of hunger( Reference Bellisle 13 ). It has been suggested that subtly guiding consumers’ food choice by providing cues such as front-of-pack (FOP) labelling can prompt healthier food choices( Reference Arno and Thomas 14 ). Labelling can influence food choices through providing information regarding the energy and nutrient content, thereby assisting consumers to make less energy-dense food choices( Reference Sinclair, Cooper and Mansfield 15 , Reference Cecchini and Warin 16 ). Whether kilojoule information alone is enough to affect food choice is controversial. Some studies have found a reduction in kilojoules ordered in online restaurant settings( Reference Morley, Scully and Martin 17 ), in less health-conscious participants( Reference Ellison, Lusk and Davis 18 ), only in lean females( Reference Temple, Johnson and Archer 19 ) or not at all( Reference Harnack, French and Oakes 20 ) when kilojoule information was presented. Systematic reviews have found that kilojoule information alone may not be the most effective labelling format to lower unhealthy food choice and consumption( Reference Sinclair, Cooper and Mansfield 15 , Reference Cecchini and Warin 16 ). This may be in part due to many consumers struggling to understand what kilojoules are in the context of their overall health and that a certain level of knowledge is required to interpret these labels( Reference Watson, Chapman and King 21 , Reference Maubach, Hoek and Mather 22 ). A simple FOP label that can be easily understood by all demographics in the population may be more effective at reducing discretionary snack food consumption.
Recently, the Royal Society for Public Health in the UK called for an activity-equivalent label to be implemented as a FOP labelling format( Reference Cramer 23 ). The physical activity calorie equivalent (PACE) label is an exercise-equivalent FOP label that displays, as a pictogram, the number of minutes of walking (or other forms of exercise) required to burn off the kilojoules in one serving of a food. There are different designs of PACE labels, some may also include kilojoule information per serving alongside the exercise-equivalent information( Reference Antonelli and Viera 24 – Reference Montford, Peloza and Goldsmith 26 ). Other activity-equivalent labels have previously been referred to as a physical activity-based label( Reference Dowray, Swartz and Braxton 27 ) or a physical activity label( Reference Masic, Christiansen and Boyland 28 ). In the present study, we consider a PACE label as any label that displays a pictogram representing the amount of physical activity required to burn off the kilojoules in a serving of food. In controlled studies where participants ordered fast foods( Reference Antonelli and Viera 24 , Reference Dowray, Swartz and Braxton 27 ) and snack foods( Reference Masic, Christiansen and Boyland 28 ) online, it was found that the presence of a PACE-type label (presented as either minutes or miles to walk) significantly reduced the number of kilojoules participants ordered. Similarly, intervention studies found that presenting the PACE information at the point of sale significantly reduced selection( Reference Scourboutakos, Mah and Murphy 29 ) and purchasing( Reference Bleich, Herring and Flagg 30 ) of sugar-sweetened beverages. Only two previous studies have assessed the impact of a PACE-style label on food choice and consumption( Reference Montford, Peloza and Goldsmith 26 , Reference James, Adams-Huet and Shah 31 ). In a controlled setting, it was found that the numbers of kilojoules ordered and consumed from a fast-food lunch menu were reduced in the presence of written exercise-equivalent information( Reference James, Adams-Huet and Shah 31 ). Similarly, it was found that providing participants with PACE information (including kilojoule information) prior to watching a 30 min video significantly reduced the amount of cheese crackers participants consumed over the duration of the video screening( Reference Montford, Peloza and Goldsmith 26 ). Furthermore, there is evidence that the PACE label is preferred by consumers over kilojoule labelling, with one study finding 82 % of participants preferred the PACE label( Reference Dowray, Swartz and Braxton 27 ). Qualitative studies have also found that participants were able to interpret the PACE label easily and believed that the PACE label would assist them to apply the foods’ kilojoule information into their food choices( Reference Swartz, Dowray and Braxton 32 ). These studies suggest that the PACE label may be effective at lowering kilojoule ordering and purchasing( Reference Antonelli and Viera 24 ), consumption of fast food( Reference James, Adams-Huet and Shah 31 ) and is preferred and understood by consumers( Reference Swartz, Dowray and Braxton 32 ). Additionally, it has been suggested that consumers are less likely to look at labels of products they are familiar with or consume regularly( Reference Maubach, Hoek and Mather 22 ), but may pay attention to FOP labels presented on novel/unfamiliar brands( Reference Becker, Bello and Sundar 33 ). The previous studies have investigated readily available, regularly consumed fast foods, sugar-sweetened beverages and snack foods( Reference Scourboutakos, Mah and Murphy 29 , Reference Antonelli and Viera 24 , Reference Dowray, Swartz and Braxton 27 , Reference Masic, Christiansen and Boyland 28 , Reference Montford, Peloza and Goldsmith 26 , Reference James, Adams-Huet and Shah 31 ). Whether the same effect would be seen in both familiar and unfamiliar snack foods has not previously been investigated. The influence of the PACE label on actual consumption and prospective consumption of both familiar and unfamiliar discretionary snack foods remains unclear.
In the present study, we examined whether the presence of the PACE label influenced consumption (how much participants sampled), prospective consumption and liking of discretionary snack foods, for both familiar and unfamiliar snacks. We hypothesised that the PACE label would lead to lower consumption than the non-PACE labels.
Materials and methods
Overall study design
Participants came to the Centre for Advanced Sensory Science laboratory at Deakin University, Burwood, Australia, for two sessions separated by one week. During each session they tasted and rated liking and prospective consumption of ten snack foods which differed in sensory profile and labelling. The amount which was tasted was measured for all snack foods.
Participants
Recruited participants (n 153) were students enrolled in an undergraduate nutrition degree at Deakin University. Twenty students (seventeen females and three males, mean age 22·8 (sd 2·3) years) failed to complete both sensory tasting sessions and were excluded from the final analyses. Students with food allergies or intolerances were excluded from participation.
Snack products
Twenty-four snack products were initially evaluated in a qualitative pilot tasting with five members of the Centre for Advanced Sensory Science. These products were evaluated on familiarity and liking as well as their overall flavour and texture profile. From this pilot two commercially available familiar snacks foods (Nacho Cheese Shapes (Arnotts, Australia) and Honey Cashews (Coles Scoop n’ Weigh), both sold at mainstream supermarkets) and two unfamiliar snack foods (Shrimp Peanut Crackers (Khao Shong, Thailand) and Cheese Rice Crackers (Want Want, Taiwan), both sold at speciality Asian stores) were selected to approximate flavour and texture, resulting in the selection of two crunchy nut snacks and two cheese biscuit snacks (see Table 1). A commercially available, moderately liked dummy snack was also included in the study to minimise first order effect (Seaweed Rice Cracker (Fantastic, Thailand)). Samples were presented in a 25 g serving size, on a white plate (BioPak, 180 mm diameter), with a corresponding photo (14 cm×21 cm) of the snack product presented on touch-screen monitors (Dell, model number 52240Tb).
Table 1 (colour online) Description of snacks used in the present study: number of minutes required to burn off the kilojoules in the 25 g serving size, number of kilojoules per 25 g serving and amount of total fat, saturated fat and sodium per 25 g serving size
Labels
The label design was derived from previous studies that have used a PACE-style label in minutes( Reference Antonelli and Viera 24 , Reference Dowray, Swartz and Braxton 27 ). Four labels were presented once on each of the four snacks and dummy snack, to total twenty snack/label variations. As shown in Fig. 1, labels included were: Blank (no label); Fake (equivalent proportion of black and white as the PACE labels); PACE walking minutes; and PACE walking minutes doubled (PACE×2). Labels (5 cm×4·5 cm) were presented in the upper right-hand corner of the snack photograph presented to participants on the touch-screen monitors (see Table 2). The second PACE label representing double the number of minutes was included to estimate a dose–response effect of PACE on the outcome variables. The minutes presented on the PACE label were calculated based on the metabolic equivalent intensity level of a 74 kg adult walking (3 MET)( Reference Ainsworth, Haskell and Whitt 34 ) and the kilojoule content of one 25 g serving of the snack food.

Fig. 1 Left to right: pictograms of Fake, PACE and PACE×2 labels presented on snack photos (PACE, physical activity calorie equivalent; PACE×2, PACE label with walking minutes doubled)
Table 2 (colour online) Labels that were presented to participants during tasting; each snack/label combination was presented to participants as they were given the corresponding sample to taste
PACE, physical activity calorie equivalent; PACE×2, PACE label with walking minutes doubled.
Experimental design
Participants came to the Centre for Advanced Sensory Science once per week at the same time and day for two consecutive weeks. Tasting took place in individual partitioned sensory booths, which minimised interaction between the participants during tasting of the snack foods. At the commencement of each session participants were given the following instructions: ‘You will be presented with a number of snack foods. These snack foods will also be shown on a photo on your screen. In each photo you might also see a pictogram of a man walking. This represents the number of minutes you would need to walk to burn the amount of snack food that you are presented. You can eat as much of the snack foods as you want. Please do not overthink your answers and just provide the answer that first comes to mind’. While tasting the snacks, participants were asked to rate the snack food on liking, prospective consumption and familiarity. Between individual snacks participants had a 2 min break where they were instructed to have a sip of water and a bite of an unsalted cracker (Coles, Australia). Each combination of label and snack was given once (five snacks×four labels) over two consecutive weeks. Each week consisted of two sampling sessions within 45 min and sampling sessions were separated by a 5 min break, to total four sampling sessions over two weeks. Within each sampling session participants were presented with all test snacks (Shrimp Peanut Crackers, Cheese Rice Crackers, Honey Cashews, Nacho Cheese Shapes) once in a randomised order, and the dummy sample (Seaweed Rice Crackers), which was presented as the first sample for each of the four sampling sessions to minimise first order effect. Each snack was assigned a randomised label (e.g. Blank, Fake, PACE, PACE×2) and each snack/label combination was assigned a randomised unique three-digit code, which was visible on the plate the snack was presented to participants on. In total, participants tasted twenty snack/label variations in a randomised order over two sessions in two consecutive weeks.
Outcome measures
Outcome measures were liking, prospective consumption, actual consumption (how much participants sampled) and familiarity. Liking was measured on a 9-point hedonic scale ranging from 1=‘dislike extremely’ to 9=‘like extremely’. Prospective consumption was measured by participants selecting the number of servings (i.e. 0, 0·5, 1, 1·5, 2, 2·5, 3, 3·5, more than 3·5) they thought they would eat of the snack ‘right now’. Familiarity was measured in an online survey containing the same photos of the snacks as the tasting sessions, which participants completed prior to attending the tasting sessions. Familiarity was rated on a 5-point Likert scale ranging from 1=‘not familiar at all’ to 5=‘very familiar’. Liking, prospective consumption and familiarity data were collected using Compusense Cloud Software as part of the Compusense Academic Consortium. How much participants sampled was measured to 0·2 g (Ohaus, model number NV 4101) by subtracting the post-tasting weight from the pre-tasting weight; this was recorded manually on participants’ individual slips.
Statistical analysis
Participants who did not complete both tasting sessions were excluded from analysis. Consumption data were excluded if ≤0·000 g, as negative consumption was not possible. Liking data associated with consumption data ≤0·000 g were also excluded as participants were not able to rate taste liking without sampling any of the snack presented to them. Familiarity data were collected via an online survey that participants completed prior to attending tasting sessions.
To assess differences in overall consumption, prospective consumption, familiarity and liking of the test snacks and label combinations, a Friedman analysis for ranks was conducted with statistical significance set at P<0·05. Where the Friedman analysis was significant, a Wilcoxon signed-ranks test was then used to find which label was significantly different within the test snacks. Within each snack food, six different comparisons were made (i.e. Blank v. Fake, Blank v. PACE, Blank v. PACE×2, Fake v. PACE, Fake v. PACE×2, PACE v. PACE×2); therefore the significance levels for these comparisons was set at 0·05/6=0·008 (P<0·008).
To assess the impact of the PACE labels (PACE and PACE×2) compared with non-PACE labels (Blank and Fake), snacks were combined into two groups based on familiarity and how much participants sampled (in grams). Honey Cashews and Nacho Cheese Shapes were grouped into the familiar category, and Shrimp Peanut Crackers and Cheese Rice Crackers were grouped into the unfamiliar category. This was an a priori classification where two familiar and unfamiliar snacks were selected. A Wilcoxon signed-ranks test was conducted to determine whether participants’ familiarity rating was in fact higher for the selected familiar snacks, with significance set at P<0·05. A Wilcoxon signed-ranks test was then conducted to compare PACE label v. non-PACE label for consumption, prospective consumption and liking, with significance set at P<0·05.
Results
Participant characteristics
A total of 153 students participated in the study, 126 (82·4 %) of whom were female (mean age 24·1 (sd 4·7) years) and twenty-seven (17·6 %) of whom were male (mean age 25·1 (sd 5·8) years). Mean BMI of females was 22·5 (sd 3·2) kg/m2 and of males was 25·2 (sd 4·7) kg/m2 (see Table 3). ‘Consumption’ in the remainder of the ‘Results’ section refers to the amount participants sampled while tasting snack foods.
Table 3 Demographic information of participants in the snack study: university students (n 153) enrolled in an undergraduate nutrition degree at Deakin University, Australia
Overall consumption, prospective consumption and familiarity
Snack foods that were assumed to be familiar were indeed perceived more familiar than the snack foods that were assumed not to be familiar (3·8 (sd 1·0) v. 2·4 (sd 1·3), P<0·01). Consumption and prospective consumption were lower for Shrimp Peanut Crackers compared with all the other snack foods tested (all P<0·001). Liking, prospective consumption and consumption (in grams) were significantly higher overall for familiar snacks compared with unfamiliar snacks (P=0·000; see Table 4).
Table 4 Mean consumption, liking, prospective consumption and familiarity results for each of the four test snack snacks (Shrimp Peanut Crackers, Honey Cashews, Cheese Rice Crackers and Nacho Cheese Shapes) and labels (Blank, Fake, PACE and PACE×2) among 153 university students (126 females, twenty-seven males, mean age 24·3 (sd 4·9) years) enrolled in an undergraduate nutrition degree at Deakin University, Australia
PACE, physical activity calorie equivalent; PACE×2, PACE label with walking minutes doubled.
Friedman analysis was conducted within each snack type, with significance set at P<0·05. Where significant, the Wilcoxon signed-ranks test was was conducted, with significance set at P<0·008.
a,bWithin each snack type, mean values within a column with unlike superscript letters were significantly different (P<0·008).
PACE labels v. non-PACE labels on familiar and unfamiliar snacks
Liking
The PACE labels did not significantly change liking compared with non-PACE labels, for both familiar (26·1 (sem 0·5) v. 26·8 (sem 0·5)) and unfamiliar (21·1 (sem 0·8) v. 20·5 (sem 0·8)) snacks (P>0·05).
Consumption and prospective consumption
As shown in Figs 2 and 3, the PACE labels decreased consumption of familiar snack foods by 9·9 % (22·8 (sem 1·4) v. 25·3 (sem 1·5) g, P=0·025) and prospective consumption by 9·1 % (3·0 (sem 0·2) v. 3·3 (sem 0·2) servings, P=0·027). Such pattern was not seen in unfamiliar snacks, with no significant difference in consumption (18·7 (sem 2·0) v. 16·9 (sem 1·5) g, P=0·684) or prospective consumption (1·5 (sem 0·1) v. 1·5 (sem 0·1) servings, P=0·799) between the PACE labels and non-PACE labels.
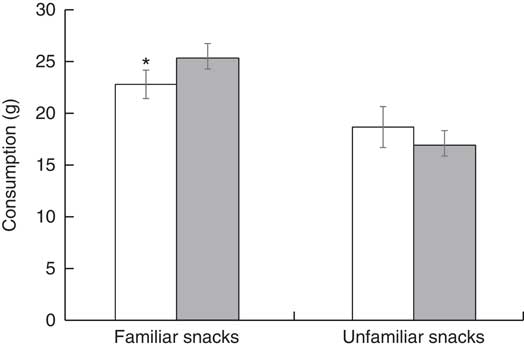
Fig. 2 Mean consumption (in grams; with standard error of the mean represented by vertical bars) of PACE-labelled (PACE and PACE×2; ![]() ) familiar (Honey Cashews and Nacho Cheese Shapes) and unfamiliar (Shrimp Peanut Crackers and Cheese Rice Crackers) snacks compared with non-PACE labelled (Blank and Fake;
) familiar (Honey Cashews and Nacho Cheese Shapes) and unfamiliar (Shrimp Peanut Crackers and Cheese Rice Crackers) snacks compared with non-PACE labelled (Blank and Fake; ![]() ) familiar and unfamiliar snacks among 153 university students (126 females, twenty-seven males, mean age 24·3 (sd 4·9) years) enrolled in an undergraduate nutrition degree at Deakin University, Australia. The PACE label decreased the consumption of familiar snack foods: *P<0·05 (PACE, physical activity calorie equivalent; PACE×2, PACE label with walking minutes doubled)
) familiar and unfamiliar snacks among 153 university students (126 females, twenty-seven males, mean age 24·3 (sd 4·9) years) enrolled in an undergraduate nutrition degree at Deakin University, Australia. The PACE label decreased the consumption of familiar snack foods: *P<0·05 (PACE, physical activity calorie equivalent; PACE×2, PACE label with walking minutes doubled)
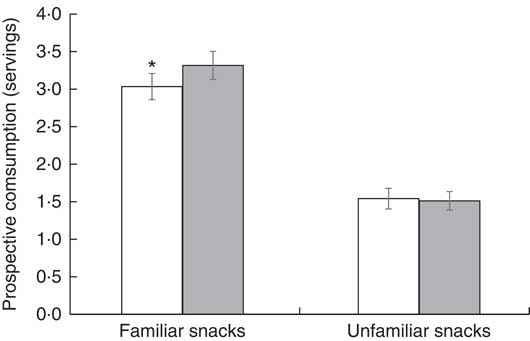
Fig. 3 Mean prospective consumption (number of servings; with standard error of the mean represented by vertical bars) of PACE-labelled (PACE and PACE×2; ![]() ) familiar (Honey Cashews and Nacho Cheese Shapes) and unfamiliar (Shrimp Peanut Crackers and Cheese Rice Crackers) snacks compared with non-PACE labelled (Blank and Fake;
) familiar (Honey Cashews and Nacho Cheese Shapes) and unfamiliar (Shrimp Peanut Crackers and Cheese Rice Crackers) snacks compared with non-PACE labelled (Blank and Fake; ![]() ) familiar and unfamiliar snacks among 153 university students (126 females, twenty-seven males, mean age 24·3 (sd 4·9) years) enrolled in an undergraduate nutrition degree at Deakin University, Australia. The PACE label decreased the prospective consumption of familiar snack foods: *P<0·05 (PACE, physical activity calorie equivalent; PACE×2, PACE label with walking minutes doubled)
) familiar and unfamiliar snacks among 153 university students (126 females, twenty-seven males, mean age 24·3 (sd 4·9) years) enrolled in an undergraduate nutrition degree at Deakin University, Australia. The PACE label decreased the prospective consumption of familiar snack foods: *P<0·05 (PACE, physical activity calorie equivalent; PACE×2, PACE label with walking minutes doubled)
Discussion
The purpose of the present study was to determine whether presenting the PACE label on discretionary snack foods influenced participants’ liking, prospective consumption and actual consumption of both familiar and unfamiliar snack foods compared with non-PACE labels.
It was found that the presence of the PACE labels on familiar snack foods resulted in participants sampling 9·9 % less (in grams) compared with the same snacks presented with non-PACE labels. Likewise, a 9·1 % reduction in prospective consumption (in servings) of familiar products was seen in the presence of the PACE label. Such pattern was not seen for unfamiliar products. No significant difference was found in the presence of the PACE label for liking, for both familiar and unfamiliar products.
In the present study, the amount of familiar products participants sampled was significantly influenced by the PACE label. This is unlikely to have been caused by liking, as no significant difference in liking was found with the presence of the PACE label. Potentially the PACE label acted as a cue to remind participants of the high energy content of the familiar snack foods, driving participants to sample less rather than affecting the liking. Some previous research has found FOP labelling to have an influence on taste perception and liking of foods( Reference Schouteten, de Steur and de Pelsmaeker 35 , Reference Liem, Miremadi and Zandstra 36 ), with other studies, including the present study, finding no such effect( Reference Zandstra, Carvalho and van Herpen 37 ). Liking may have not been influenced by the PACE label as the snacks tasted within each snack type were in fact identical products; earlier studies have had similar findings( Reference Zandstra, Carvalho and van Herpen 37 ). Furthermore, as the PACE label only shows exercise information and no additional information pertaining to ingredients of the product, this may additionally explain why no significant difference was observed for liking. Although no change in liking was found in the presence of the PACE label, the reduction in consumption observed may have positive public health implications.
Currently 35 % of Australians’ daily energy intake consists of discretionary foods, with an estimated 10·5 % of this coming from discretionary snack foods such as chips/crisps, other salty snacks, cakes, sweet biscuits, ice cream and chocolate( 8 ). Positive energy imbalance of 209 kJ daily is calculated to increase the weight of an individual by approximately 2·2 kg per year( Reference Kumanyika, Obarzanek and Stettler 38 ). To prevent this weight gain, an individual would need to eat, for example, only 10 g less of a discretionary salty snack each day to reduce energy intake by 200 kJ( Reference Kumanyika, Obarzanek and Stettler 38 , 39 ). The results of the present study are promising and could potentially contribute to this small decrease in the consumption of certain discretionary snack foods. However, it needs to be noted that long-term studies are needed using a more representative population. Furthermore, the current study did not investigate whether the PACE label would impact physical activity levels of the participants. Previous research has found that 64 % of participants thought the PACE label would be ‘somewhat likely’ or ‘very likely’ to encourage them to partake in physical activity( Reference Antonelli and Viera 24 ). The effect the PACE label has on physical activity levels of participants is worth investigating in the future.
In addition to consumption and liking, measuring prospective consumption is also important, as it may give further insight into actual eating behaviour. A recent study found that prospective consumption of snack foods was related to actual consumption in an ad libitum consumption task( Reference van den Akker, Bongers and Hanssen 40 ). Although the present study did not assess ad libitum consumption, it has been suggested that measuring consumption during laboratory taste tests is also a valid measure to investigate factors that may influence consumption( Reference Robinson, Haynes and Hardman 41 ), such as FOP labelling. In the present study, a relationship was found between participants’ prospective consumption and actual consumption. It was found that the presence of the PACE label on familiar snack foods resulted in a 9·1 % reduction in prospective consumption and a 9·9 % reduction in how much participants sampled compared with the same snacks presented with non-PACE labels. The present study is the first to investigate the influence the PACE label has on participants’ prospective consumption and actual consumption of both familiar and unfamiliar discretionary snack foods. Furthermore, to our knowledge, past research has only investigated the influence of the PACE label on familiar, readily available fast-food menus( Reference Antonelli and Viera 24 , Reference Dowray, Swartz and Braxton 27 , Reference James, Adams-Huet and Shah 31 ), snacks( Reference Montford, Peloza and Goldsmith 26 , Reference Masic, Christiansen and Boyland 28 ) and sugar-sweetened beverages( Reference Scourboutakos, Mah and Murphy 29 , Reference Bleich, Herring and Flagg 30 ). The influence the PACE label has on unfamiliar products has yet to be explored. Hypothetically, the influence of the PACE label on consumer behaviour may be different for familiar and unfamiliar products. This may be because nutritional information of products that consumers frequently purchase may be neglected( Reference Masic, Christiansen and Boyland 28 ). Contrary to this, the present study found the PACE label to be effective at reducing consumption of familiar products. This finding is supported by previous studies that have found the PACE label to reduce selection and/or consumption of familiar foods( Reference Antonelli and Viera 24 , Reference Montford, Peloza and Goldsmith 26 , Reference Dowray, Swartz and Braxton 27 , Reference Masic, Christiansen and Boyland 28 , Reference James, Adams-Huet and Shah 31 ). However, the present study suggests that the PACE label does not seem to impact consumption of unfamiliar products. Previous research has found participants do pay attention to FOP labels on novel brands, which is important as attention is initially required for participants to then comprehend FOP labels( Reference Becker, Bello and Sundar 42 ). However, it is possible that participants did observe the PACE label, but for the PACE label to then impact participants’ consumption, a sufficient amount of the snack foods needs to be consumed. Recall that in the present study participants consumed significantly less of the unfamiliar than of the familiar snack foods, or did not taste the unfamiliar snack foods at all. Therefore, it may not be that the results seen are due to the PACE label not having an impact on unfamiliar snacks, but that consumption of unfamiliar snacks was too low to detect a significant difference between the PACE and non-PACE labels.
Limitations
The use of a university sample consisting of predominantly female, nutrition and food science students, with healthy BMI who are likely to have a high nutrition literacy and health awareness, reduces the external validity of the findings. However, previous studies have found that presenting a PACE-type label (presented as either minutes or miles to walk) to be effective in lowering the number of kilojoules ordered( Reference Dowray, Swartz and Braxton 27 ) and consumed( Reference Bleich, Herring and Flagg 30 ) in populations with low kilojoule and numeracy literacy( Reference Dowray, Swartz and Braxton 27 ). This indicates that the PACE label may be effective in both health-conscious, nutrition-literate populations and populations with lower nutrition and numeracy capabilities. The present study was conducted in a laboratory, which is not representative of the real-world scenario as variables such as cost, time constraints and other marketing information are not present which may impact consumers’ behaviour. One could argue that the 45 min tasting session was rather long, which could result in ‘mindless clicking’ without participants consciously processing the information provided. However, first, the tasting session was broken up by regular breaks between each snack food (2 min) and between sessions (5 min); and second, mindless clicking in the case of the present study is not necessarily detrimental to the results. Discretionary snack consumption has been suggested to be habitual behaviour that occurs with little thought( Reference de Vet, Stok and de Wit 43 ) and is influenced by cues in the environment( Reference Wilson, Buckley and Buckley 44 ). Subtly changing the food environment by providing nudges (such as FOP labels) may make certain behaviours more likely( Reference Kelly and Barker 45 ). It is thought that a lot of our behaviour occurs with little cognitive processing, but is triggered by factors in the environment without our direct awareness( Reference Kelly and Barker 45 ). Providing FOP labels such as the PACE label is an example of a subtle nudge that is salient to participants. Additionally, in real-world food choice or consumption environments consumers are not told to look at specific information on labels when they are making decisions. Therefore, we decided it was not necessary to include attention checks throughout the tasting sessions. Furthermore, participants were not required to complete FFQ and/or food behaviour questionnaires. Therefore, it was unable to be determined whether the PACE label would have different effects in consumers with varying eating behaviours, such as restrained eating. Additionally, as we focused solely on savoury snack foods it is unclear whether the same effect would be found in sweet snack foods. Nevertheless, the study measured consumers’ prospective consumption and actual amount sampled, providing some possible understanding into the influence of the label in the real-world setting.
Implications
The present study was the first to assess the effects of the PACE label on both prospective consumption and actual amount sampled for both familiar and unfamiliar discretionary snack foods. Previous studies have focused only on purchasing/selection( Reference Scourboutakos, Mah and Murphy 29 , Reference Bleich, Herring and Flagg 30 ), hypothetical menu ordering of regularly consumed products( Reference Antonelli and Viera 24 , Reference Dowray, Swartz and Braxton 27 , Reference Masic, Christiansen and Boyland 28 ), or consumption of fast foods and snack foods( Reference James, Adams-Huet and Shah 31 ). If the PACE label reduces the amount consumers sample (and potentially consume) of discretionary snack foods by 9·9 % in the real world, as it did in the current study, there could be a potential public health benefit. However, longitudinal studies and studies in which ad libitum consumption is measured are needed to give a fair estimation of potential public health benefits.
Conclusion
The PACE label appears to be a promising FOP label that could be used to decrease familiar discretionary snack food consumption in young, health-minded participants. Future research should aim to replicate these findings in a real-world scenario, using a representative sample of the population.
Acknowledgements
Acknowledgements: The authors thanks Kathryn Colla for assistance during data collection and entry. Financial support: This research received no specific grant from any funding agency in the public, commercial or not-for-profit sectors. Conflict of interest: None. Authorship: I.E.H. contributed to study design, data collection, data analysis and writing the manuscript. D.G.L. contributed to study design, data collection, data analysis and writing the manuscript. R.S.J.K. contributed to study design and writing the manuscript. Ethics of human subject participation: This study was approved by the Deakin University Human Ethics Advisory Group (HEAG 2012-162). Written informed consent was obtained from all participants.


 Open access